
The Golden Week
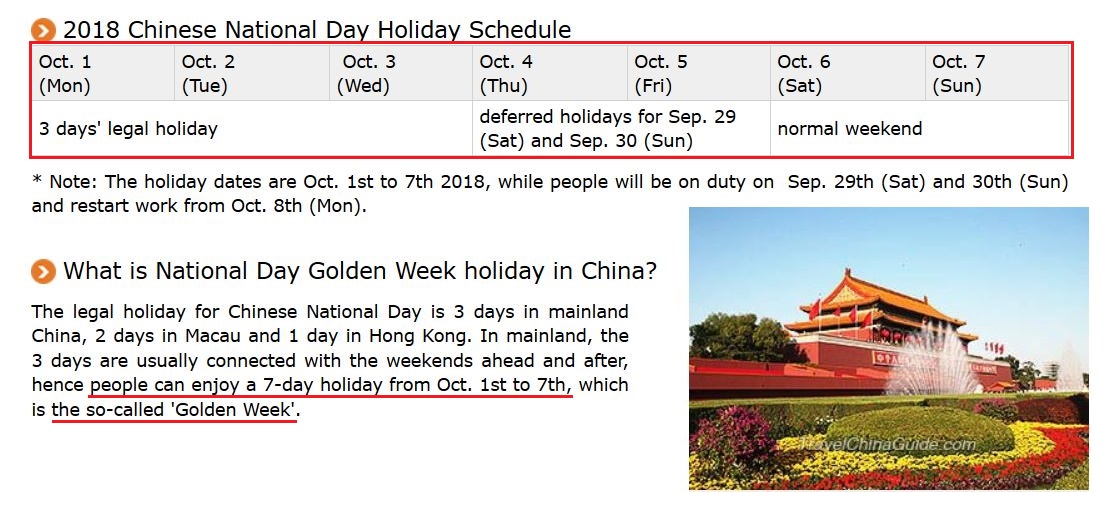
Thanks Ray, for reminding me by email that this is the so called Golden Week in China. What is the Golden Week? See the calendar below, and you’ll see that China is basically on holiday from Oct 1 – Oct 7th…
Good News & Bad News:
You may recall that in the last few yrs, this Golden Week caused a lack of buying in Gold, but that’s not all. After reviewing the charts, I saw that Gold dropped quite a bit on those weeks on the last 3 yrs.
The good news? It regained all of the losses the following week very quickly, actually, in just 2 days! So it sold off during the Golden Week, and then rebounded sharply in 2 days on the following week.
.
I should mention that there is No guarantee that we will see a sell off this week, but it is good to take note of the Golden Week and keep that in mind. If we do see Gold selling down, we can also look to see if Silver & Miners resist the selling. So I just wanted to bring it up, since I did find that it has caused some selling last year and the year before.
.
Let’s just review some charts from Monday
.
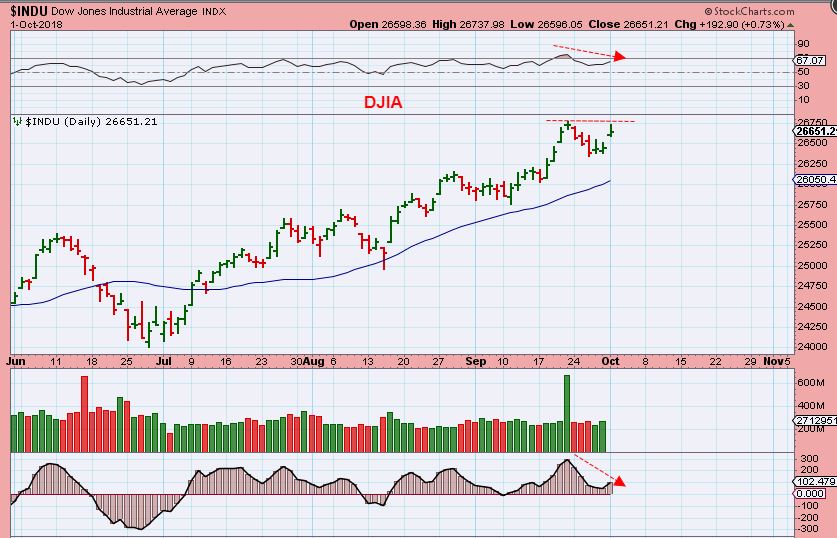
DJIA – The Dow gapped open and surged higher at the open, but eventually sold off ( again). I’m expecting a pull back soon.
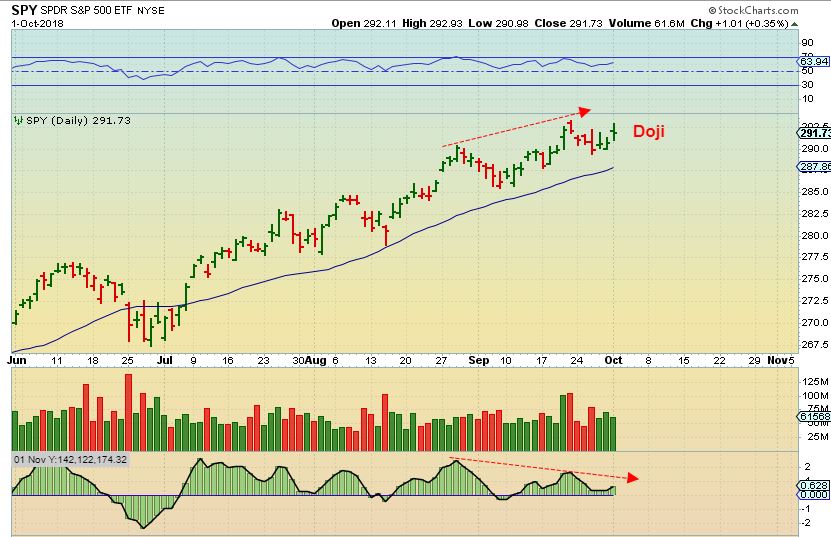
SPY – More sideways choppiness. We see an indecision candle here, a Doji and divergence.
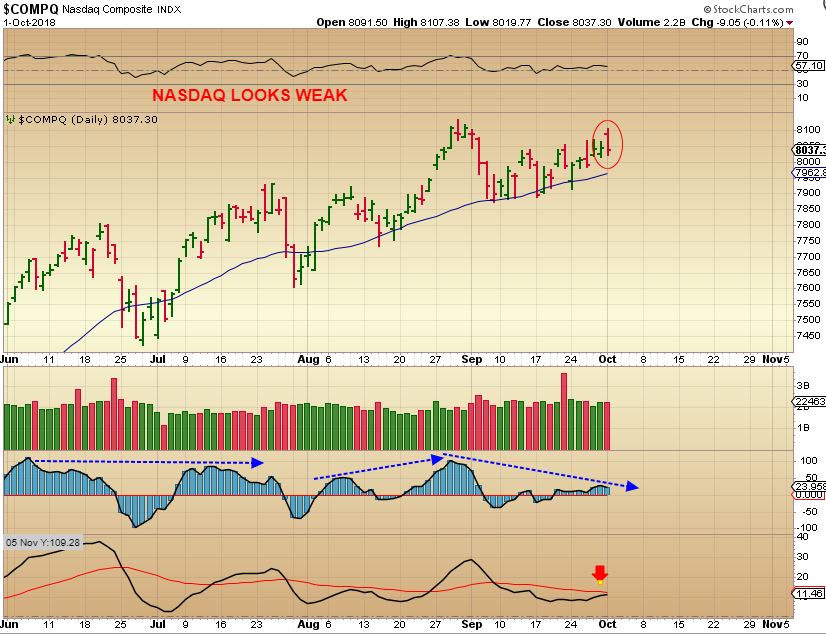
NASDAQ – The NASDAQ gapped open around 45 points, but sold off into a reversal. If it sells down further Tuesday, it’ll be back at the 50sma again. These markets are choppy, as mentioned in prior reports.
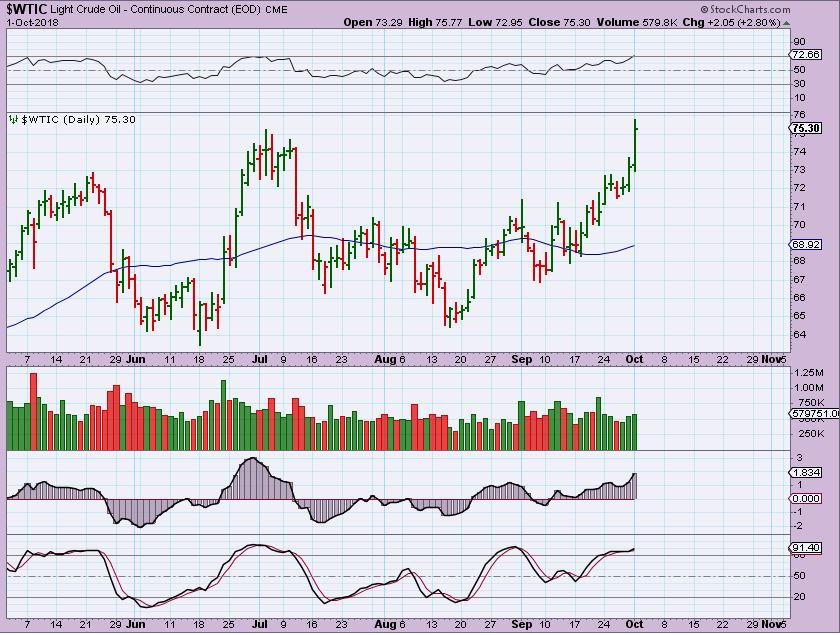
WTIC – Oil really found that follow through, and has proven to be bullish as noted after it broke above the day 12 highs. Also noted was XLE or individual Energy Stocks setting up bullishly.
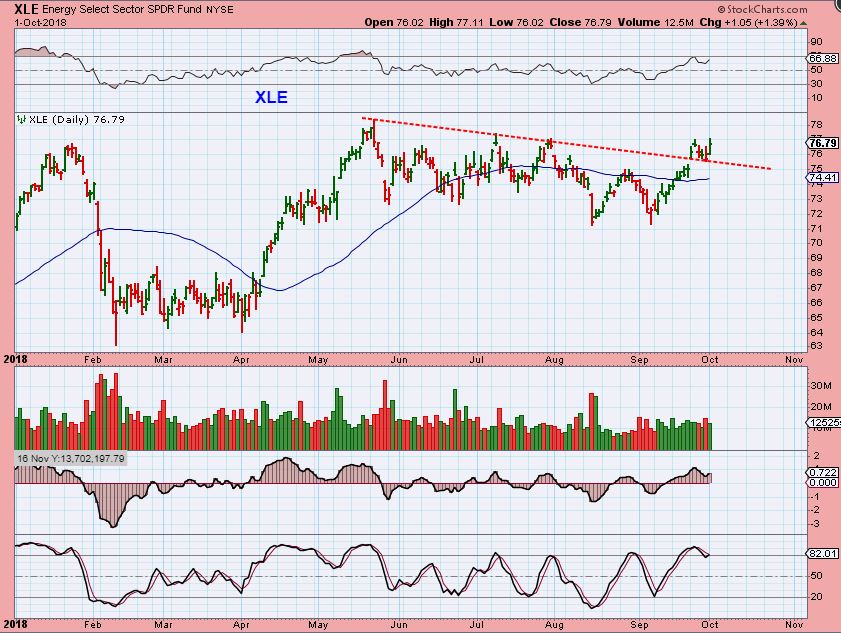
XLE – The XLE broke above the down trend line and back tested it last week. We looked at a number of energy stock set ups recently, so lets take another look at a few Energy Stocks.
.
TRADES OR BUY & HOLD
.
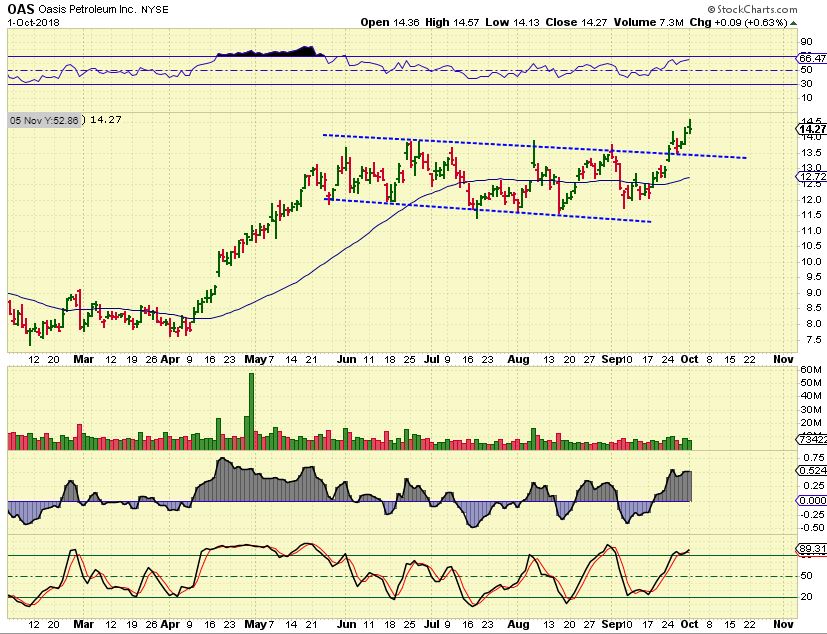
OAS #1 – On Sept 24th I mentioned that OAS was breaking out & it now has follow through after a quick back test too …
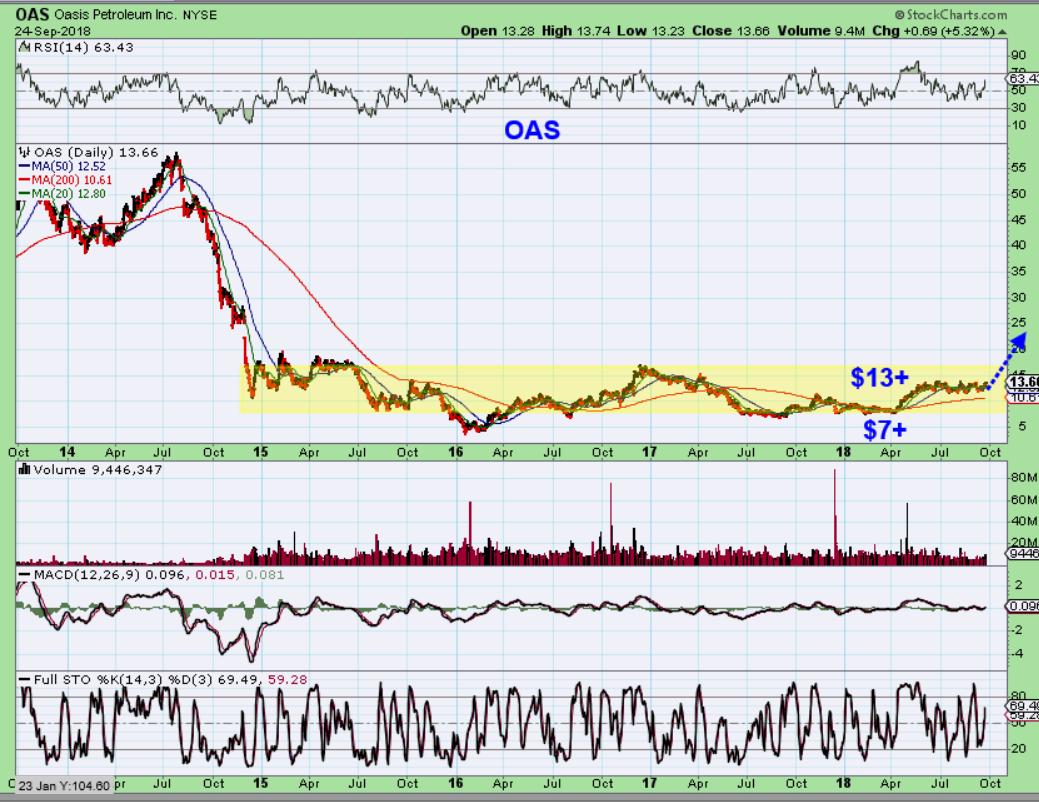
OAS #2 – I used this chart on Sept 24th to show the potential on some of these break outs. It has already gone from $7 to $13, and these could be BUY & HOLD candidates when they leave the BASE.
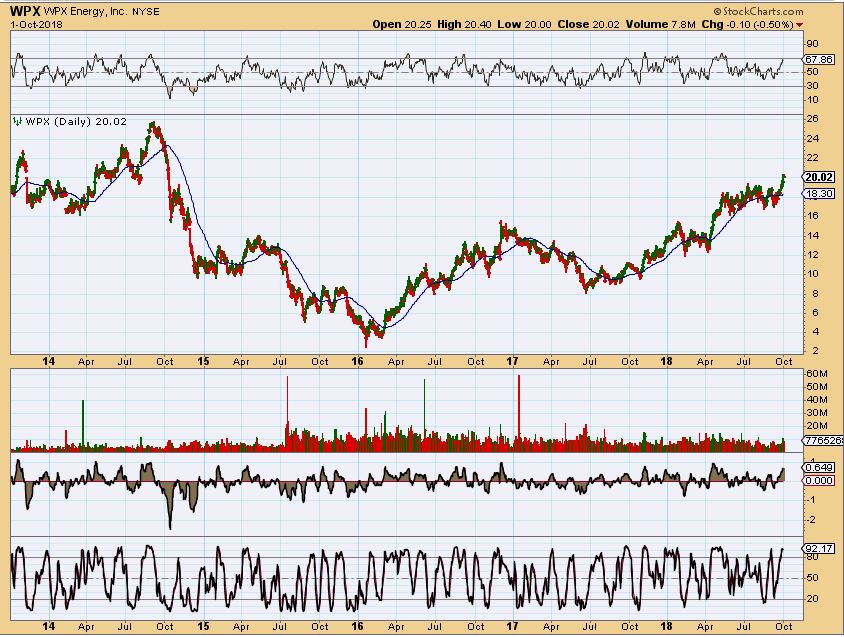
WPX – I pointed this one out too. It could run to 2014 highs. You can see that this would be buy & hold since June 2017, but would that have been easy? Not really.
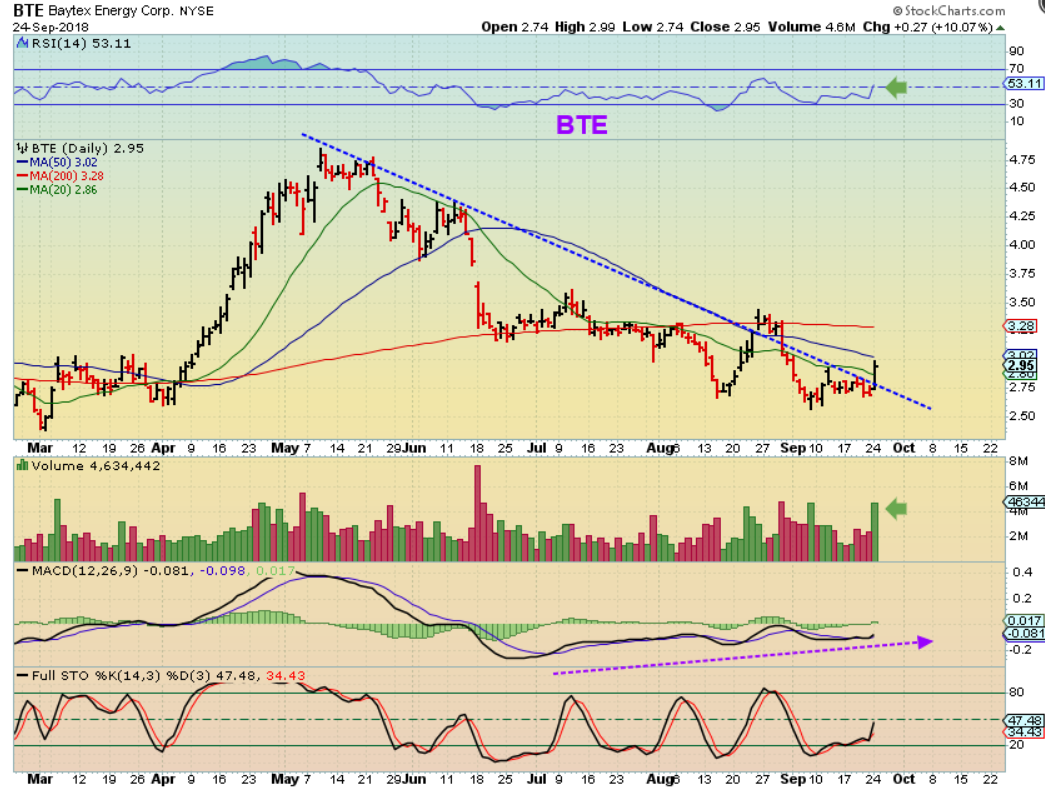
BTE – On Sept 24 this was breaking higher, but did have resistance at the 50 & 200sma. The 50sma was at $3…
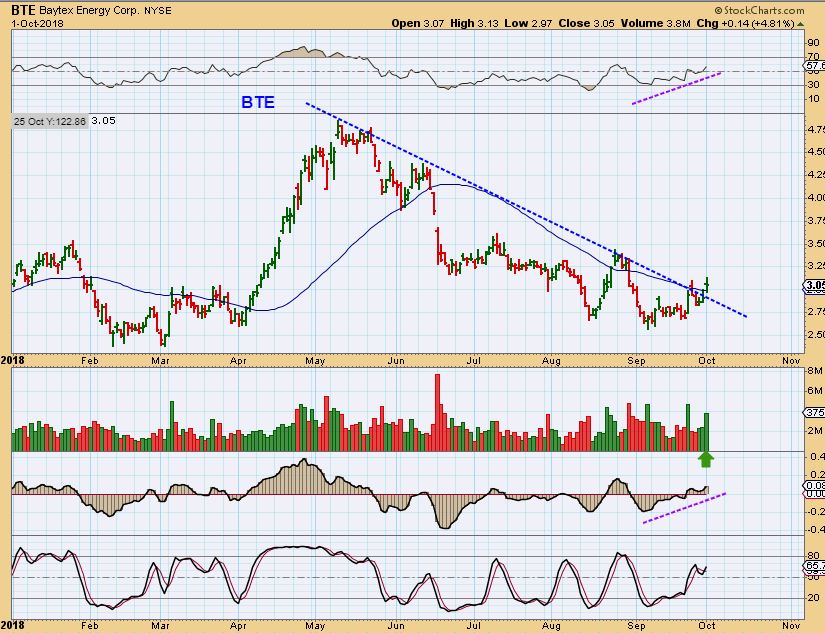
BTE – I re-drew that down trend line, but this is still a good set up. Volume increased on Monday and it is now above $3 & above the 50sma, so…
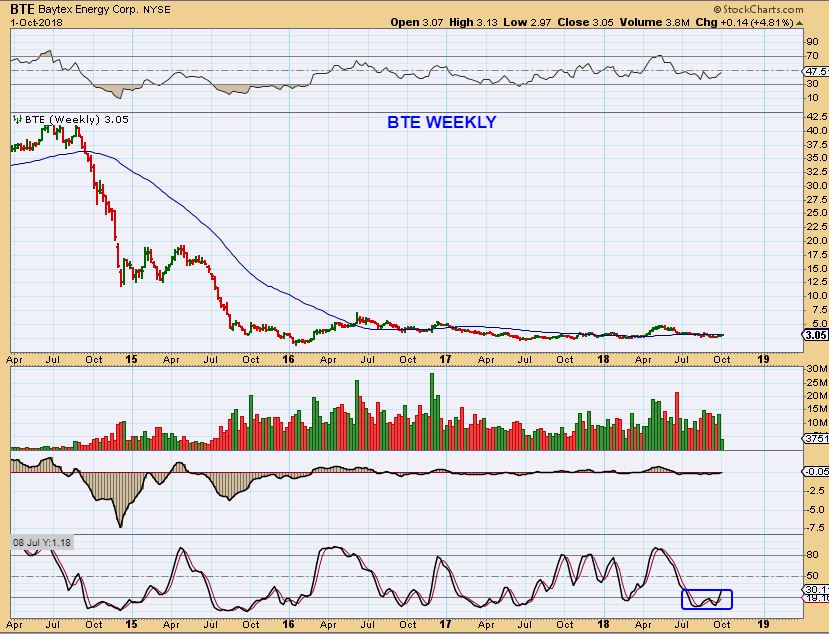
BTE The Big Picture – This is also a massive BASE and remains oversold on a weekly basis. If it is improving fundamentally and continues higher, it could make some nice steady gains too.
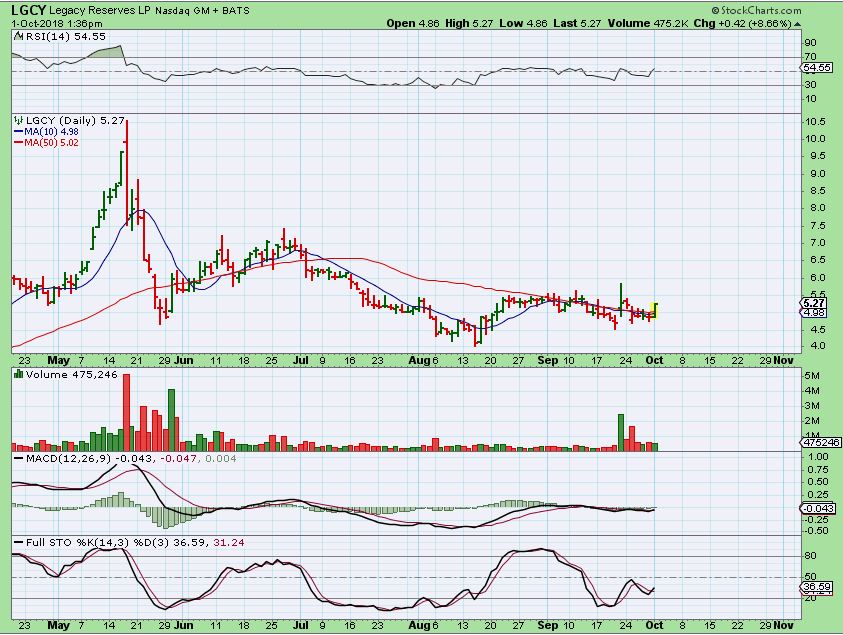
LGCY – On Sept 24th I pointed out this large base too in LGCY. LGCY ran from under $2 to over $10 this year, and has pulled back to the 200sma. That could be a buy & hold if you can take the big ‘wiggles’ …
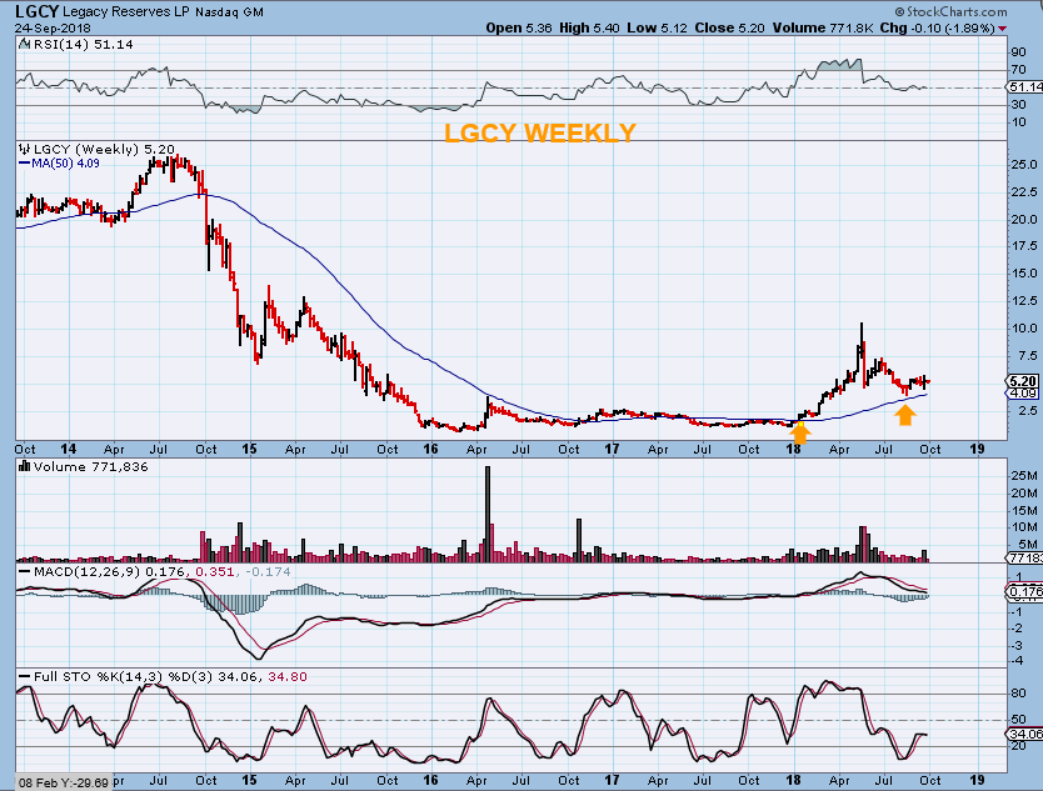
LGCY – Ready to go now? This looks like an inverse H&S and was breaking above the 50sma Monday, and looks like it may run back to the May highs.
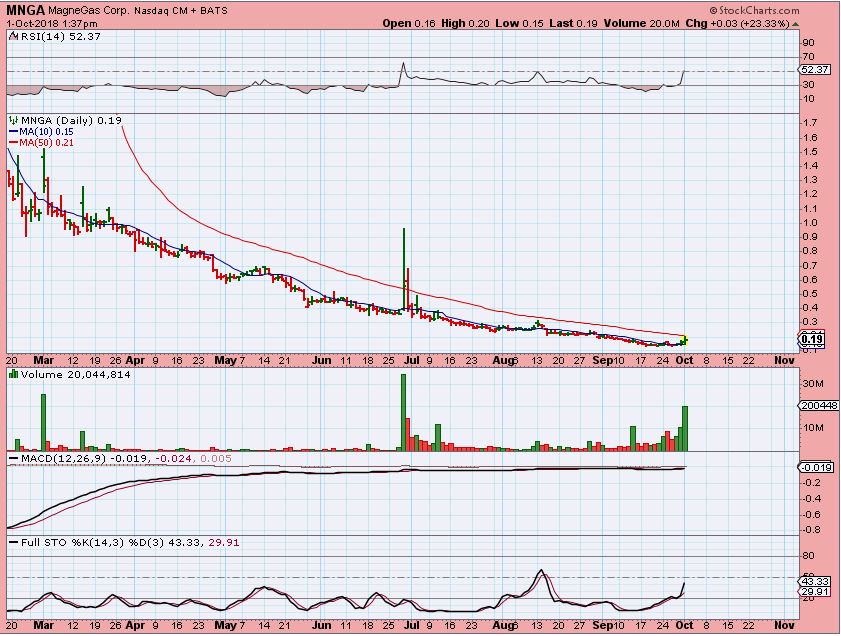
MNGA – ( Higher risk-low price) Does anyone remember trading MNGA? This tiny looking pop was 20% and it also had moved higher Thursday & Friday, so this is possibly going to crawl under the 50sma and could be a good buy for those interested ( watch list)
.
Many Shippers have bullish looking set ups too.
.
I had mentioned a list of shippers to keep an eye on recently too. SB, SBLK, DCIX, DRYS, FRO, EGLE, ETC. Let’s just take a look at a couple, they are stretching out…
.
.
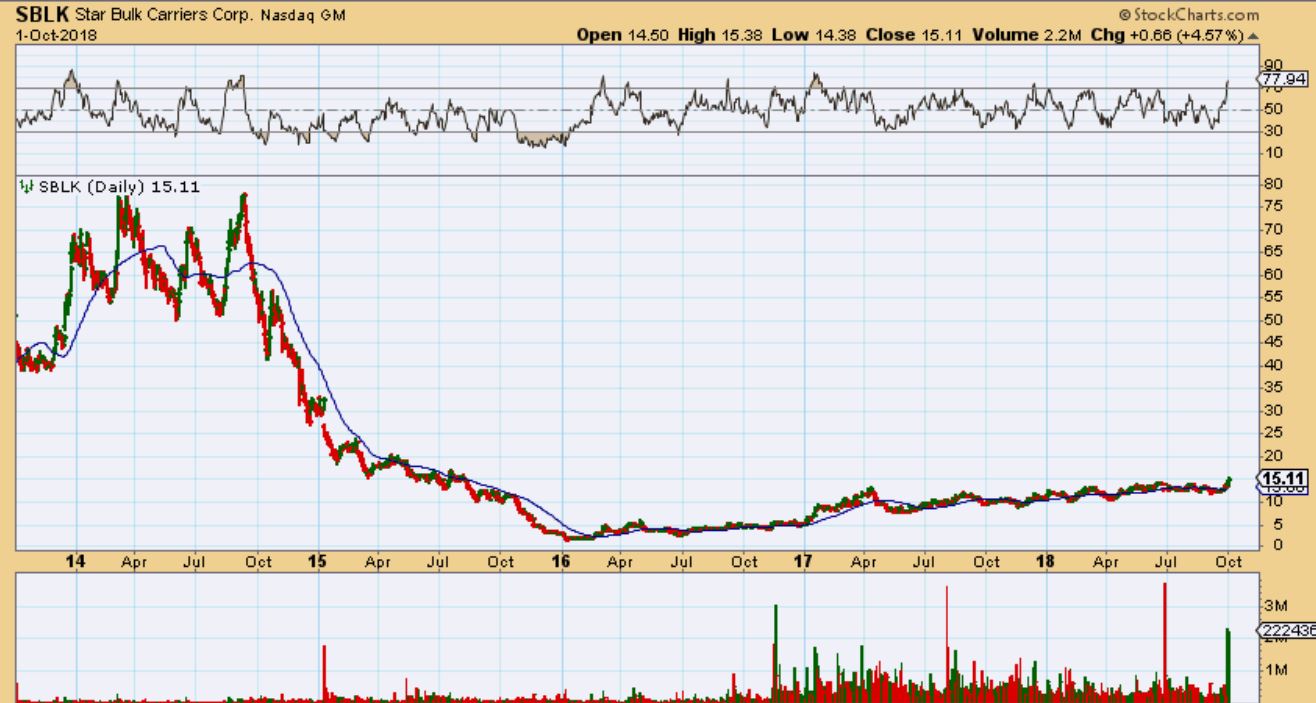
SBLK – SBLK has broken out since I mentioned it. Buying a back test may be possible if it pulls back, and…
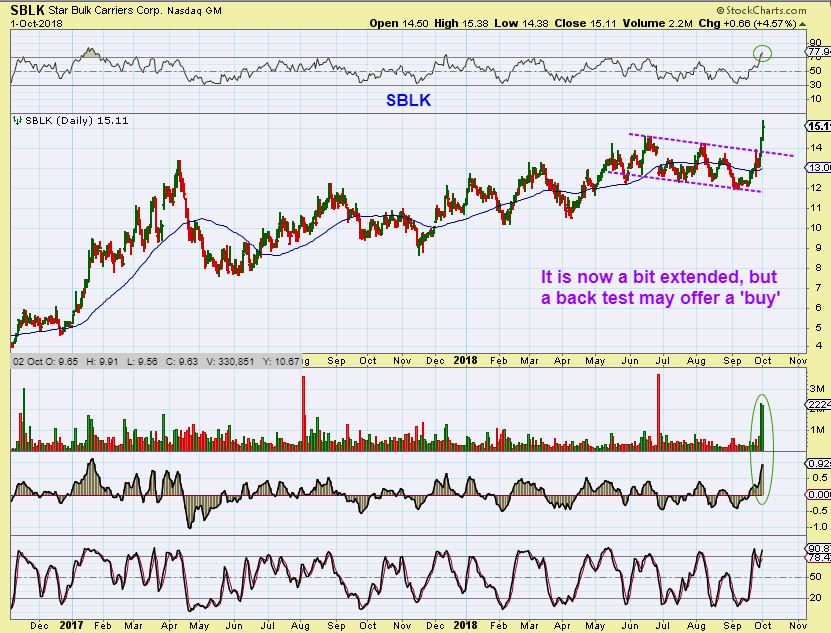
SBLK – This is a crazy long base. This has been very slowly recovering since 2016. It doesn’t look like much , but this is $2.50 to $15. ( 1:5 split adjusted).
.
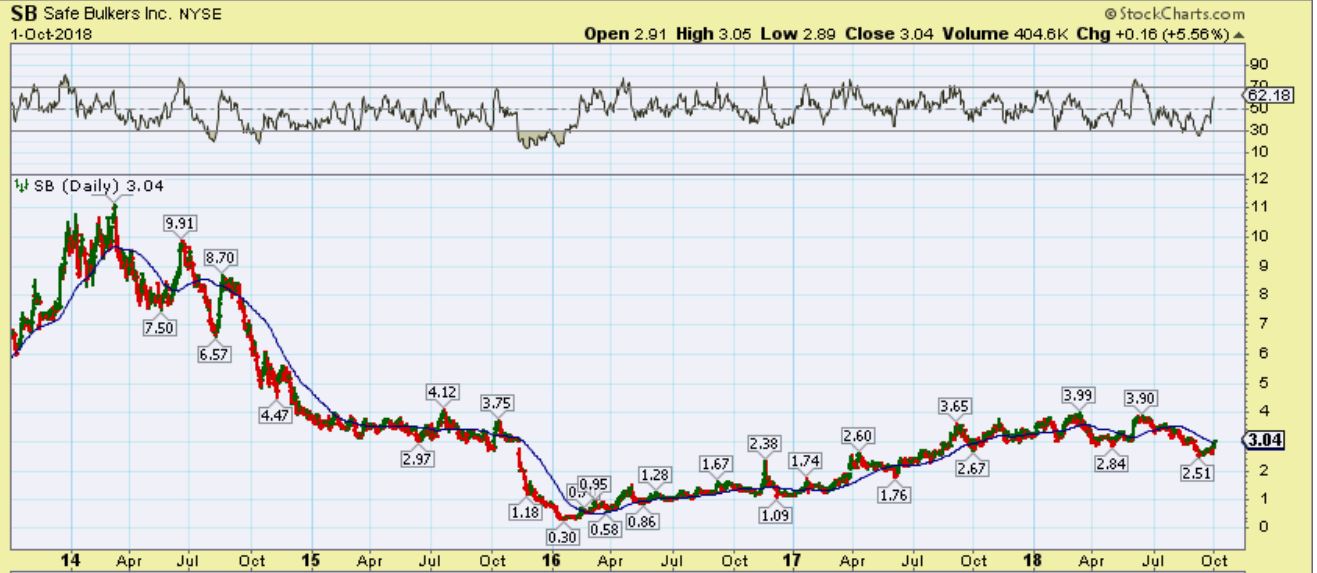
SB– It ran from $2.60 to $3.04 in 3 days. Breaking above the 50sma, it can run higher.
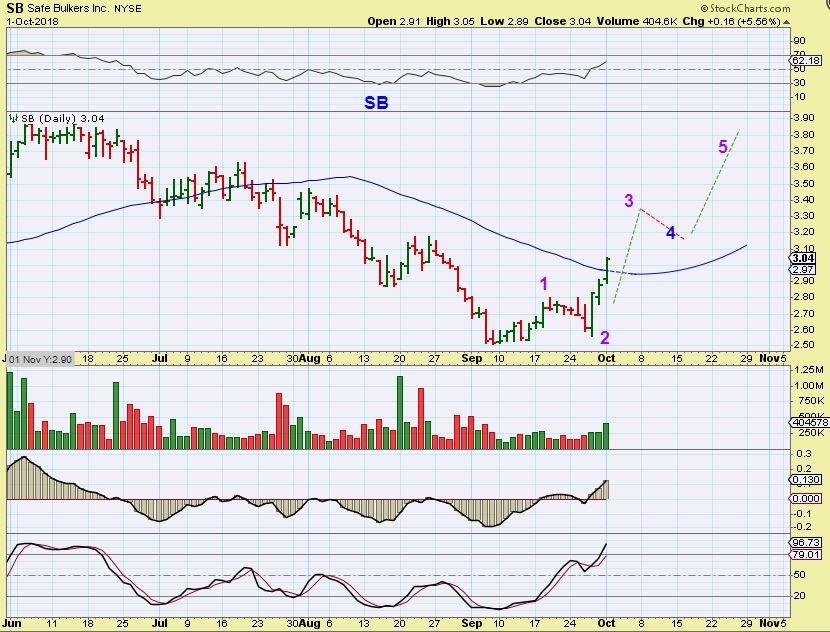
SB has gone from 30 cents to $4 since 2016 lows, and this is without reverse splits. IT IS NOT EASY TO BUY & HOLD THESE, but it would have paid off.
.
TK – TK is breaking out this week.
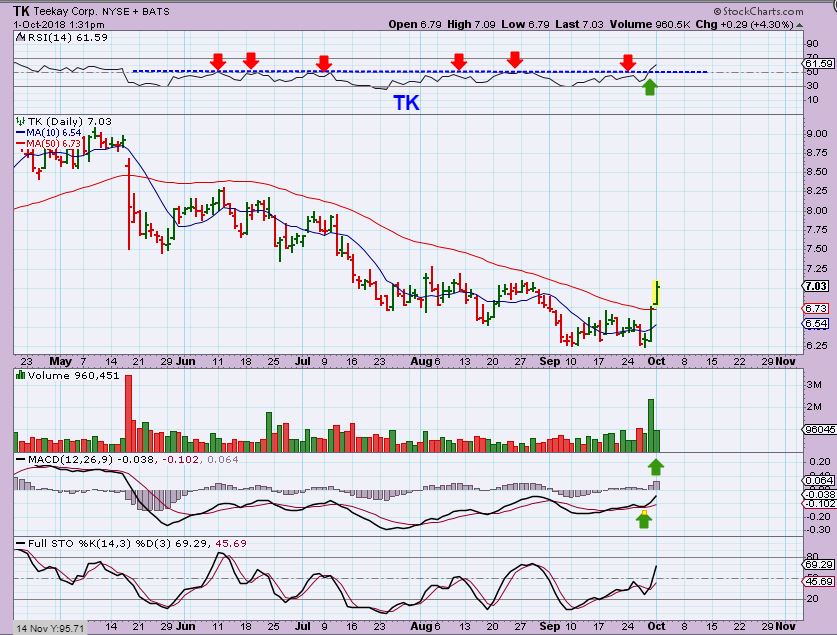
SO if you did keep a list of the Shippers , as mentioned a week ago, you may have caught some of these starting to take off, and others look ready to go now too. See EGLE, FTK, TNK for example, on a 3 or 6 month chart.
.
We talked about Steel Stocks like CLF, AKS, X, and even other Metals stocks.
.
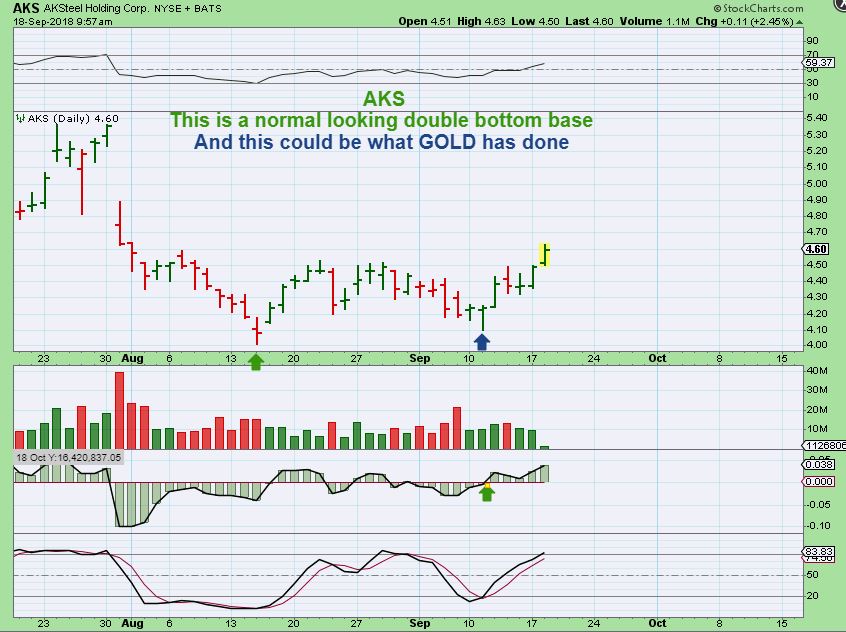
AKS on Sept 18th, I showed that AKS was breaking higher from a double bottom base.
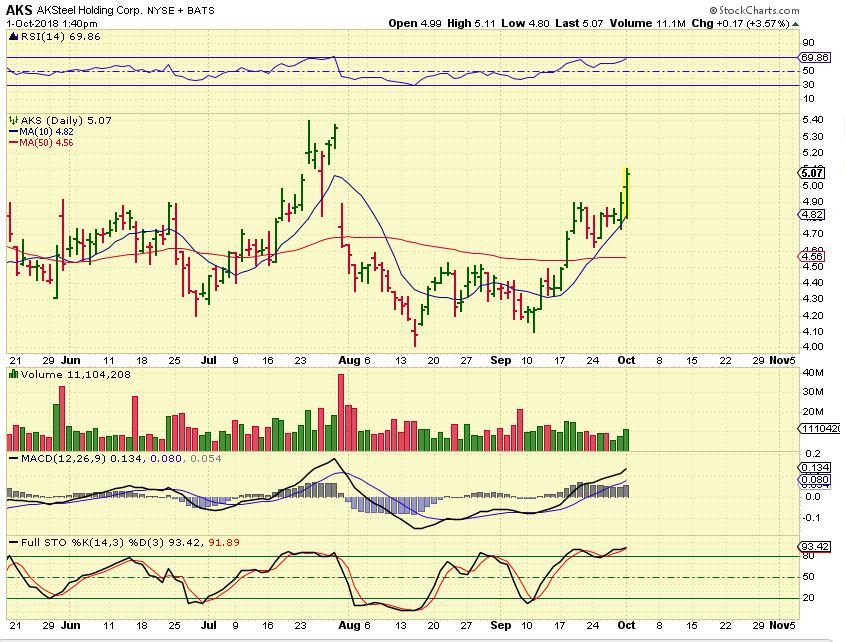
AKS – It ran higher and then reversed to tag that 10sma last week. Monday it Popped higher again, so Steel Stocks and other Metals still look fine. Also …
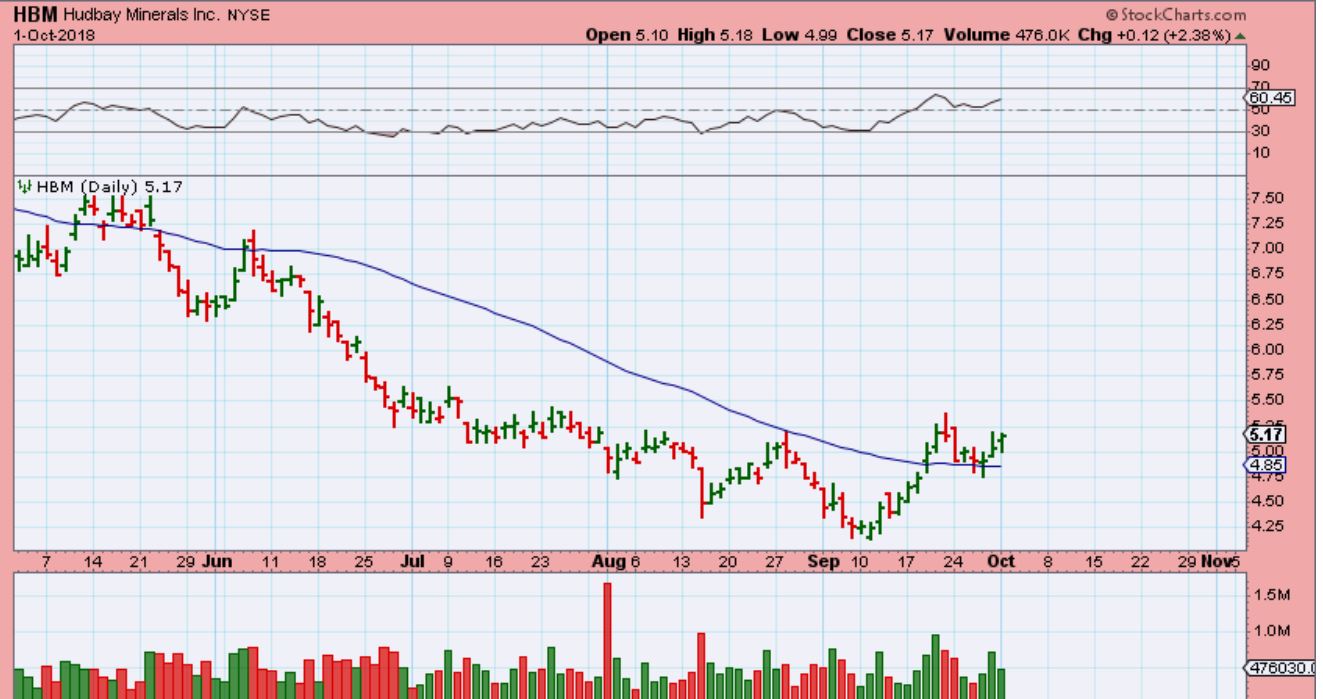
HBM remains healthy too, after a back test last week. This would be a great place to add to current position or even buy here.
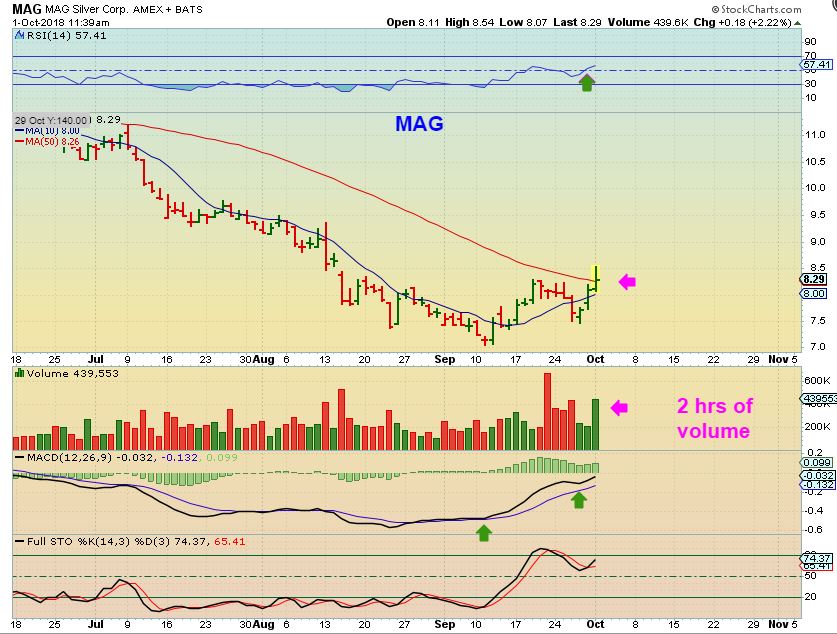
MAG – Mag looked great midday, but it did not close above this 50sma. I think it still looks fine, and will attempt to break out again.
.
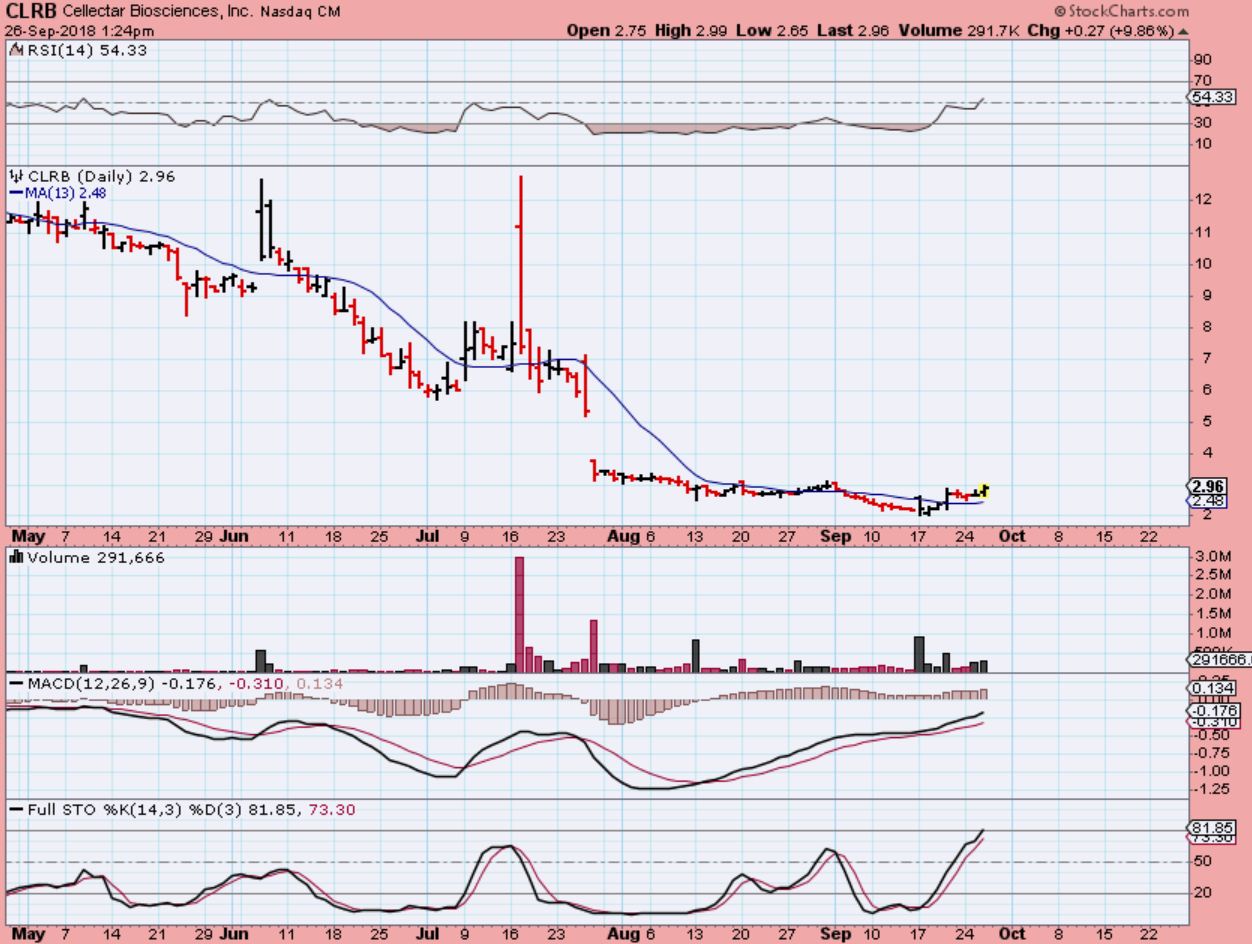
CLRB was a base that I pointed out a week ago ( and SOG mentioned in the comments ). I bought it, it has great upside potential. I posted this chart at $2.96
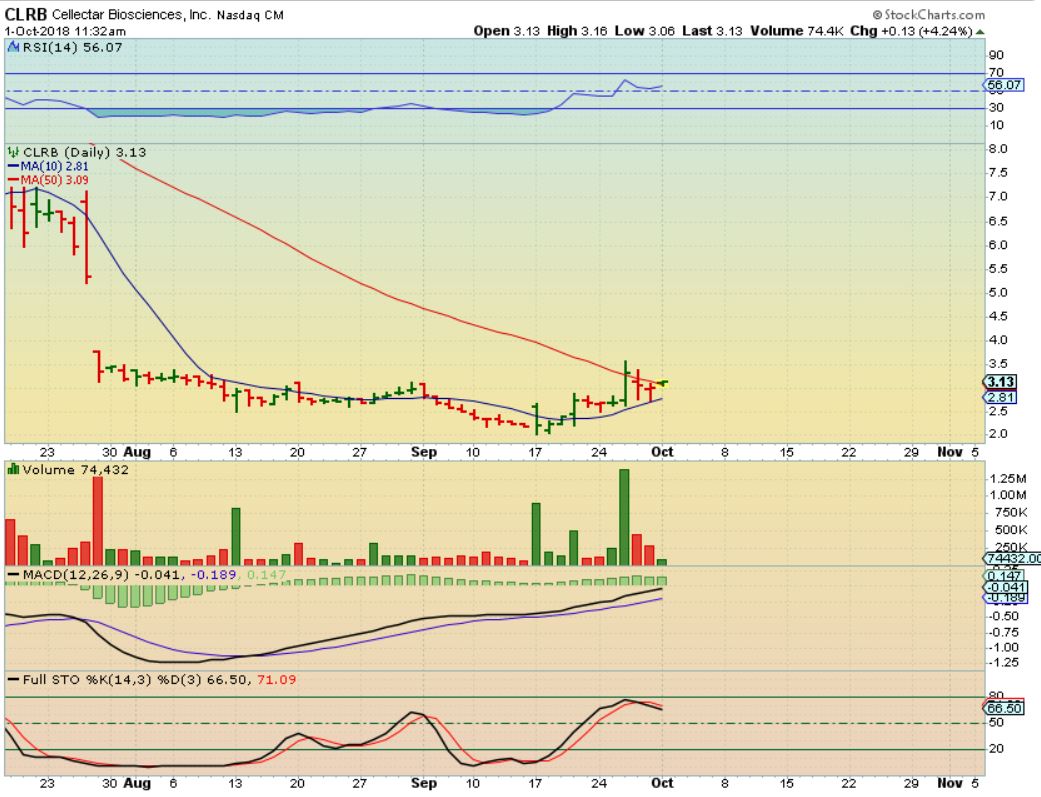
CLRB – Then I saw it Monday pinched between the 50 & 10sma, and also pushing on the 50sma, so I put this in the comments.
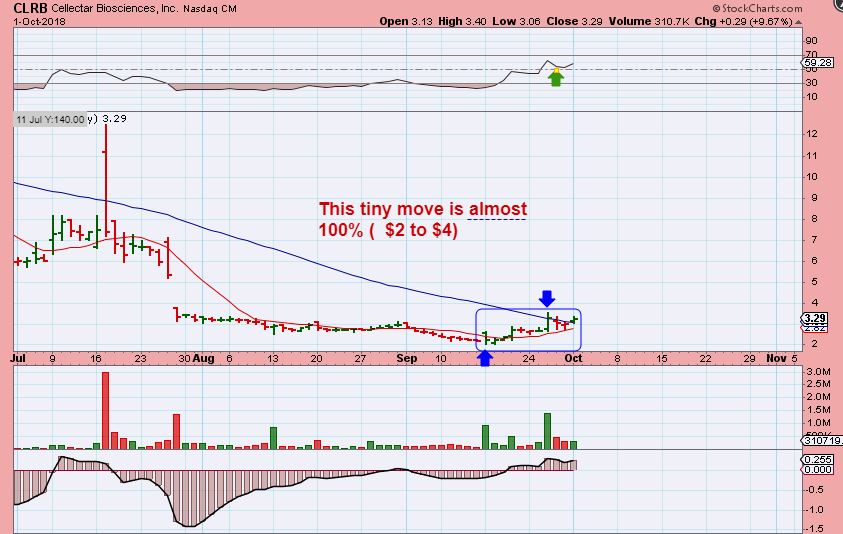
CLRB – AT the end of the day it moved higher. It closed up 10%, though the move does not look like a lot. If this takes off higher, the gains will be big. A sell off would hurt, so be reasonable with position size if you enter or already own this one.
MJ STOCKs, we all know the story by now. Trade at your own risk, they do move Very Quickly in both directions. I wont buy overly extended ones, but a move from a base can be very profitable. USE PROPER POSITION SIZE TO PROTECT YOURSELF. That said…
.
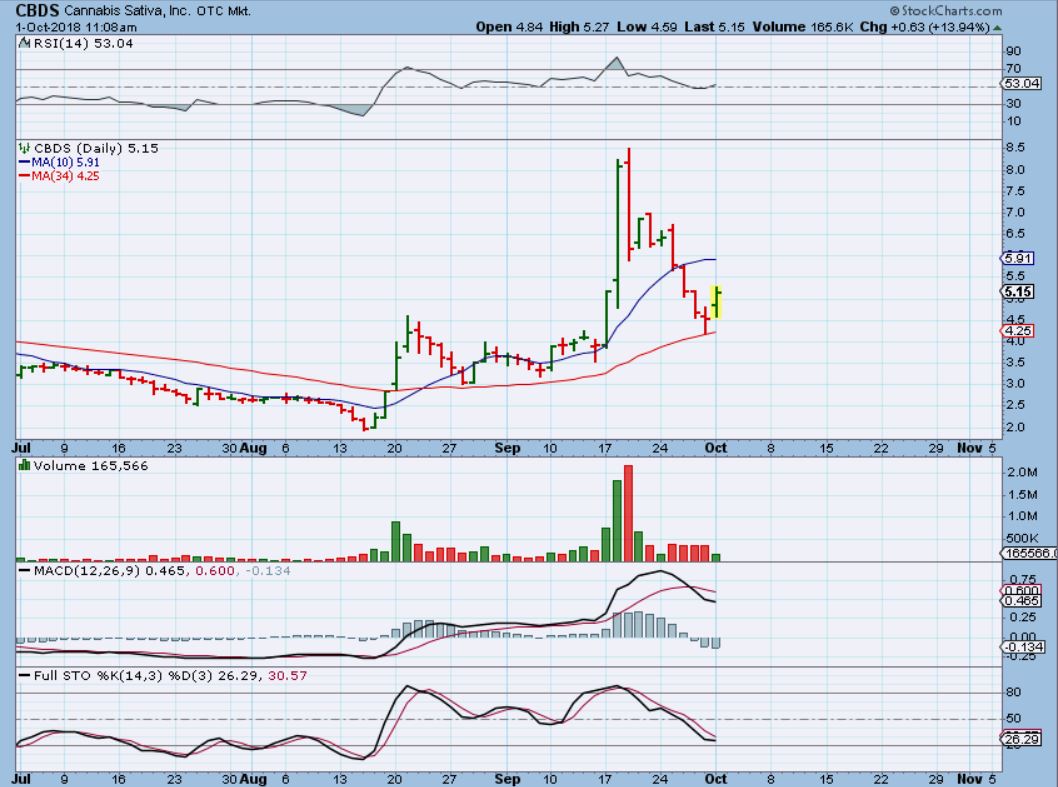
CBDS – Yes, THIS MORE THAN DOUBLED IN 2 DAYS SEPT 17&18. 🙂
I posted this at 11 a.m. as a reversal off of the 34 sma after a good light volume pull back. It actually kept going & closed up 30% to that blue line. Very nice and it can keep going.
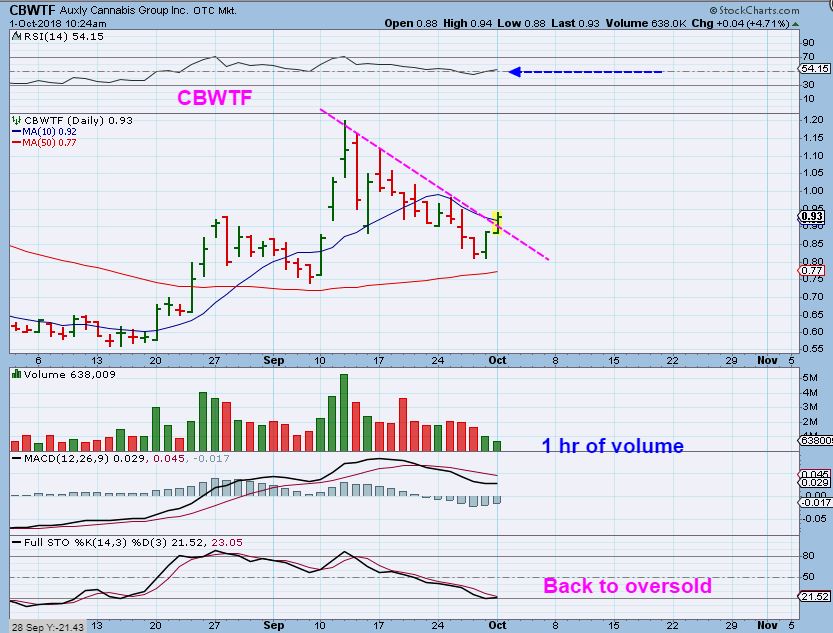
CBWTF – I like this set up as a buy, and it closed 2 cents lower, so it is still a buy with a reasonable stop.
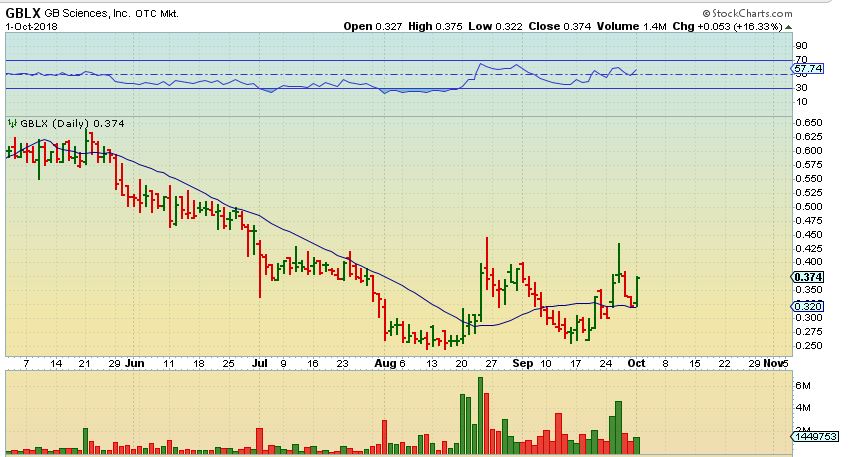
GBLX – This reversal also looks good, as it builds the base that it will likely launch from.
.
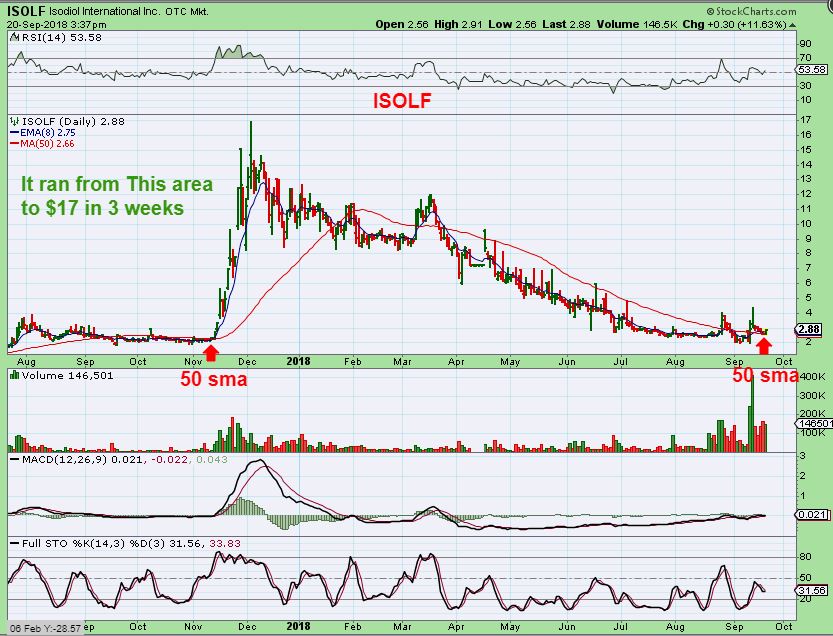
ISOLF – I AM PATIENTLY WAITING IN THIS ONE & HAVE ADDED. WHY?
.
ISOLF – Read the left side of this chart that I posted when I recommended this. It was in the $2.80’s above the 50sma. WHAT-A-RUN. Even 1/2 of that would be excellent, so I was buying at $2.80’s 🙂
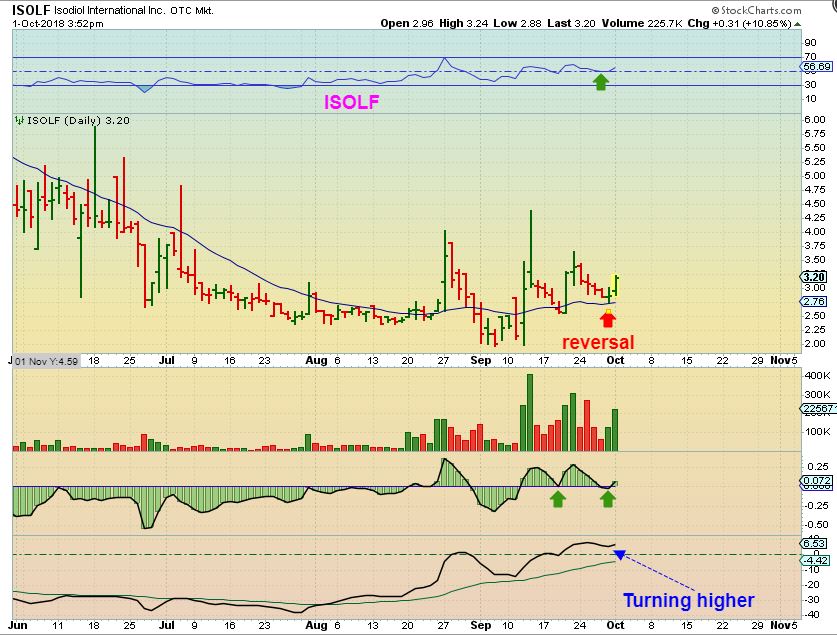
ISOLF – It ran to $3.50 in 2 days (Yay!) and then slowly drifted back again to under $3 (boo!). I watch it daily and saw that it DID reverse on the 50sma, so I looked intraday and it was moving from $2.88 to $3.06…
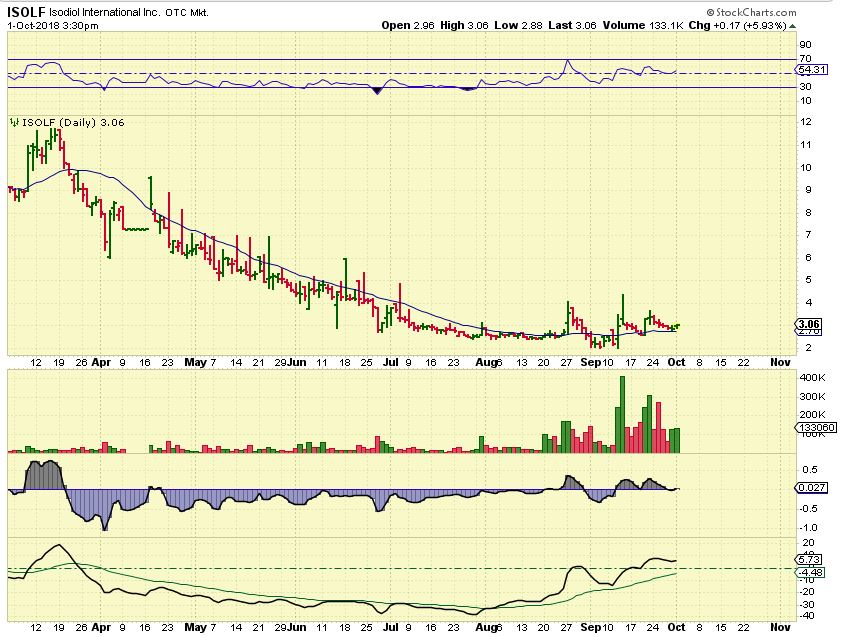
ISOLF – It was trading at $3.20 ( up 10%) in seconds, so this is NOT for the faint of heart. Remember, It ran to $3.50 & down to $2.80 again in days. That said, this is a reversal on support and volume surged into the end of the day…
ISOLF – Even a quick run to $4.50 is very ‘possible’. From $2.75 to $4.40 is a 60% gain. These move so fast, they really can be rewarding if you know how to play them correctly. And of course…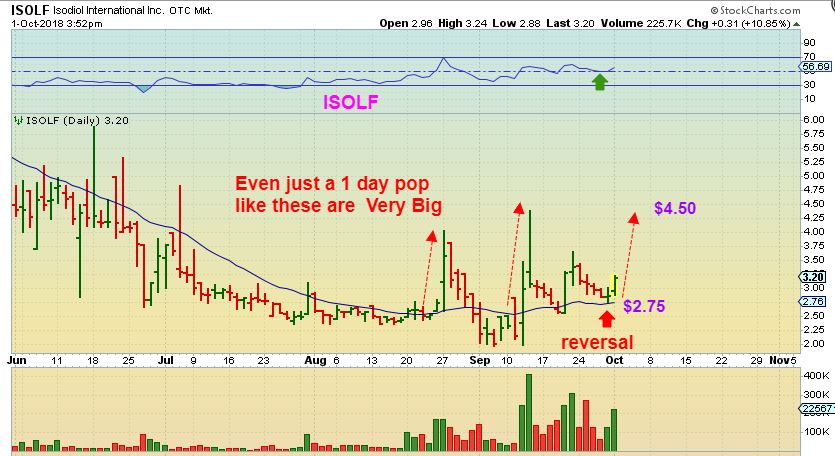
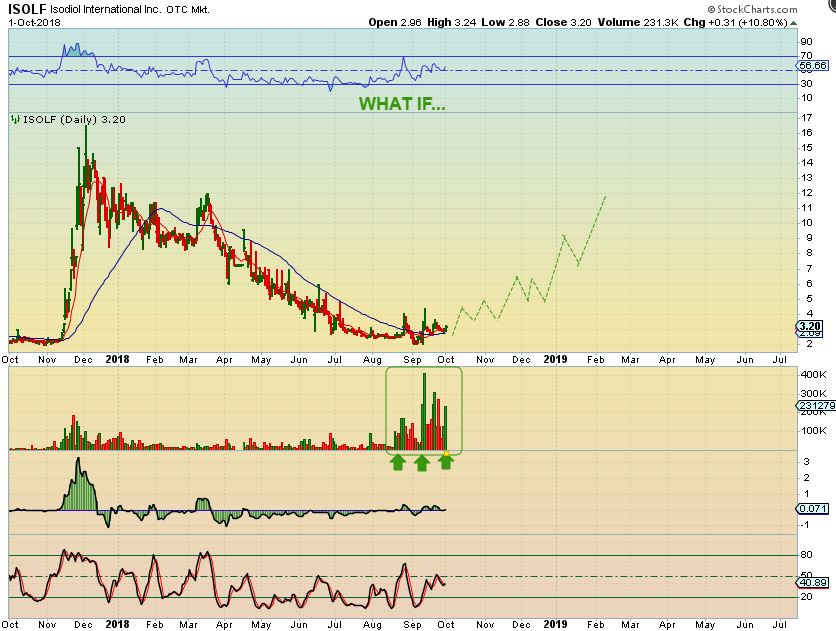
A small ‘buy & Hold’ position is NOT easy to ride out, but if one starts small and waits to see what happens? It could be pretty good. What if it eventually moved back to former highs?
We have a lot to look at in these markets, and some set ups have been great opportunities already, others should be coming in the near future.
.
Enjoy your Tuesday Trading!
.
