Wkend Report- Between A Rock And…
You’ll see why I chose this Theme Pic shortly, but first let’s do our Big Picture Weekend Review…
.
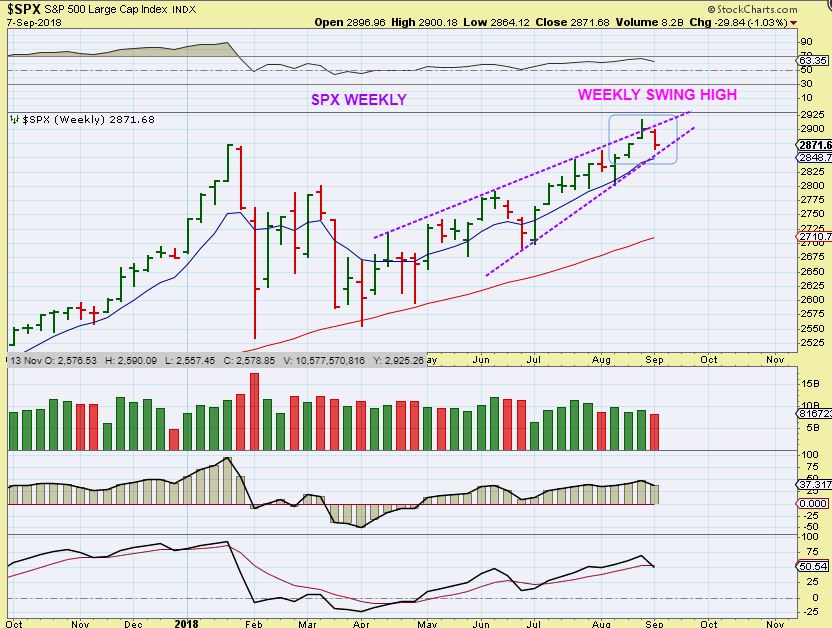
SPX WEEKLY – We have a weekly swing high, and I have been expecting a pull back to a dcl, even an ICL.
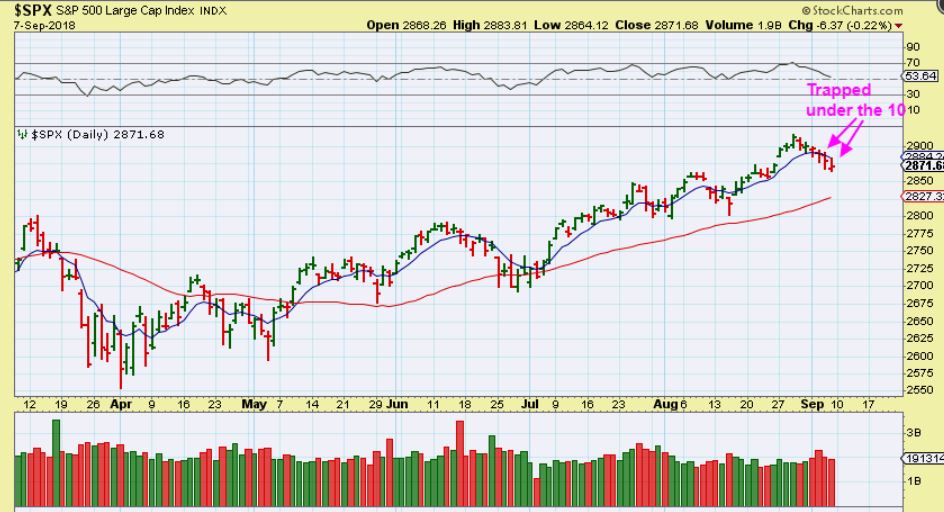
SPX DAILY – The SPX broke to new highs recently, but it is now dropping into that DCL. Will it stop at the 50sma? Look at the March sell off, that is how ICL sell offs look, and we are due for an ICL, we’ll see. Let’s look at the even bigger picture…
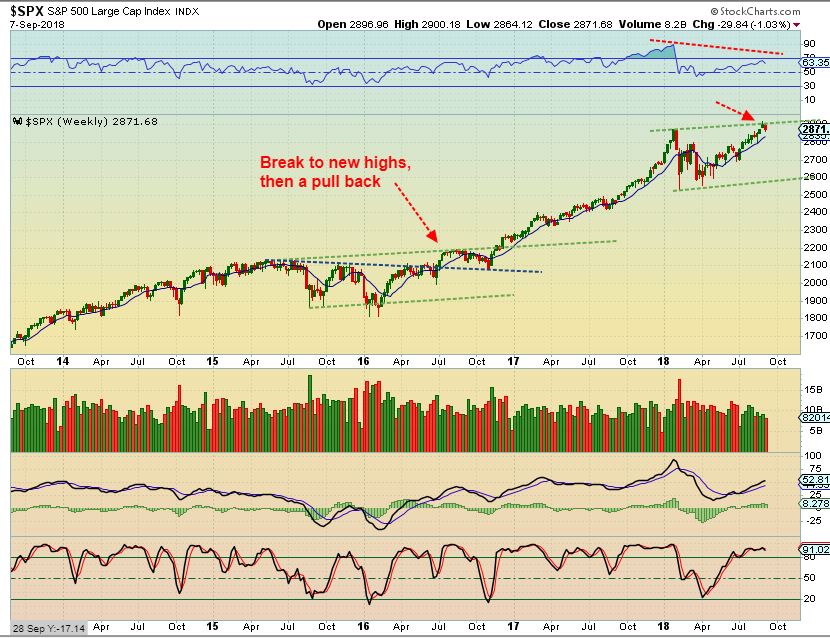
SPX WEEKLY – A break out to new highs often has people thinking that it will just keep running, but I often see a pull back following a break out. Profit taking may be taking place now, and we are due for an ICL type drop.
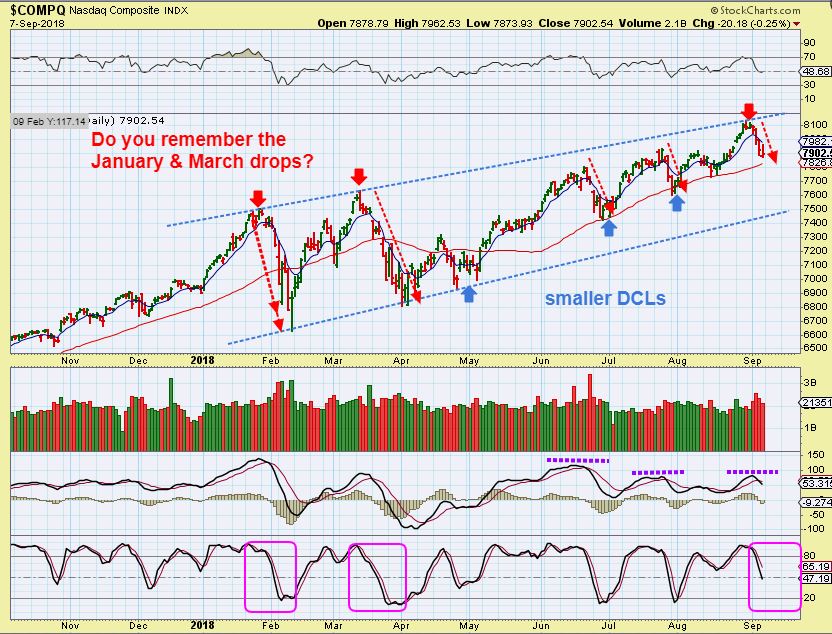
NAZ DAILY – Look at the FEB & MARCH drops. This helps us to see that a drop into an ICL can be serious. We are due for an ICL, but so far this dip is similar to the last few dcls.
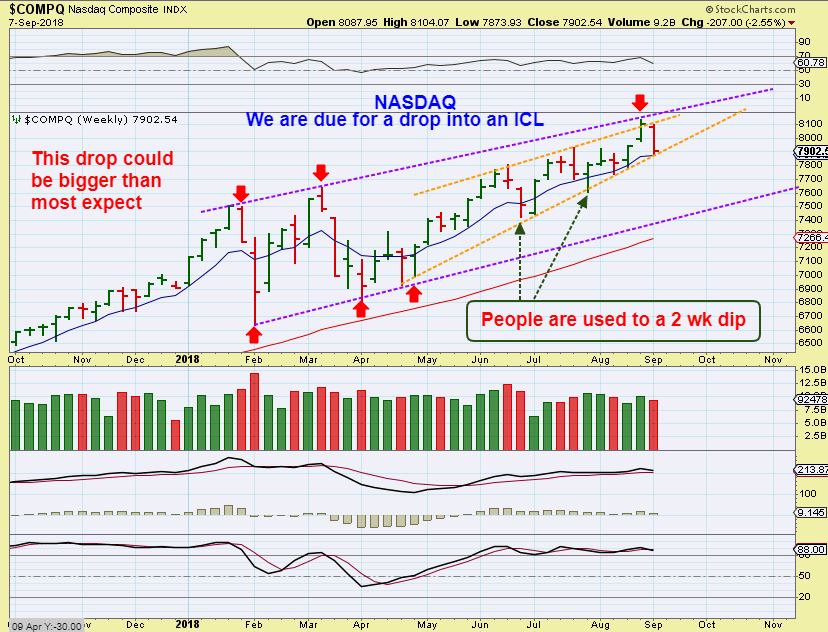
NAZ WEEKLY – We reached the upper trend line.
GENERAL MARKETS – I have been optimistic , a bull market has surprises to the upside, but I also have been saying that we are not only coming due for a dcl, but also for an ICL. This could be the start of that ICL drop.
.
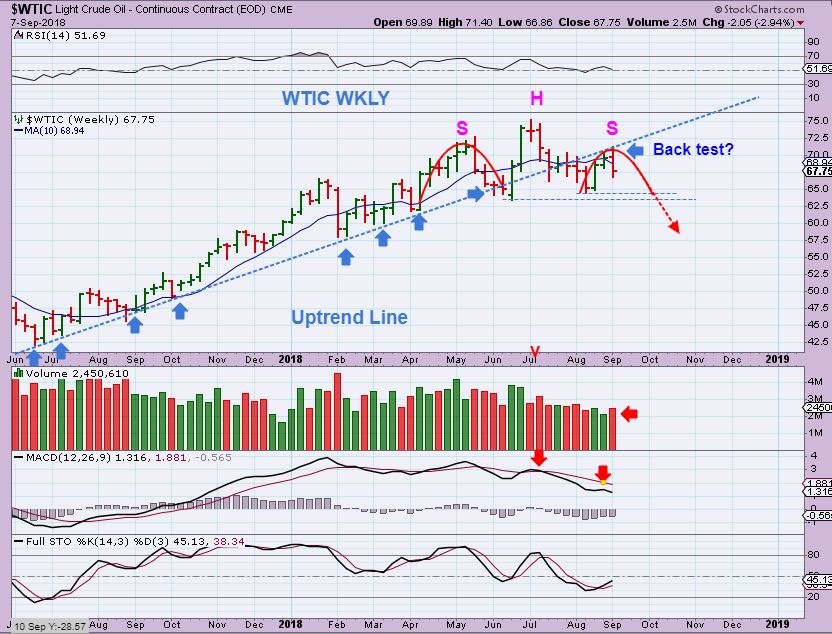
WTIC WEEKLY – Oil has played out exactly as expected over the past few months really. Notice the long term trend line too. OIL is due for an ICL too.
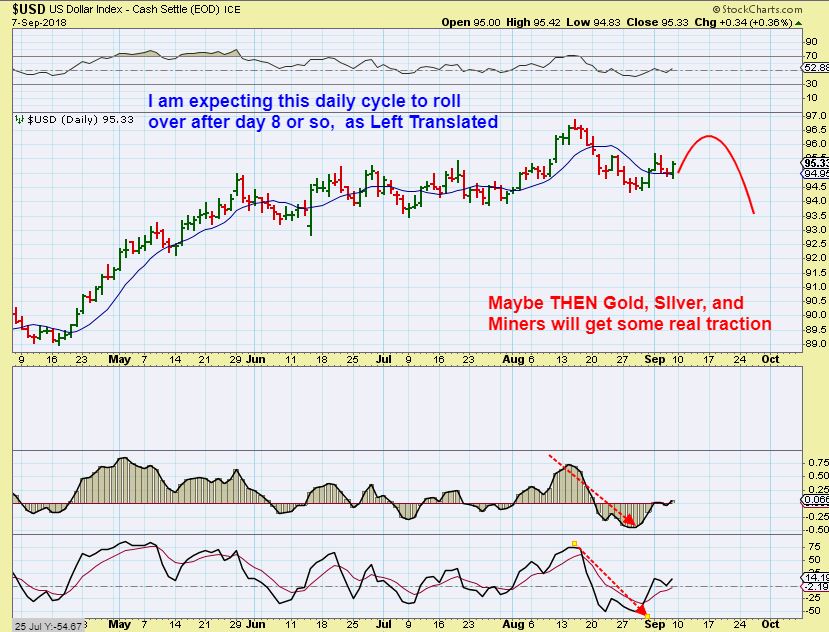
USD DAILY – Though the USD does not look bearish, I am expecting it to peak soon and roll over as L.T. It is also due for a larger drop into an ICL. Read the chart.
USD WEEKLY – My indicators are showing weakness on this last rally peak too.
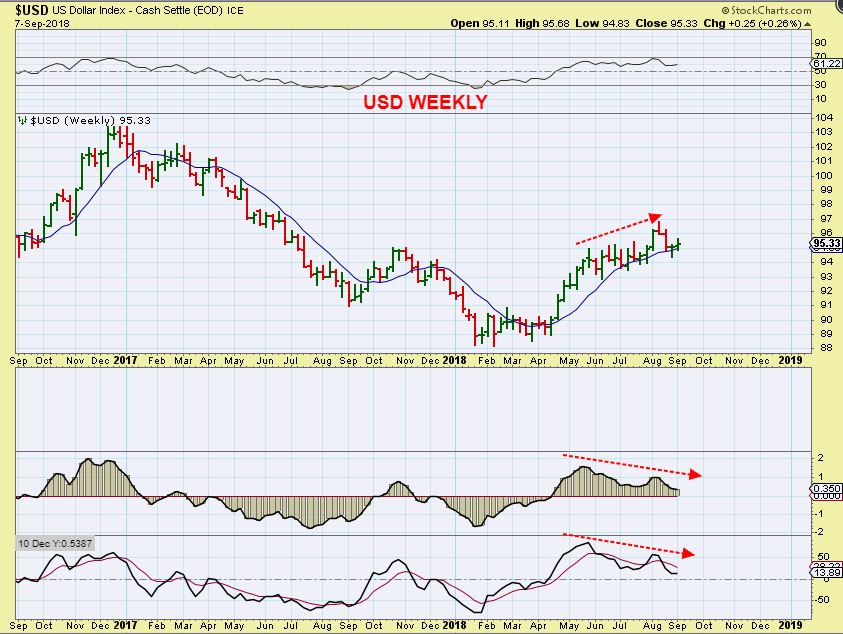
A USD DROP FROM HERE SHOULD HELP GOLD, SILVER, and the MINERS
.
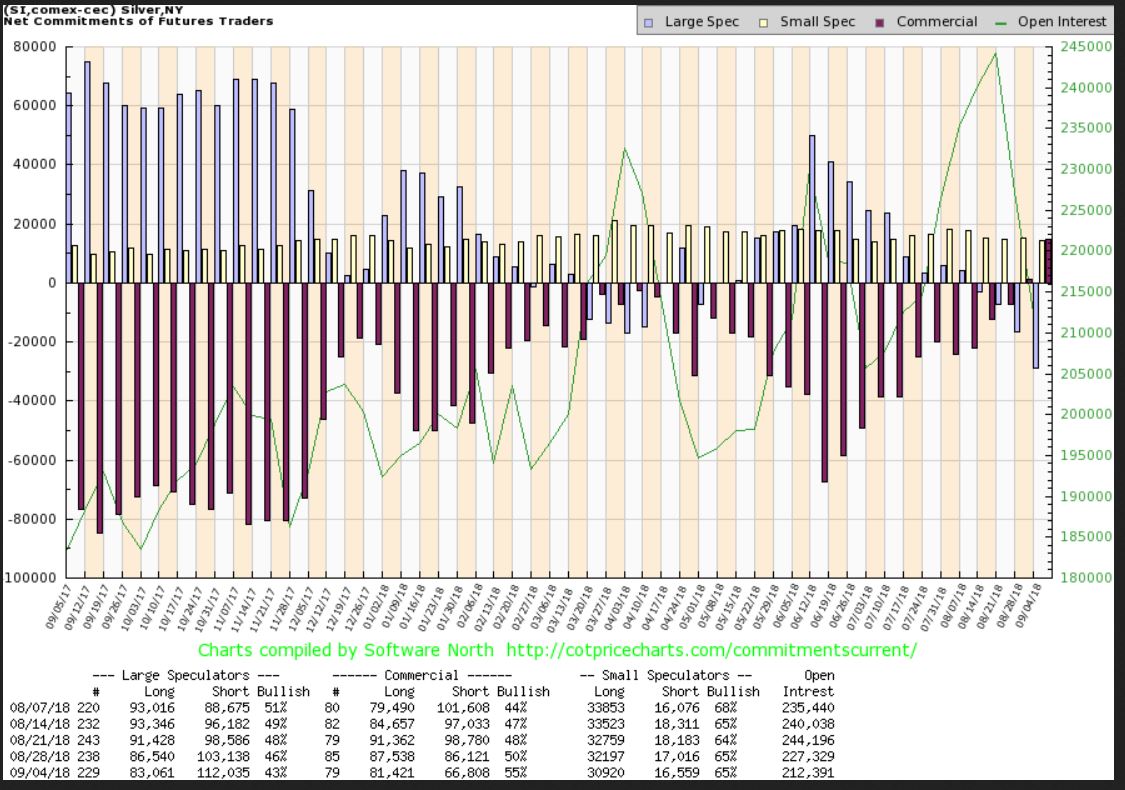
SILVER & GOLD COTs – ARE YOU KIDDING ME?
The SMART MONEY has gone quite LONG Silver & Gold according to current COT. They are almost ALWAYS short Gold as a hedge, even during deep sell off lows and ICLs.
SILVER COT – I don’t recall ever seeing this.
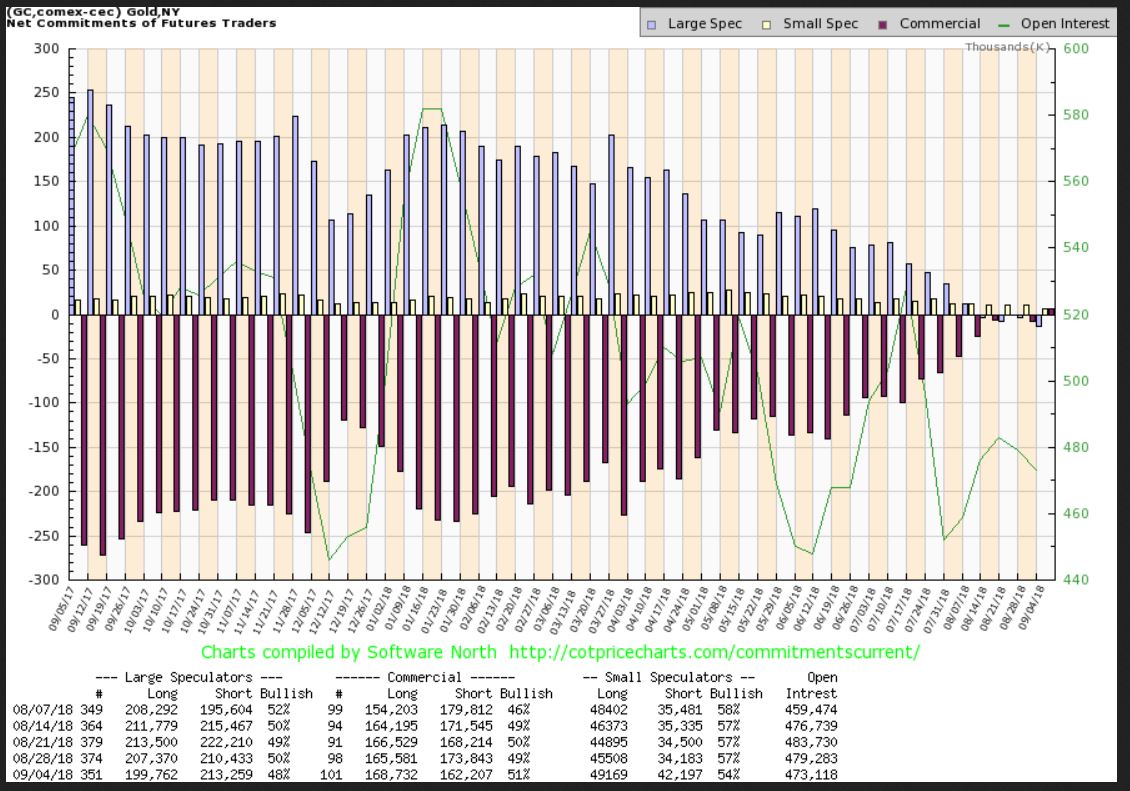
This is GOLDS COT – This hasn’t been seen since right before the 2001 Gold Bull Started.
I have had people ask me, ‘ Do you know where was the COT back when we got our rally in 2016?” Yes, I do, I have my older COT charts on File.
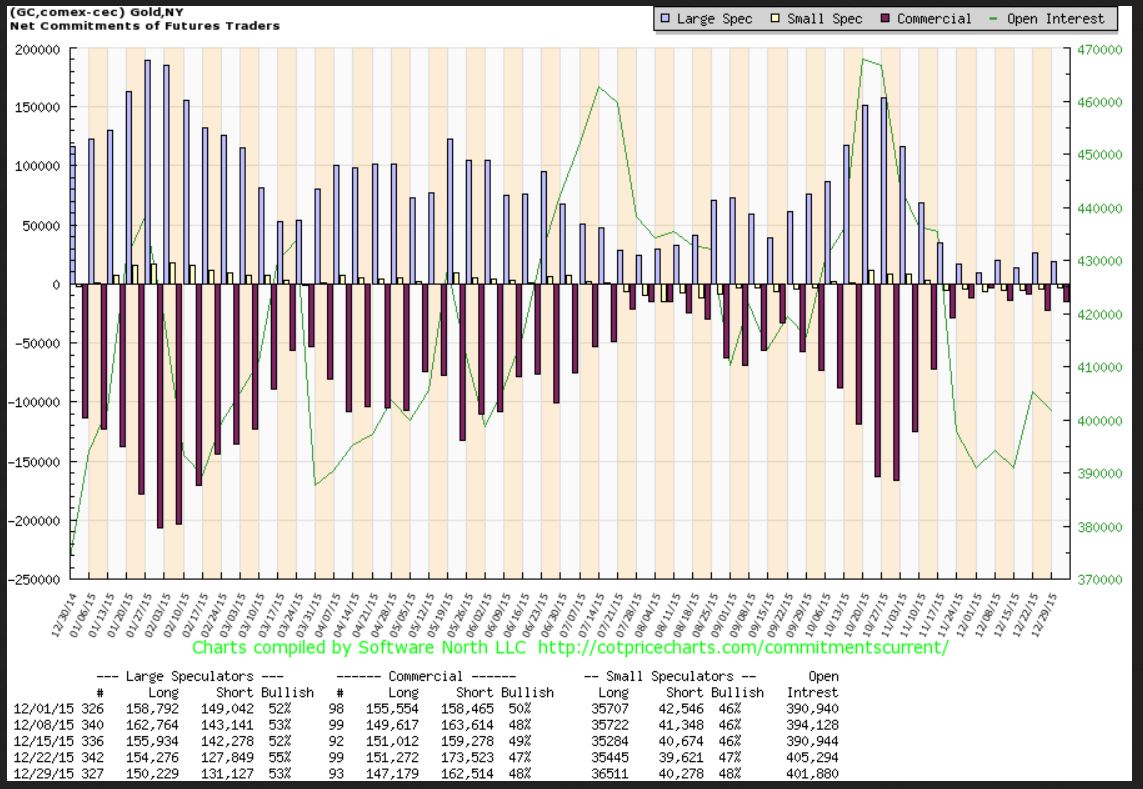
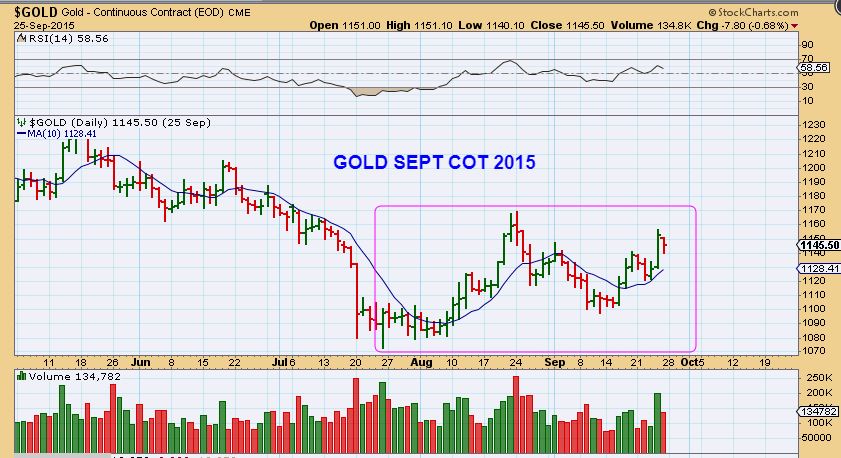
2 charts – July 2015 COT on the far right of this chart. This was an ICL of 2016
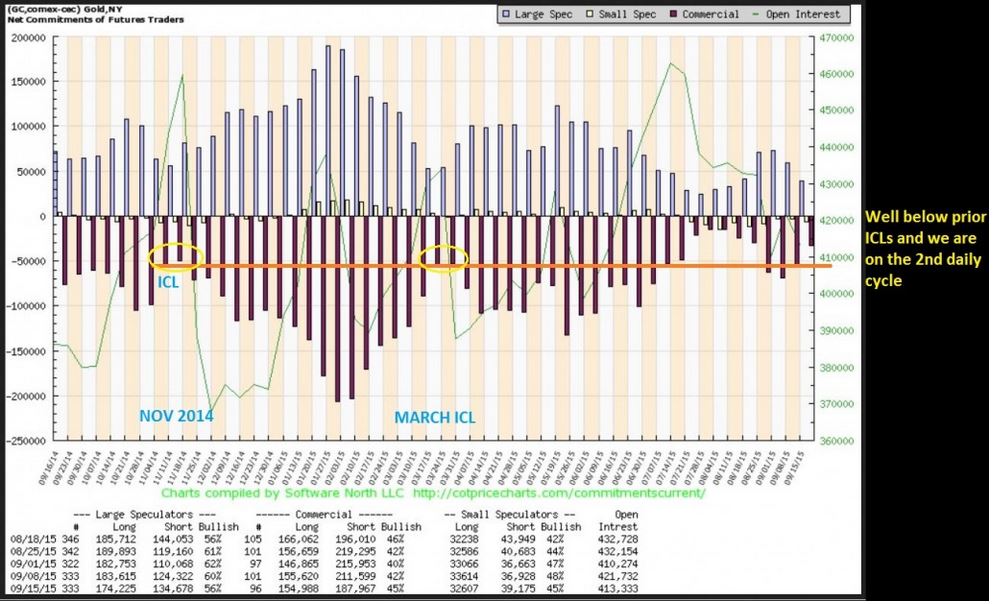
DEC 2015 ICL, before that massive rally in 2016. Smart Money reduced ‘shorts’ to VERY LOW, but never went long. So our current COT reading is better than July or Dec ICLs of 2015.
.
I WANT TO POINT SOMETHING OUT HERE
.
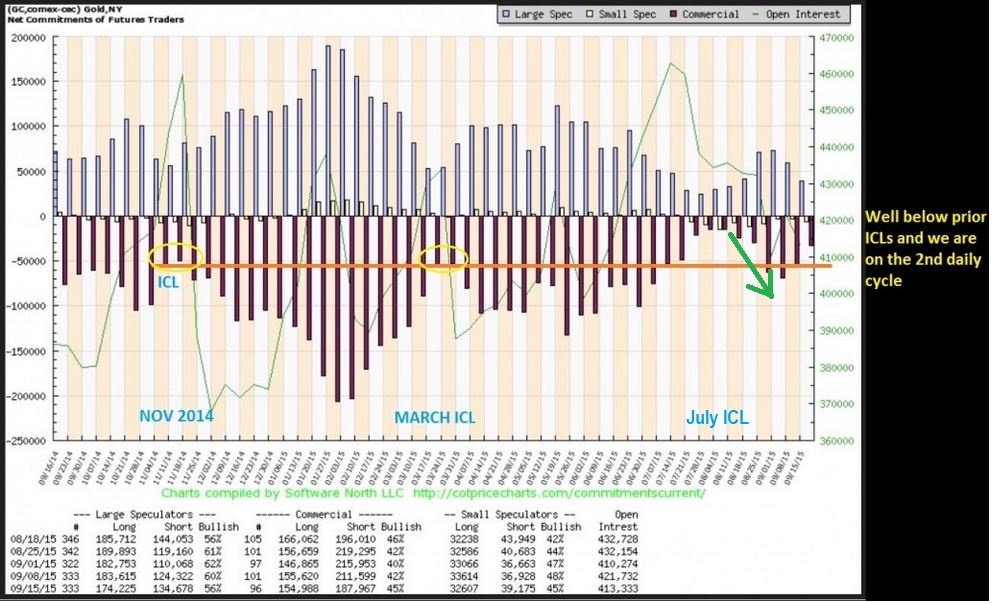
This is GOLD JULY ICL 2015 – As Gold ran higher out of that low, notice that …
NOTICE THAT AS GOLD BOTTOMED IN JULY 2015 & ran higher, the COT shows Smart Money was getting heavier ‘short’ again into August ( green arrow). My Point? As Gold rises as seen in the above JULY 2015 chart, you expect them to add to their shorts. THAT is NOT happening now.
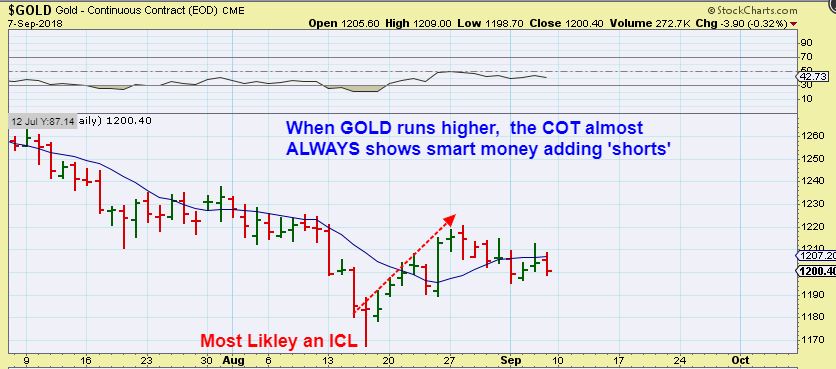
This is GOLD currently rising, and yet the COT shows smart money is STILL closing shorts and actually went long as Gold moved off of the lows. This doesn’t match the July or December of 2015 COT for Golds ICL. Smart money is now Long Gold, even after a bounce. That is so Rare, that I do not remember seeing it in the past 20 years of my trading.
.
.
THIS is actually why I chose that ‘stuck between a Rock & A Hard Place’.
1. I want to seriously advertise & scream about how Bullish this set up is, along with sentiment reading and other factors, and I personally want to be positioned heavily long, but at the same time…
2. The COT does not time lows, and For the sake of the readers here, I need to remain balanced.
.
I Know that many here like to go in very heavy at lows with JNUG or NUGT, and some use Options to get heavily positioned for the rise too, but as I have mentioned many times, and you have seen it too- These COT Readings & positioning really aren’t a good ‘timing’ tool. This is telling me that we are seeing extreme conditions on the Bullish Side, but so far the reaction has been tame in Gold and NOTHING in Miners. CHOPPY LOWS can kill Options and decay in JNUG can add to losses. That said, Patience for some signs of strength in Miners is better for those choosing leverage. I think you will have your ‘big profits days’ in the near future. The set up is very Bullish for the precious metals sector. Let’s continue and just look at the facts…
.
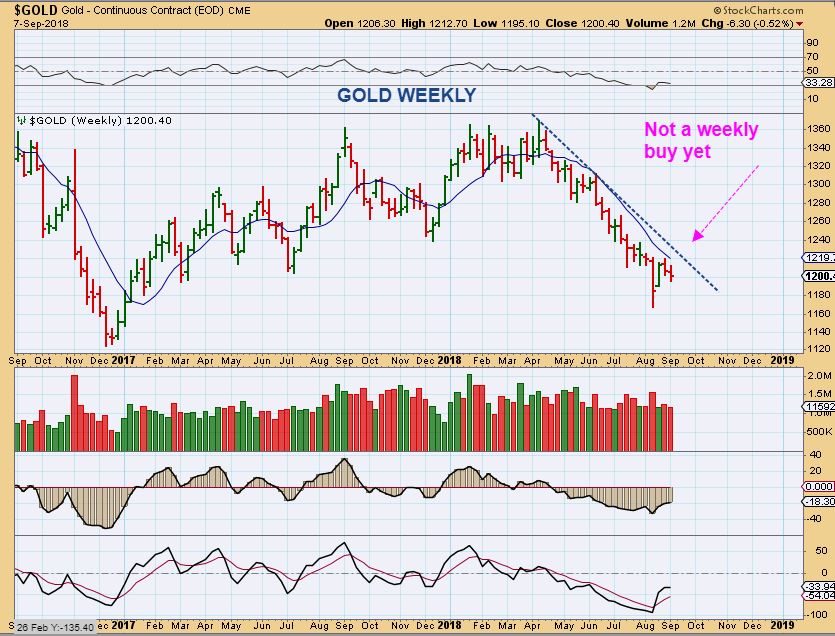
GOLD – No weekly ‘buy’ yet, but this would appear to be the ICL. Could it follow Miners and drop to slightly new lows? never say never. Maybe if it did, Miners would then resist the selling & lead the way higher. We just need more time to know for sure.
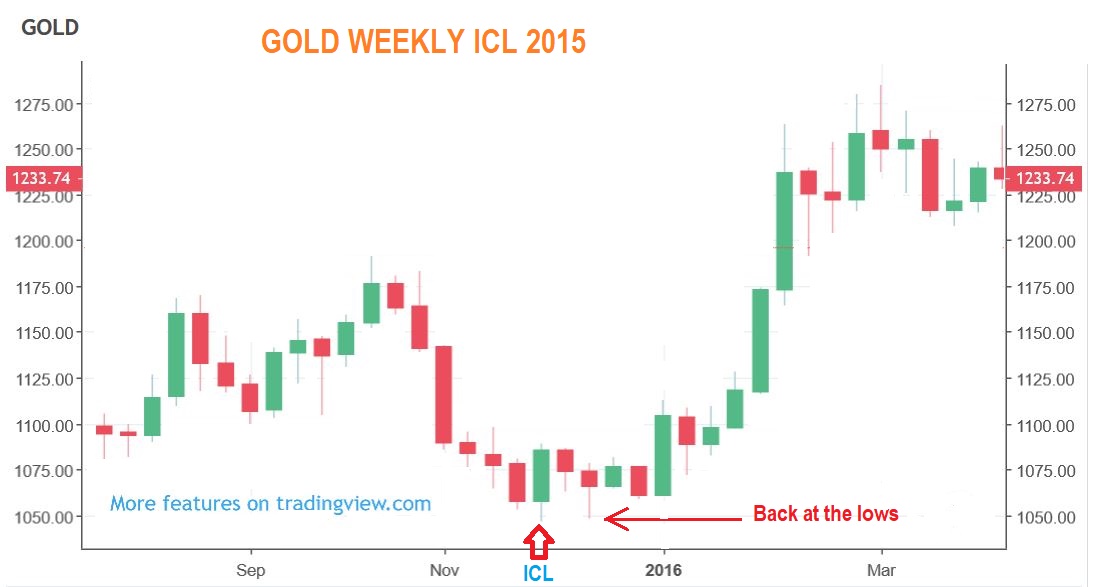
SO AGAIN, CAN GOLD drop toward the lows again? It did in Dec 2015 2 weeks after the lows were in place, as seen here on a weekly chart, it just didn’t break the lows. Never say never.
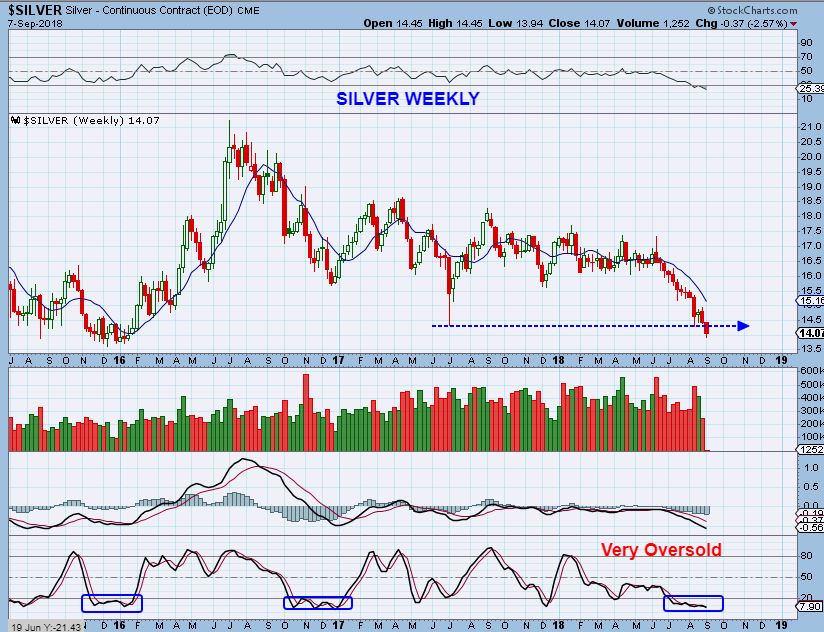
SILVER WEEKLY – Silver broke the July 2017 lows and is actually sitting near the Dec 2015 Lows. All I can say here is that the Silver COT is now extremely bullish, sentiment is at bullish extremes too, and it is just a matter of time.
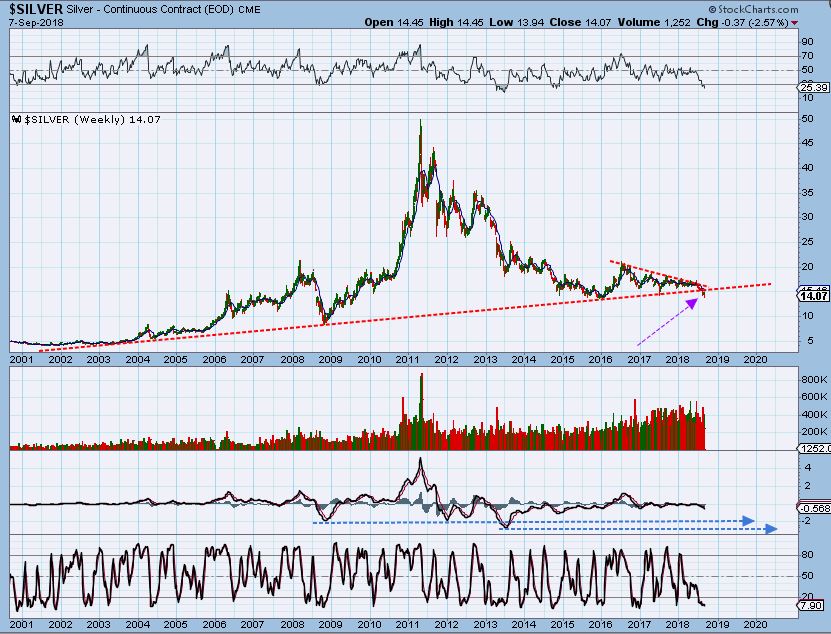
SILVER WEEKLY – Silver has even broken the uptrend line of the entire bull market, so a recovery would give us a shake out.
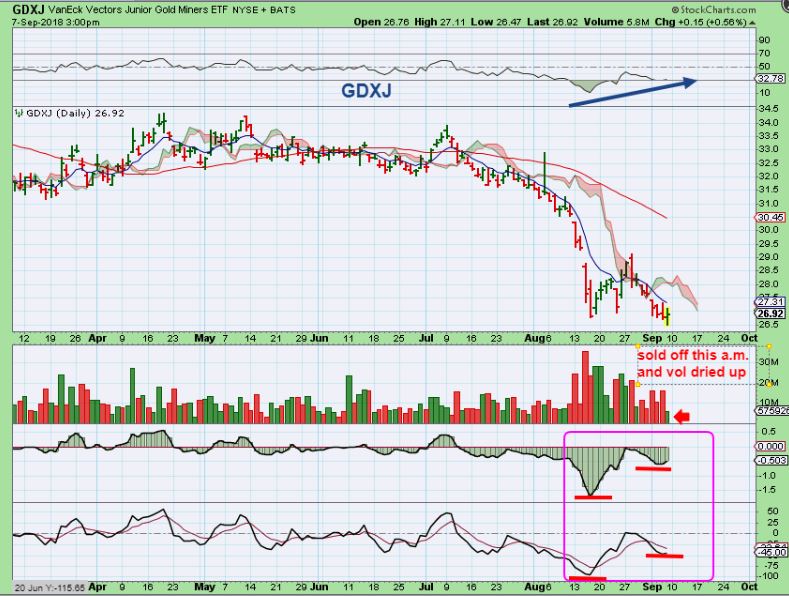
GDXJ – I am looking for a bounce here soon in the short term, simply because the divergence is strong as GDXJ did a slight break of the lows. This has a day 15 low so far. Yes Rob ( from canada), this ICHI is your old setting that we used to use for dcls 🙂 Price remains below it.
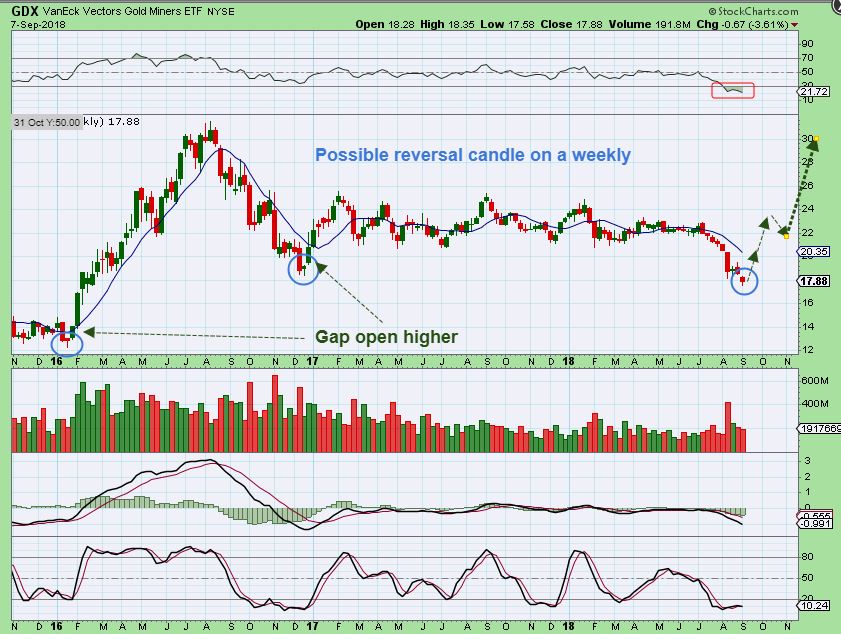
GDX WEEKLY – The Big Picture has a small hammer candle, which can be a reversal after a long sell off. I’ve learned not to get my hopes up with this current sell down 🙂 but in prior hammer lows circled, we would have a Monday Gap open higher as something to look for. We have broken the Dec 2016 ICL (lows).
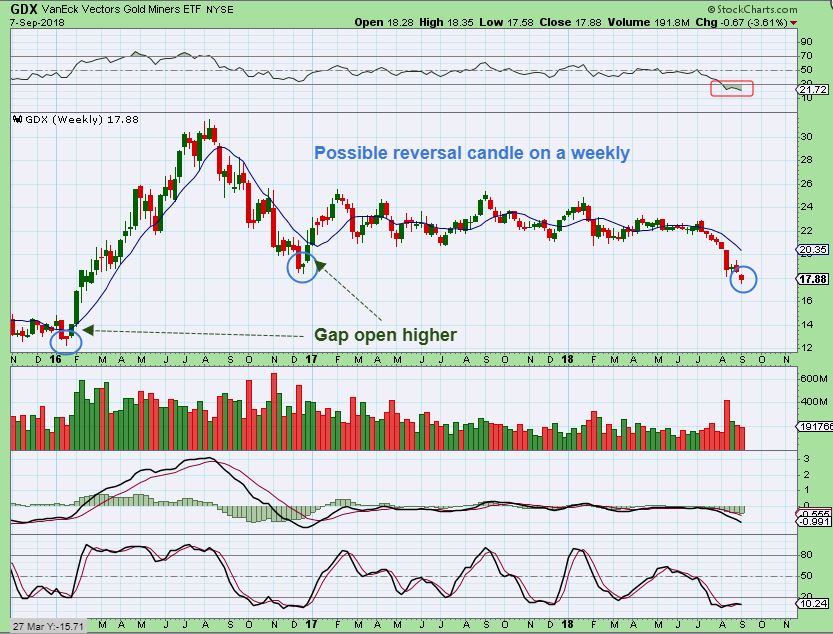
GDX WEEKLY – We would love to see a sudden ramp higher with short covering like this…
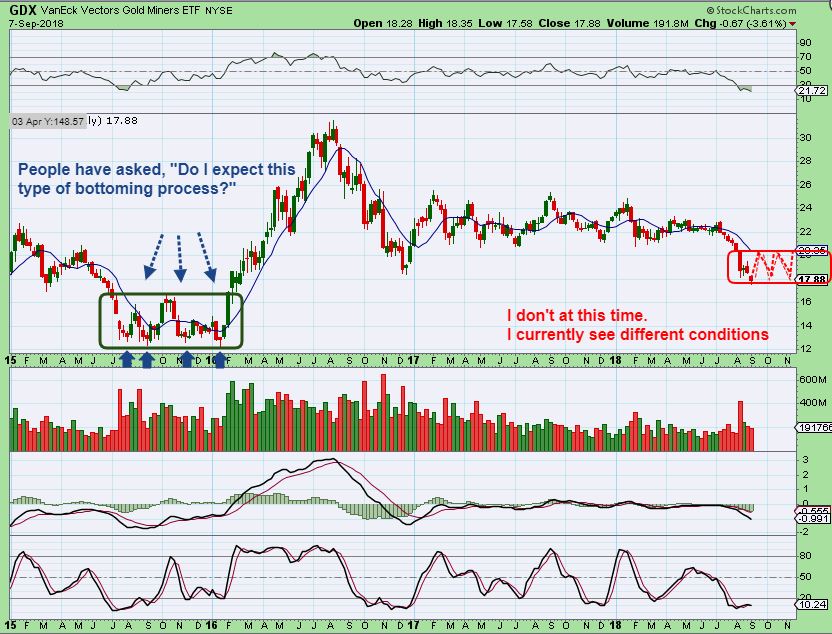
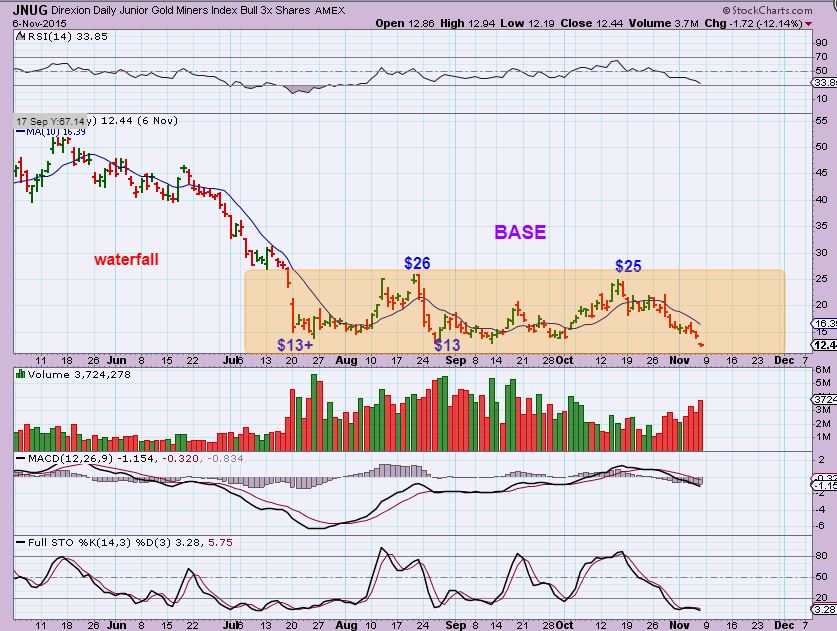
GDX WEEKLY – I have been asked about a choppy low forming, similar to 2015. I do see differences from now & then, conditions differ, but of course we can’t say dogmatically that a choppy bottom won’t form. See the chart. However..
You may be surprised to know that even in JULY 2015, JNUG doubled twice within that base. You would have to buy at the right time, ride a rough uncertain period of bouncing action, and sell the top to keep all of those 100% gains, but it did double twice in that chop, and you could catch 60- 80% without catching the lows. Warning: The drops were CRASHES, so choppy did not make for good long term trading.
And we’ll just get silly and check out how JNUG then dropped to the next ICL low in Jan to $8 and went on to run up to $140. We rode a lot of that, it was extremely mind bending on the pull backs though, very very difficult, always fearing that we’d lose out gains. It dropped from $75 to $40 at one point into May alone, this was NOT as easy of a ride as some would think just looking at a chart. 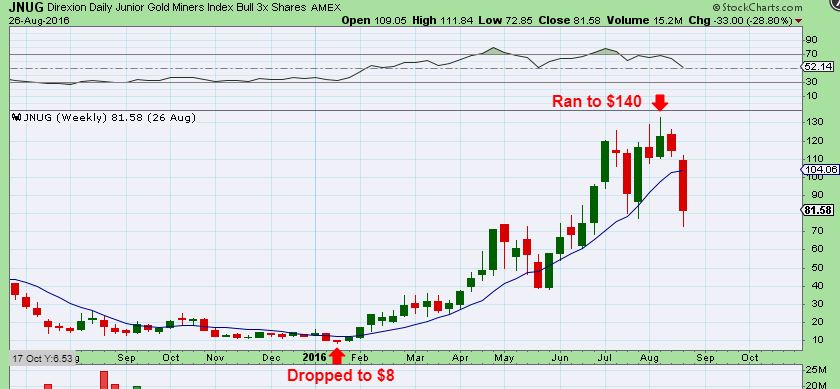
So let’s review.
-The General Markets have been Bullish, no doubt about it, but The FEB and MARCH DROPS show us that good solid pull backs can happen when an ICL comes due. We are due for an ICL.
-The Oil and the USD are also both due for an ICL, so it seems likely that after the USD finished its bounce in this daily cycle, it rolls over as Left Translated.
– I am thinking that we may see all of these sectors drop at roughly the same time.
– WHEN THESE SECTORS DROP, Maybe that will lead to a push to Precious Metals as a safe haven move, since they should be starting to move higher out of their ICL, which is PAST DUE. If this triggers a ‘short covering rally’, I do not expect a choppy base like July 2015, I would expect a steadier ramp up higher, but we’ll see.
.
So this is where we stand currently. As that old saying goes, I am stuck between a Rock & a Hard Place, in between too tough situations. One being that I want to be cautious, to prevent short term loses that could come from a choppy bottoming process in the precious metals (leverage & Options could amplify the losses). At the same time, I am very excited about this current set up too. Sentiment is in the gutter for Miners, people not only HATE those miners, but they tend to fear entering a position, expecting the lows to be taken out again and again and again. Meanwhile the COT shows us that SMART MONEY is now Long Gold & Silver, and that is something bullish that hardly ever happens.
Many things look Very Very Bullish for the precious metals sector, though patience and looking for a sign of strength in the Miners ( a swing low confirmed for example), is my best advice at this time. Some individual Miners are showing good signs of bullishness, we have looked at charts of SBGL, HMY, GSS, AY, and more as being nicely off of the lows. As a trader that trades daily, I may take trades that I do not openly recommend here yet, but that is a separate situation based on caution.
.
Hopefully next week will give us some more obvious Bullish price action in the precious metals sector. The Miners can tack on some quick gains once they get going, and I know many readers are looking forward to that time of trading.
.
Enjoy the rest of your weekend and thanks for being here at Chartfreak!
.
~Alex
.
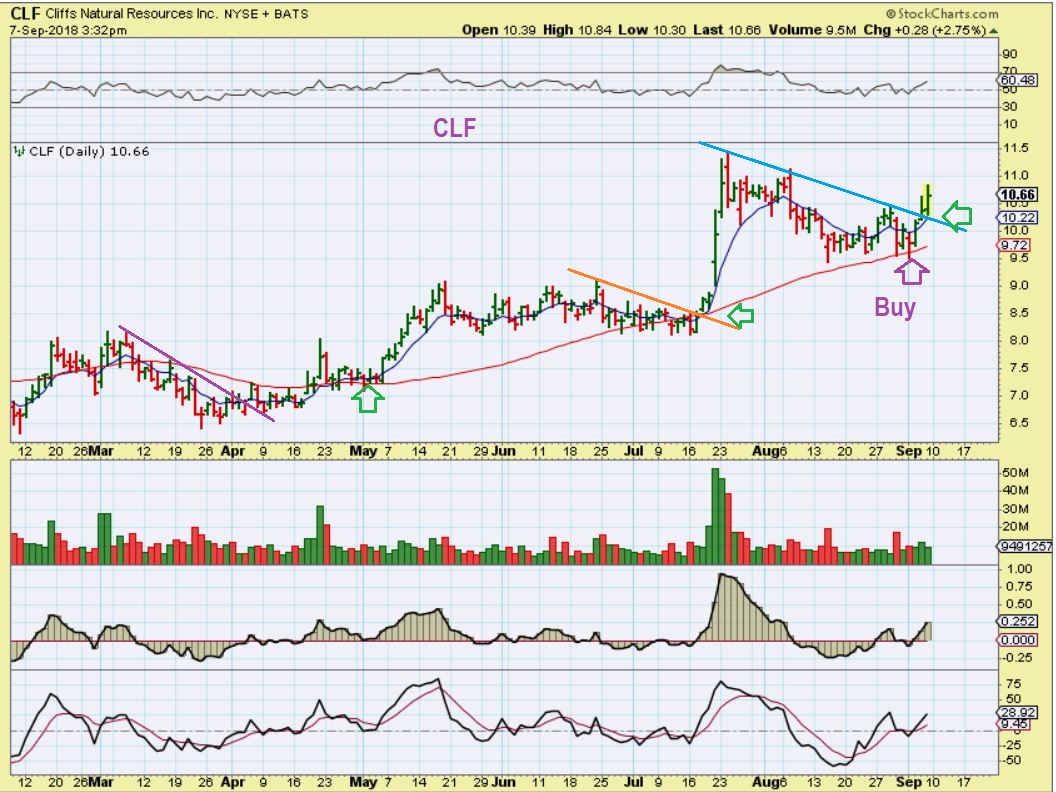
CLF DAILY – Some ‘Metals’ stocks are actually perking up, and this may be due to tariff adjustments or the USD starting to weaken. Whatever the case, this chart looks good moving off of the 50sma again. I’d consider it a buy breaking this down trend too.
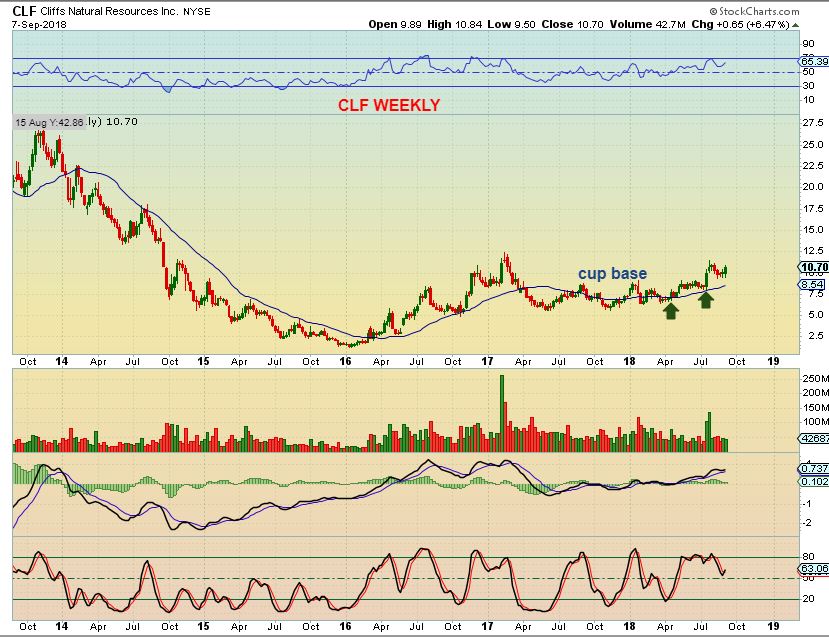
CLF WEEKLY – CLF is a nice longer term bullish chart, but the recent base action of a cup has been tricky to ride on a daily basis.
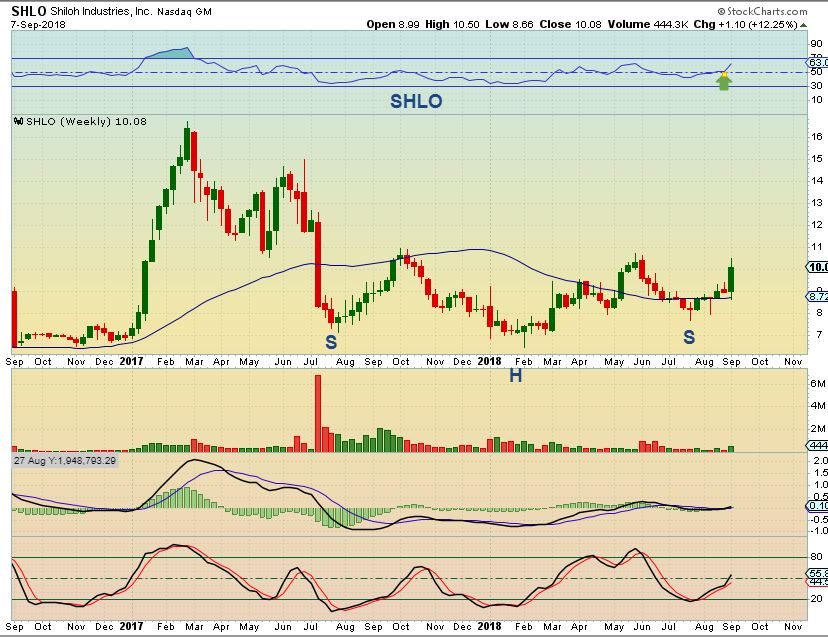
SHLO WEEKLY – Both the daily & weekly chart regained the 50 MA. This is a bullish longer term chart too, so many this area will start to bottom and shape up too.
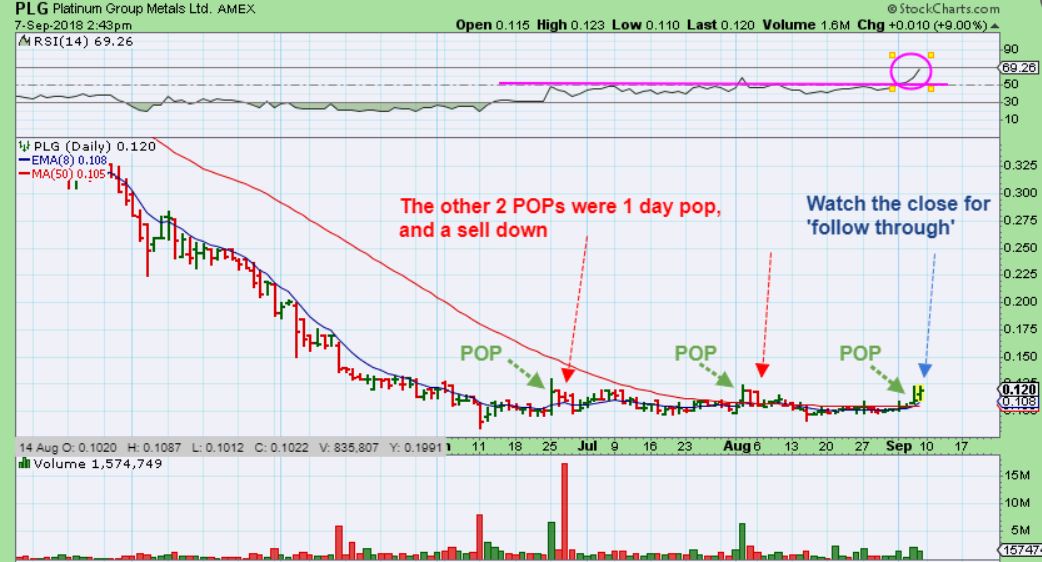
PLG – I am still in the PLG base and this is just an update that it may be finally ready to gain some upside. Prior Pops were 1 day wonders, this may have follow through.
PERSPECTIVES IN SHORT TERM & LONG TERM
.
The MJ stocks have been very exciting & rewarding, but I wanted to just point something out about the different perspectives. I am specifically discussing shirt term & long term…
.
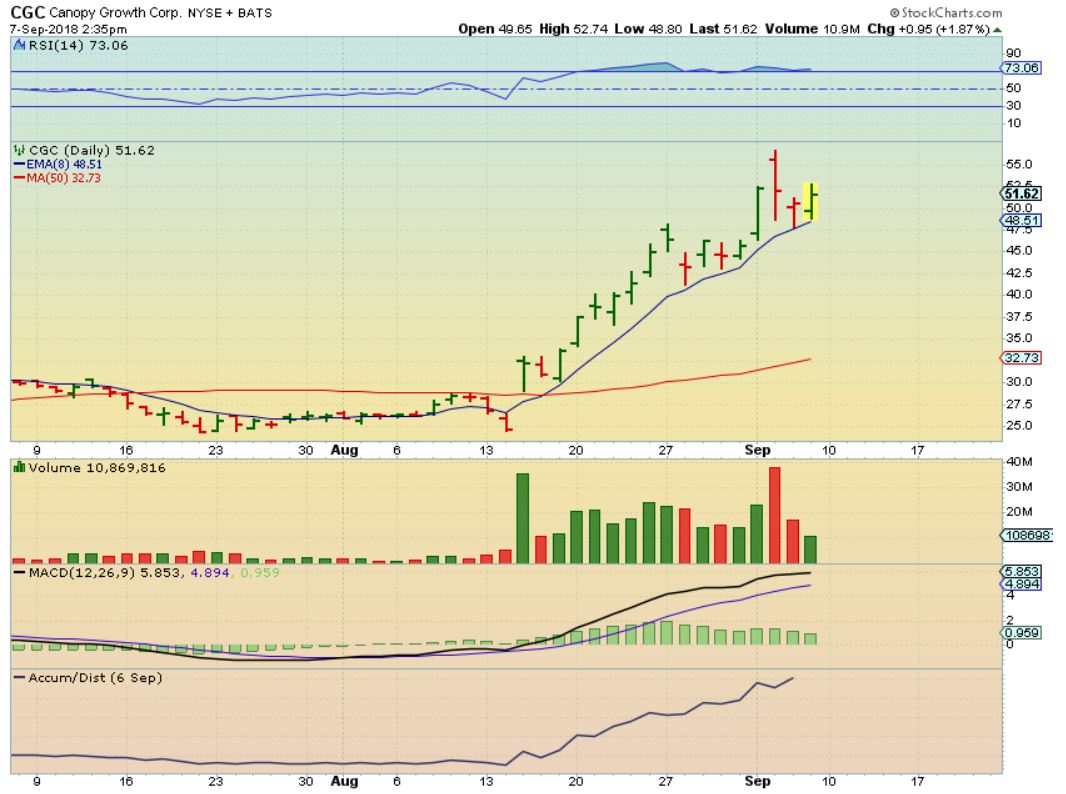
CGC DAILY – This has been very bullish and looks set up for another run higher. it COULD be bought at the 8 ema, but the next chart shows the danger…
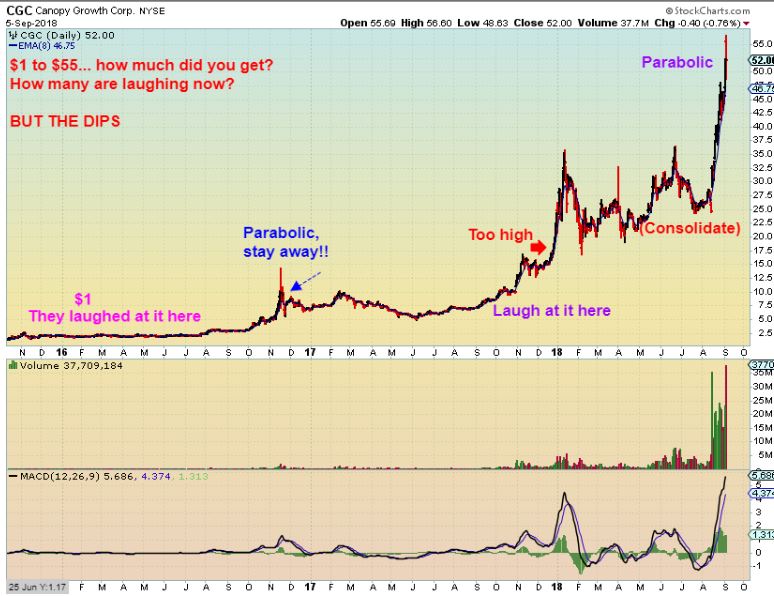
CGC WEEKLY – From a weekly perspective, CGC has really shot straight up. Moves like this exhaust eventually, and you can see from past parabolic runs, the drop can be sharp. I am showing this to admonish caution or the need for using stops. Also…
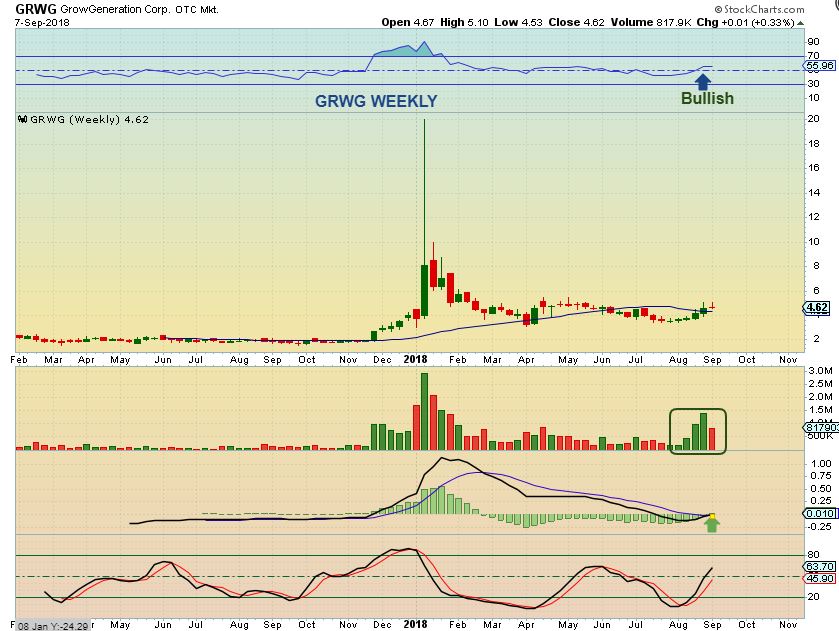
2 charts of GRWG– As some of these drop, they are not over extended, they remain near their bases, so they may be buying opportunities for as long as this sector remains bullish.
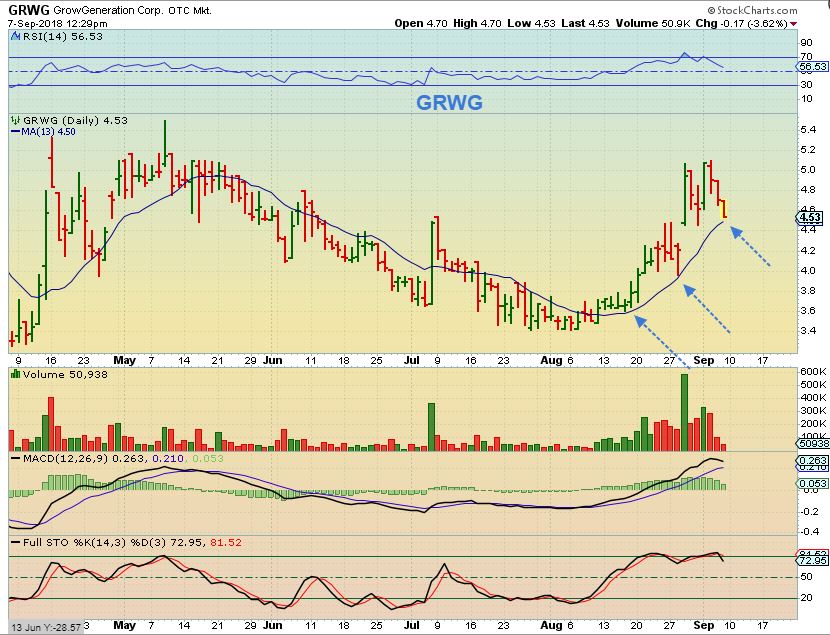
GRWG WEEKLY – You can see the base, and the potential, for as long as this sector remains hot. It has been quite heated up lately, and we’ve traded many with good results. I will continue to watch this sector if it remains bullish.
.
Perspective
.
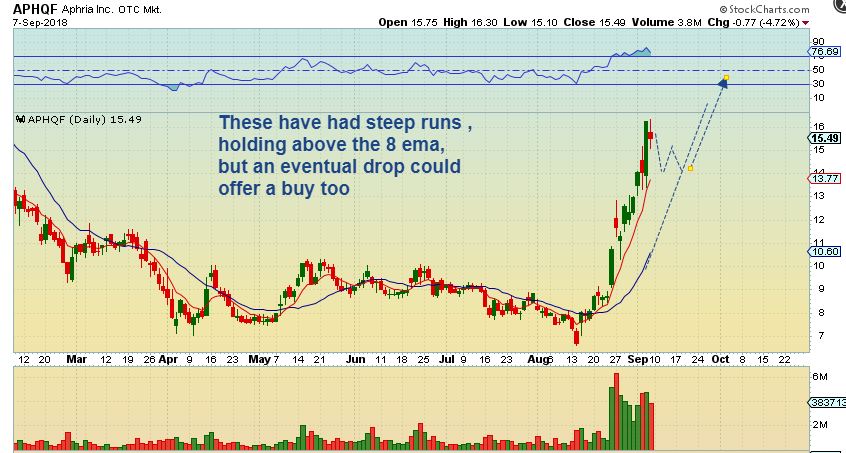
APHQF – So some of us bought APHQF near $8 and we have 100% gains. I have been expecting this type of move the whole time, if the sector remained bullish, however…
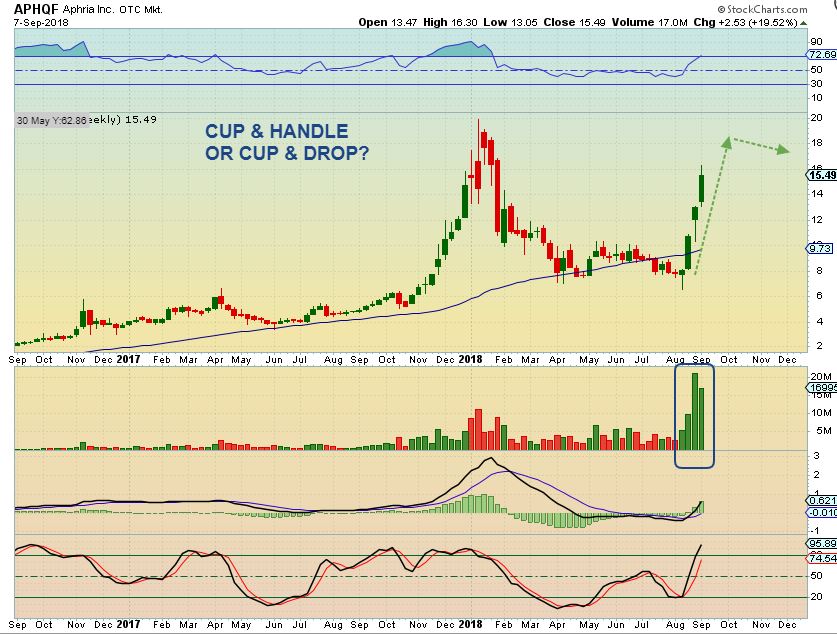
APHQF – When a stock gets this extended above the 50sma, it can drop back or go sideways untl the 50 catches up. My point? I would love to ride a full position from $8 to $20, but I have taken some profits just in case it pulls back. I mentioned that I sold some in the $11 area after the Gap higher & re-added on the gap rill, but now I have sold again on this rise just to lock in some gains. That said…
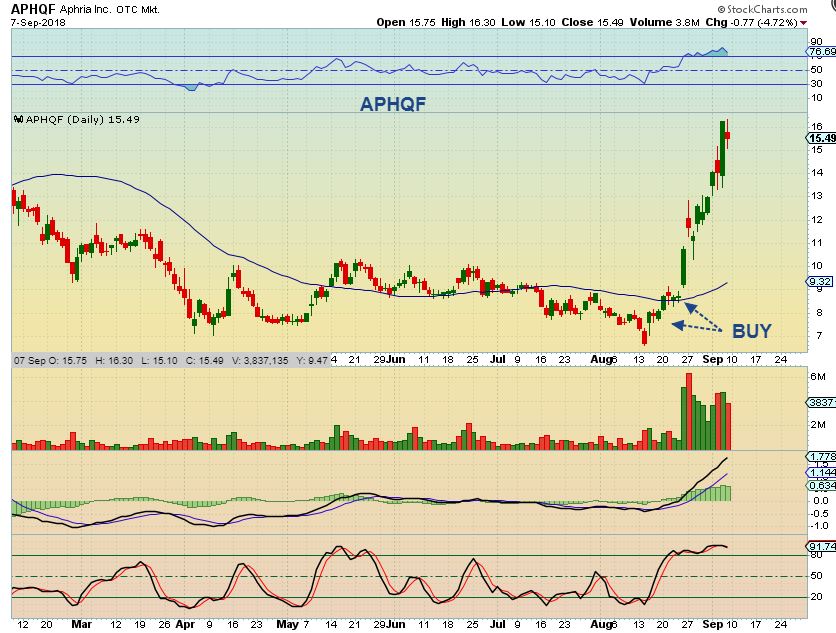
If this pulls back to $14 and reverses, or other forms of consolidation eventually present themselves, I may add again as these may continue their bullish rise. We’ll be adaptable.