Tuesday August 21 – Is It Possible?
Sometimes what seems to be impossible actually becomes possible, but a man rides in to town on Tuesday and leaves 2 days later on Tuesday? If that is possible, then I guess it is possible that Gold may have bottomed too. Oh, and by the way, his horse was named Tuesday. Let’s review our markets…
NOTE: FOMC Minutes will be released tomorrow, Wednesday AUG 22. That could affect various sectors, so we’ll have to wait and see if they discuss inflation or other concerns. It could drop Gold, It could cause Gold to surge, we’ll have to wait and see. Let’s just look at things and see where we stand as of right now.
.
It still looks like ‘Mixed Markets with our general Markets…
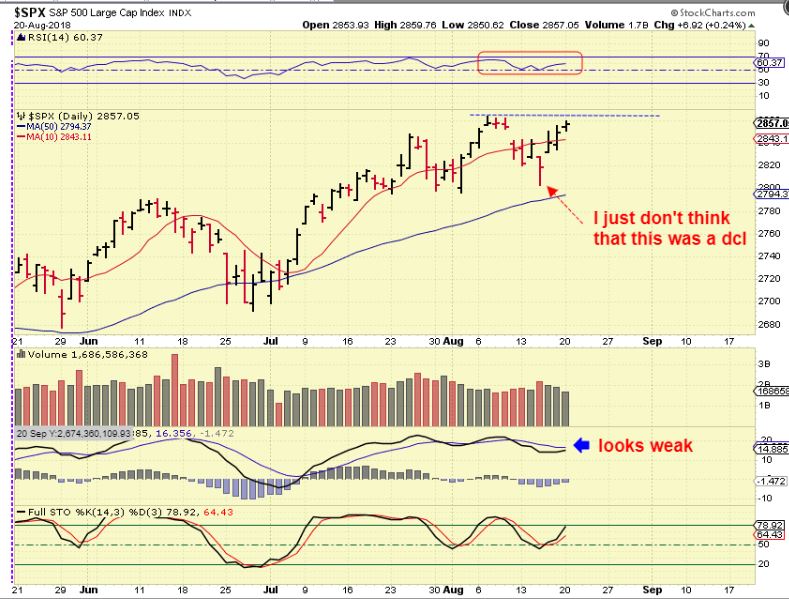
SPX – I don’t think that this was a DCL at this point. The MACD is losing momentum, the Relative Strength is slightly weaker, but the SPX is near the highs threatening to break out higher.
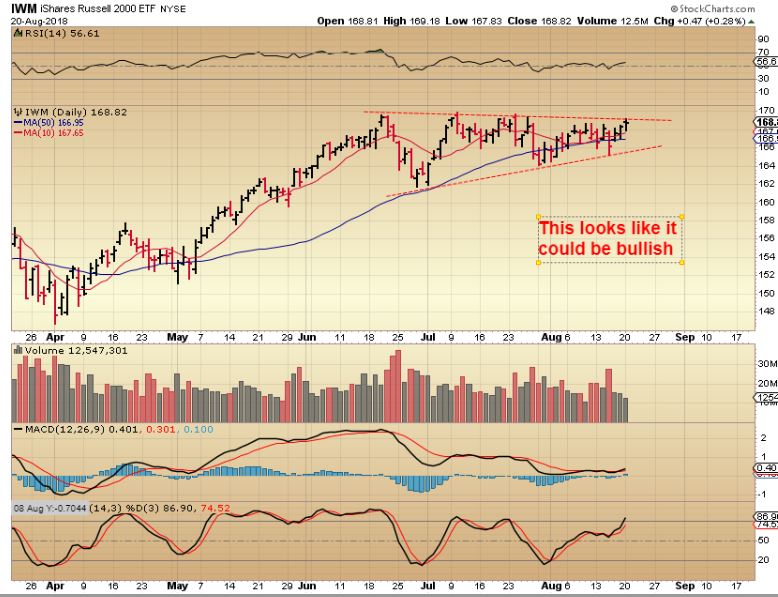
IWM – This does look more bullish than weak ( And the DJIA after the Walmart Pop, looks more bullish too). Mixed markets. ..
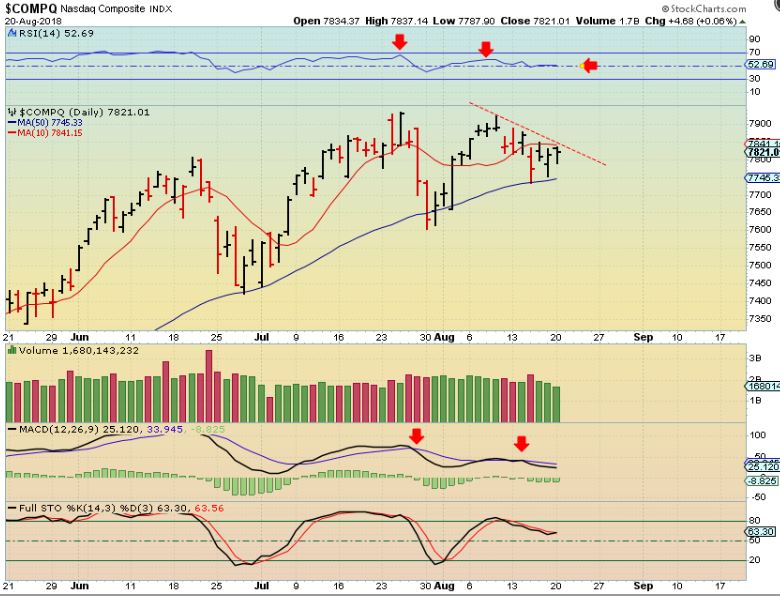
NASDAQ – The NAZ has not moved back toward the highs with a few Fang stocks losing their bite. The MACD seems to be losing momentum here too. That said, it is near the 50sma, it COULD be bought with a tight stop, it may be ready to break above the 10sma.
USD – The USD has formed a swing high on the Daily and Weekly chart. This doesn’t look outwardly bearish, it is at a support, or it could drop to the 50sma. We also want to keep in mind that…
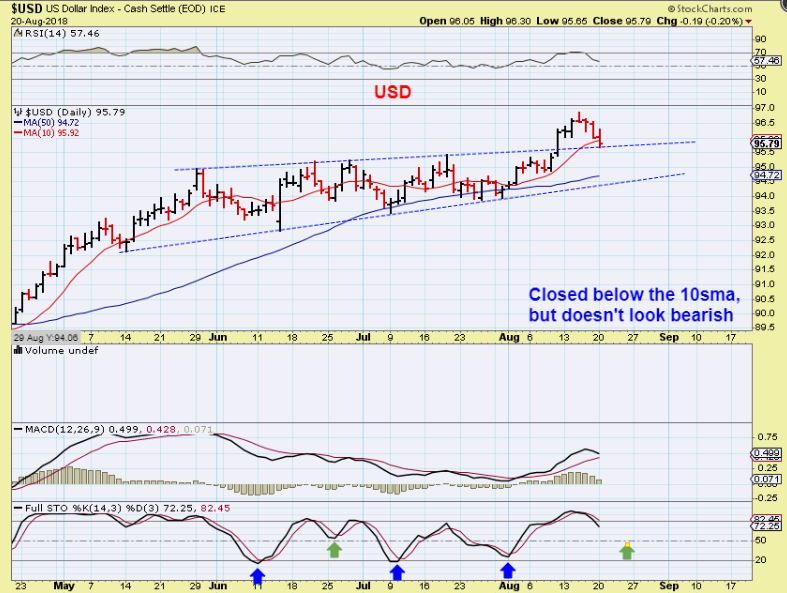
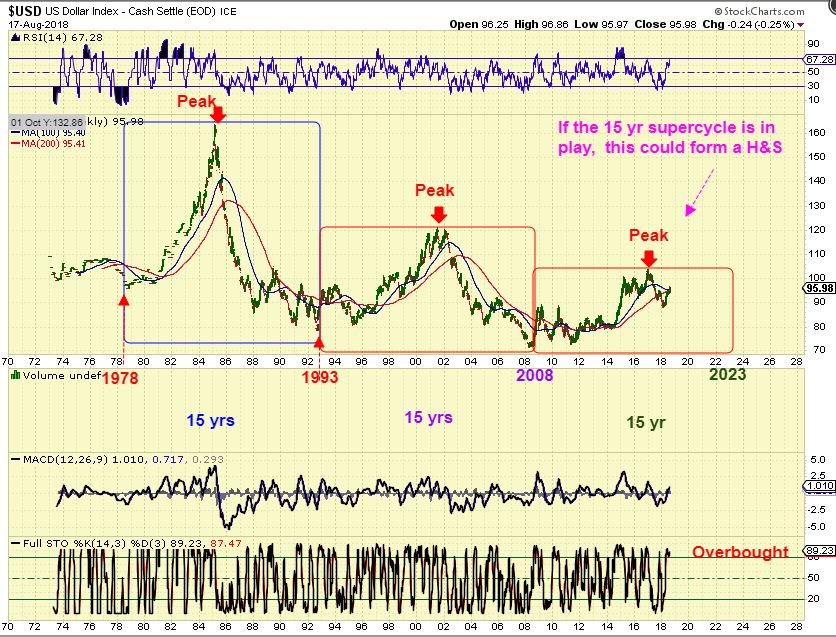
The USD 15 year cycle top was discussed in the weekend report. That top is in in place and the USD should seek out a low all the way forward to 2023.
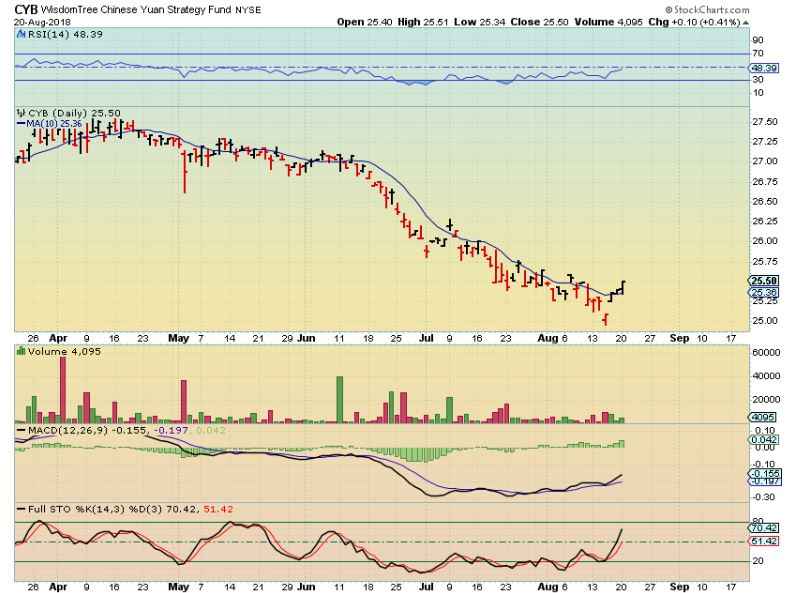
CYB – Volume on this chart is tiny, but I’m just watching price to see if it is coming out of a low. The YUAN and GOLD have been closely attached on this drop. We saw a nice pop above the 10sma on Monday.
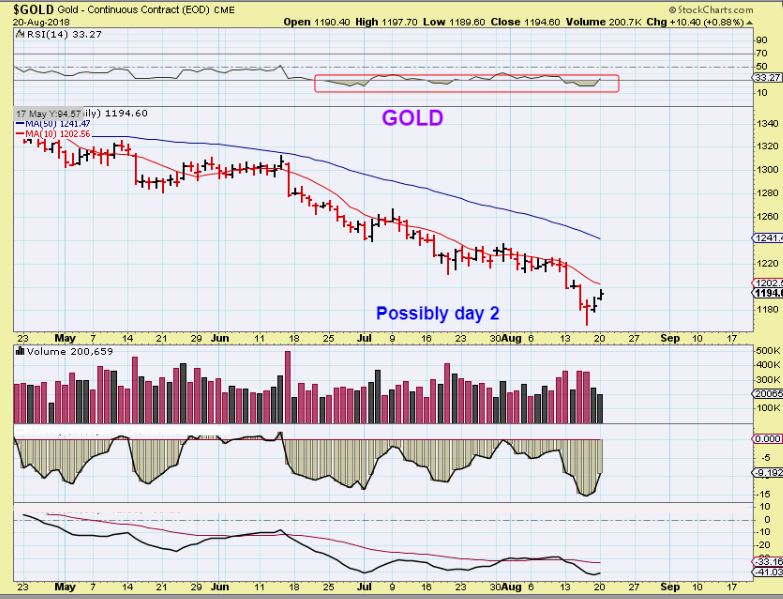
GOLD – Gold is approaching the 10sma, so we have a swing low, but it has not been confirmed as a strong confirmed swing low. THIS COULD BE DAY 2, with the FOMC Minutes being released on what could be day 4. The choice is yours…. 1. STAY SAFE & REMAIN PATIENT. 2. BUY WITH A TIGHT STOP AT THE LOWS, knowing that Prior lows like this gave way.
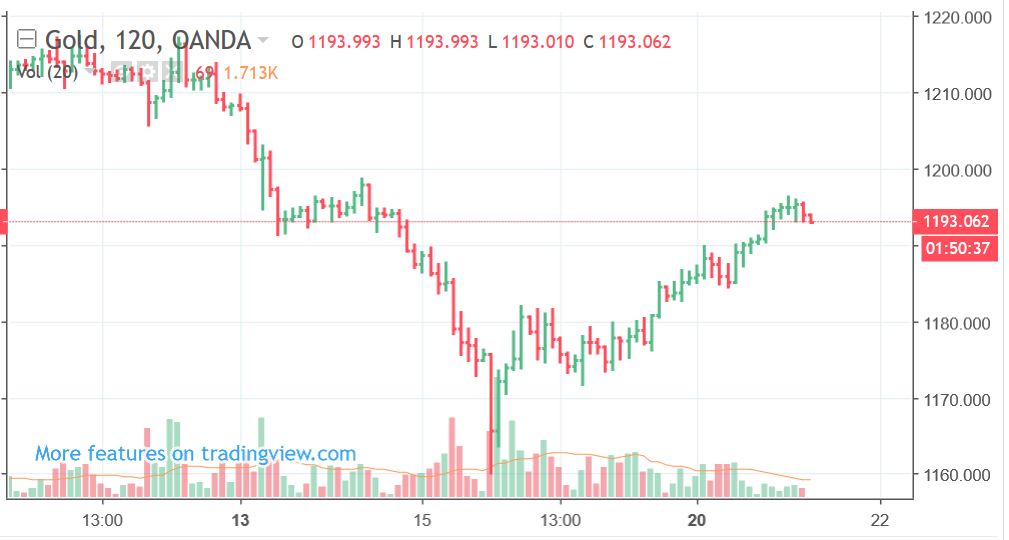
GOLD LIVE 7 a.m. Eastern Aug 21st– you can see that Gold has reached some resistance. IT may stall & even pull back or bounce around for a it ( Forming an inverse H&S?) .
GDX – Like Gold, we have a swing low unconfirmed here. You have the same choices – Buy with a TIGHT STOP, or be safe and wait for a close above the 10sma. Unfortunately, when the drop becomes so steep, it leaves that 10sma behind. (I want to explain that RSI2 trade, because some decided on their own to give it a try, because it has had such a high success rate).
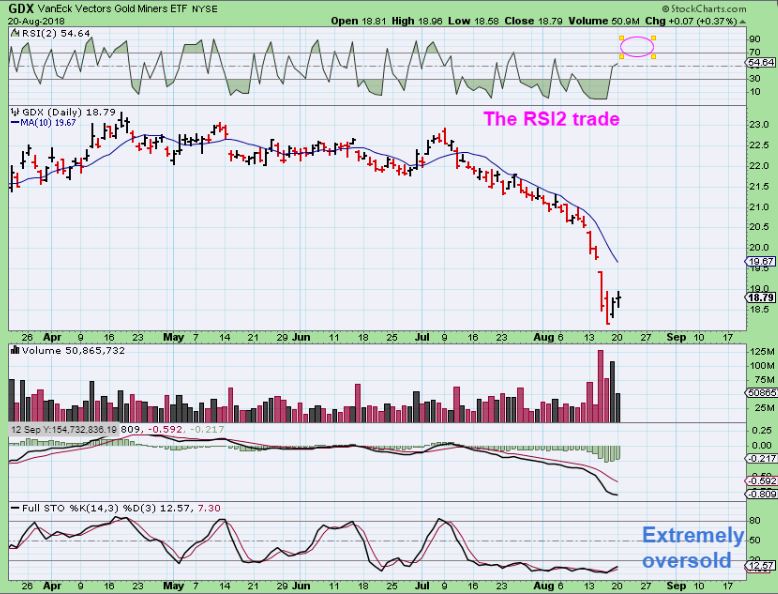
GDX – RSI2 is a ‘traders’ trade, but I have always taken that trade due to its’s success rate. It goes like this…
1. The RSI2 setting closes under 1% (Very rare) and you then buy it.
2. It can drop a bit more, but will usually reverse higher soon, as an extreme ‘exhaustion’ play 3. When the RSI2 eventually moves above 70 ( Most wait for a reading of 80 on the bounce) you should be profitable.
4. That is where the ‘trade set up’ ends, you Buy under 1%, sell when it bounces over 70 -80%.
5. But I personally have just used that RSI2 to help me find the bottom. In the past, I have just continued to hold my position and allowed it to play out with a stop.
BACK TO MY “ALL BOTTOMS DO NOT LOOK ALIKE”
If you have been here for years, you know that I always say that not all bottoms in the Gold or Precious Metals form or look alike. I am already getting emails saying, “Where is the strength?” & “This looks pathetically weak, dont you think?” So I will once again show you a variety of BOTTOMS, and please note that They are not always STRONG ON DAY 1 or 2.
GOLD –
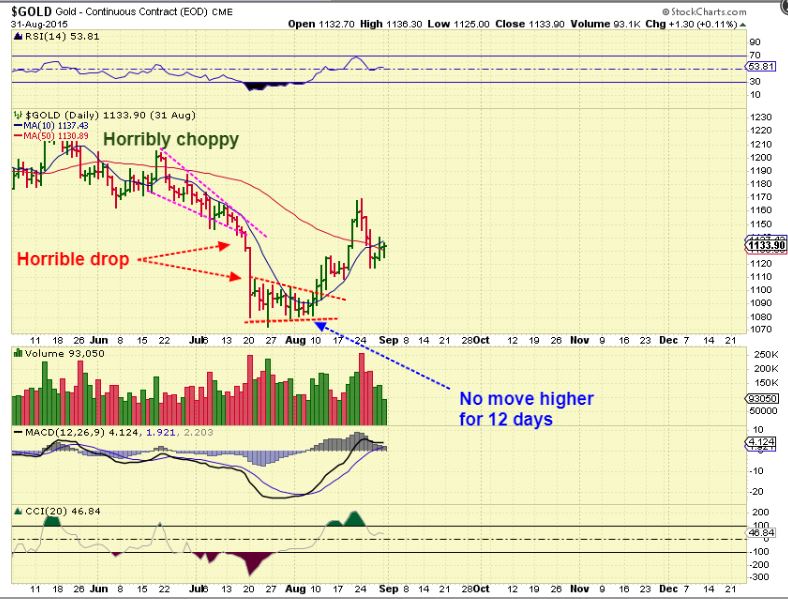
1. This sell off was similar to our current drop. It started as a slow sell off, day after day and then FLUSH!!
2. Then Look at the spike down bottom of JULY 27. That was final lows, however…
3. It then went sideways for 12 days! That is over 2 weeks. So on a possible day 2 when someone says, “Why does this look so weak?”, What can I say? It ran up $100 points at the end of the first daily cycle.
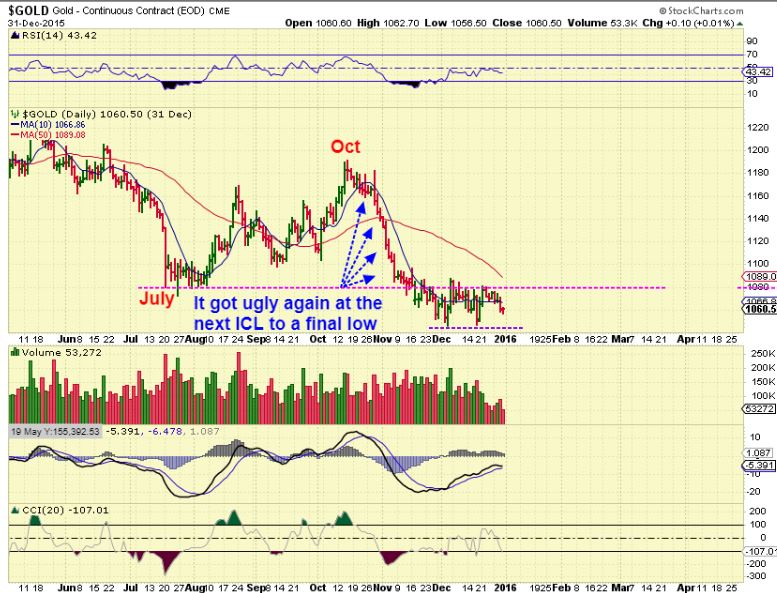
GOLD – That was not THE FINAL Lows of 2015 however. After a choppy 3 month run to a peak, it crashed into the well remembered Dec 2015 ICL. THAT LOW ALSO DID NOT TAKE OFF RIGHT AWAY. IT WENT SIDEWAYS FOR WEEKS.
.
Now I want to show you a normal bottom in GDXJ. It eventually took off higher, but look at it at the ICL (Lows).
.
GDXJ – ICL at the blue arrow.
Day 1 = GDXJ sold off red on day 1
Day 2 = Ran up & sold off into the close on day 2
Day 3 = Weak volume mini pop, still under the 10sma
Day 4, 5, 6 = It was not until day 4 that price started to stretch out as it finally moved above that 10sma, and allowed you to raise your stop. 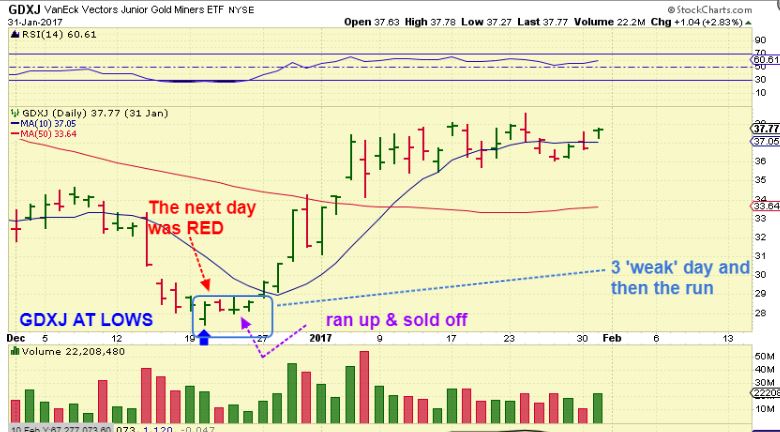
So these 3 chart above of ‘Bottoms’ are only a couple of MANY that I could show you that prove that at the ICL, it is NOT always a rip your face off rally higher from day 1 onward. We could be on day 2, but we are not above the 10sma yet and it is not ripping higher yet.
Sometimes you just have to allow the markets time to play out. If, as a trader, you are invested or decided to take a position, you also must use stops and accept that it could get a bit tricky. The lows may hold after the FOMC Minutes are released, or they could break down to new lows. The GDXJ chart showed that it was not until DAY 4 that the price crossed the 10sma, but waiting for that was not all that costly. GDXJ ran from $30 to almost $40 very quickly.
~ALEX
MJ POPPING
.
I mentioned in a recent report that the Medical Marijuana sector looked to be ‘setting up’, and I posted 2 stocks ( CRON & CGC). Let’s review.
,
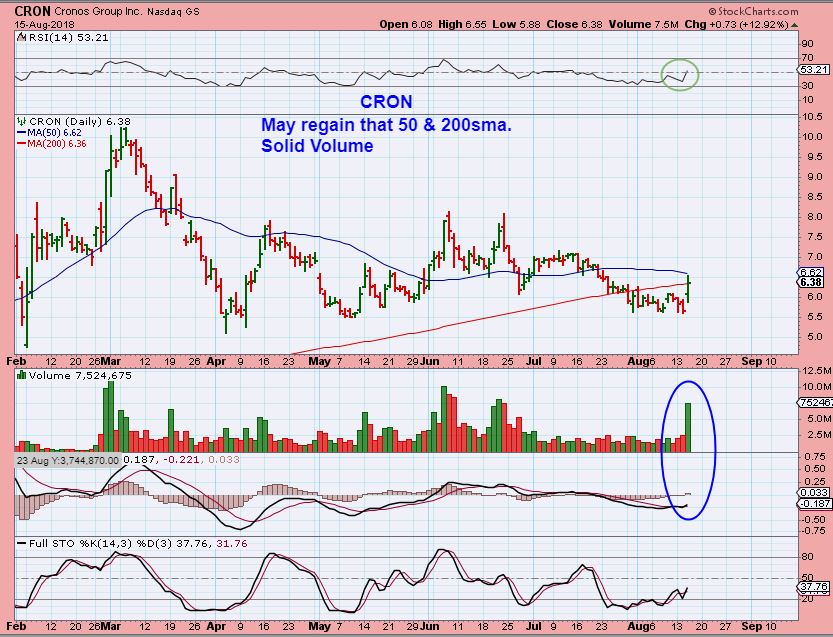
CRON AUGUST 14 – I mentioned CRON & CGC as bullish, and other Medical marijuana stocks as ‘setting up’. This was a possible Shake out, and it was on a support and a recovery could be bought. I mentioned that I bought CRON.
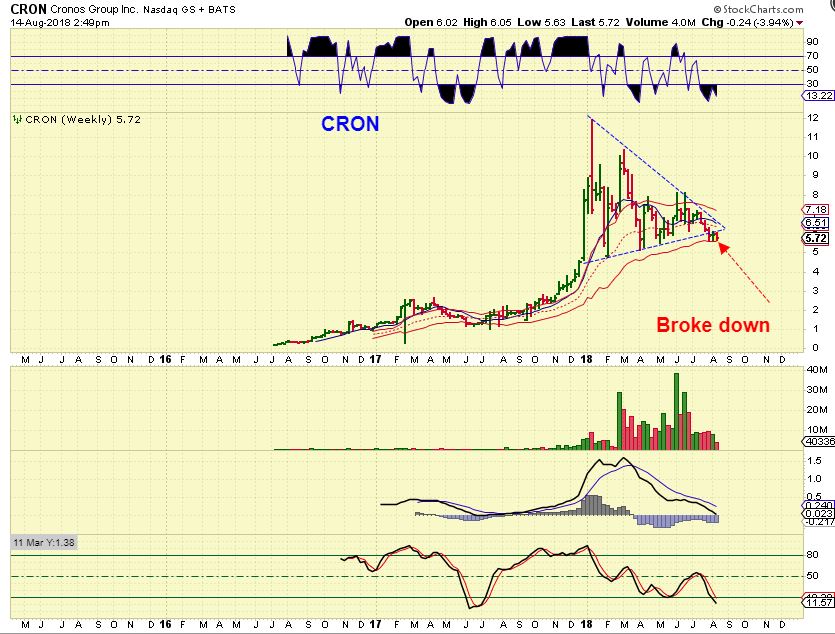
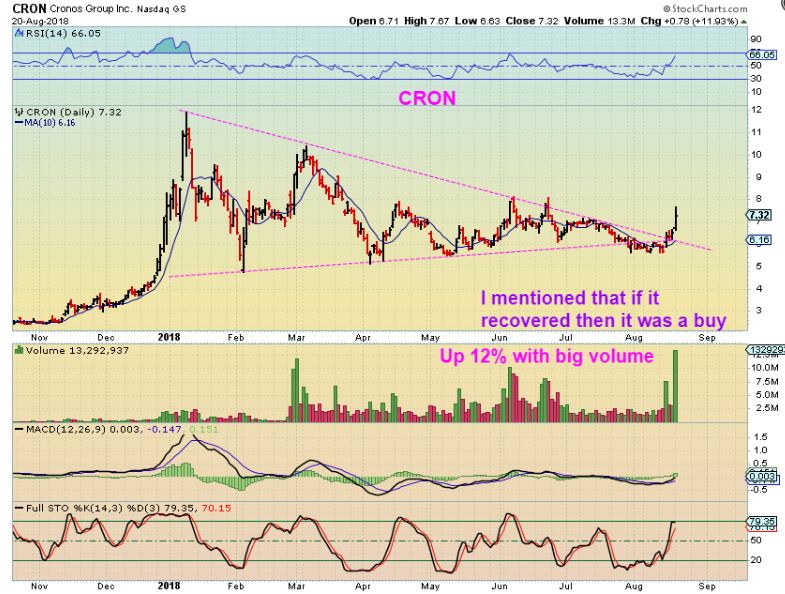
CRON 1 day later, it was recovering with volume.
CRON – After a 1 day pause it continued to break out, and you can see from the big picture chart that the potential on these is impressive. The run last Nov – January was massive and vertical.
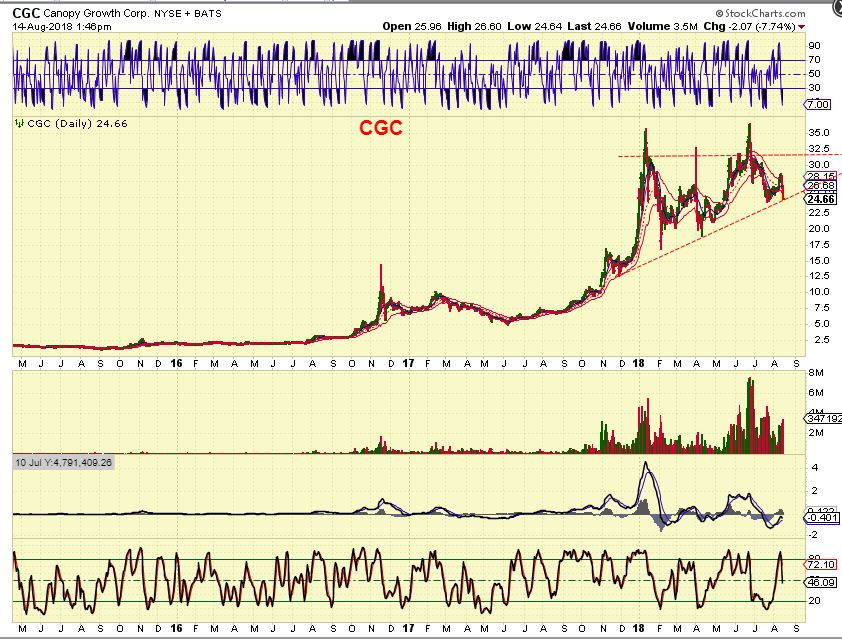
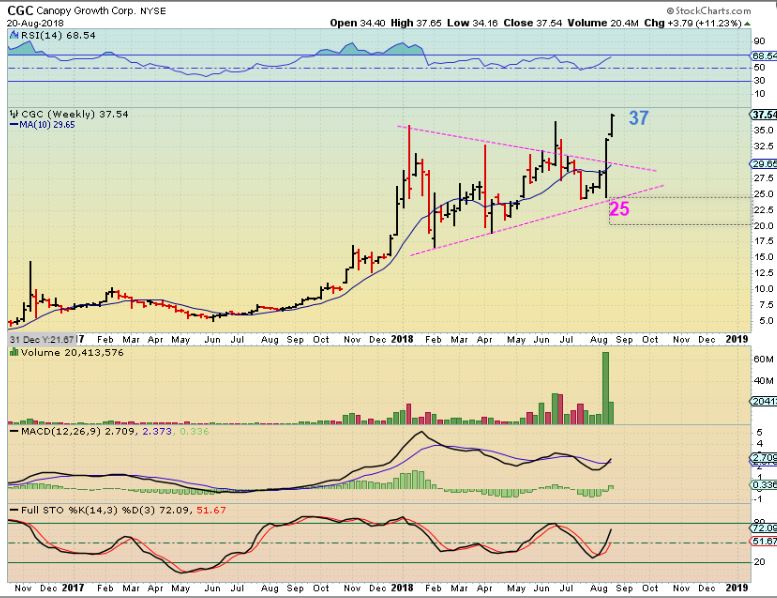
CGC – CGC was at $24.66 when I pointed out the pattern, and it was slammed down to the bottom of the Bullish rising wedge.
CGC – Now its $37? Impressive.
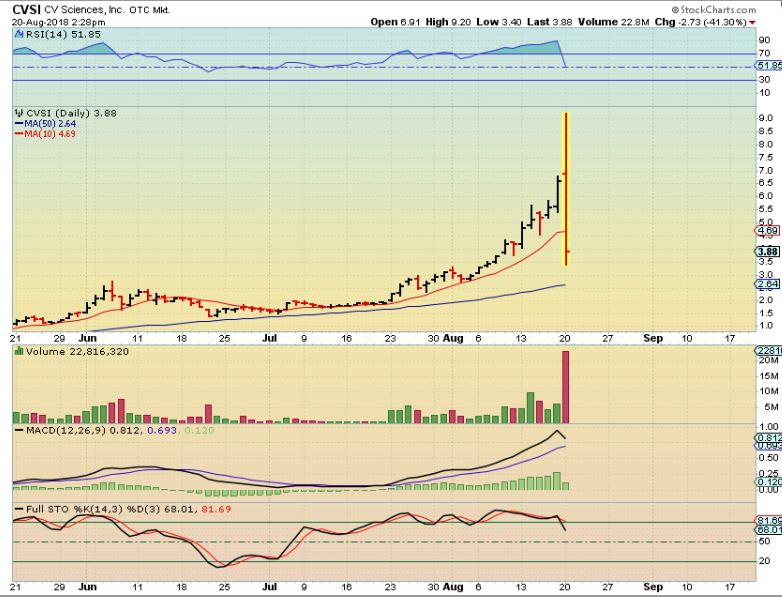
CVSI – This one was running strong, $1.50 to $9 yesterday, and then a negative report was released to bring it rapidly down. It actually closed at $4.21, so this highlights the dangers of any individual stock really, they contain risk, so it is best to buy an ETF or build a small basket of the sector, and USE STOPS. If you can’t use a stop on an OTC stock, or watch it real time during trading hours, it may be best to stay out. (CRON & CGC are Listed, not OTC).
I bought this one near the open, because the sector was popping and the opening volume was Big.
APHQF – This was Breaking above the 50sma as of 3 p.m. It closed at $8.72, but you can see the potential that it has, based on the run at the end of last year. It ran from about $5 to $20 and we traded it here then too. ( I sold this one on a gap higher near $9 and missed the rest of the run).
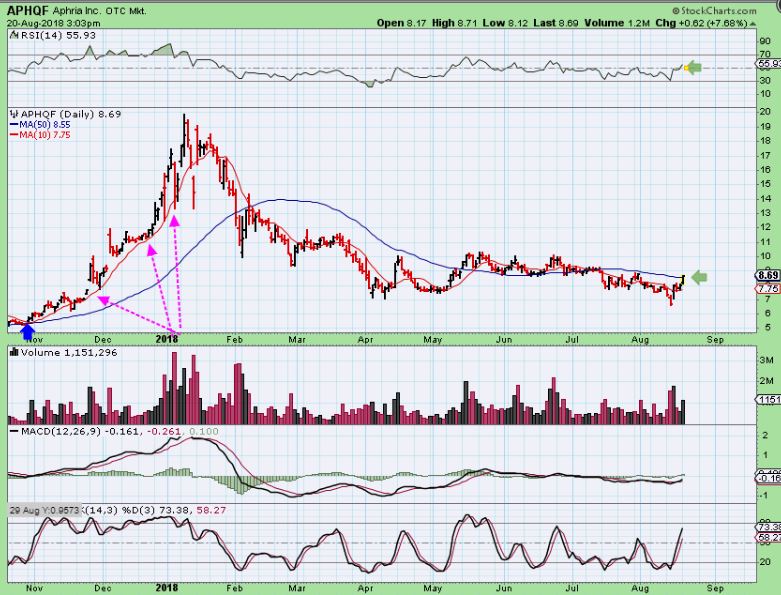
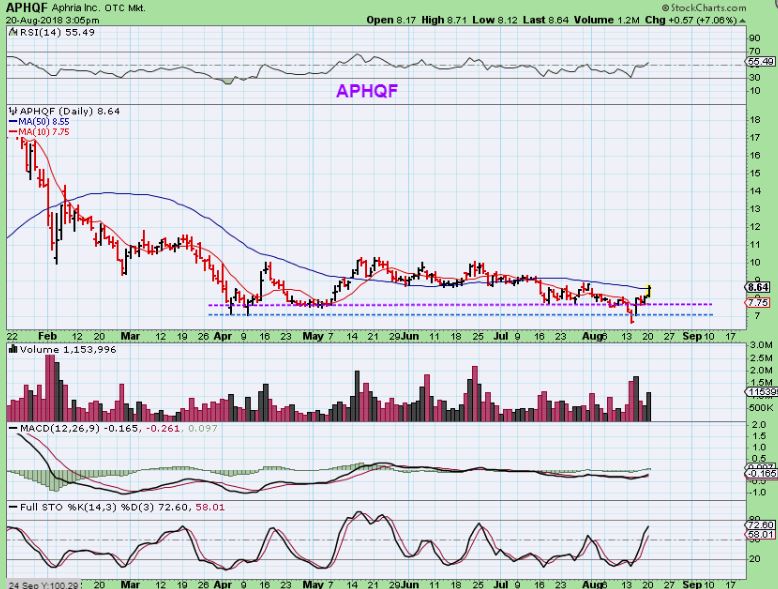
APHQF – This is a close up, and to me this was a nice base with a rising MACD.
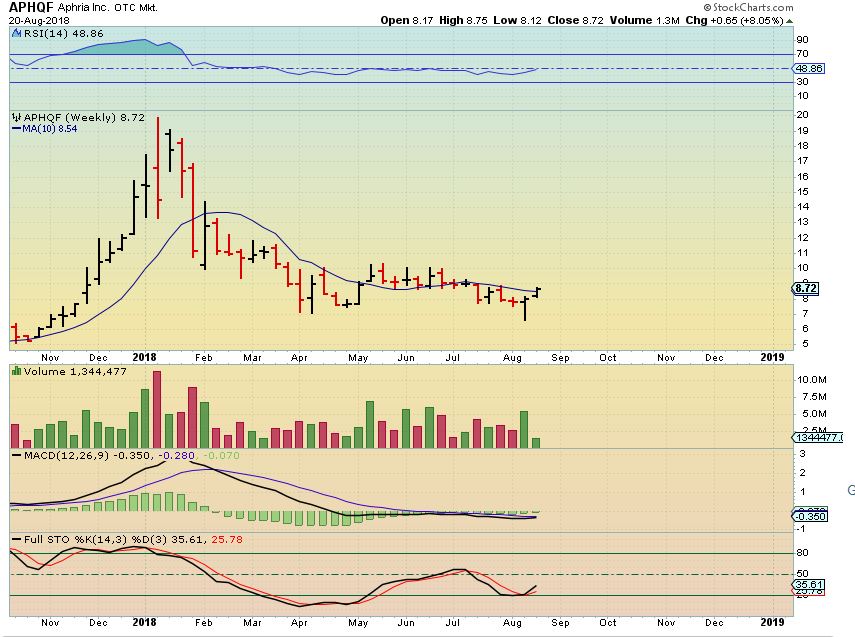
APHQF WEEKLY- near oversold.
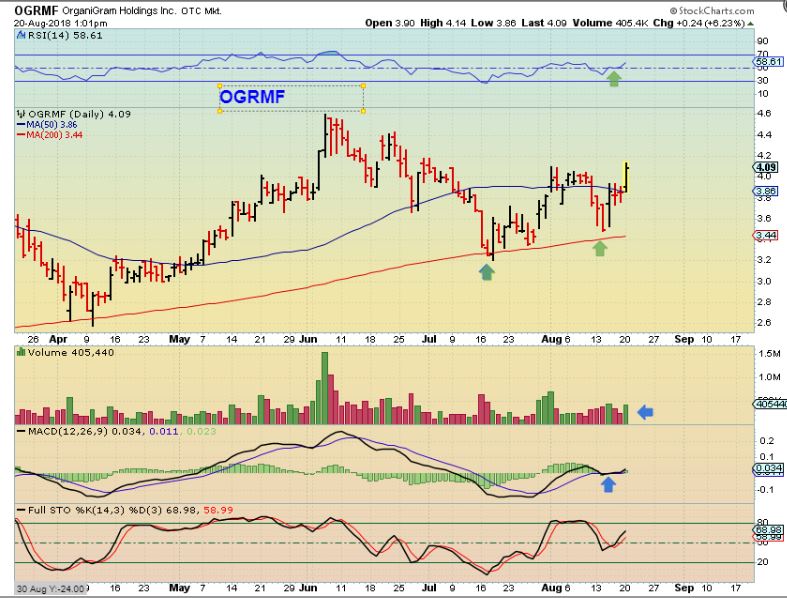
OGRMF – This bounced off of the 200sma, and has regained the 50sma. It is acting correctly and I think that it could be bought with a stop under the 50 ( or maybe 200ssma if you can take that kind of heat).
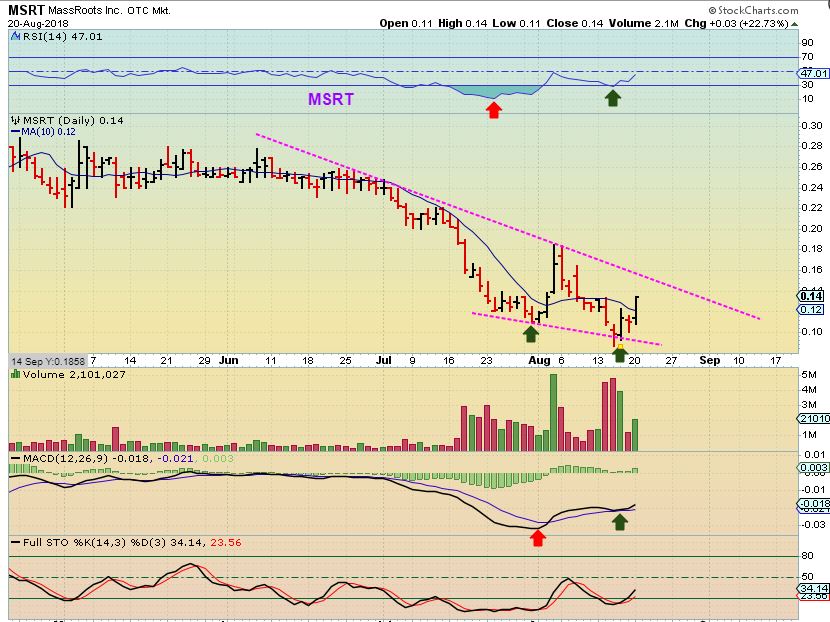
MSRT – This is crazy, I almost hate to post this, due to possible risk -an OTC stock at 14 cents, but I traded this last year and did very well, so I will post this with this reminder:
KNOW YOURSELF AS A TRADER. DO YOU AVOID RISK? AVOID THIS IF SO. Let me say, OBVIOUSLY a 14 cent OTC stock has MUCH risk, but this sector has had some unreal %-Gainers in the past. Reward: Last year this ran like a rocket ship. 11 cents to $1.17 in 2 months. Next chart…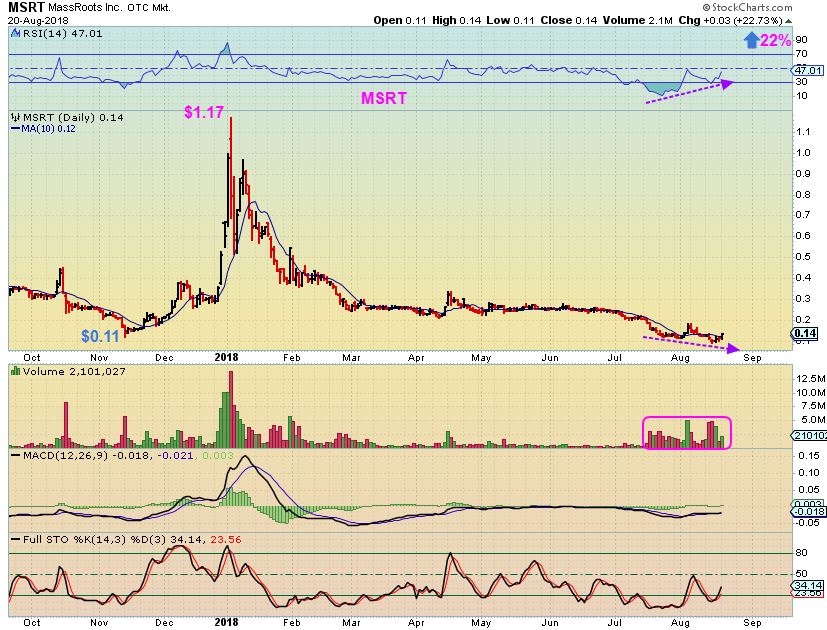
MSRT – Close up, the divergence is large. It is just moving out of the lows. If it broke out and simply ran to the former June highs, it is a 100% run. VERY RISKY/ Could be rewarding. I do not own this currently.