August 11 Weekend report – Think Happy Thoughts
PART 1
.
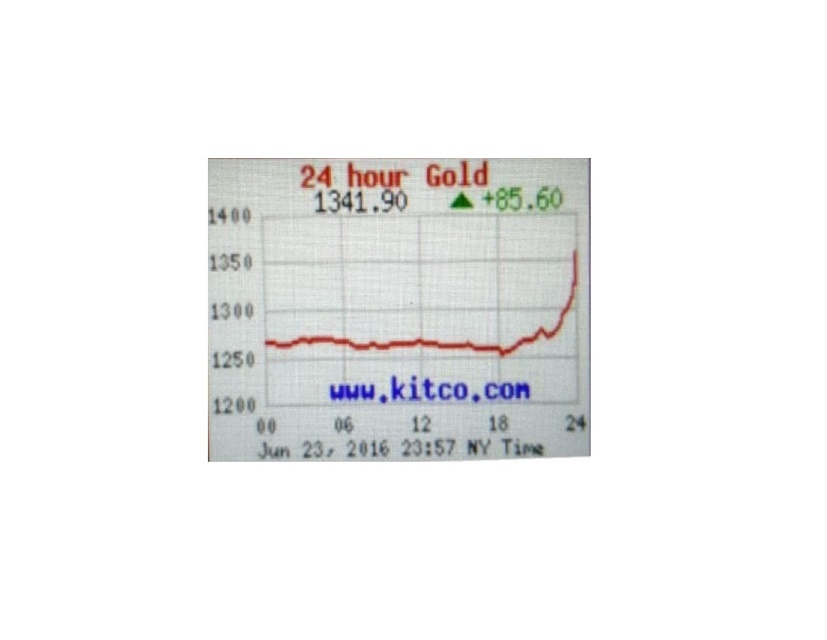
Yes, that Theme Picture is a real un-doctored Gold Chart that I captured ‘live’ one night at midnight as I was writing my report. In this report I wanted to show you some things that You may find quite interesting about that time period…
.
You may not even remember June 3, 2016 or June 23, 2016, when they actually should be very hard to forget. I want to tell you the story, so that you at least you know what possibilities do exist 🙂 I write my reports later at night, and Gold was slowly rising from $1250 one night when I started writing it. Well, it started ramping up and just kept going, rising up almost $90 to $1241.90, as captured by me in the Theme pic live late that night. It did NOT stop there. It actually jumped $109 points that day. Let me tell you a story …
.
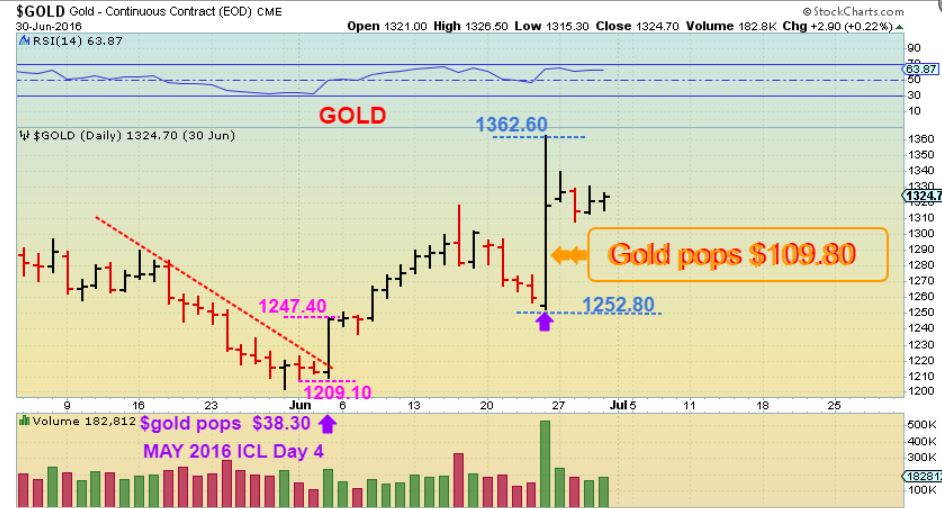
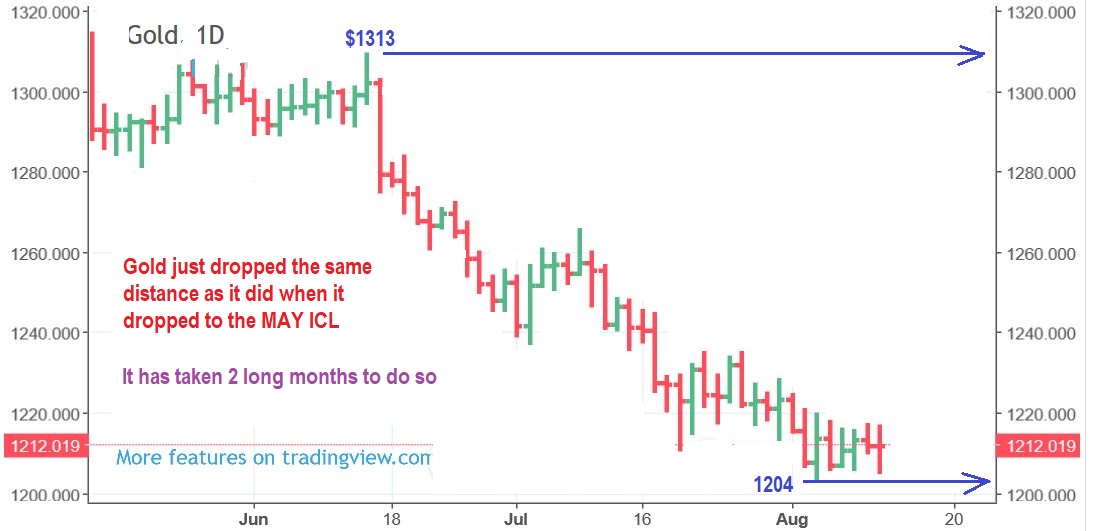
In May 2016, Gold sold off into an ICL. Interestingly, it dropped from $1310 to $1200, and you could say that from May 17th to the end of May it was all red, red, red, day after day. THAT KIND OF SELLING GETS TIRING 🙂 I say that because we just sold off from $1314 to $1204 too, almost the exact same amount (but we took 2 months to do so, VERY TIRING). Back to 2016, we had our ICL in place at the end of May, but it just went sideways for 2 days. On day 3, or 4 days after the lows were in place, Gold went Boom! It took off, rising up almost $40 in 1 day, and kept on going for 2 weeks. After a brief pull back, BOOOOOOOM! That Pop of $110 followed.
.
THIS IS GOLD NOW, and we also just sold off from $1313 to $1204, it has just taken longer. When the contract changed to December, this chart was altered a bit, so I will show the Spot Gold chart too, for accuracy. It shows the NEW low that Gold traded at when it hit $1204.
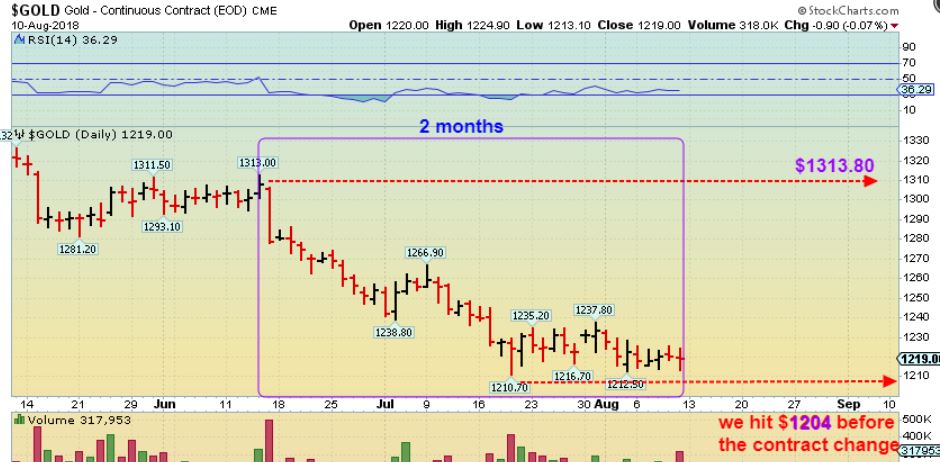
SPOT PRICE – 2016 took 1 month from 1300-1200, but this has taken 1.5 months
We will cover the General Markets, Oil, The USD, etc. next, but then I will have PART 2 of this discussion at the conclusion of this report. At that time, we’ll discuss the current set up in the Precious Metals sector. It is an important conclusion to this very interesting story. Enjoy 🙂
SPX DAILY – I’m expecting the markets to dip down soon, and I discussed that in detail in Friday mornings report. Friday the Markets gapped down.
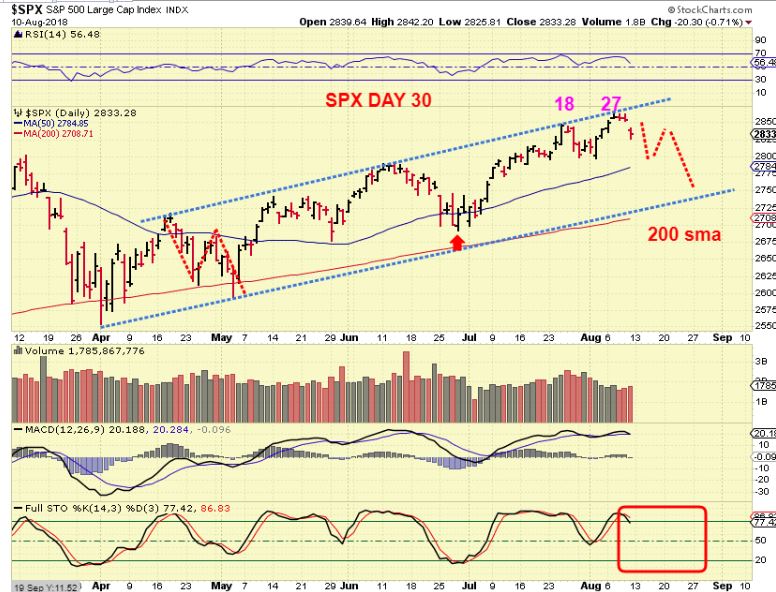
I will further discuss my expectations for a sell off in the daily reports…
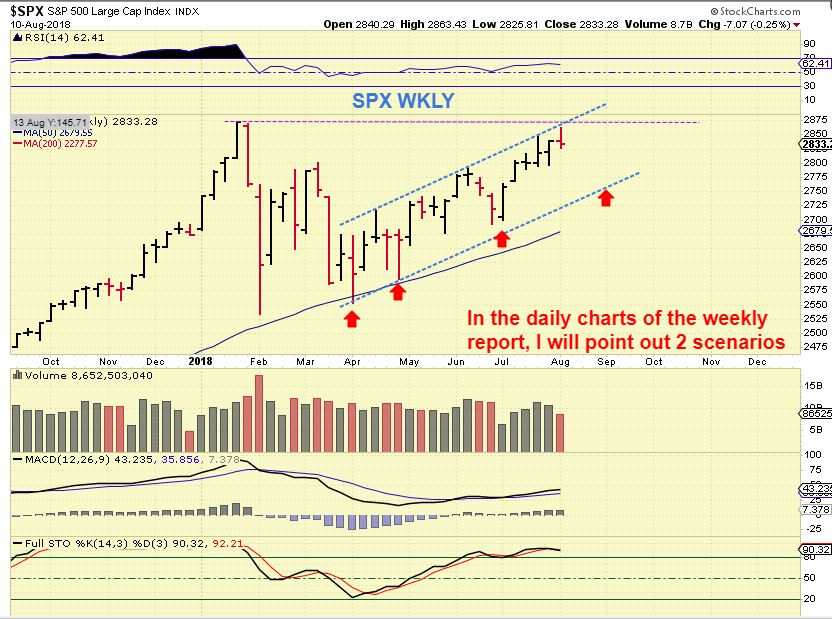
SPX WEEKLY – I also pointed out the resistance area that we find the SPX at. It can still bump along the upper trend line next week, but I am expecting a dip down into a dcl soon.
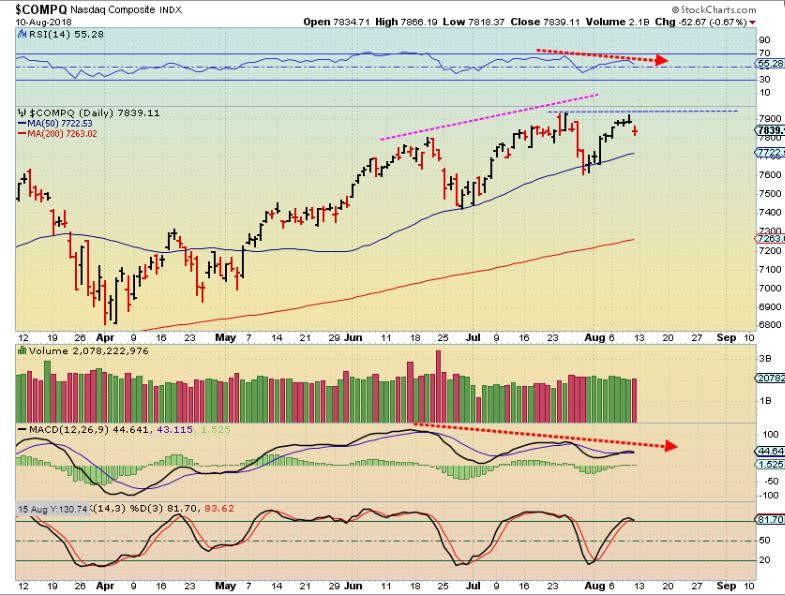
NASDAQ – The NASDAQ began to drop right on Que too, also gapping down Friday.
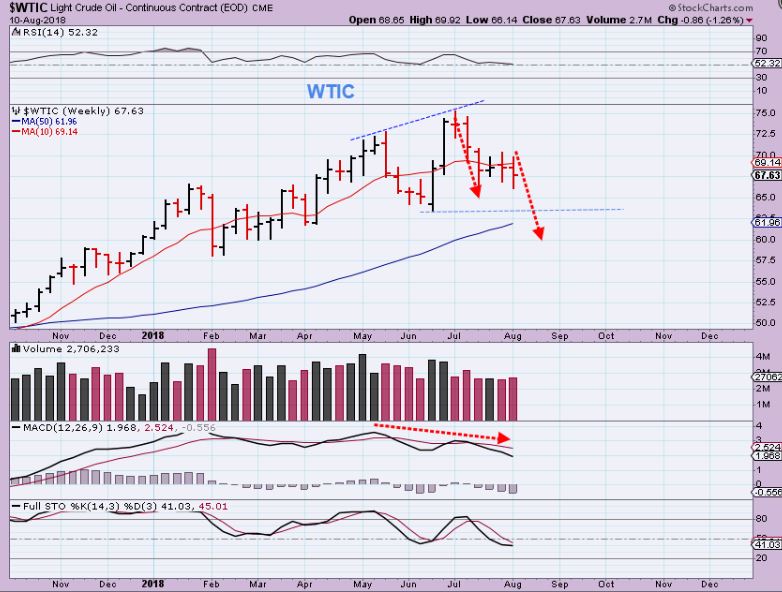
WTIC – I am still expecting more of a pullback in Oil too. I am expecting the low at the horizontal blue line to be taken out.
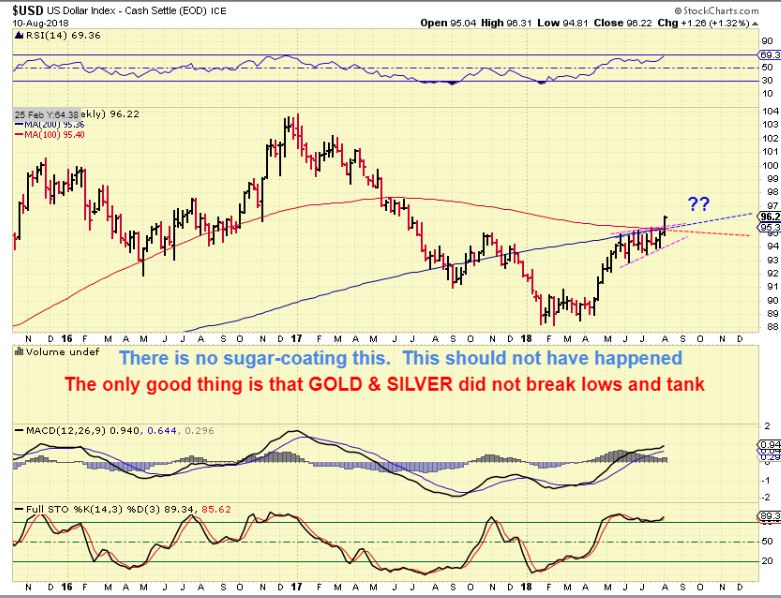
USD WEEKLY – Honestly, I did NOT expect the USD to get through this 200 weekly ma. I will discuss this more later in the report. The good news? Note that the USD broke sharply higher Friday, yet GOLD did NOT break the lows. THAT alone was encouraging. Please read the chart
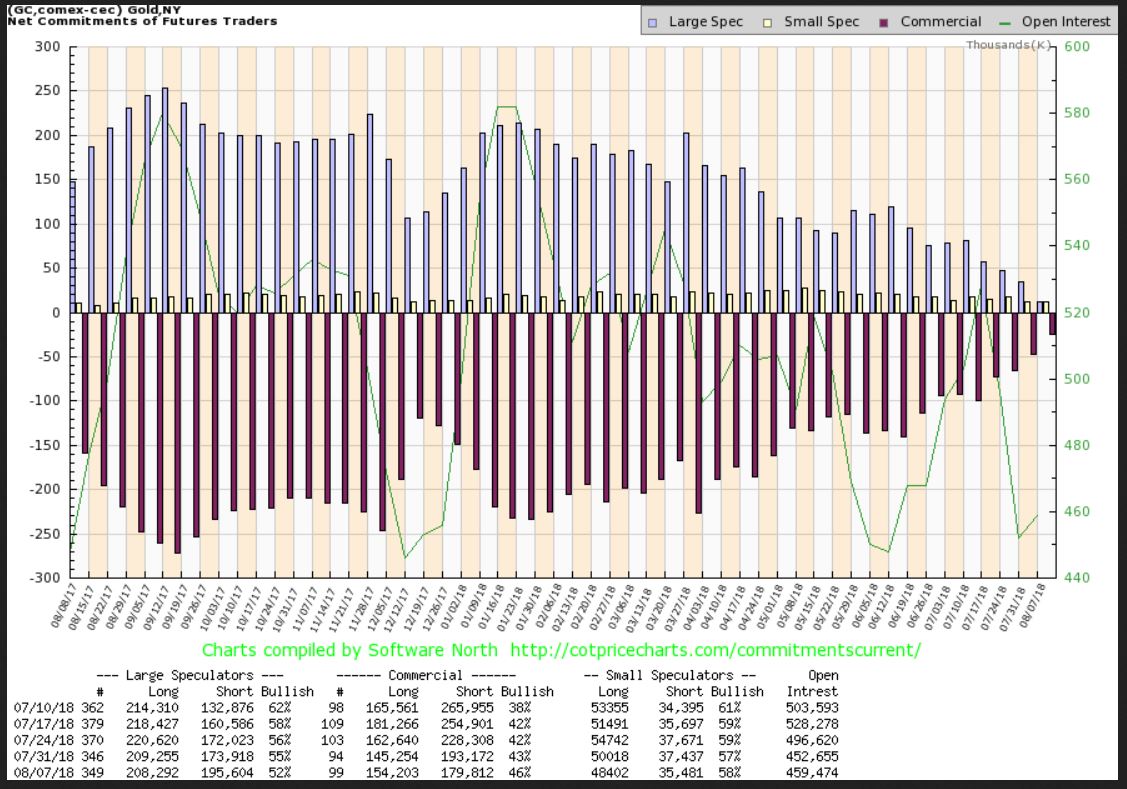
GOLD COT – This really just keeps getting more and more Bullish. Look at the Large & small Specs! This is a very bullish COT.
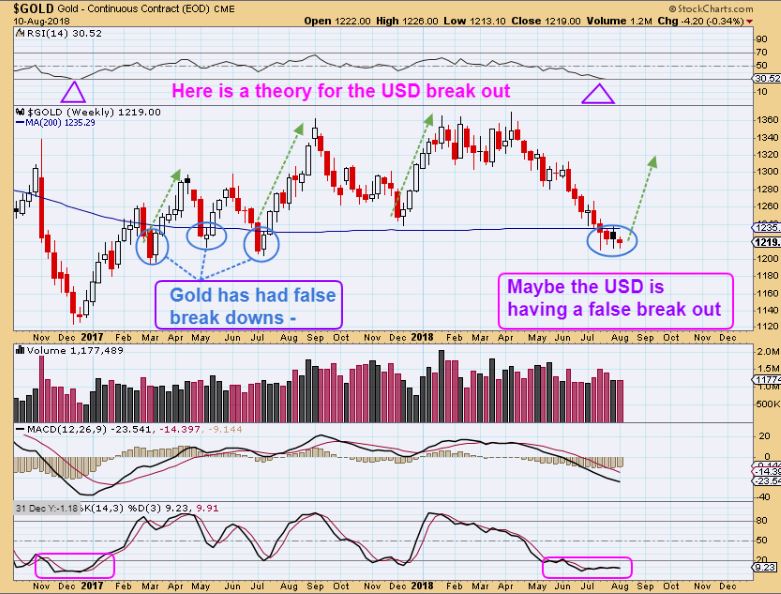
GOLD WEEKLY – Addressing that USD break out on Friday, Notice that Gold didn’t drop sharply Friday. Please read the chart for 1 theory on the USD break out above the 200 weekly ma. I’ll also point something else out later.
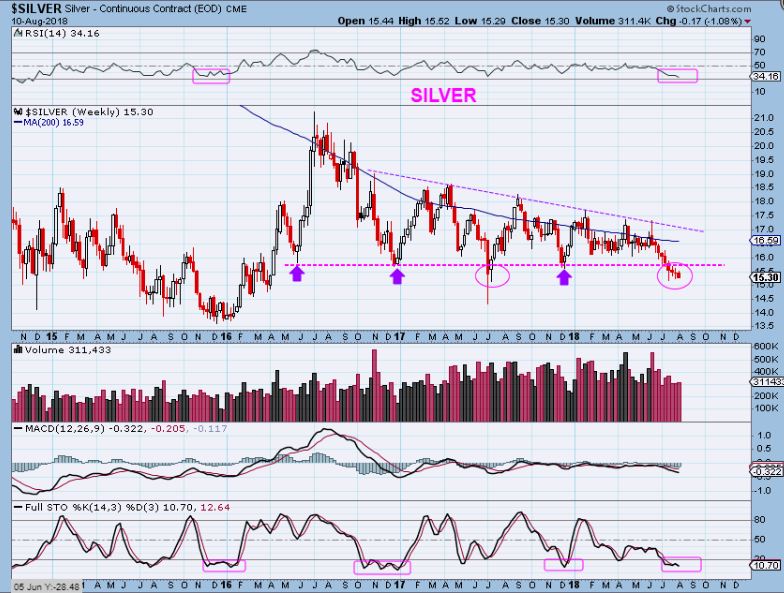
SILVER WEEKLY – Silver has broken down to what could be considered ‘shake out’ levels. A recovery is all that is needed to complete the shake out.
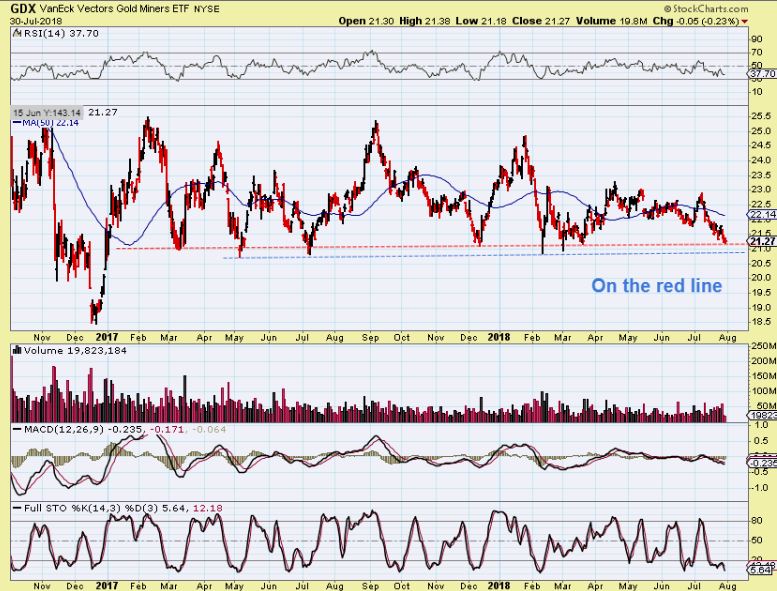
GDX July 30– We were thinking about the shake out that could happen below the blue line.
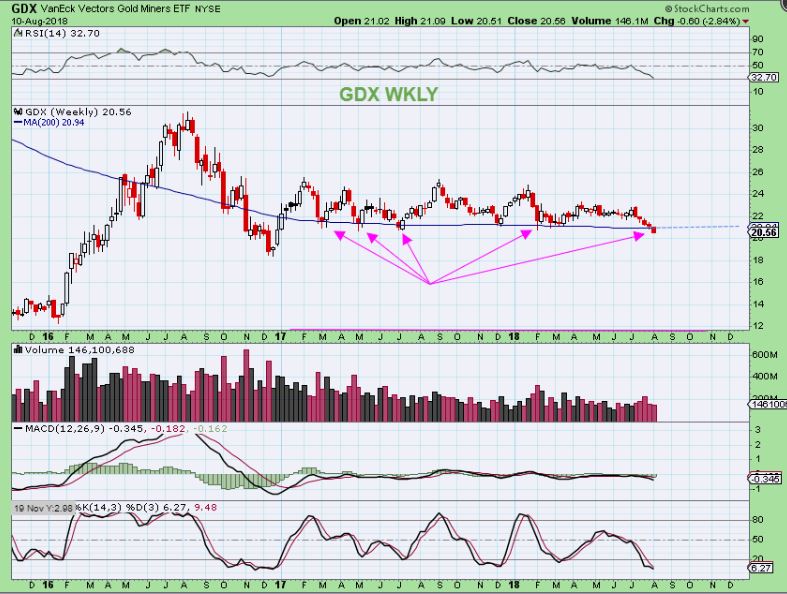
GDX WEEKLY – So we’ve been expecting this, but we didn’t get the reversal yet, we closed at the lows.
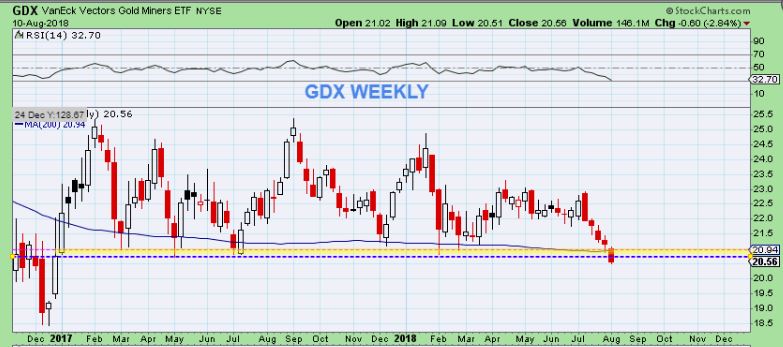
GDX AUG 1– I was discussing the 200 weekly MA as a possible shake out to come?
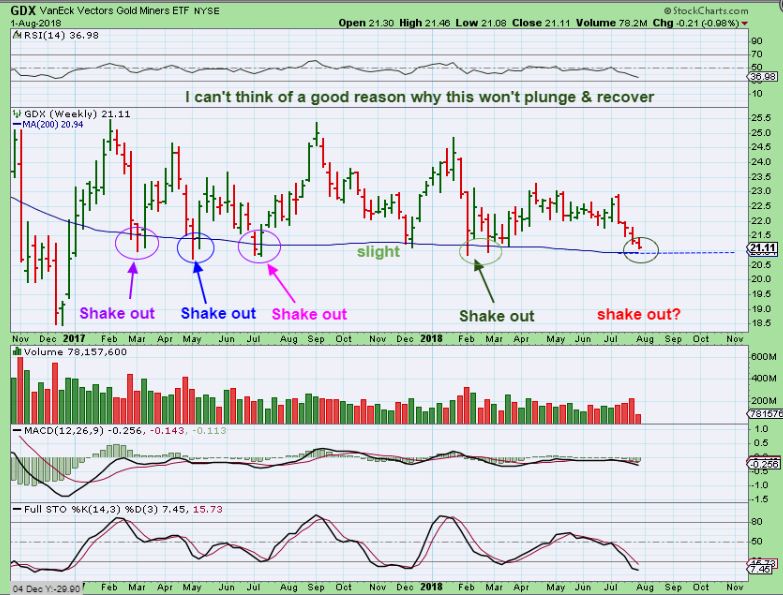
GDX WEEKLY – We are under that 200 weekly ma. Again, we need the reversal / recovery.
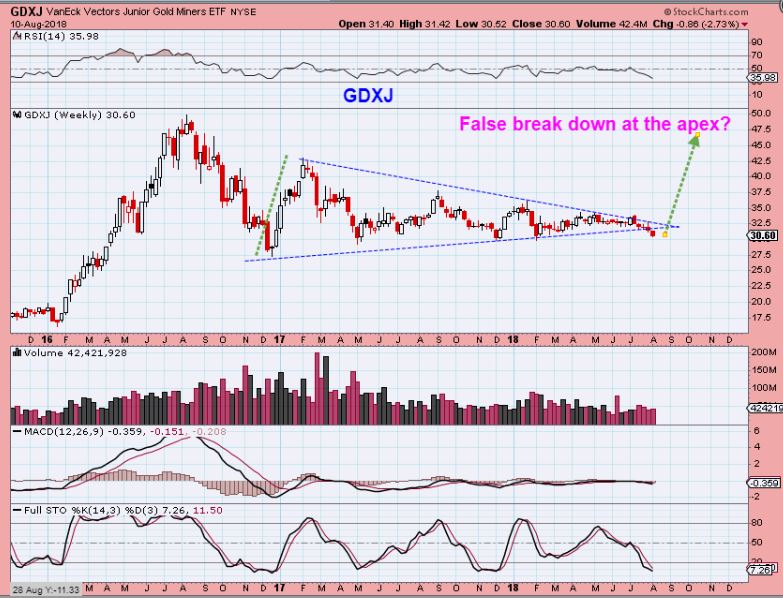
GDXJ WEEKLY – A shake out or false break down if we get the recovery.
Enjoy the rest of your weekend, and please read the last part of this report, which is the conclusion of the first part of this report. It is, in my opinion, the most important past of that 2016 story.
.
~ ALEX
.
DID GOLDS $109 RAMP UP TAKE PLACE DURING U.S. TRADING HOURS, SO YOU COULD GRACEFULLY ENTER POSITIONS? No!
.
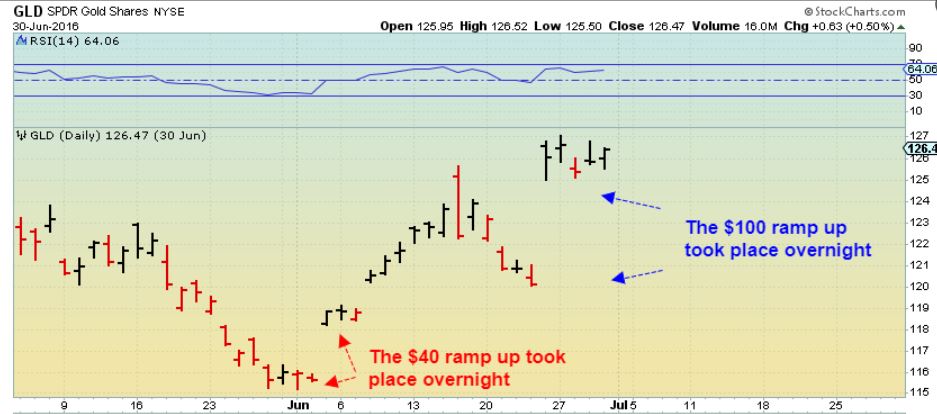
Please take note of something on this chart. The numbers along the bottom are time of day at 6 hour intervals. We go from Midnight (at 00) to 6 a.m. to 12 p.m. to 18 ( 6 p.m.) and 24 is Midnight. So by that you can see that AFTER 6 p.m., gold actually dropped and then slowly started to climb, but it was really after ‘After Hrs Trading’ ended that Gold really started to ramp up. By the morning GOLD was up $100. Who could Buy THAT? That was a lock out for the next run higher.
GLD – I want you to know that BOTH the $40 Ramp up and the $100+ Ramp Up out of a sell off took place overnight. You can see this on the GLD Gaps. I have lived & traded through these kinds of set ups for many years, so I never expect the ‘Buy’ to be all that easy.
I’m holding a few Miners now, just in case I’m writing my report at midnight Eastern time one day ( or we wake up) to find Gold has been taking off in the hours that the U.S. markets cannot trade. Some Miners like PAAS, AUY, SSRM, and others have already reported earnings and are holding up nicely. Others are holding support levels as well. These are the types that I think that you can hold, until we get our ICL lows in place. If I get stopped out ( Like I did with EXK for example) , I move on and find a healthier one with earnings behind them.
I know that at times it seems like Golds drop from $1313 to $1200 will never reverse. It has been a long slow 3 month drop from the highs of $1370 to $1204, but have I ever told l you of the time yrs ago when Gold dropped from $1310 to $1200 day after day after day and then popped up $40 at the ICL in 1 day? And then 4 weeks later, after a run higher & a pullback, it shot up over $100 in one overnight session? Gold jumped $110 in one night? You probably wouldn’t even believe me if I told you. 🙂
.
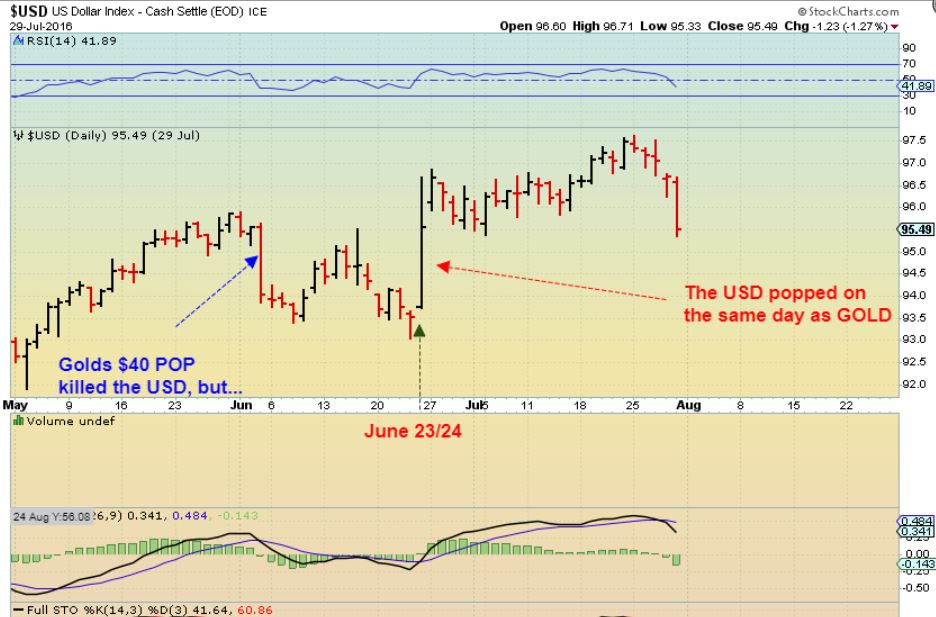
SIDENOTE: USD ODDITY – The June 3 $40 POP in Gold saw the USD drop sharply, However, The $100 POP in Gold saw the USD pop too. ‘Anything can happen?’, so the USD breaking out right now above the 200 weekly ma did not affect Gold and may not amount to anything anyway.