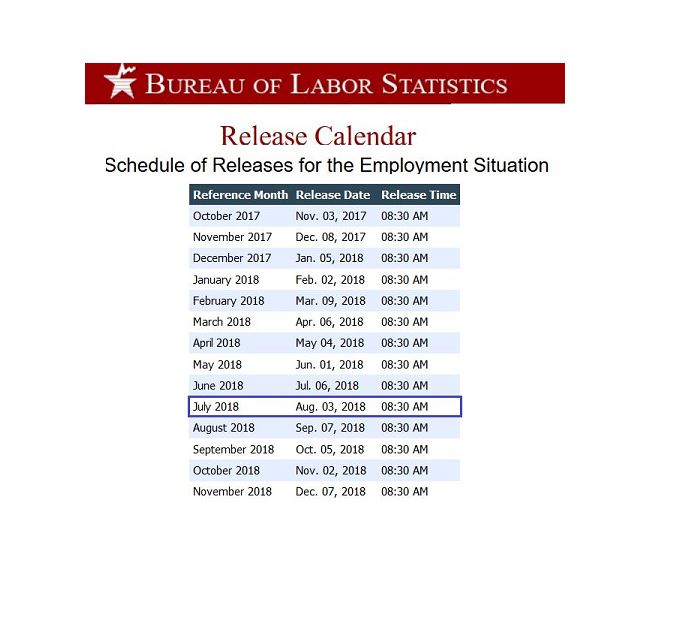
Friday August 3rd – The Employment Report
I don’t expect any big surprises with the July Employment report , scheduled to be released at 8:30 a.m. Eastern Time. It shouldn’t really affect things, but since that is the next event on deck, we’ll just have to wait and see if it does or doesn’t affect our markets. Let’s take a look at Thursdays action, shall we? We have A LOT to discuss…
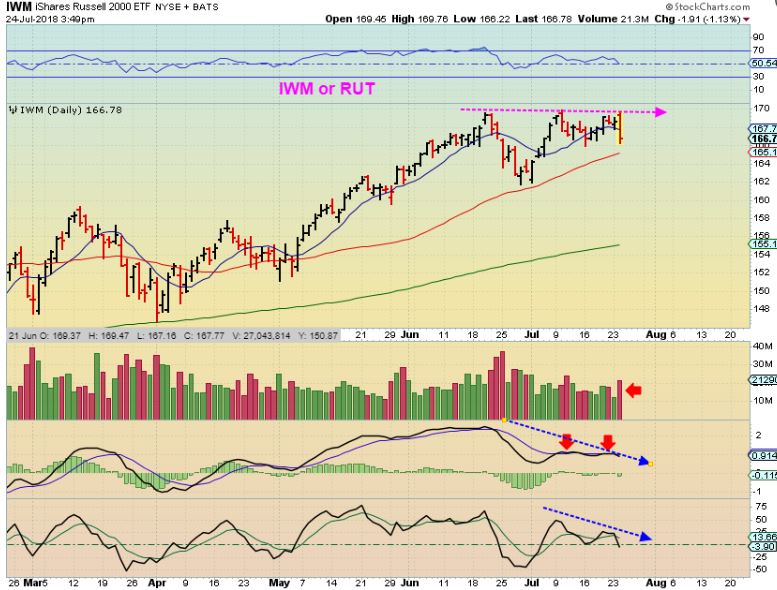
IWM From July 24 – I have been looking for a dip into a dcl, and so we would expect a top of some sort to form. The IWM started us off looking weak . Notice how the Weak MACD & High volume drop makes the IWM, a former leader, look weak That 50sma did NOT look like it would act as support and it didn’t. Price broke below the 50sma…
IWM COPY/PASTE FROM YESTERDAYS REPORT – I thought that the ‘pattern was bullish, but indicators remained weak”. It looked like it could bounce though, as the markets have become oversold. You can read my thoughts from yesterday.
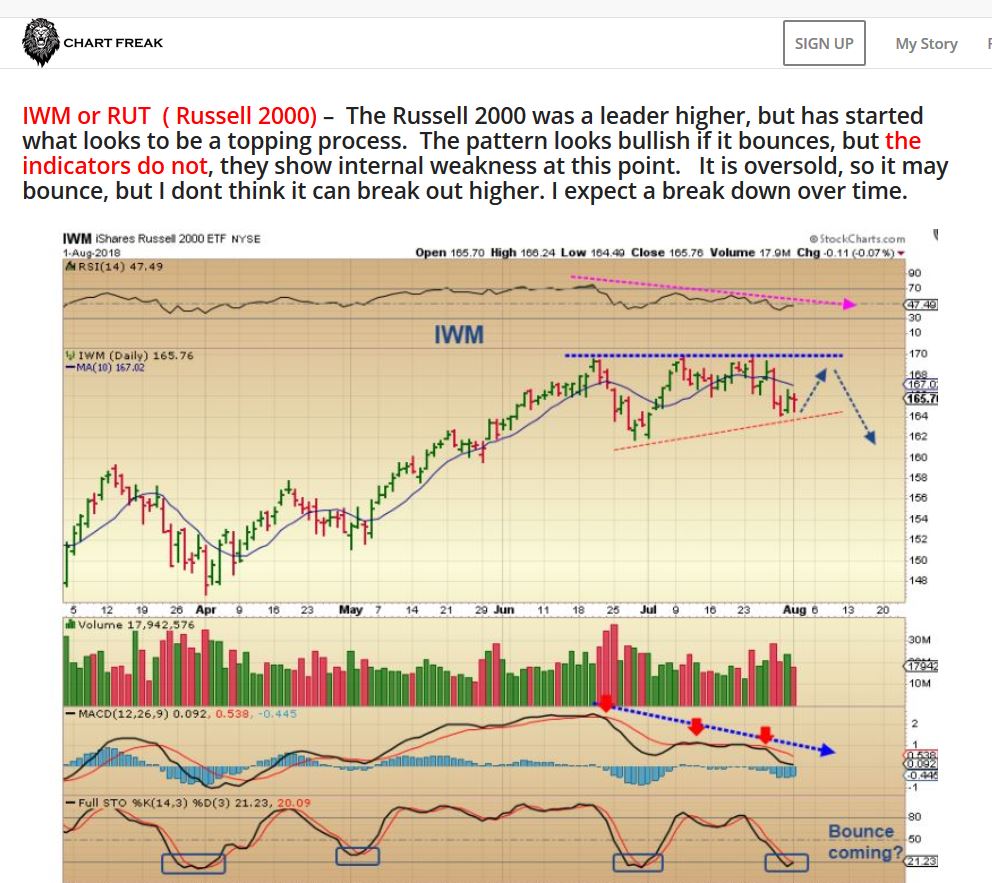
IWM CURRENTLY– The 50sma did not hold, but the bounce did come Thursday and Price did regain the 50 sma. The bounce actually looks bullish, but indicators still do not. That makes this “Iffy”. Any reversal like this ( regaining support) can be bought with a tight stop, just in case these markets break out higher.
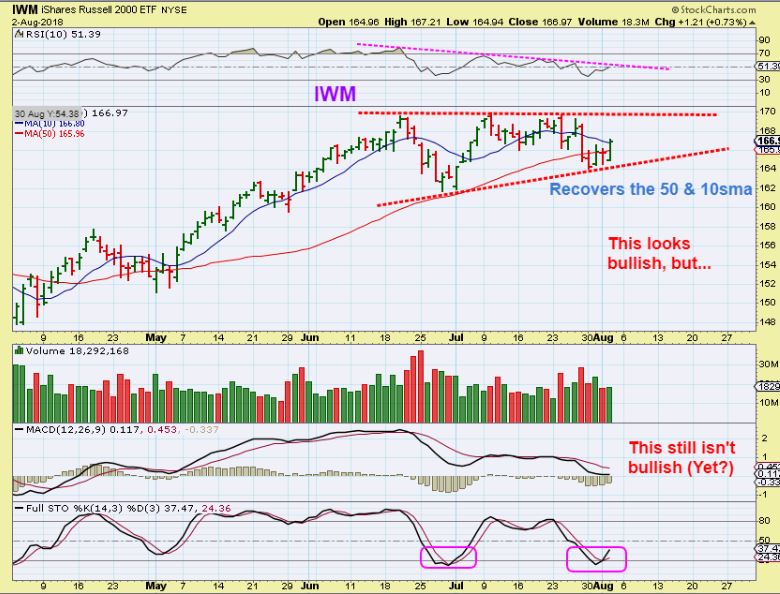
So timing-wise, We are coming due for a dcl, but that could be a 1/2 cycle low, as mentioned on the NASDAQ yesterday, and we may go a bit higher. These markets are surprising both to the upside & downside lately during earnings season, and that makes it a bit trickier as things become choppy. It is a stock pickers market when things get choppy like this. Lets continue…
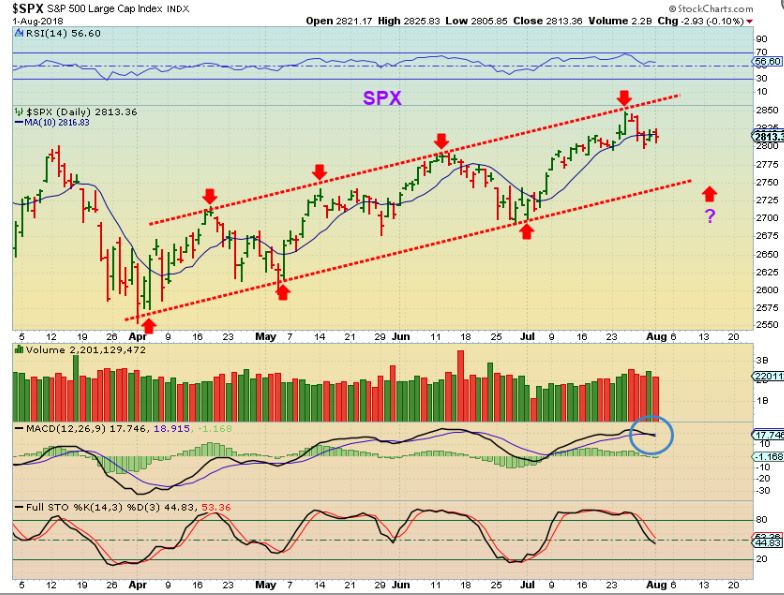
SPX – My chart from August 1 and we looked to have reached the upside target. It was day 23, with a day 18 ‘peak’, and This looked ready to drop into its dcl, macd crossing down
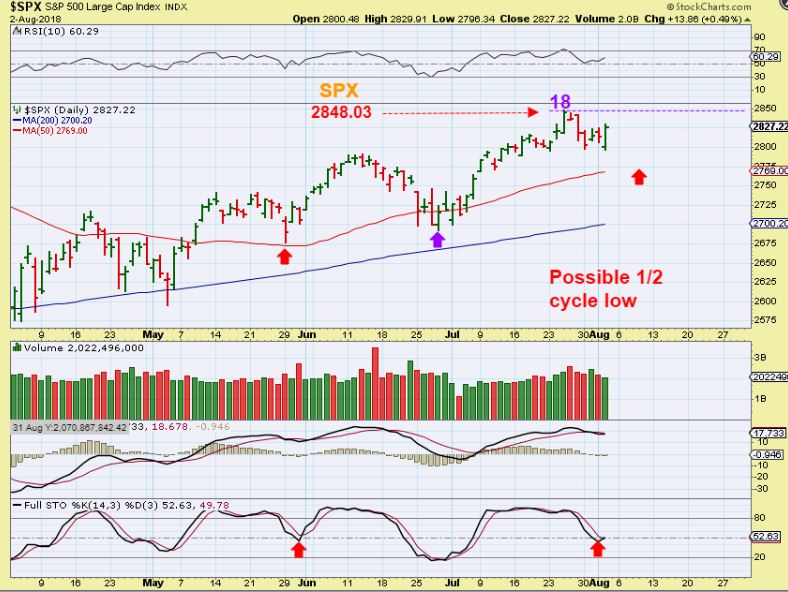
SPX – Now we see a reversal higher again on day 24. IF THIS MAKES a new high above 2848.03, this will then likely become R.T. The last 1/2 cycle low bottomed here on the stochastics as shown, so the General Markets are showing some resilience. I was expecting a drop into a dcl, but this is not as weak looking as IWM (MACD, RSI, ETC). And the NASDAQ of course looks even better…
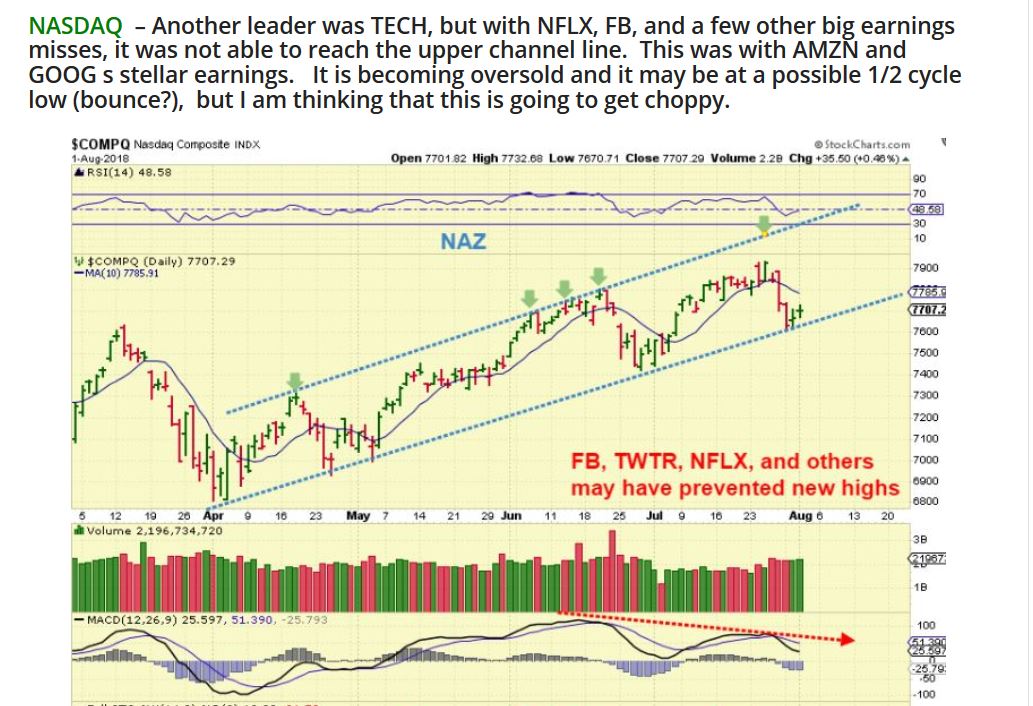
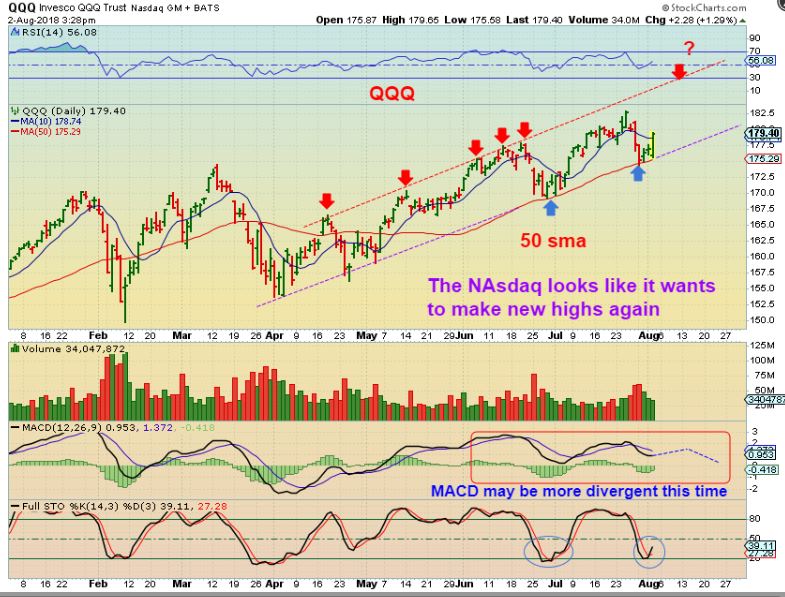
NASDAQ FROM YESTERDAYS REPORT – A mix of Good & bad Earnings were released and Bad ones like NFLX & FB dropped NASDAQ last week pretty sharply, and prevented it from reaching the upper channel line.
I expected a possible bounce, and though that we could see a 1/2 cycle low here. I am not long, but it could be bought with a reversal on Support. This is what I wrote…
.
QQQ – This was captured at 3:32 P.M. Eastern, we got the bounce / reversal. When I see this kind of reversal, it can be bought with a tight stop, because the NASDAQ is oversold, at a possible 1/2 cycle low, and the trade may take it to the upper channel line. I would use a stop for sure & remain cautious, since we had 2 very strong down days just last week. Watch the MACD as the daily cycle ages.
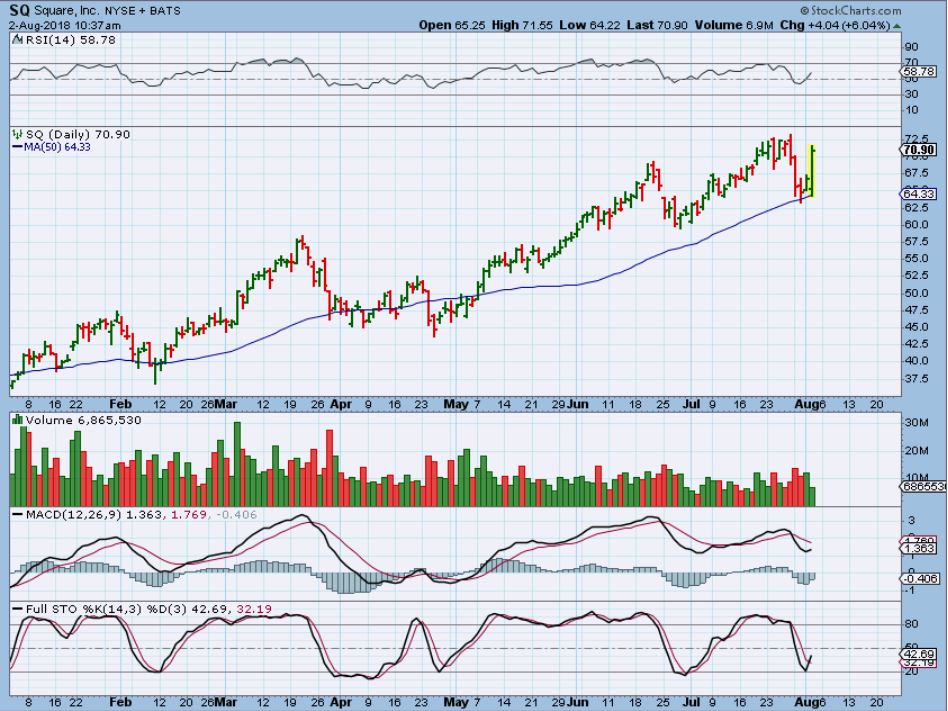
SQ – The good earnings Pop. Some earnings reports are really helping ( GOOD, AMZN, SQ, many others), while FB, NFLX, are struggling. The ETFS have been choppy, we’ll see what the employment report does for the markets ( if anything. It may be figured in already).
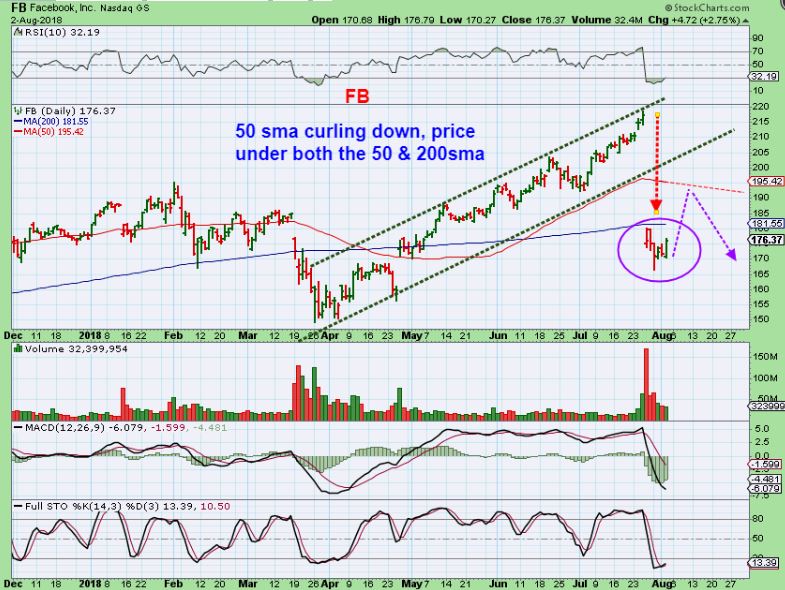
FB _ The ‘Missed earnings’ group has received punishment
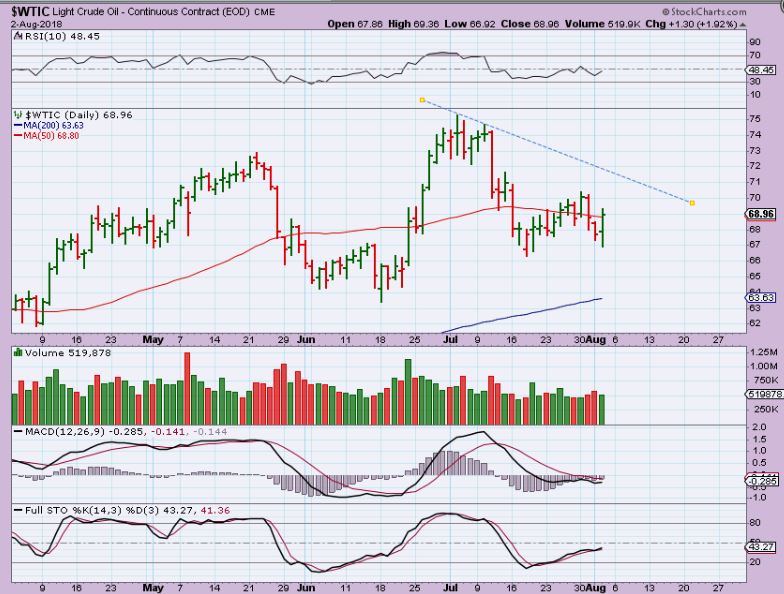
WTIC – Oil reversed on Thursday too, with a day 21 low so far, this should be day 32. I am not expecting it to get above that upper trend line. ( I will admit, when I look at this ‘pattern’, it looks very similar to the June lows pattern where we saw a 1. Bear flag 2. sharp drop to new low 3. reversal 4. run higher). That day 21 low should not be a dcl though, so I would expect this to stall soon.
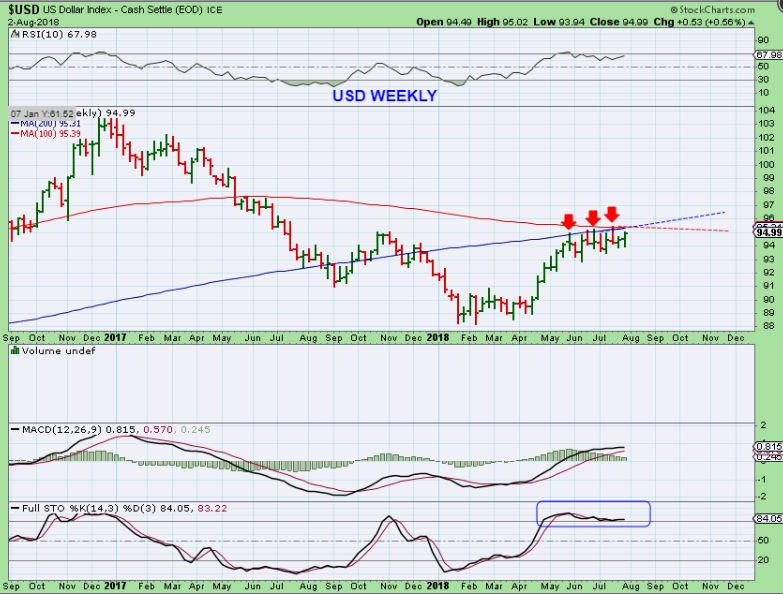
USD WEEKLY- I want to start with the weekly, because the daily chart of the USD looks a tad bullish. This resistance has held the USD back, and that should continue. If this breaks out, there could be a problem. It is overbought on a weekly, so has room to sell off.
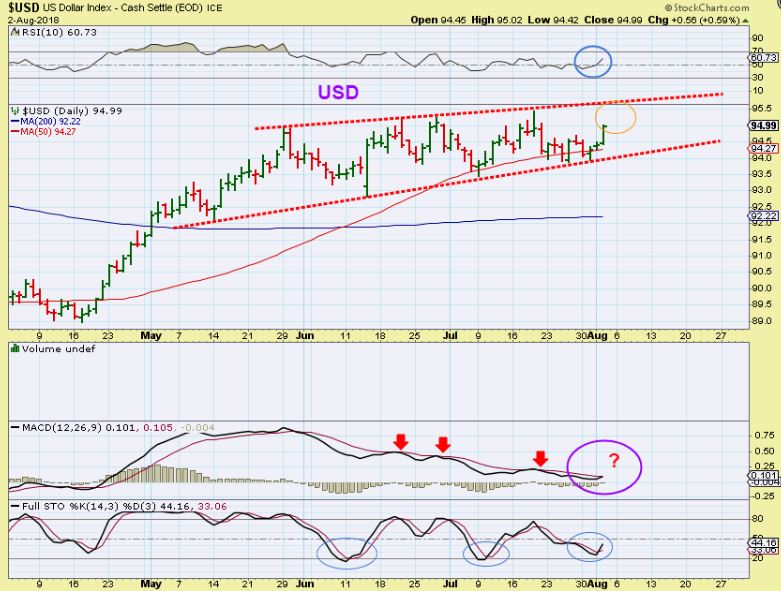
USD DAILY– The USD has room to move higher, and it should stop at resistance ( 95 – 95.50ish). This can cause Gold to drop further, we’ll discuss that.
.
What I dont like 1. USD is Oversold 2. MACD may be crossing up? Good news: Past oversold areas did not break the highs though, it popped and crawled sideways. WATCH THE USD 95.50ish.
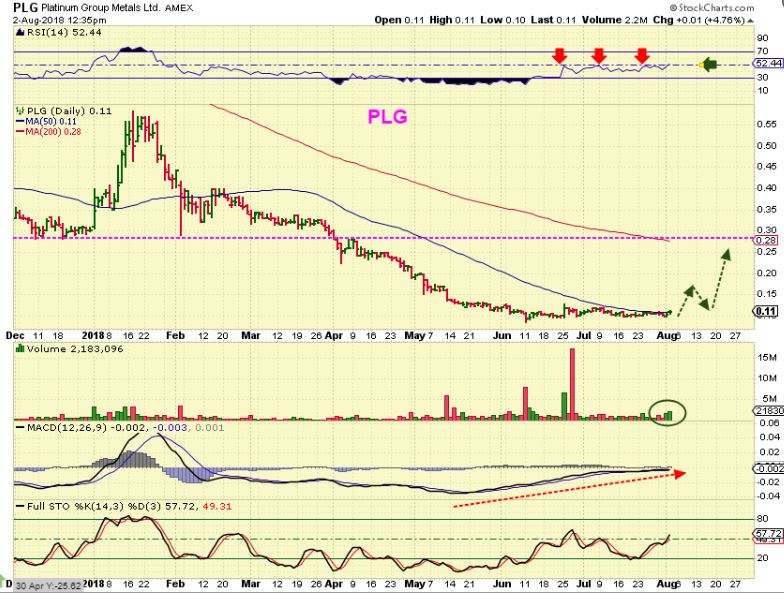
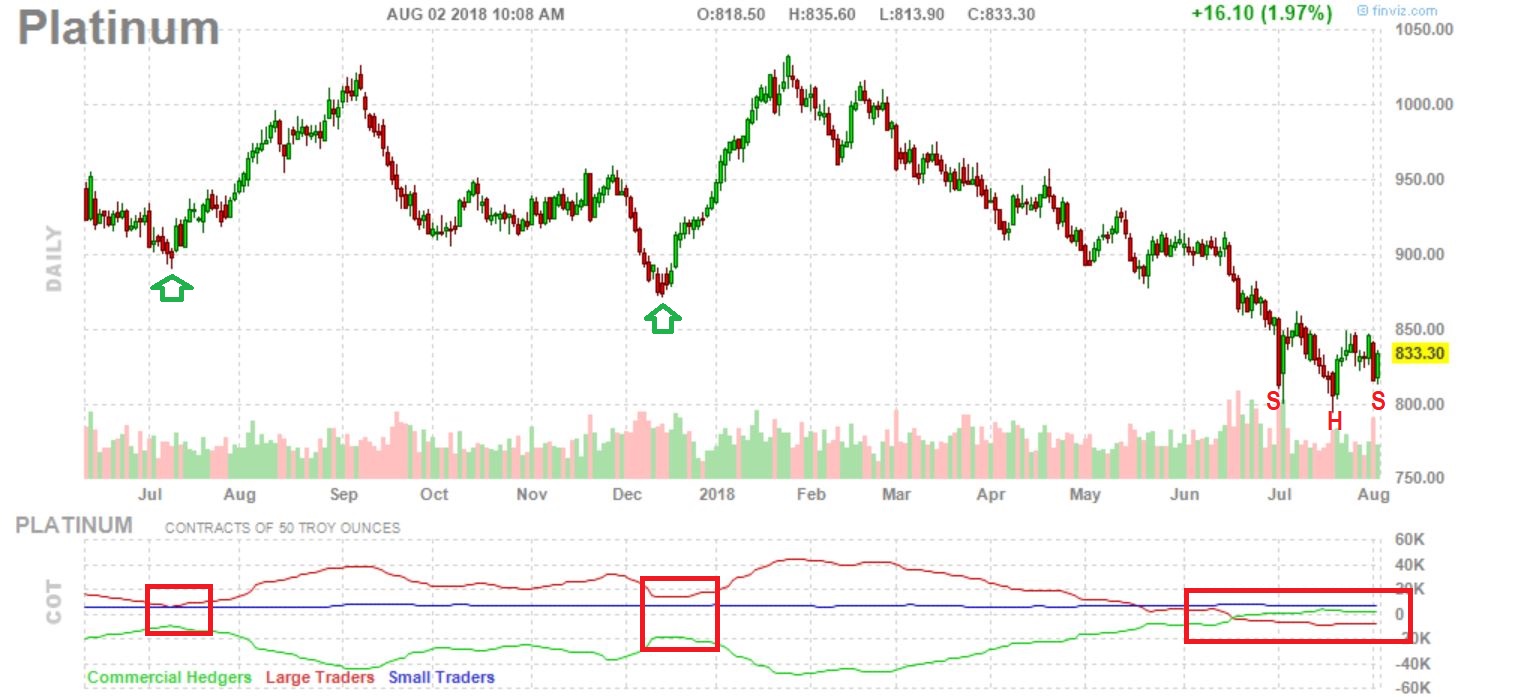
PLATINUM – Sometimes Platinum ( and Silver) used to bottom ahead of gold. Platinum looks like it is bottoming with an inverse H&S. Can we please get a bottom in Gold please? 🙂
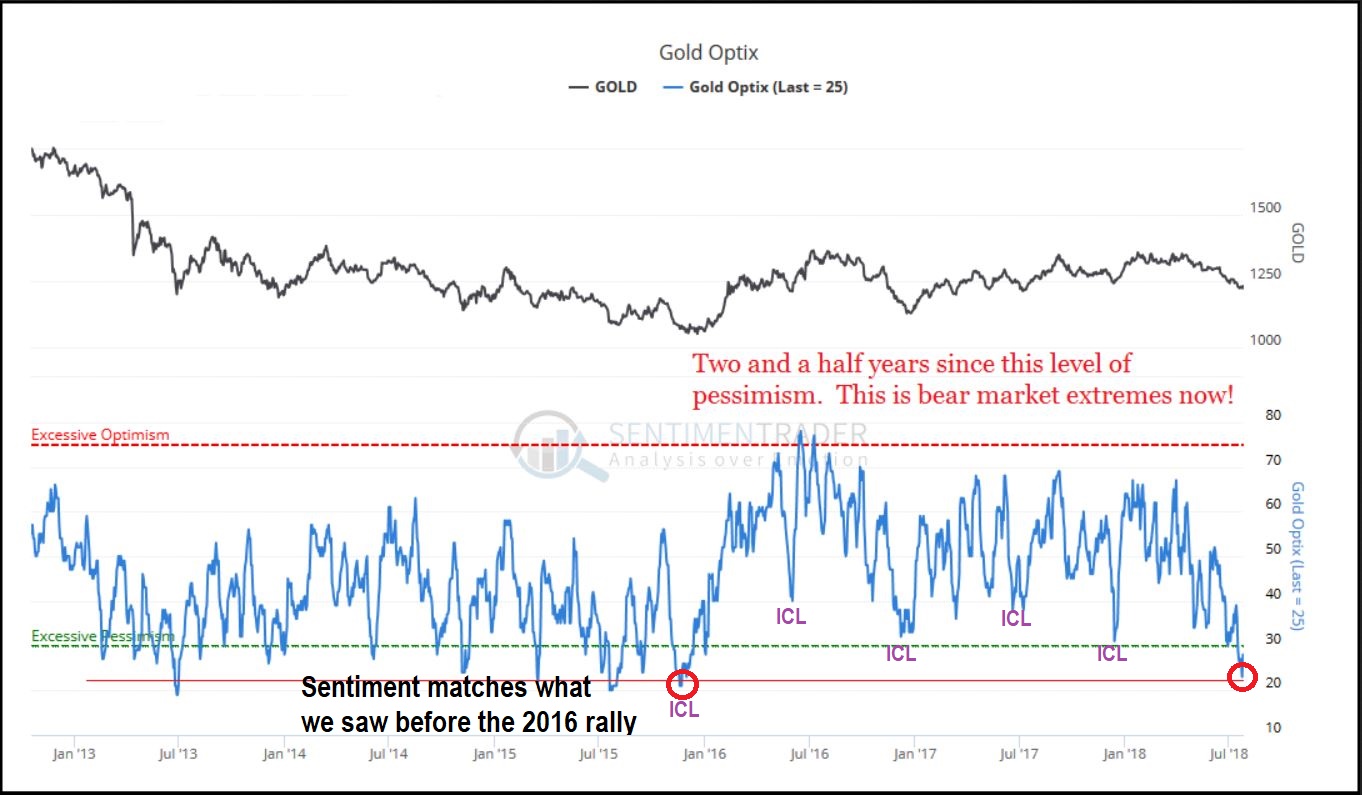
SENTIMENT – As mentioned, it is IN THE TRASH FOR GOLD, similar to 2015, This is bullish and leads to a relief rally, but it is not a good short term ‘timing’ tool.
GOLD – A basic measured target for Gold could be $1195. It can drop deeper, since measured moves in extreme conditions often extend.
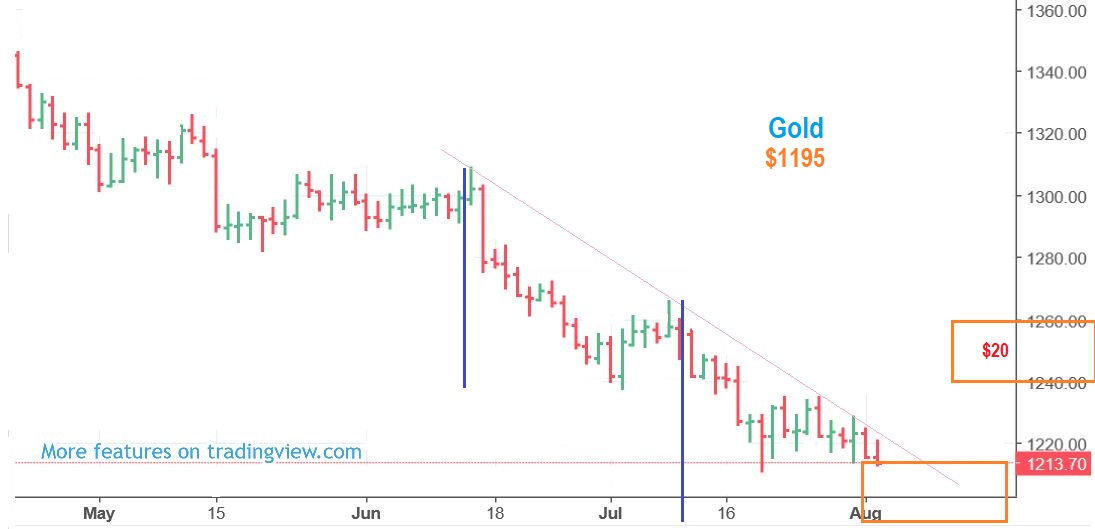
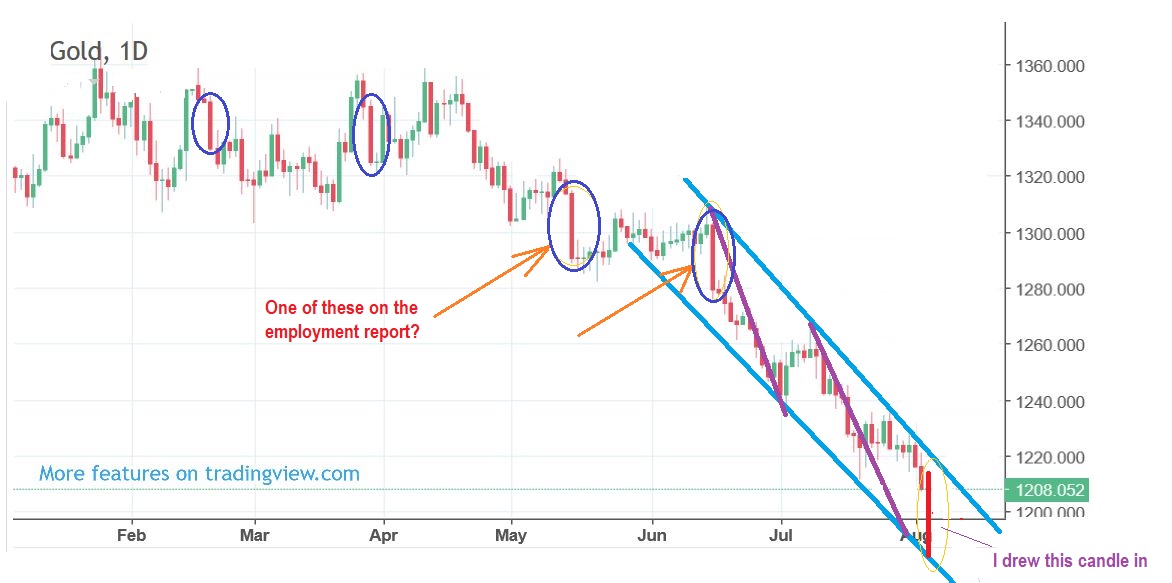
GOLD – A big flush candle could occur with the Employment report. This looks more like the $1180’s are possible for Gold using a trend line and long candle.
IMPORTANT:
.
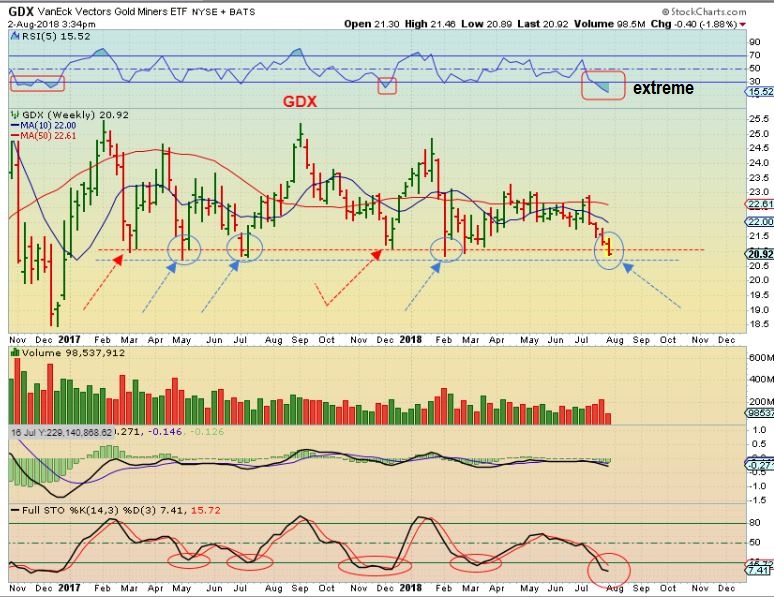
GDX WEEKLY CURRENT- GDX has dropped below our red line and is near or at the blue line. This is the important area. We are in the area where a stop run that we have discussed and need to accept as a possibility, would take place. Even though Miners were holding up so well for so long, they have drifted down to so called ‘support’. Let’s discuss this further…
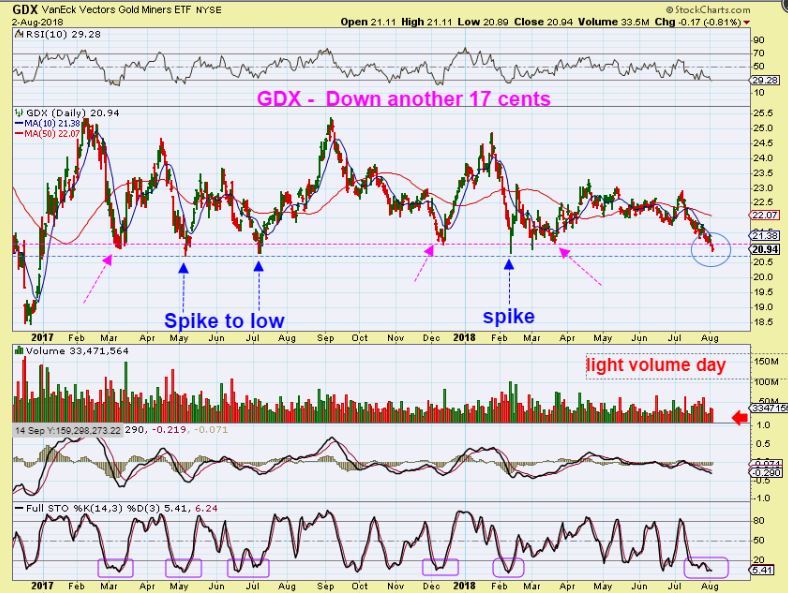
GDX DAILY– In the past, the red line either acted as support, or GDX Spiked down to the blue line and the selling ended there. So we could see a Spike down in GDX to the blue line, and it also MIGHT break that blue line to run over a year and a 1/2 of stops. NOTE: Today GDX was only down 17 cents, but each day that is what we’ve seen, a slow drip, drip, drip down. Many are frustrated and forlorn by this slow melt down. The constant down days, though smallish, are taking their toll. Now we must expect a possible wash out / flush out stop run. We’ll discuss this even further…
Note:
.
1. I bought a few individual Miners & traded some this spring. I also recommended holding some back in April, since they resisted Golds selling and could lead the way & take off higher ( Like KL, GORO, etc). Even with that, Stops are still important with every trade. We don’t want a sell off to get carried away while we are holding on.
2. I never recommend Leverage to my readers before Gold has a confirmed ICL, though I may own some personally. Stops should be used if buying anything before a confirmed ICL is in place, especially leverage – so let me explain one method that I have used. I may buy a small starter position, I then add on to it on a move higher. If I add, I at least put stops on partials of my positions. Say I buy at $13.50 and it goes to $14. I may add at $14 with a stop under $14. Then it goes to $14.50, I add again and raise a stop again (for partial). If it eventually falls below my starter at $13 , it will have stopped me out on some with locked in profit & some loss, and then I can afford to ride some below my original $13 if I want to stay in. I would do that as long as things remain ‘as expected’ and my leverage position would automatically shrink on the dips if selling continued.
.
IMPORTANT : Lets discuss this possible flush out again…
.
GDX – Click to enlarge. GDX is now at $20.94 and in past reports I said that GDX could drop below $20 to flush the stops. The prior lows are shown as $20.72, $20.82, and $20.83. We are only 22 cents from the deeper low, but please know that a stop run could cascade for a bit, to lets just say under $20. It could run all of the stops here. A $1 drop in GDX is similar to a $3 drop in NUGT. Then I would expect at some point a reversal & rally , like we saw at prior lows. See the long red arrows on this chart.
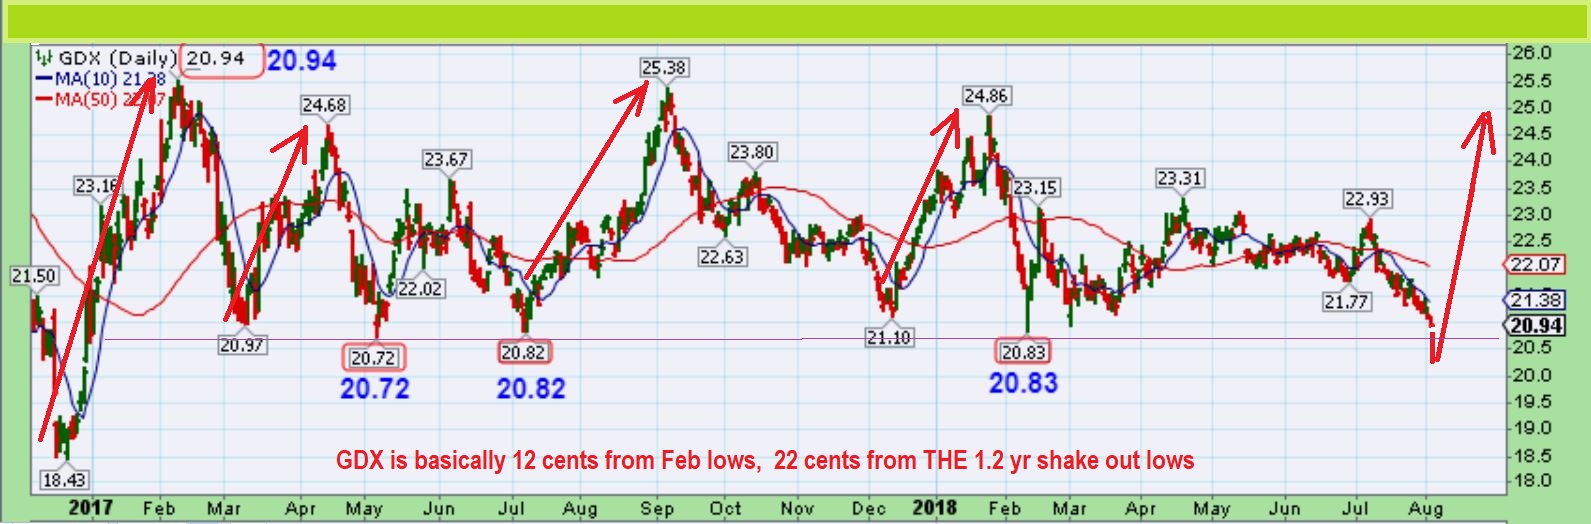
NOTE About Leverage: This drop could be scary, even sickening, if you own leverage. GDX from $20.90 to under $20 ( $1) could be NUGT down $3 more. If you have been here for a while, then you know that I NEVER used to mention buying JNUG or NUGT, because I didn’t want people to jump in and ride it down when it came to leverage. Over time, Readers have asked me to mention it and leave the decision & risk up to each trader. I feared this, because I knew another letter writer that used to push “All in 3x ETFS before an ICL was in place” and insist that you do not sell on the drop or you’ll sell the bottom. OUCH. More than one of his readers told me that they rode it down from $20 to $8 or $6 or $4 at prior ICLs. That is … Wow! I would personally never recommend leverage to others until a confirmed ICL in Gold was in place, though I may trade it myself.
Even after an ICL, a stop must be used if the 10sma is broken and lows are threatened again. It is a learning process with leverage for sure. This time around, I was being asked in the comments here and there , “Do you own JNUG?”, and I did since miners were resisting selling ( and I do still own some). So I mentioned that I owned some JNUG, and I mentioned it in the reports too, as very risky. I am hearing in emails and comments that a few ( at least a few, maybe more) are now pretty loaded up with leverage before a confirmed ICL in Gold. Even this slow continuous type of selling hurts in a 3x etf, even if GDX is only losing 20 cents a day. When I discuss GDX or GDXJ, readers can decide if they want to venture into leveraged positions, but I may go back to not disclosing whether I own it or not. I am concerned that others may think the risks are lower if I am trading it.
.
Things could get uncomfortable if we get the flush out, but it really should be short lived. Even so, I’d rather that people sleep better at night and wait for the ICL in Gold before adding on what could be a dip today. Use your best judgement. That said…
Let’s see what Friday brings our way, from the Employment report at 8:30 on into the close.
.
~ALEX
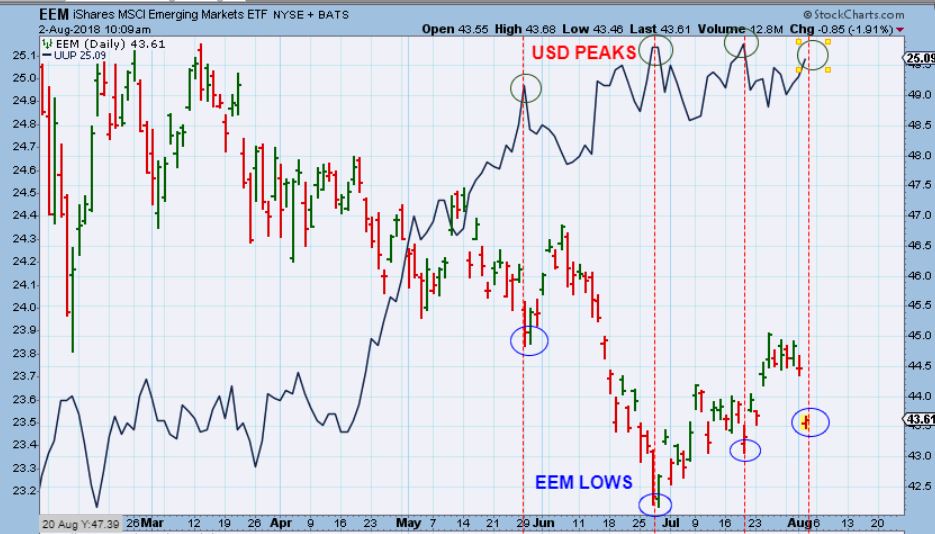
EEM – in the comments, Edward asked if the USD rise is affecting the EEM inversely. I drew up this chart and it does appear that this is the case. The EEM is probably dropping into a dcl, while USD pops to prior highs.
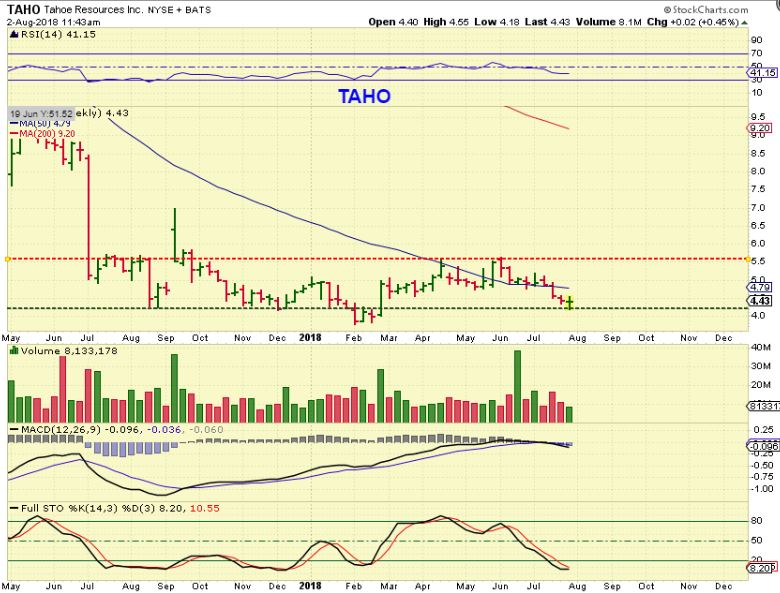
TAHO – George pointed out that TAHO looked to be in a trading range and was at the lows, so I pulled up a chart midday and I think that he is correct. I personally wouldn’t buy it before the precious metals selling stops ( and watch for earnings), but you can see that this are is an area of a long 1 year base. Taho actually closed at $4.47 Thursday. A possible weekly reversal at the lower trading range.
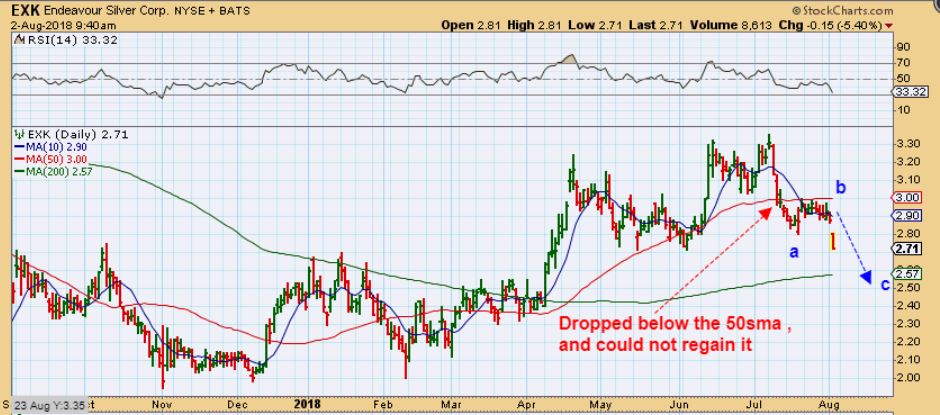
EXK – I bought EXK in April at the 200sma and recommended it down there, and again on the wedge, just before the break out in June. They released earnings and gapped down. The warning was breaking below the 50sma and back testing it, but I missed that sell signal. It was down 14 cents Thursday morning and I drew this up for the comments section. It looked like it wanted to a-b-c down to the 200sma & support from March & April, so I decided to cut it loose and look to re-enter after it after it stabilizes. It did drop to the 200sma by days end, I wont touch it again until it proves itself.
PLG – I mentioned PLG as a trade ( it is low priced and has to be considered risky, most understand that ), and it started to break above the 50sma. It closed up 11% and can continue higher.