August 2nd – BOTTOMS
It is time for my favorite lesson again, and I call it …
NOT ALL BOTTOMS LOOK THE SAME!
While we are awaiting a bottom in Gold and Precious Metals, it t is often good to be reminded that…
1. Not all bottoms look the same and
2. Bottoming can be a process at times, and can wear our patience thin.
We will review that fact using a few charts showing different types of bottoms at the end of the report. For now, we will review various Market sectors.
.
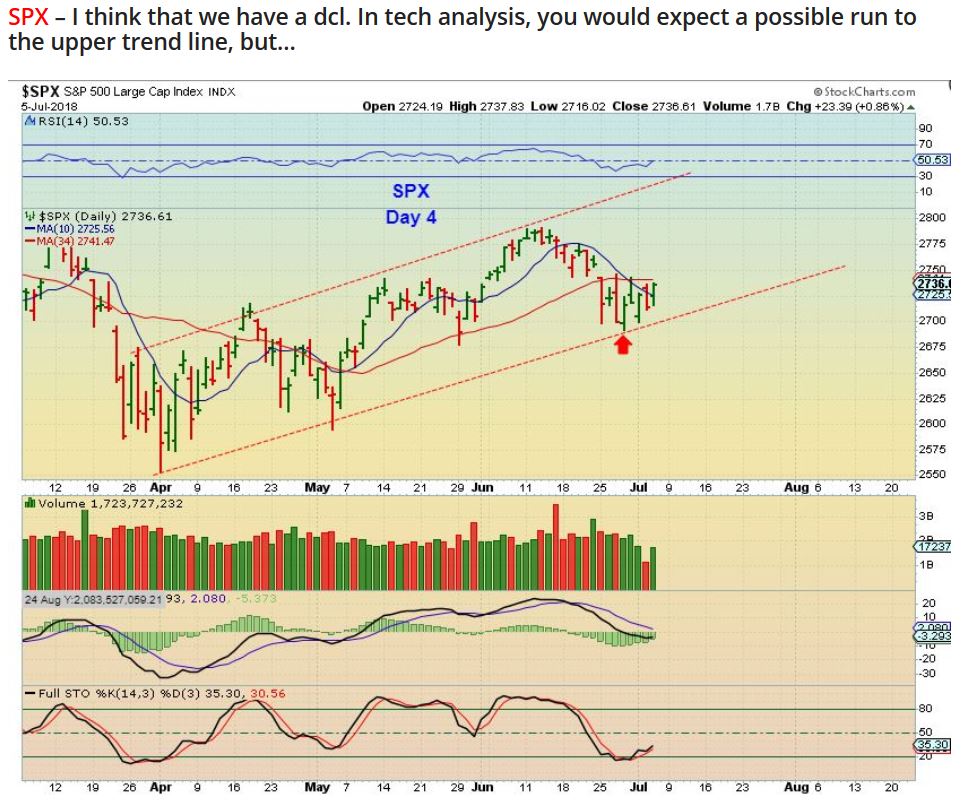
SPX – This Chart and writing was from my July 6th report. It has been copy / pasted here.This is where you could ‘buy’ or go long the General Markets again…
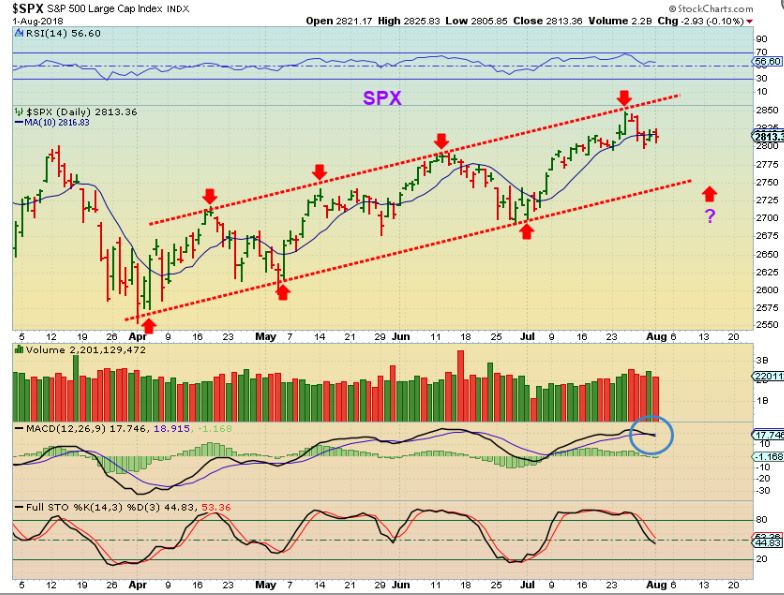
SPX – I had mentioned that by day 15 we would begin to look for signs of a top. So far it topped on day 16 and we are seeing ‘signs of weakness’ now. I expect a dip down over the next few weeks. I have mentioned that I do not expect new highs from here.
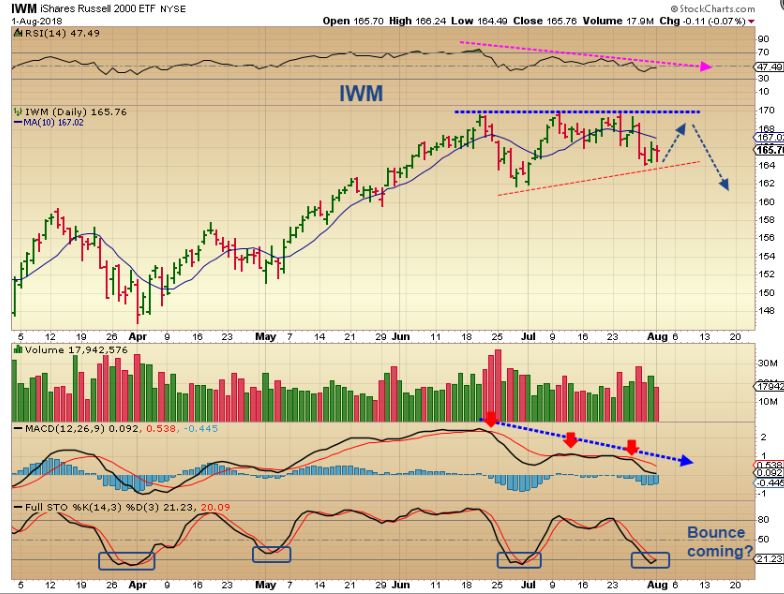
IWM or RUT ( Russell 2000) – The Russell 2000 was a leader higher, but has started what looks to be a topping process. The pattern looks bullish if it bounces, but the indicators do not, they show internal weakness at this point. It is oversold, so it may bounce, but I dont think it can break out higher. I expect a break down over time.
NASDAQ – Another leader was TECH, but with NFLX, FB, and a few other big earnings misses, it was not able to reach the upper channel line. This was with AMZN and GOOG s stellar earnings. It is becoming oversold and it may be at a possible 1/2 cycle low (bounce?), but I am thinking that this is going to get choppy.
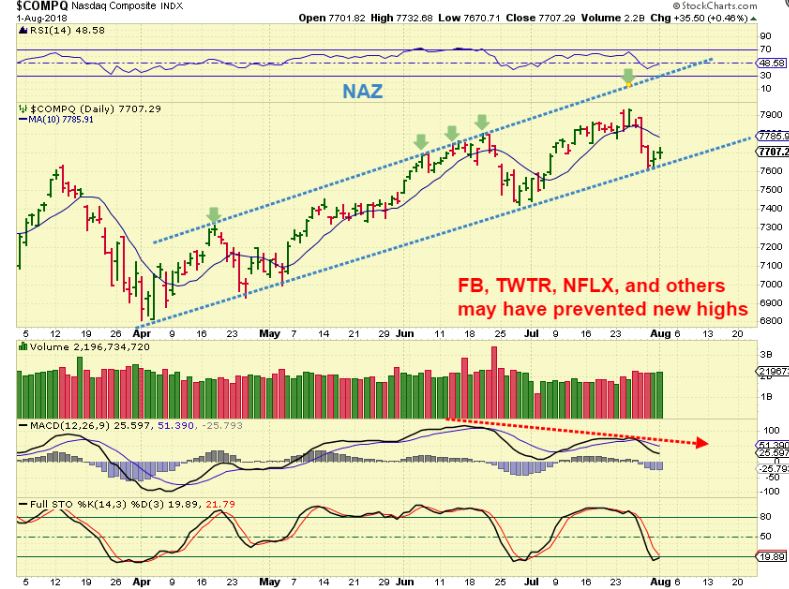
So I have been saying since the Daily Cycle Low that we should be cautious from Day 15 onward and look for weakness. I am expecting a drop into a dcl and a drop into an ICL is due too. Though everyone is Very Bullish with AMZN, GOOG, nailing earnings, I wrote a report saying “Everything looks beautiful at the top”. When Markets top, everyone is bullish, when they bottom, they are hated. EVERYONE seemed to be bullish last week heading into earnings, I’ve been expecting this dip. Be sure to use stops if you remain long.
.
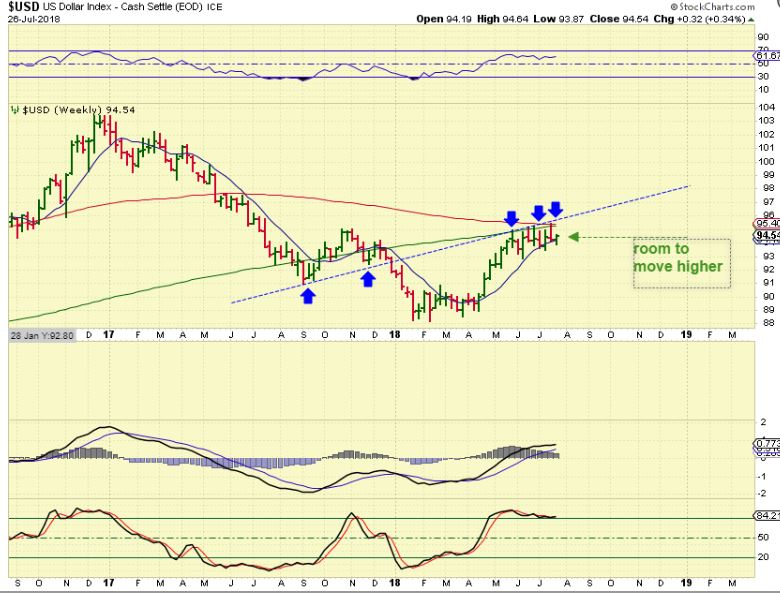
USD DAILY – I have been saying that the day 8 peak should be the peak of this daily cycle, an so far it is. That daily cycle should be L.T. . I look at this chart and it now looks due for a bounce? Oh No! A bounce from the USD may drop Gold to a new low. We’ll see. Eventually it should drop and break support and selling would escalate, pushing Gold higher.
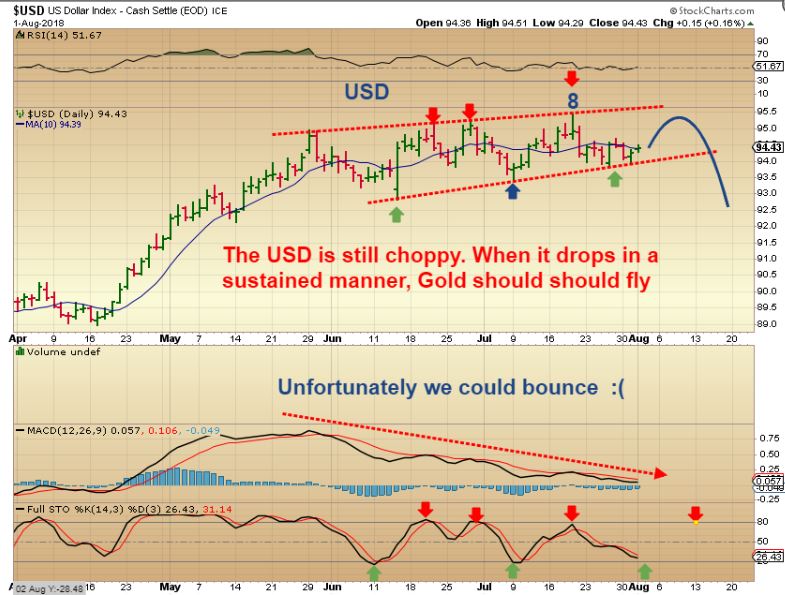
USD WEEKLY from Last Week – I have been showing this resistance holding the USD back. I would expect that any bounce should be capped around 95.50.
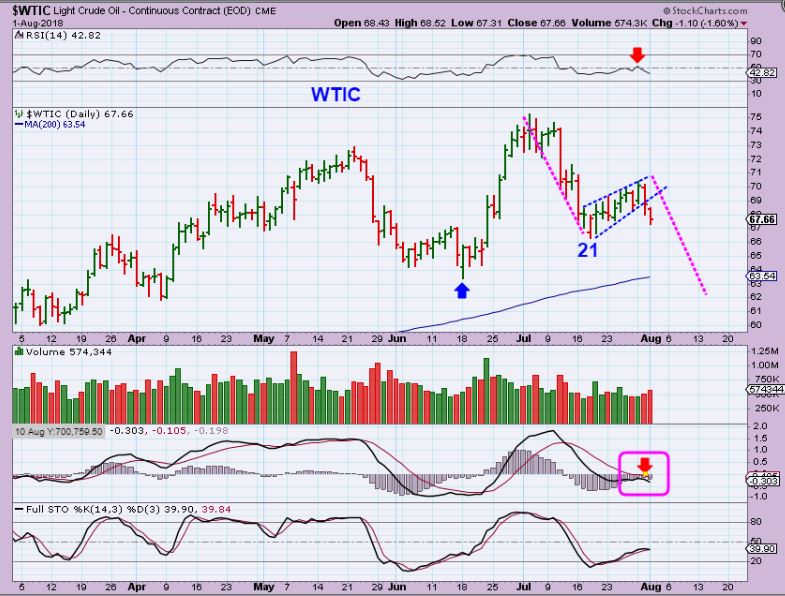
WTIC – I said that this ( day 21 low in Oil) was too early for a dcl, but I did expect a weak bounce and a deeper drop as shown.
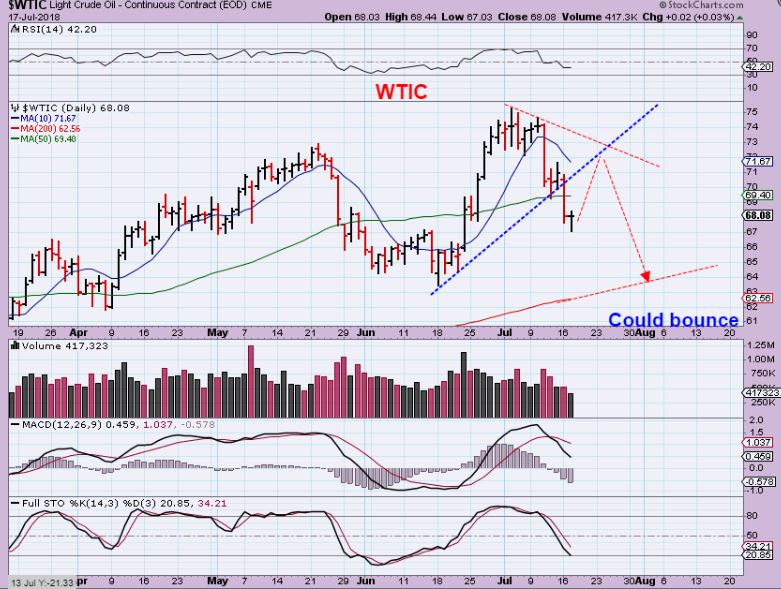
WTIC – So far that is exactly what we have seen. This has a day 11 peak, that is very L.T. & will be weak. We are on day 31 and these daily cycles can be 30-50 days long, so we now watch the drop and look for a swing low to form. Normally I would have shorted this, but I am just focused on buying at a Precious Metals bottom lately.
.
PRECIOUS METALS – We’ll discuss Bottoms
.
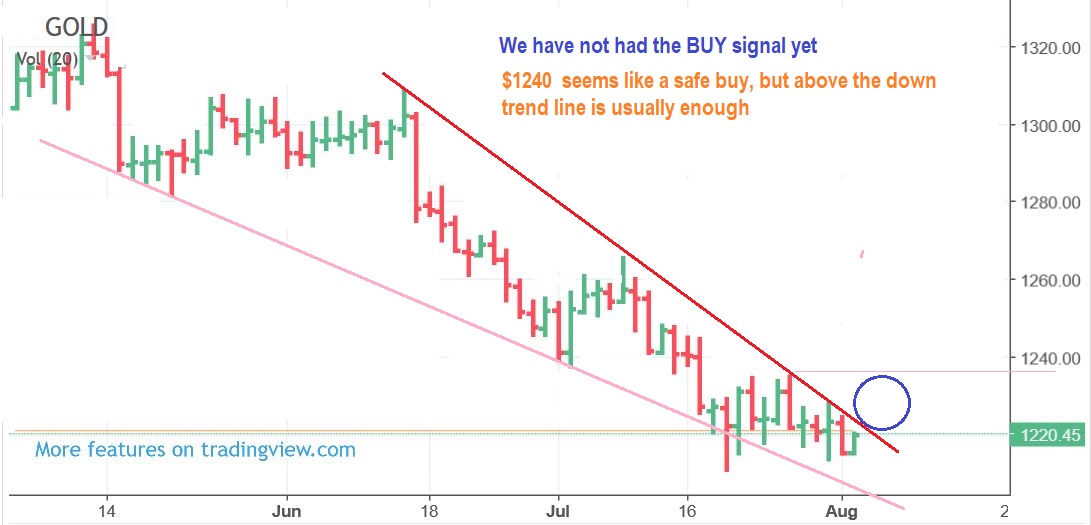
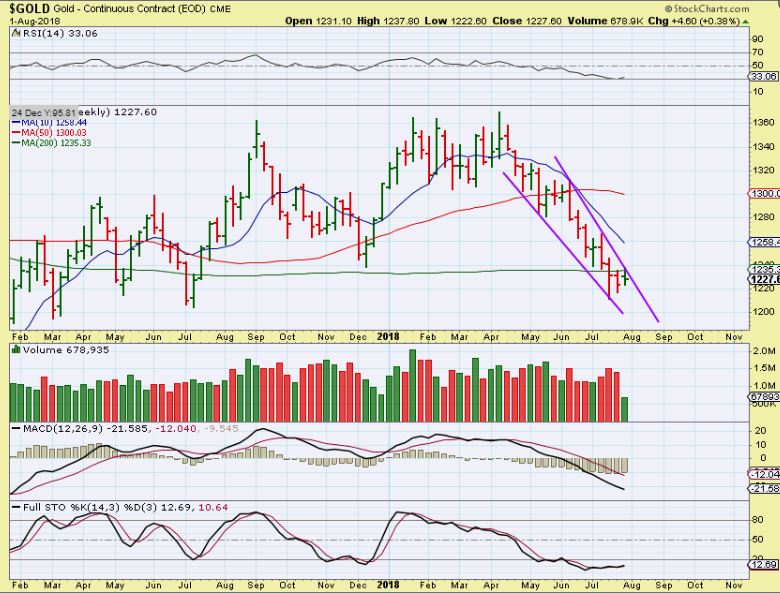
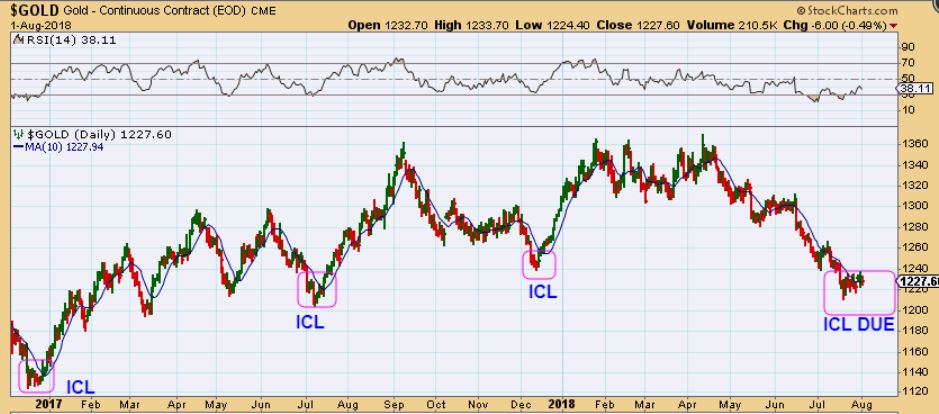
GOLD DAILY – This is not a proper descending wedge, but it does look like a tight squeeze that could pop higher sooner than later. We are due for an ICL in Gold.
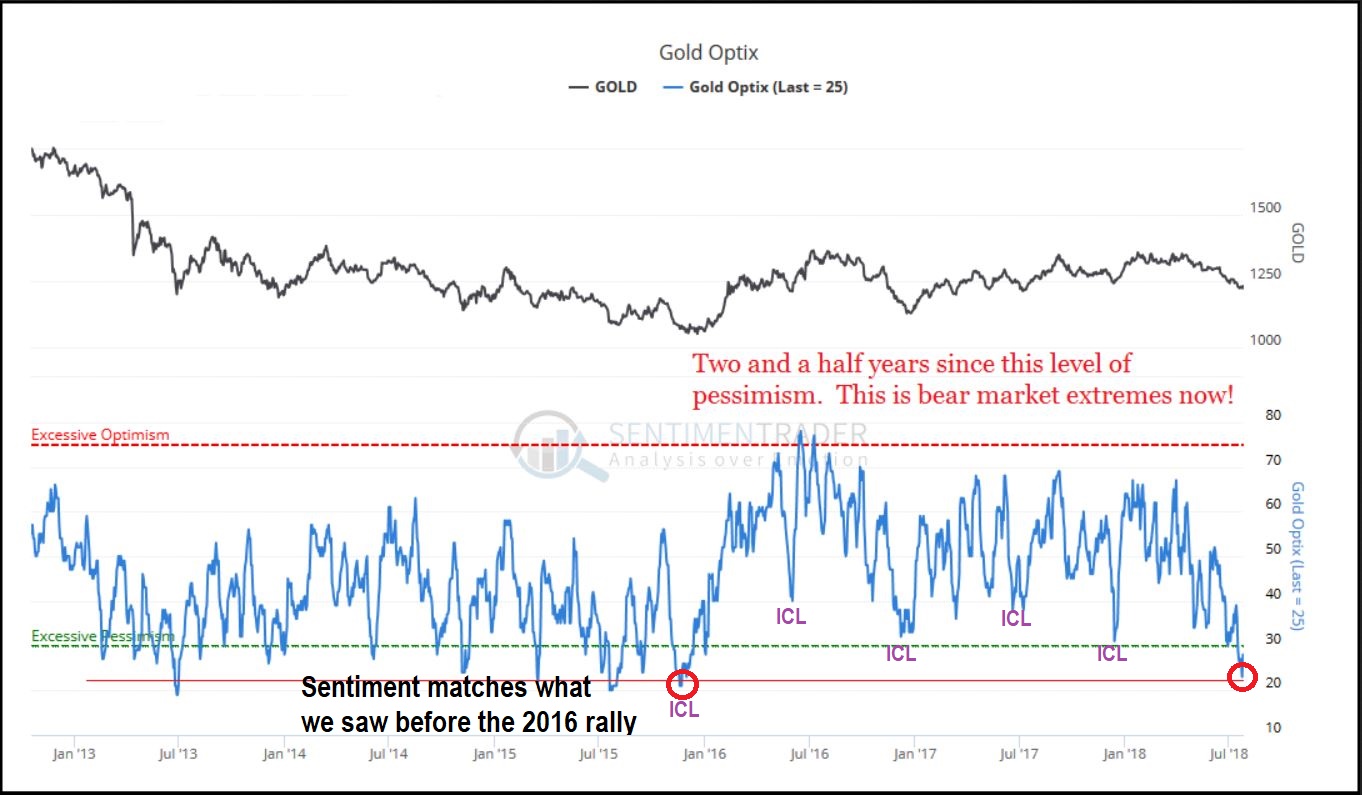
SENTIMENT – Do YOU hate GOLD? Me too 🙂 Are YOU fed up with this slow DROP, DROP, DROP? Me too, and we are not alone, in fact, sentiment is in the Gutter. It is at multi-year lows. I have drawn on the sentiment chart below…The last time sentiment was this low it was right before the massive rally of Jan 2016 in Miners.
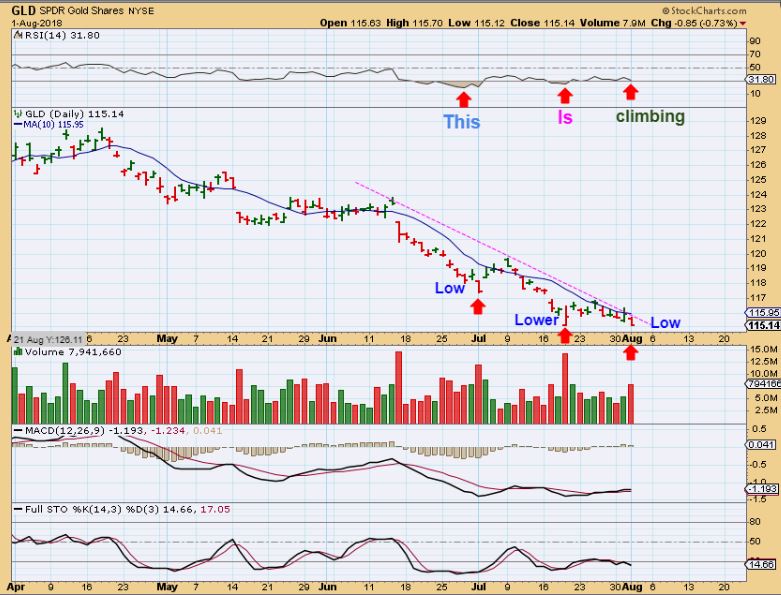
GLD DAILY – Here on GLD I am pointing out that with each lower low, we are seeing Relative Strength increase. That is bullish Divergence. GLD is at the lows and the MACD is rising , so hopefully we get some follow through higher soon.
GOLD WEEKLY – This weekly chart is very oversold. We need to recover the 200 weekly ma as a ‘shake out’. They do not stay this oversold forever, but it certainly feels like they can week after week.
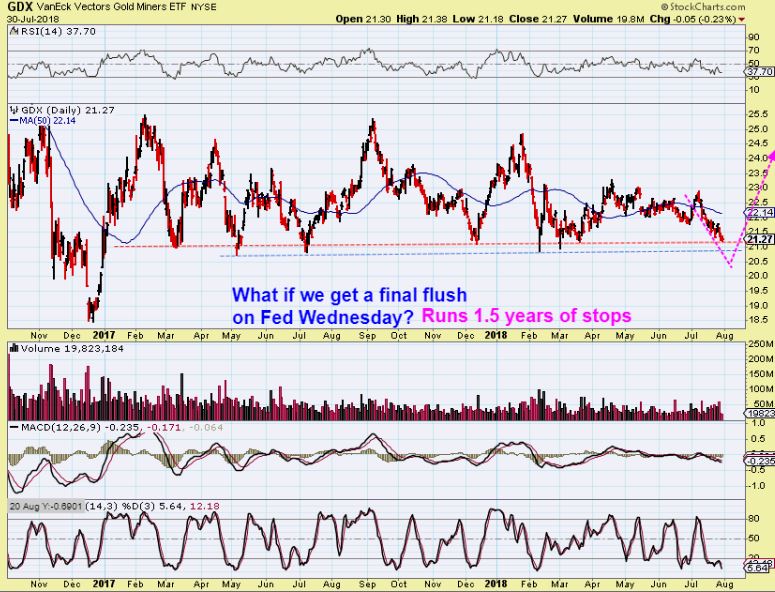
GDX DAILY LONG TERM – Going back to the July 30 chart, we have reached the RED support line. A stop run would break it, so we should expect that. We then have the blue line of former shake outs. A run below there would be a massive 1.5 year shake out as shown. Let’s expect that, and if it doesn’t happen & is support again, great. That said, GDX Could drop to $20 right? So …
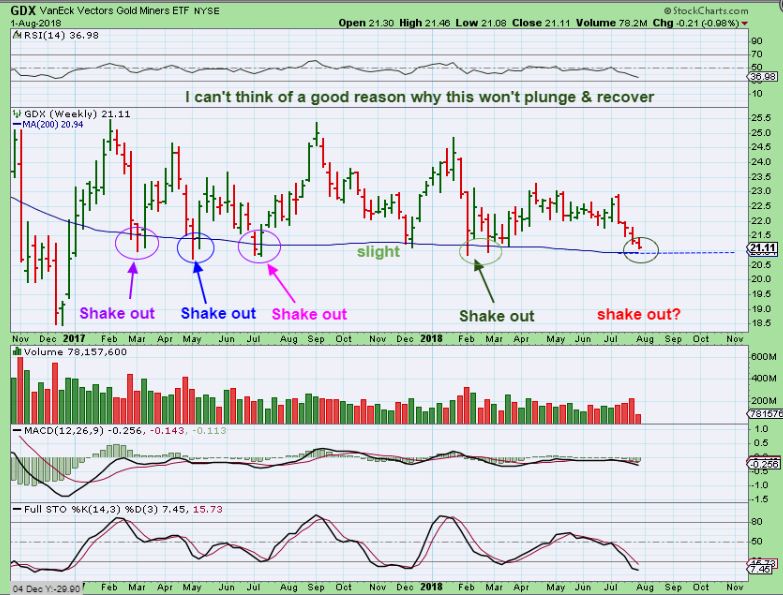
GDX WEEKLY – On the weekly chart, it is clear that we have not run those stops yet. We have also seen shake outs at the 200 weekly ma in the past, so this could dip further, right? Let’s expect that dip, and if it doesn’t happen, fine. That said…
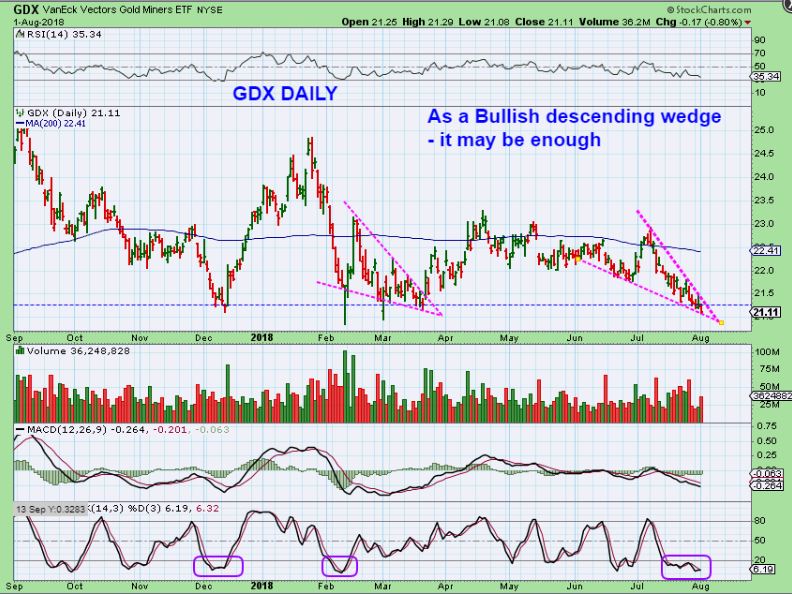
GDX DAILY WEDGE – The daily chart shows what looks to be a descending wedge AT THE APEX. Normally this should break out higher at this point, but again, Let’s just expect that the stops on the Feb lows will be run. If not, GREAT!! GDX is very oversold too, after a slow drip, drip, drip.
We’ll have to see what Thursday brings, since the FOMC Meeting didn’t seem to be the Catalyst that would light the fuse or set Gold on fire.
EDIT: AS I PROOF READ THIS REPORT AT 7:00 a.m. Eastern time, GOLD is in the Red and the USD is bouncing. Below I’m going to review a few different types of ‘Bottoming processes’ that have occurred in the past. This can help us to understand the bottoming process that we are experiencing now. Not all Bottoms look the same.
.
Enjoy your Thursday trading!
.
~ALEX
.
NOT ALL BOTTOMS LOOK THE SAME !
I want to review quickly just a few different bottoms that formed, and this can help You and I to understand the process of bottoming may not always end when we think it should…
.
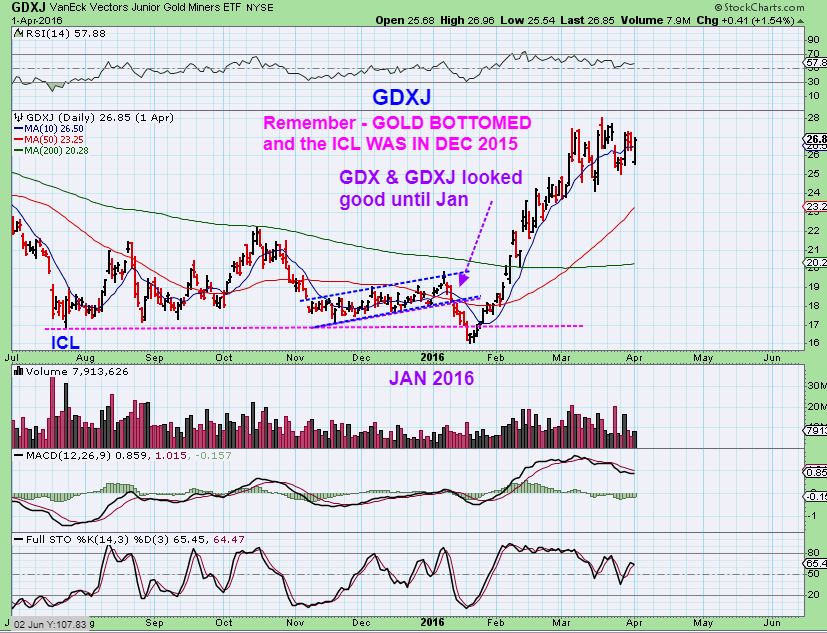
GDXJ BOTTOM JAN 2016 – This was a long drawn out upward channel that slammed down in about 7 days. That final slam down would be very hard to buy, it was a final ‘shake out’, but he rally that followed was one of the best. We bought that here at Chartfreak.
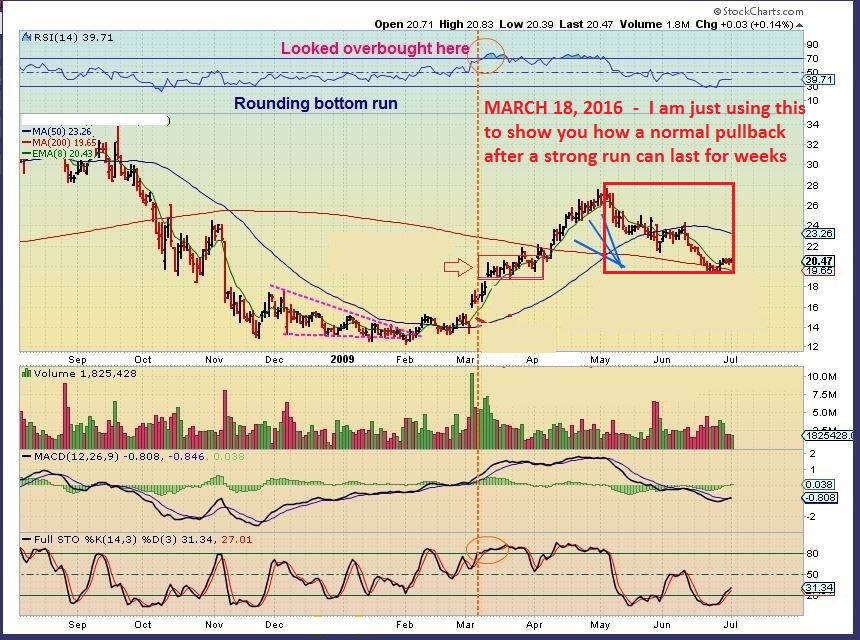
GOLD BOTTOM JAN 2016 – Here is a rounding bottom. This was such a tricky bottoming process, when you were riding it day by day, day after day. We look back at times and think that it was easy, but No! This was dropping to the lows as late as 10 and 19 days after the lows were in! This looks like what we are doing now, so …
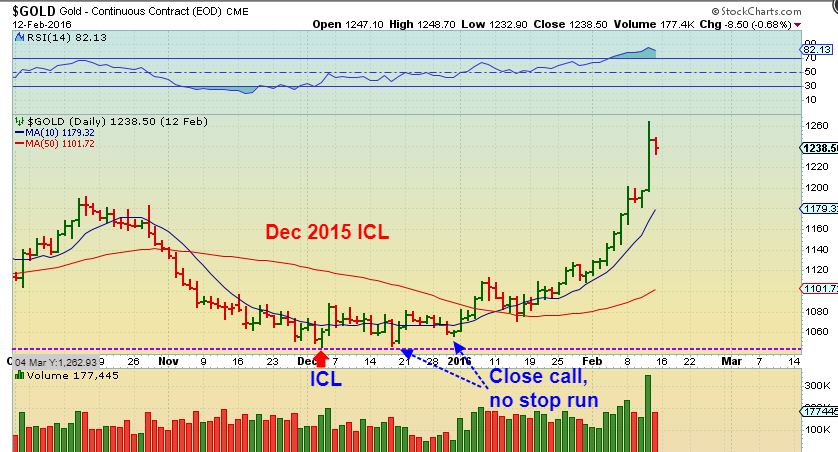
REMINDER: GOLD NOW – This could be day 10, and we are back at the lows again here too. Easy? No! This is what happened at the 2015 Dec ICL too, as seen above.
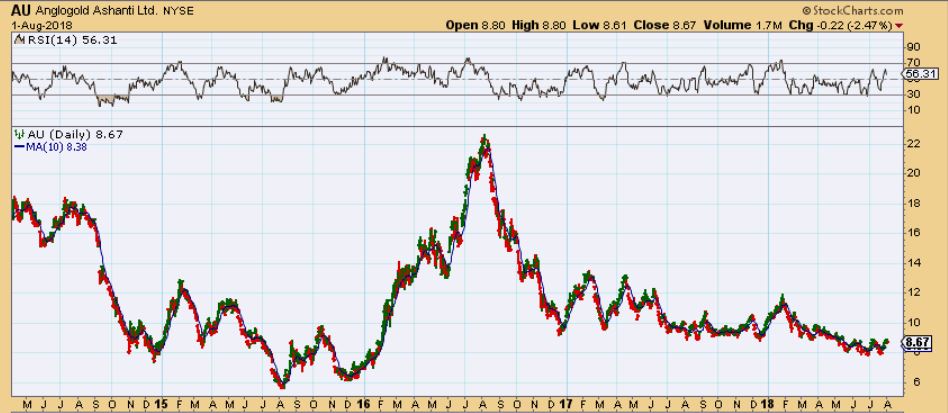
Look at the AU Bottom of DEC 2015 – This is a multi year weekly chart that I drew up in Dec 2015. Just look at the final POP & DROP of July – December. Another tricky Bottoming process. This bottoming process was taking a long time. Was it worth it?…
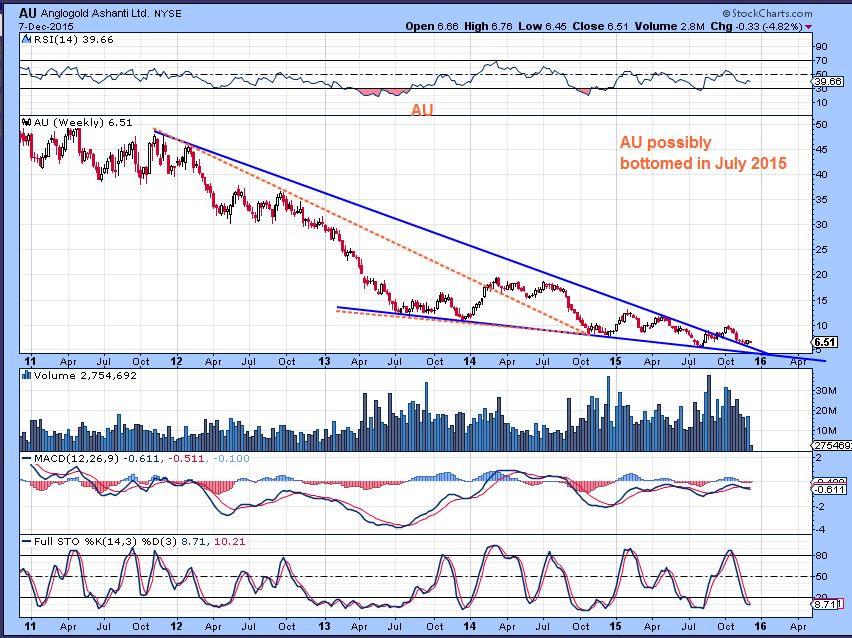
AU – After that bottoming process in 2015, look how AU AU ran from $6 to above $22. That is encouraging.
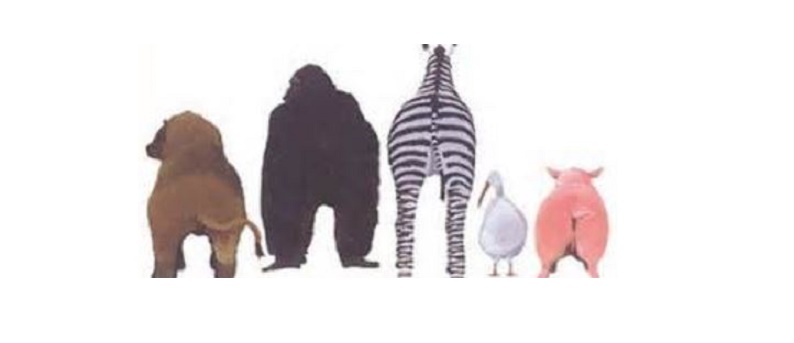
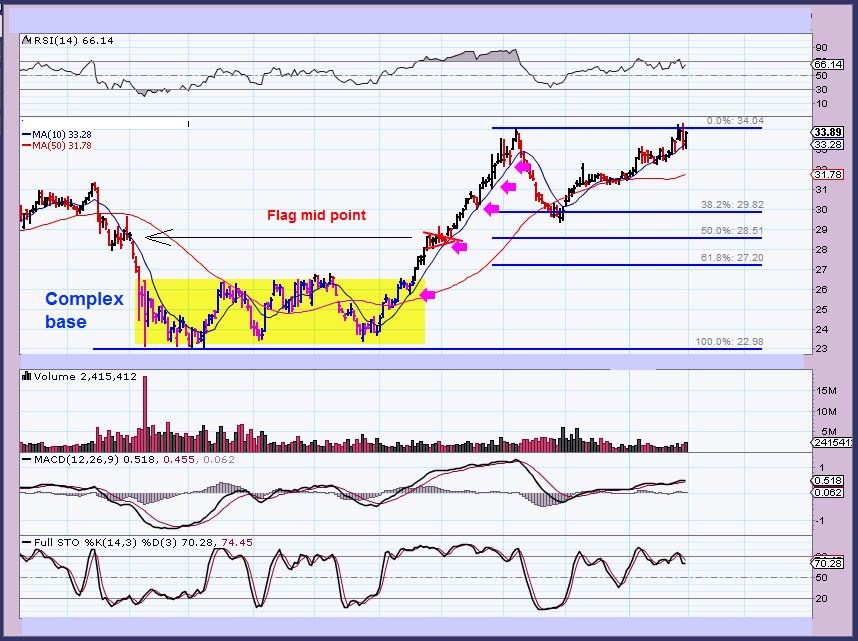
Another type of BOTTOM – This is a complex bottoming process of rally, drop, rally, drop. and is very frustrating. I CERTAINLY HOPE that we do not have to bottom like this in Gold now, and I actually don’t believe that we will. With sentiment at deep lows and with the current COT readings, we should just take off higher at some point, in a short covering rally. I just wanted to show the readers here that 10 days at the lows in Gold is not as bad as it could be.
Another BOTTOM – When a bottom bases out after a sell off, it can also give you a lot of long choppy sideways movement along the lows. Ignore the writing on the chart, it was used in a report years ago. Here I am just showing another kind of bottom, long drawn out choppiness.
Conclusion: These are our recent ICL (Bottoms) and you can see various ways that they formed. This one is a bit drawn out, but it can all be part of the bottoming process. This one looks more like the Dec 2016 ICL at this point, though it could sustain a FINAL slam down to flush out Bulls. We shall see, but we are in the timing for an ICL.
Speaking of bottoms.
.
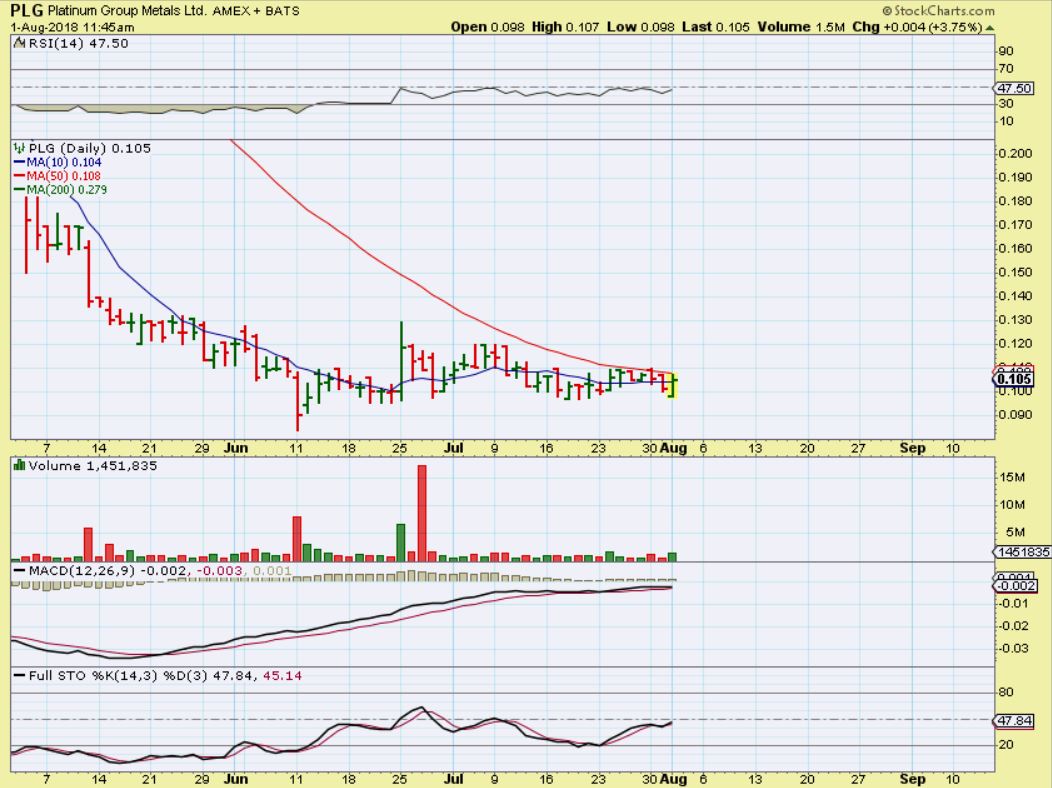
PLG MIDDAY – I think we are bottoming in PLG, so when Platinum moves higher, this may begin to break above that 50sma resistance and move higher also. IT seems to be bottoming at the moment.
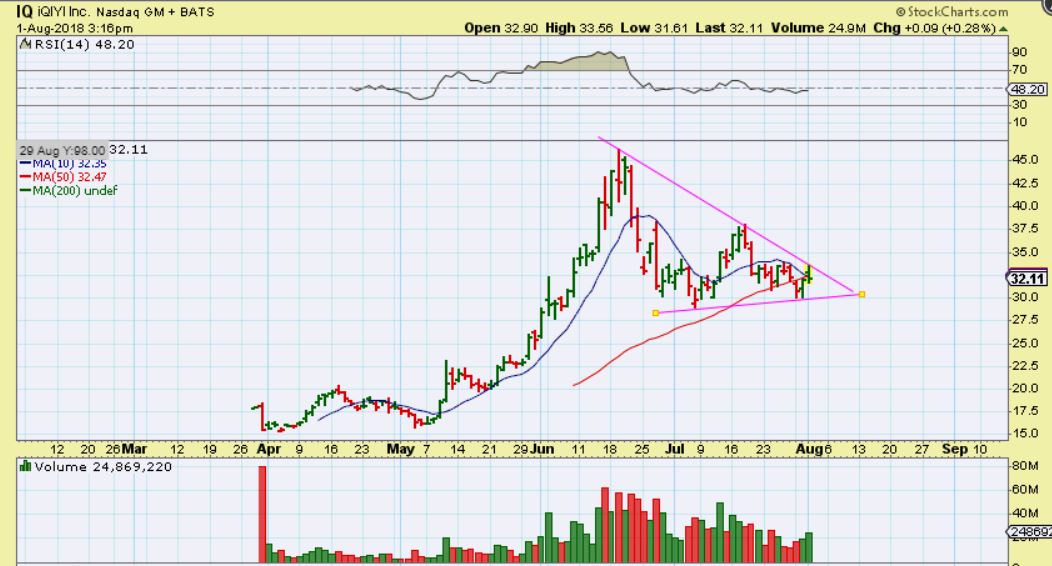
TECH- I am not confident that the General Markets are going to hold up, but some individual stock picks seem to be bullishly setting up. I am just watching IQ, HUYA , and a few others at this point , to see if they can get any follow through higher. They may be worth a quick trade for the faster day traders.
.
IQ – Earnings were released, but I didnt buy because I am expecting the general markets to dip. Some stocks may resist, so I am waiting to see if this breaks higher or lower. It looks pretty good so far, but it is simply on my watch list as a possible fast trade.