SPX – I am still expecting the General Markets to begin rolling over.
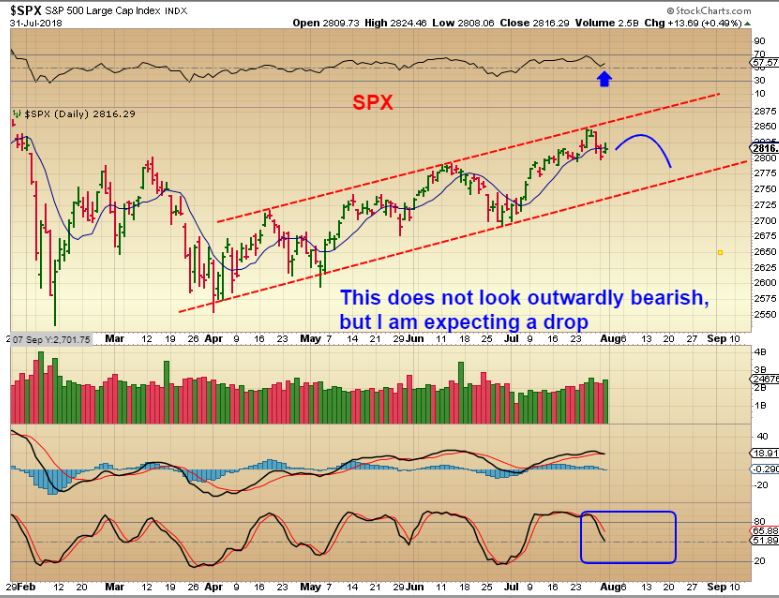
Even with great earnings beats that GOOG and AMZN had, the NASDAQ fell for a couple of days. AAPL beat too, but I still think that the markets are going to have a hard time resisting a drop from here.
This report has not been proof read, please excuse any typos- Thanks!
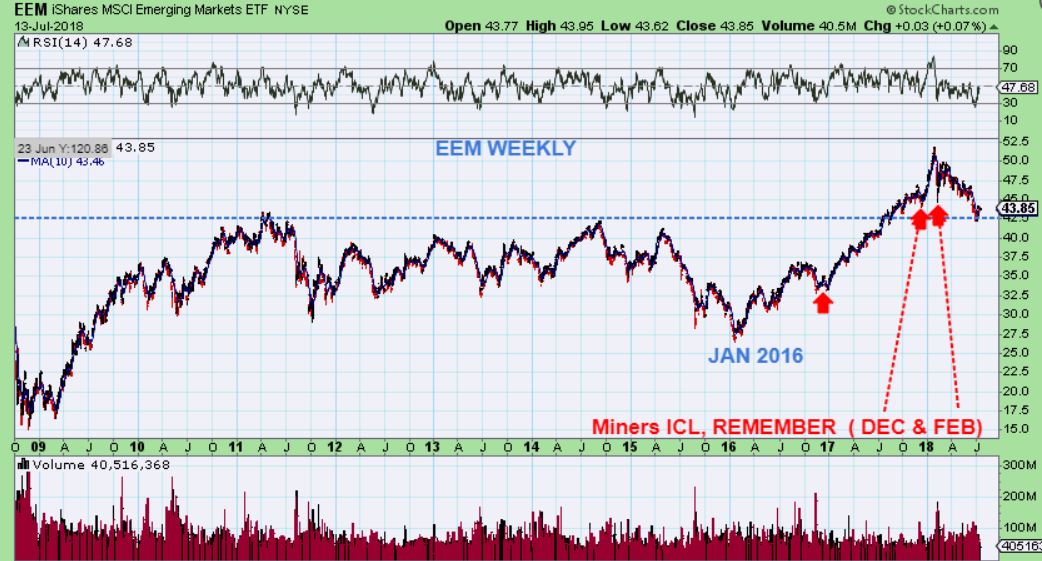
EEM – Recently I mentioned that I thought that EEM back tested and bottomed. I linked this to ‘timing’ Miners too, because in the past the EEM Bottomed at around the same time as Miners – In the same month. We see JAN 2016, July 2016, Dec 2016, Dec 2017 & the dip in Feb 2017. So…
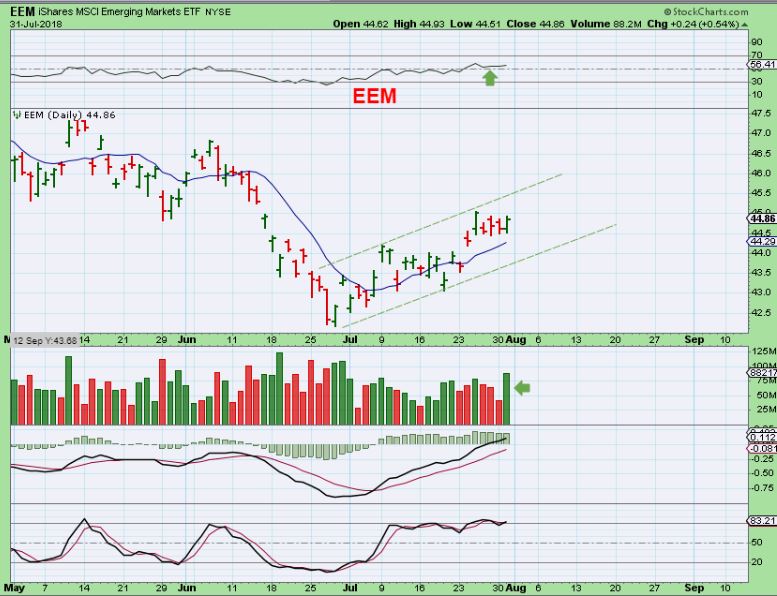
EEM – So I also mentioned that I thought that Emerging Markets had bottomed ( And Miners should soon. Miners are over due for a low). This is the current chart of EEM. I also pointed out that EDC is the 3x ETF for EEM
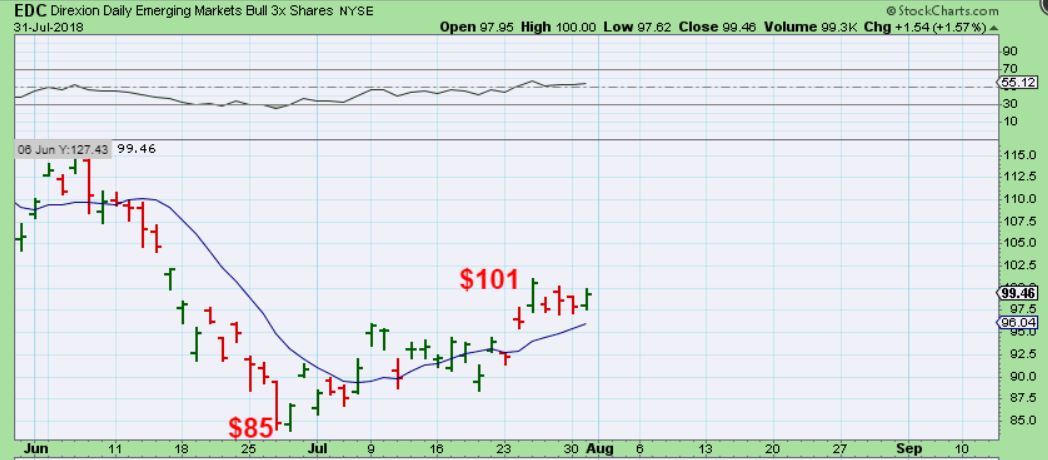
EDC – This was my chart of EDC on July 16 as a buy. I couldn’t tell if we’d just go higher or get a double bottom, but it could be bought with a stop
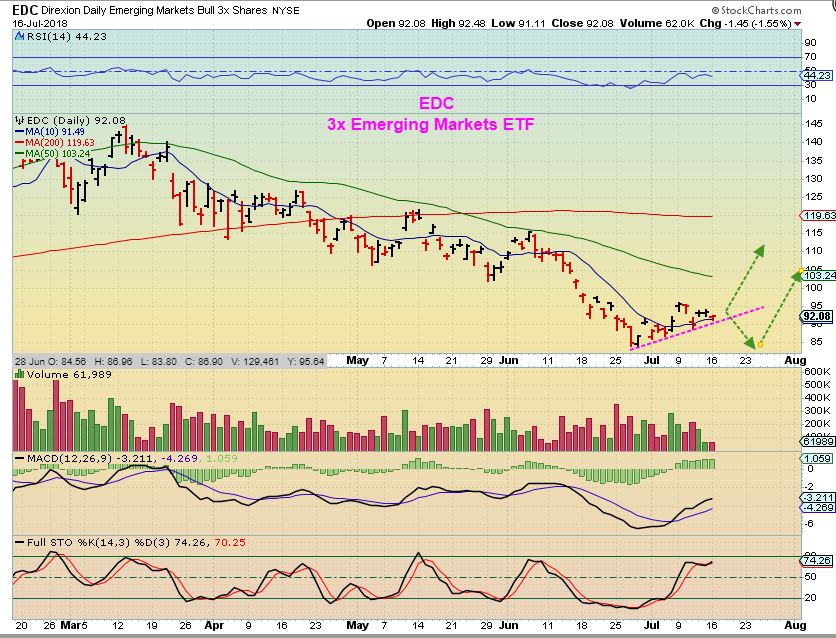
EDC 3x EEM – It actually did a 1 day drop and & then moved higher. So far, EDC has made a run from $85 to $101, and it is still bullishly set up. The chart ABOVE shows the 50sma may act as resistance, the chart BELOW is bullish.
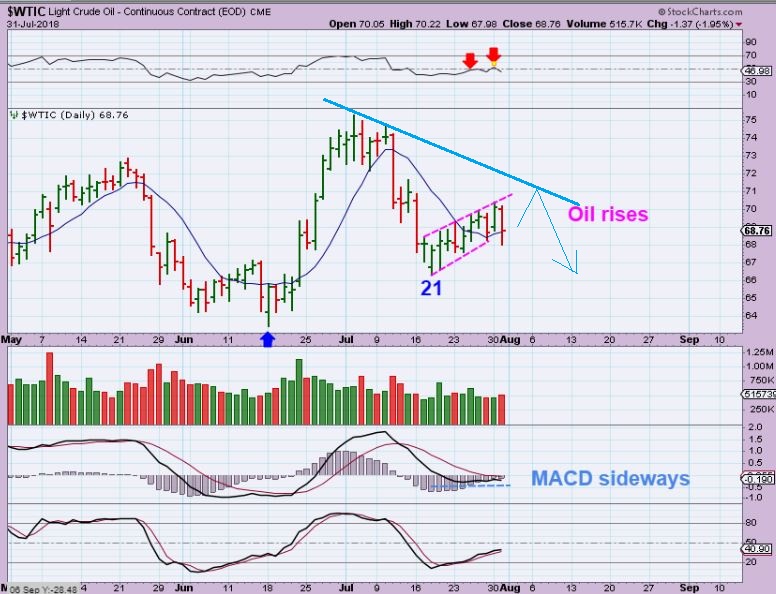
WTIC – Oil dropped Tuesday, but Wednesday is the Oil inventory report, and that usually affects Oils direction. Even if Oil pops, I am expecting a drop soon, and not a rally to new highs.
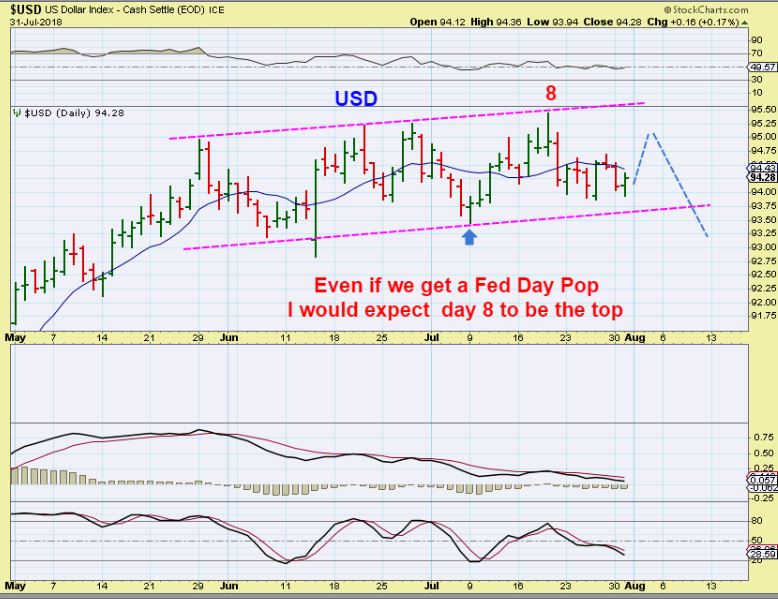
USD – Honestly? This chart looks short term bullish, but the MACD looks weak longer term. Today is the FED MTG, and I do not expect any surprises, so we’ll see what happens. I have been expecting the day 8 peak to hold as the highs and a drop to make this L.T.
FOMC MEETING– So we are expecting no change in interest rates from the FOMC MTG, and talk of a hike in September. With this all figured in, we just need a catalyst to start Gold moving higher.
GOLD – I would say that almost any move of Gold higher above $1235 is quite bullish. It breaks the trend line, the 10sma, and could start some short covering. How did GOLD get this reversal yesterday?
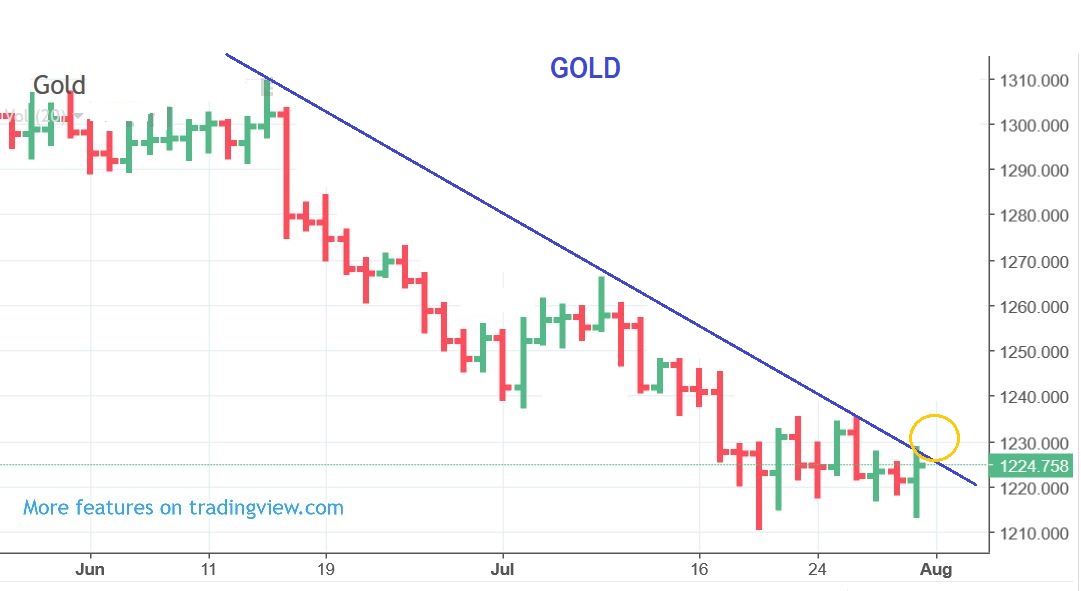
GOLD PRE-MARKET TUESDAY shot down and immediately reversed higher, as shown here. You may see that type of volatility on a FED DAY. Did the selling run some stops and then Buying took place? That may be so … 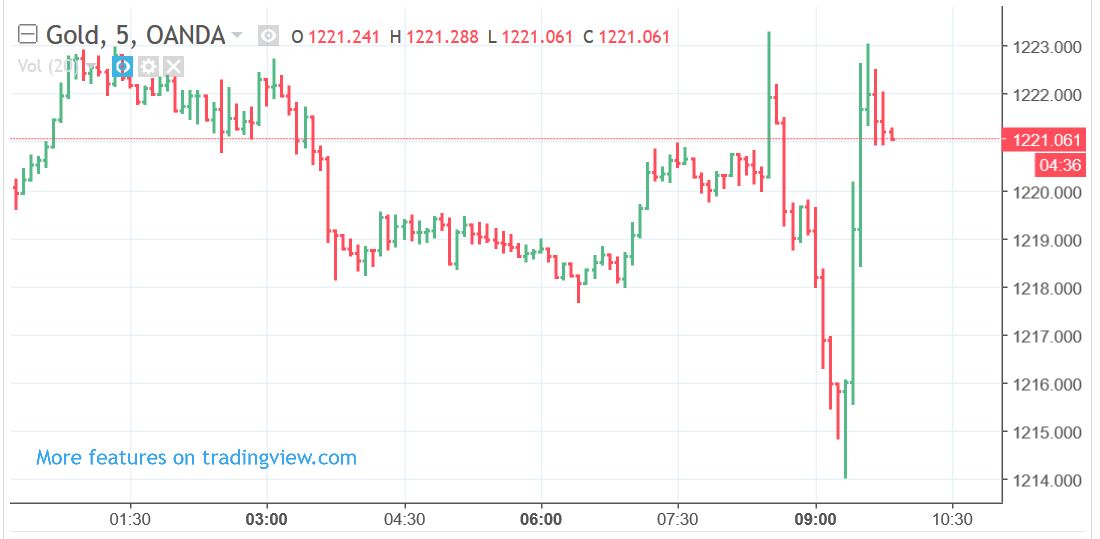
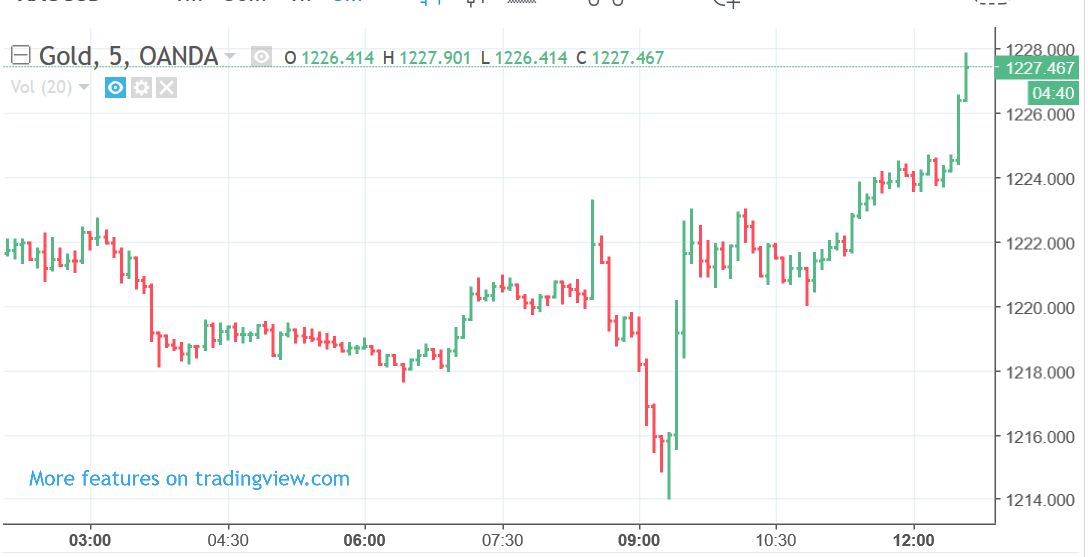
GOLD then went sideways and eventually took off higher. You can see how volatile Gold is acting intraday, and on a FED WEDNESDAY I don’t think that we should expect anything less, especially at 2 p.M. eastern time.
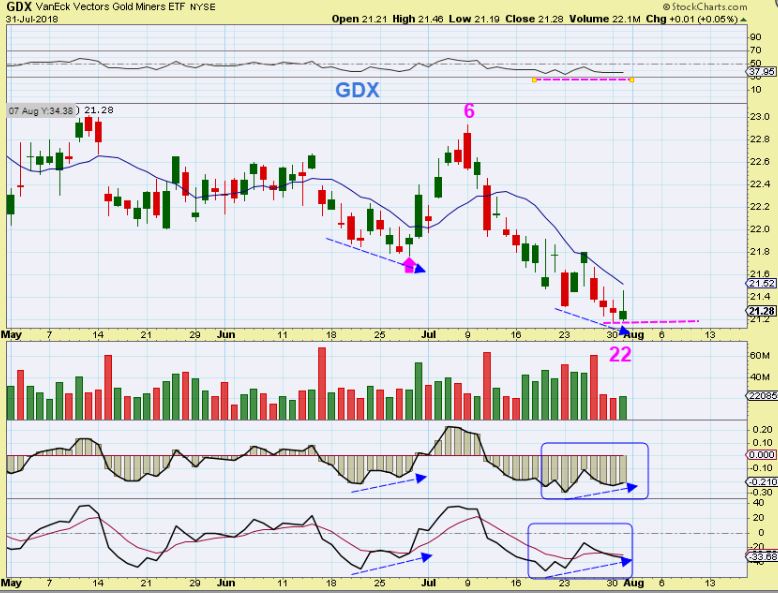
GDX – The divergence in June started a rally in June. We do have divergence now in the GDX & GDXJ. GDX timing is also into the 20 plus days from the last low and a DCL can occur in this area.
INTERESTING CHARTS – I wanted to review some charts of various Miners at this time. Are they ugly? Are they overly Bearish?
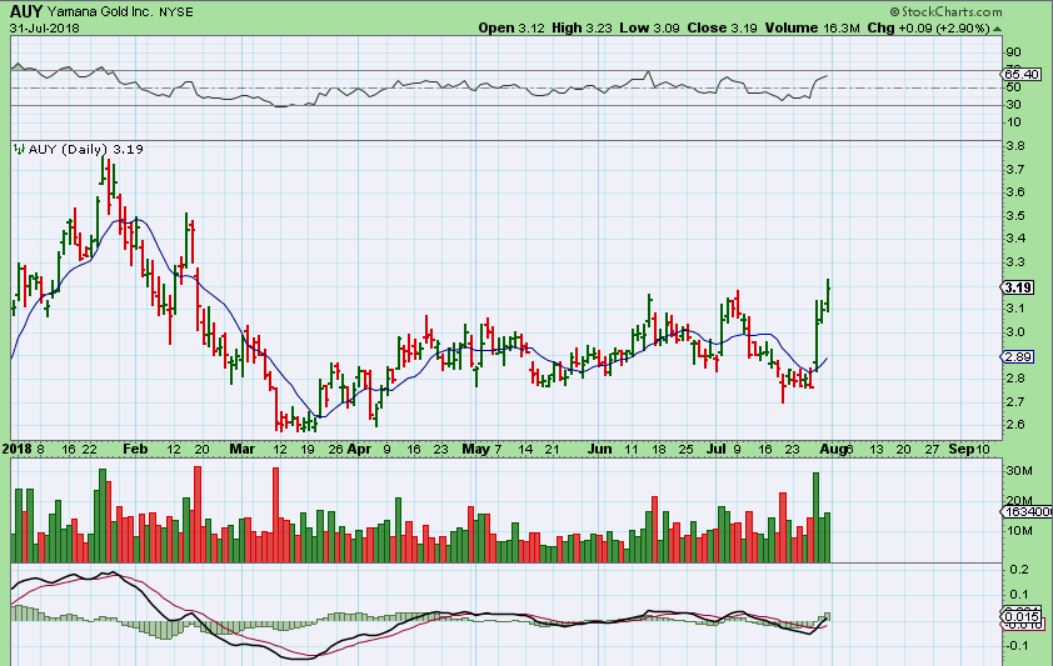
AUY – AUY released earnings, Popped, and began to move higher above the 50sma. Would it have any follow through without Gold running higher?
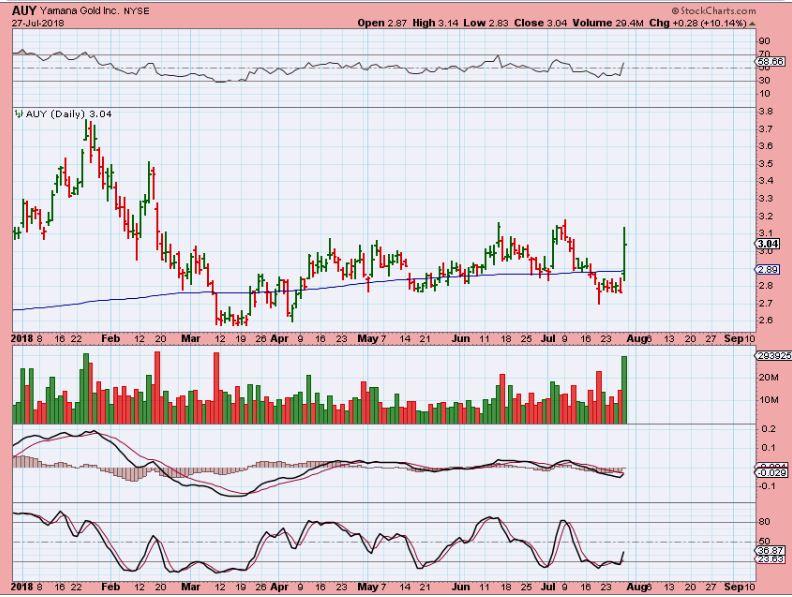
AUY – Yes it has and it is breaking above a base. This could form a large cup, with a run to $3.80. When GOLD Confirms an ICL, it could just break higher & keep going.
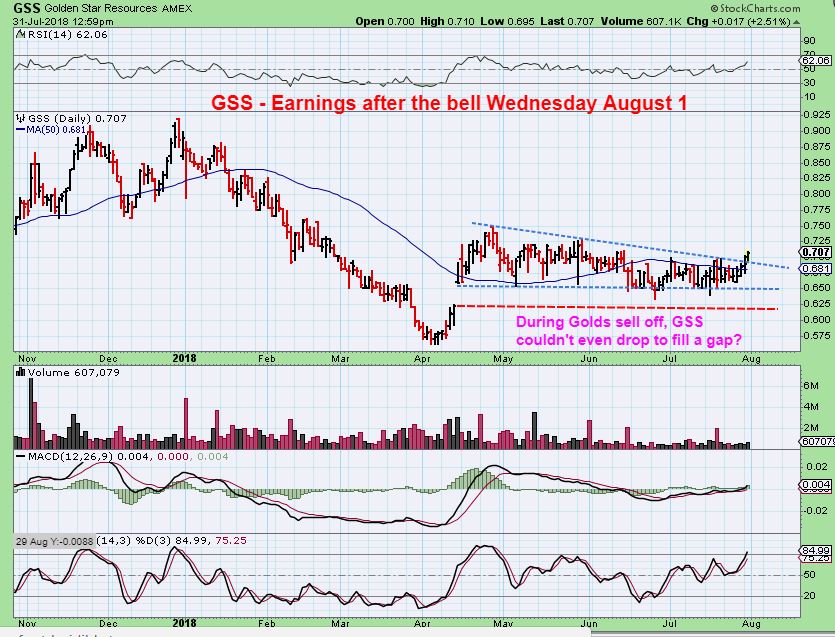
GSS – I mentioned this one a week or two ago. GSS cannot seem to fill that open Gap, even with Gold selling down. That is bullish, so you may want to keep an eye on this. I WOULDN’T BUY IT YET, earnings are after the close today .
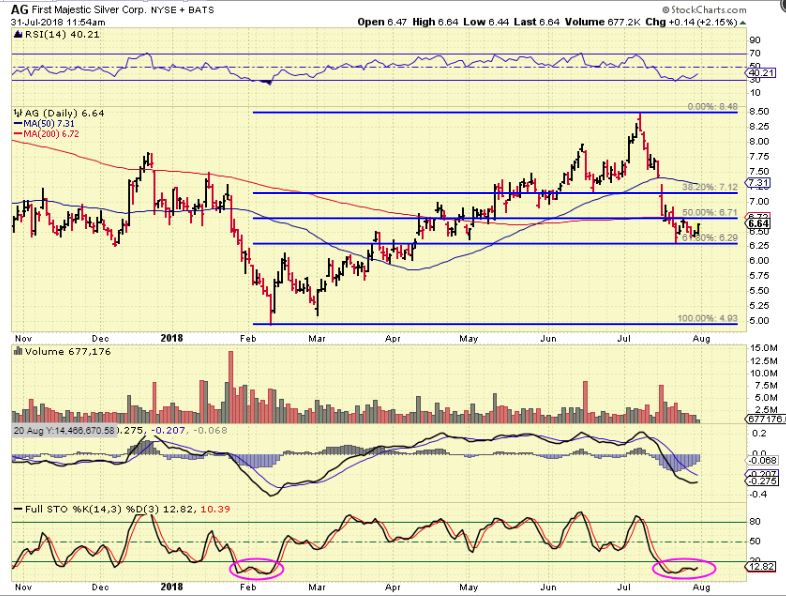
AG – AG has done a 6.18% retrace of its recent run higher. It is hard to see it on the chart, but the 200sma is just overhead, and I think I would wait for a recovery of the 200 before taking a new position. An ICL in Silver should help to repair recent damage, but AG is now on sale, and maybe for the last time, if you wanted to own it. It was at $6.64 Tuesday.
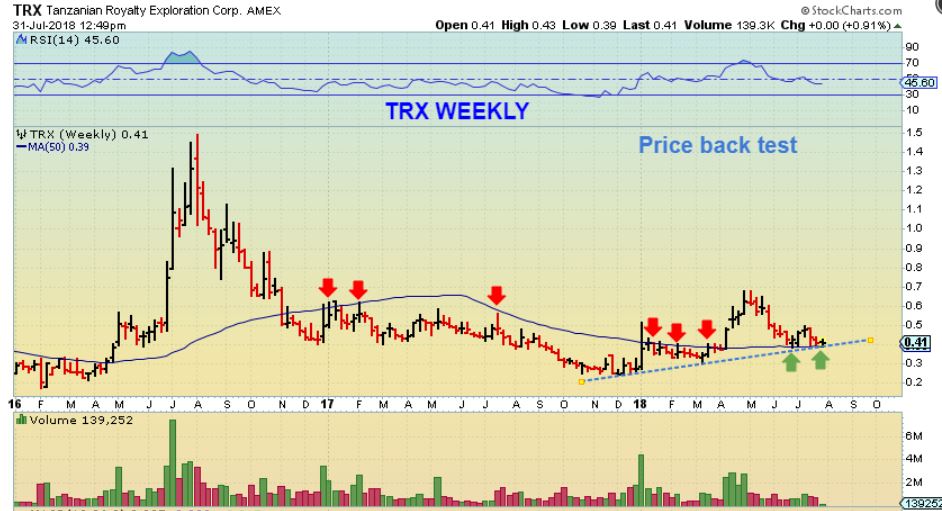
TRX – I own this and the chart looks bullish. This chart is gaining traction since the Dec ICL and looks to be back testing the 50 weekly MA. It currently sits on support.
SIDENOTE: YES- I AM WORRIED ABOUT SOME OF THESE SMALLER COMPANIES NEEDING FUNDING. THERE IS ALWAYS THE RISK OF A PUBLIC OFFERING, WHICH LOWERS THE SHARE PRICE. FOR EXAMPLE, I BELIEVE THAT TRX IS POSITIONED FOR GROWTH, BUT THEY WILL EVENTUALLY NEED FUNDS TO DO SO. WILL IT BE FUNDED BY SECURING A LOAN OR BY A PUBLIC OFFERING THAT LOWERS THE SHARE PRICE TEMPORARILY?
That is usually not known until later. What I have seen in my experience is that we see Public Offerings during the 2nd or 3rd daily cycle, after price has run up out of the lows nicely. Is that just a coincidence, or does the company do a public offering after price runs up, because it looks more attractive to the interested party? I do not know, but this is something that I have seen in the past. In the past I’ve been riding a Miners out of an ICL for 2-3 months with great gains, and then suddenly it opens up down and takes a good chuck of those gains back with a public offering. This is why I always have a basket, or stick with ETFs to avoid that issues. I still make great money with a basket, even after that happens.
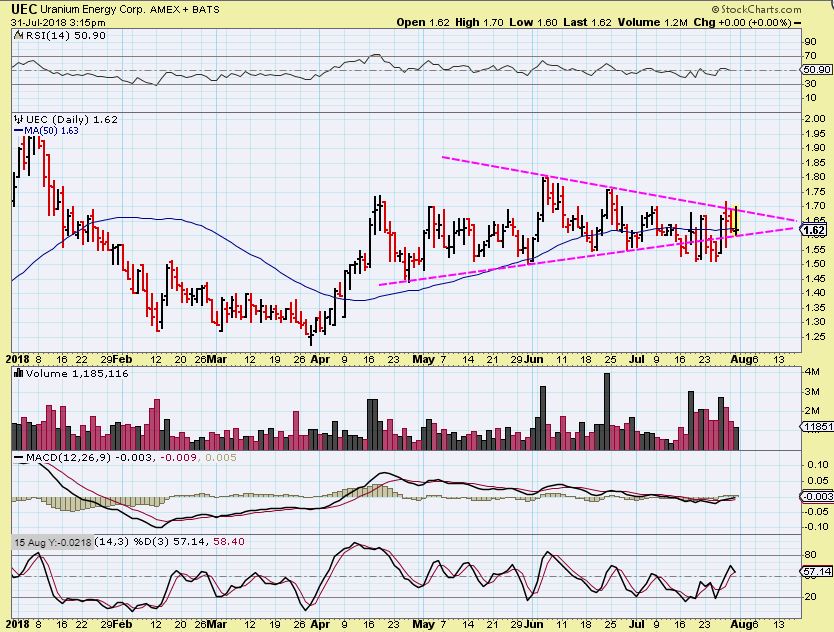
UEC – The Uranium stocks are still bullishly set up too.
So here we are, Literally Fed Up with precious Metals on a Fed Wednesday. The set up for Precious metals is ripe, we just need a catalyst of some sort to get this party started. Lets see what Fed Wednesday may bring.
Enjoy your Wednesday trading!
~ALEX
REVIEW OF SOME RECENT PAST GDX CHARTS
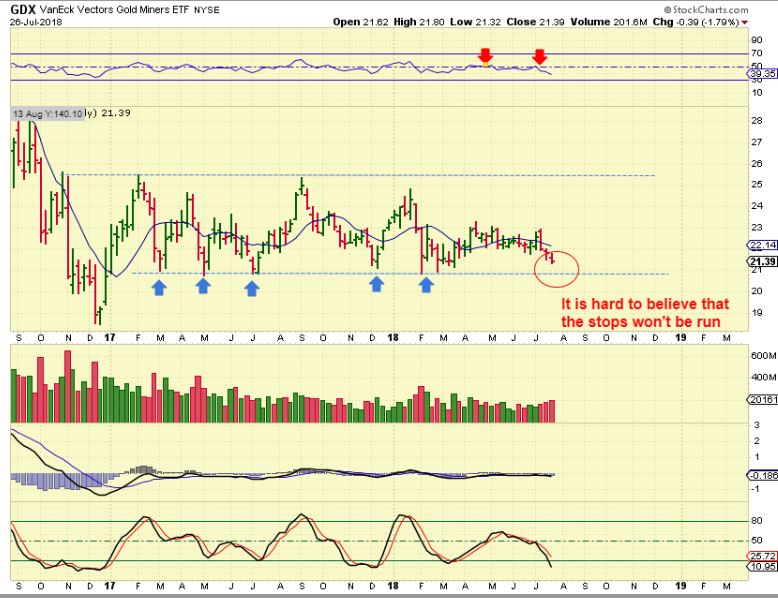
GDX – On July 26th, only 1 week ago, it just seemed like Miners would drop, and why not run those stops? It seemed likely, right?
GDXJ WEEKLY – Also last week, the JULY 27 weekly chart of GDXJ shows it landing down on a support area too. This is where past ICLs or rallies started.
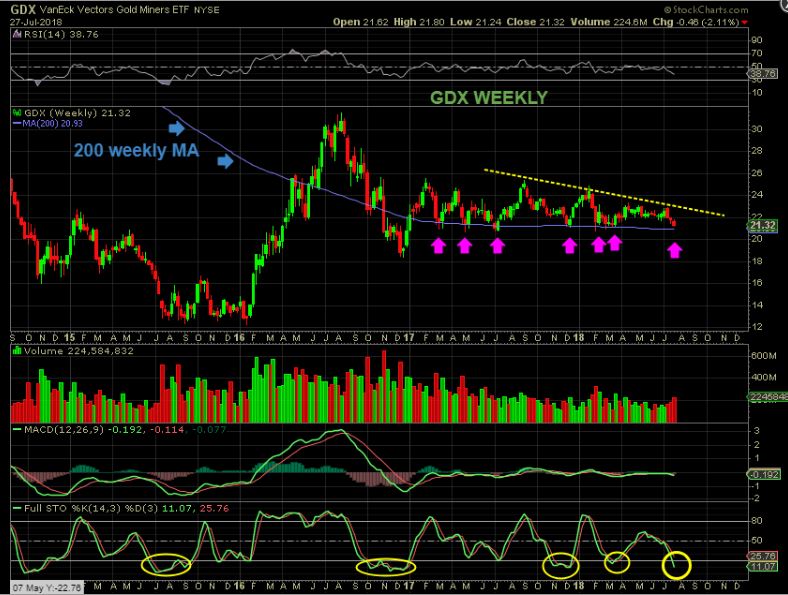
GDX – And here we are landing on that support zone and we just have to wonder…
1. Will this area act as support and hold again? Like it has for almost 2 years!
2. Or will we do a quick flash shake out & run the stops of 1.5 years?
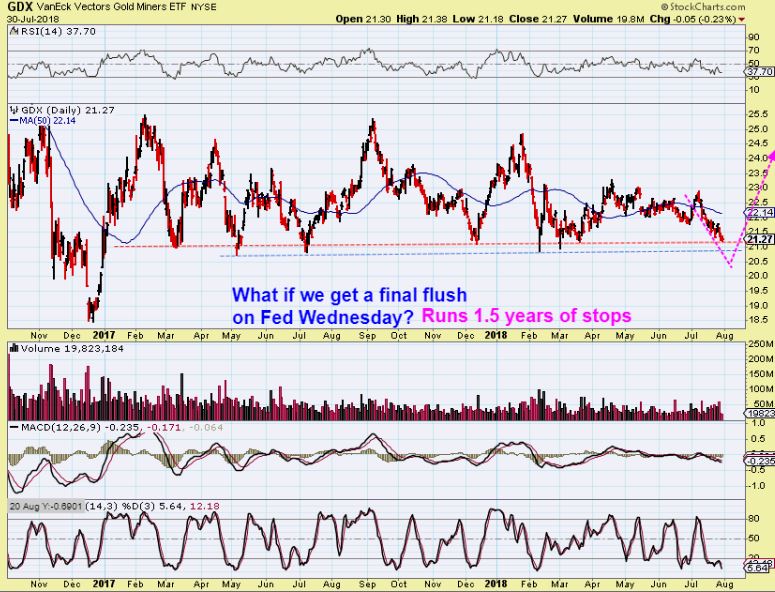
I would have to think that these stops would be taken out so bigger money can take bigger positions, but the drop should be short lived as buyers step in to accumulate positions. An example of this is to take note of how small the break to the blue line is, when running stops on the red line. Last Feb broke Dec lows for a day. Prior drops to the blue line to shake out the red line lows was quick too.
Tuesday July 31st – The Triggerfish 
 August 2nd – BOTTOMS
Scroll to top