Pick An Emoji
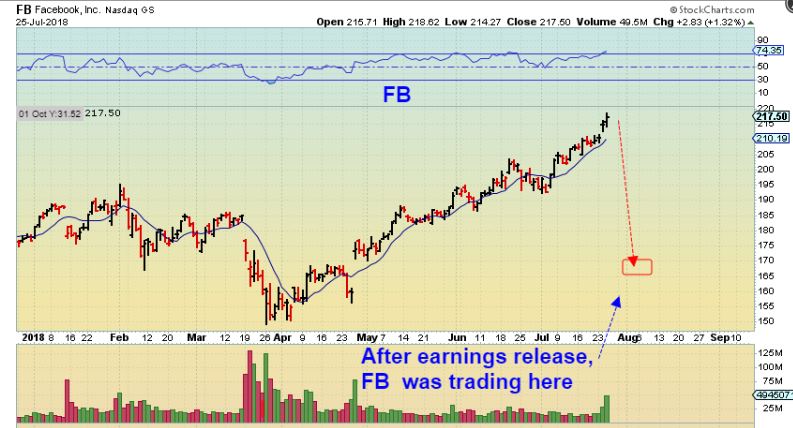
Talk about a love / hate relationship and you’re talking about being a disappointment during earnings. They love you when you perform well, but it’s a different emotion when your earnings ‘miss’.
.
Facebook released earnings on Wednesday night, and it was set to open about $50 lower. We’ll just have to wait and see how things shake out during the regular markets hours, but this is where it would open at this rate. Talk about “filling that gap at $170”!
On to the markets…
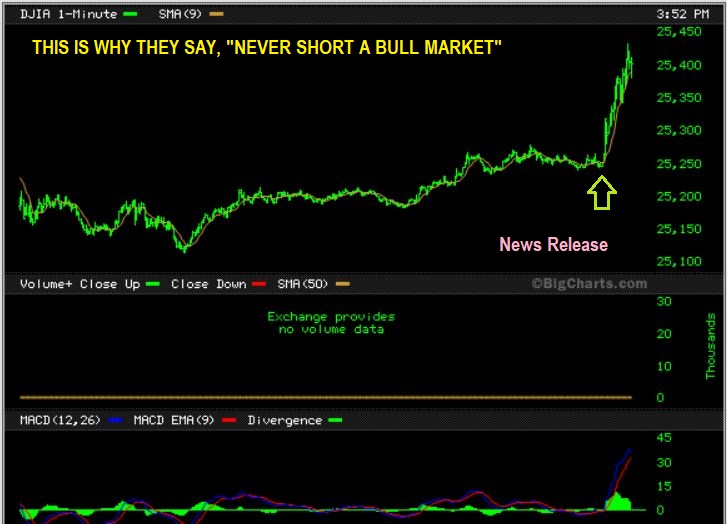
We’ve all heard these words before , “Do not short a Bull Market, surprises come to the upside”. Wednesday was a good example of why that saying is so popular. If a market is due for a drop, it can be topping for a while, and it would be best to wait for it to break. What happened Wednesday?…
.
All day long the General Markets ( SPX, NASDAQ, DJIA) did not fall down below the 10sma on a daily basis, so the ‘longs’ were not stopped out , even if they had tight stops at the 10sma. The markets started going sideways, and suddenly the markets surged higher on the afternoon news headline –
“EU agrees to cut Industrial tariffs”
DJIA – This is a 1 minute chart of the DJIA at that announcement, and you can see the surge that took place here. It ran straight up.
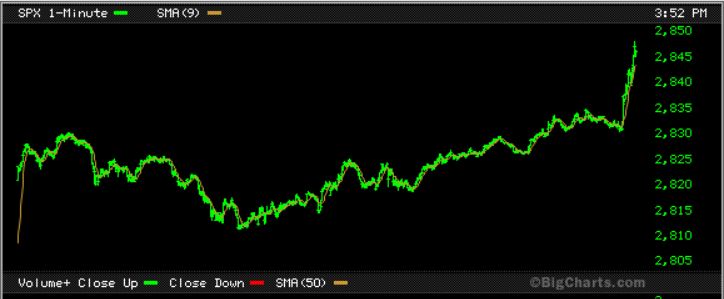
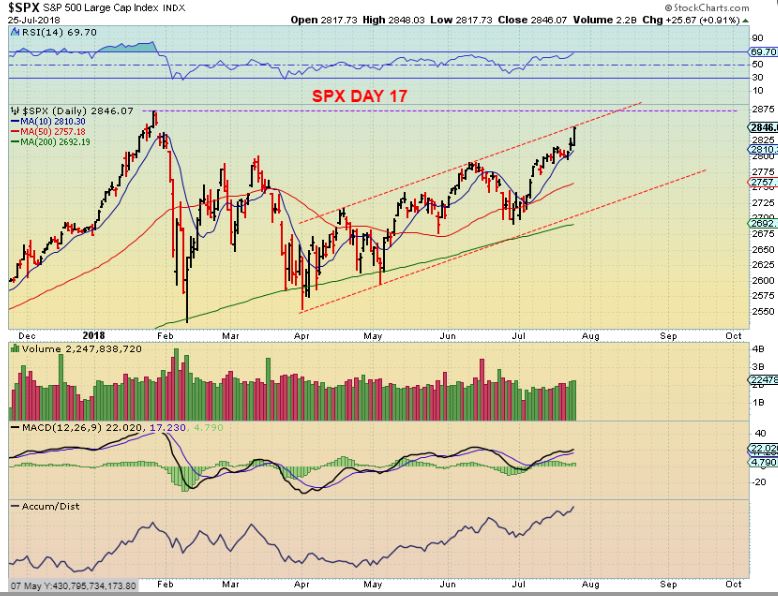
SPX – The SPX also ran straight up, so what did this do to the daily charts? Well, they closed near the highs, but I still wonder if there will there be follow through, or is this a final surge on ‘news’? Let’s go to daily charts and discuss this further…
.
SPX – The SPX has finally reached that channel line. It could ride up along that line to the January highs, and THAT could make this a R.T. Daily cycle, but it also could roll over after that ‘news’ burst. On day 17, a drop from here can still make this L.T. on a 35 -40 day daily cycle (not uncommon). Continuing to drift higher would begin to change this to a R.T. Daily, so we’ll be watching this play out. “longs” can still continue to ride with a rising stop (or sell partial or all at this upper trend line if you wish).
NASDAQ -The NASDAQ is at the highs too, but I noticed today that you can draw it with 2 sets of ‘peaks’. The blue line peaks or the Magenta line peaks. Some earnings ‘misses’ are causing after hrs prices to drops, others seem to be good. The NAZ futures were down 60 points by the time I started writing this (Choppy fickle markets?) . Either way, I would still recommend just riding it long with stops in place. You would still be in this trade from the dcl.
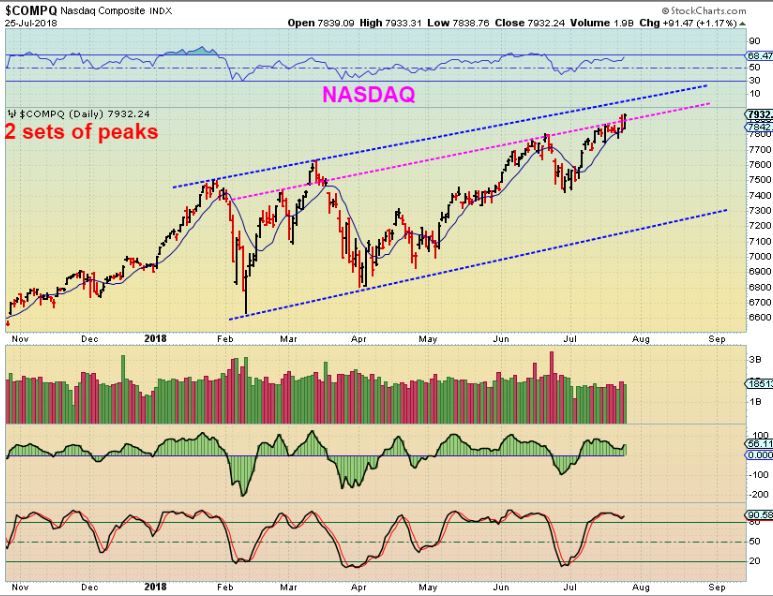
Note: AFTER HRS SAW FB, TWTR, AMZN down- QCOM, AMD up. Mixed bag.
Click to enlarge: Notice the NASDAQ futures are down 60 points on Wed night, and the VIX is green. We’ll see what the morning brings.

.
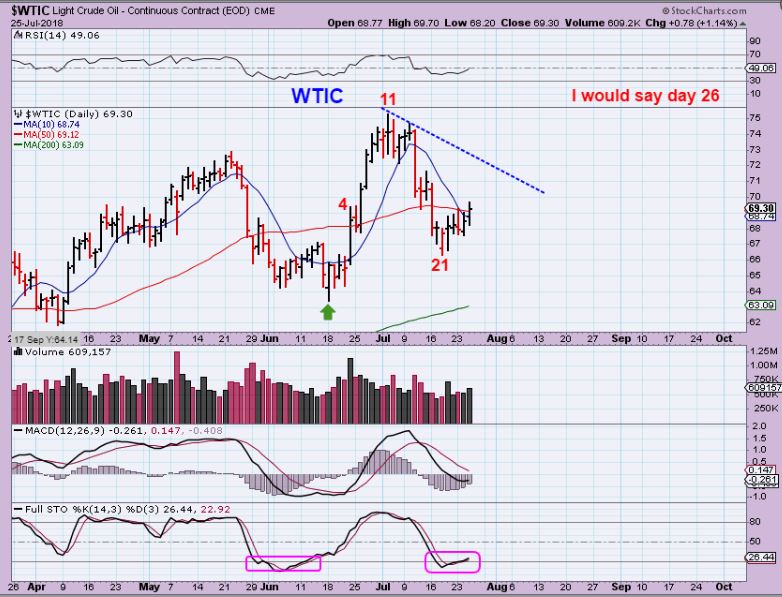
WTIC – I think that day 21 is really just too early for a dcl. We have had the expected drop, and now a bounce to the trend line may occur, we’ll see if that trend line holds price down, I do expect a deeper drop into the dcl. Could be an a-b-c to the 200sma.
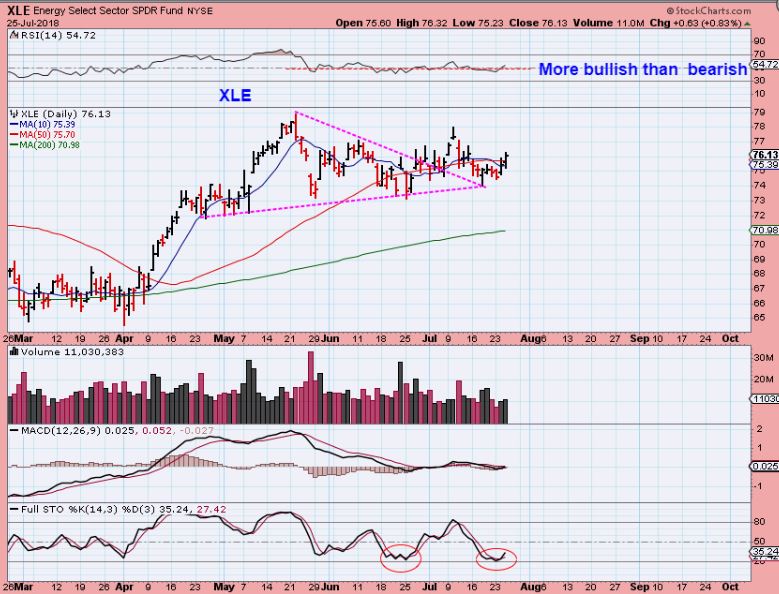
XLE ( OIH does not look nearly as good) – Oversold and sideways chop, I am not playing this sector. It does look due for a bounce. Some energy stocks really got hit with OIL, others are holding up. The XLE actually looks ‘o.k.’, but I am not trading this sector under these set ups.
.
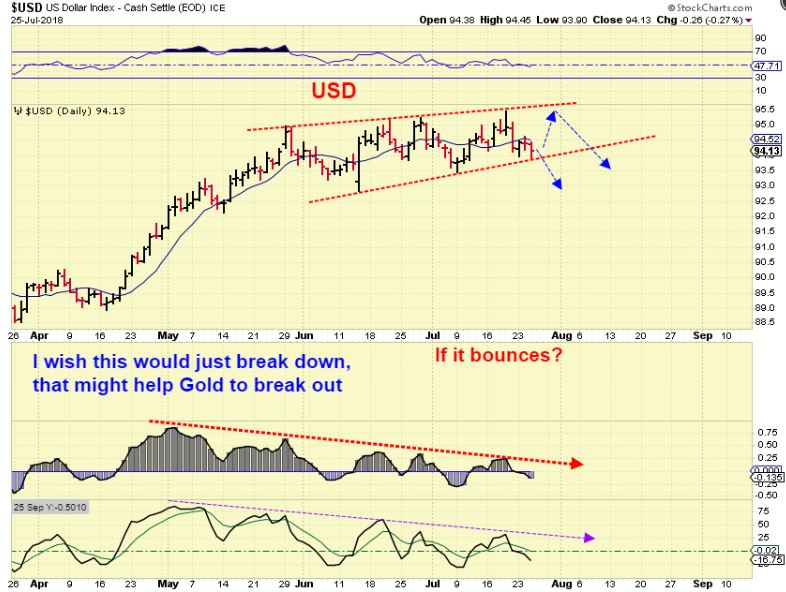
USD – We have a day 8 peak, as mentioned in prior reports. The Dollar is selling into a dcl, but a small bounce at this trend line isn’t out of the question, but I expect day 8 to hold as the peak.
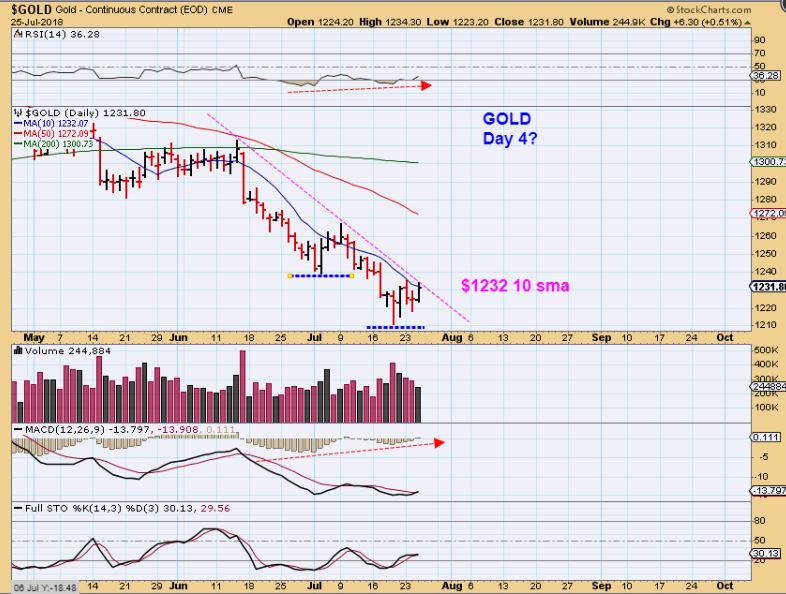
GOLD – Gold has not, at this point, closed above that 10sma yet. I am writing Wednesday night, so maybe it will be above it by the morning. The trend line is right there too. Above $1233 is good, but I’d like to see it above $1240, because that would look like a clear break.
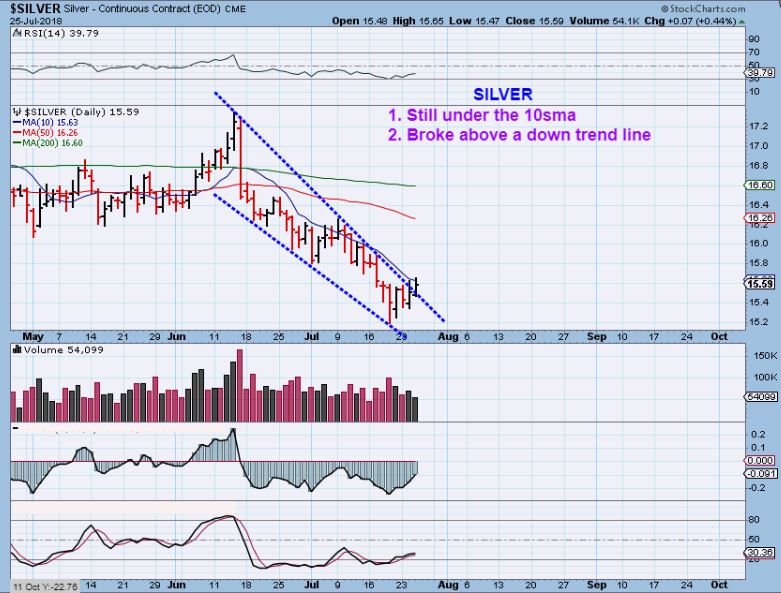
SILVER – Read the chart
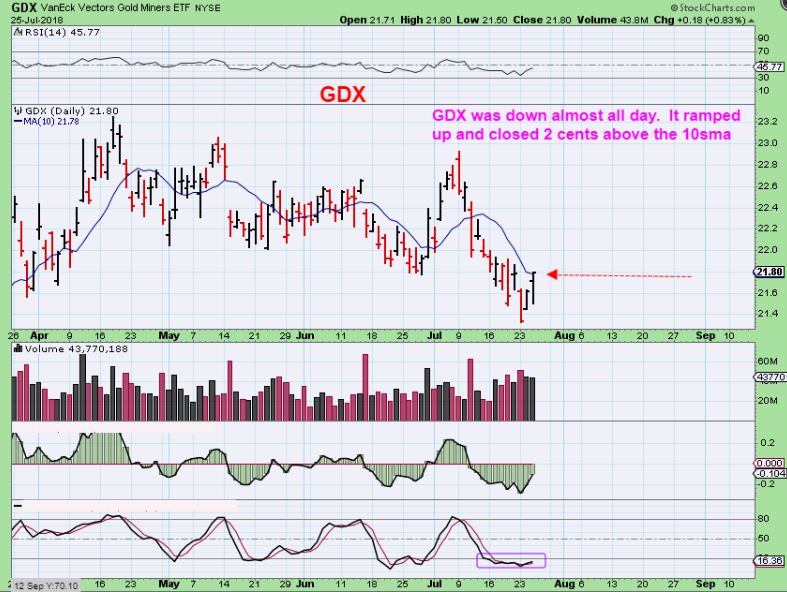
GDX – Read the chart. MAYBE DAY 2? By closing over the 10sma, it becomes a buy, but I would put a stop under Mondays lows. You can use a tight stop, but you may get stopped out early.
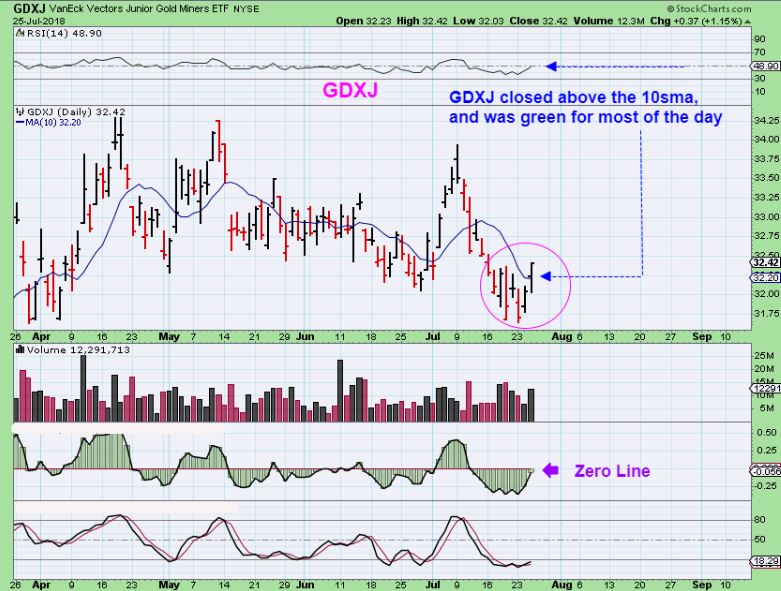
GDXJ – Read the chart , GDXJ actually looks pretty good above the 10sma and closing at the highs. There is no clear trend line, but basically the down trend is broken.
.
The General Markets have become very interesting, since we got a peak on day 17, but we are at the upper trend line & have had a mixed bag of earnings. Add to that the idea that the NASDAQ futures were down 60 in after hours, right after surging higher with the ‘news’. Will the true market direction please stand up! We are due to drop into a DCL soon.
With the Precious Metals, we are looking for follow through. We got a close above the 10sma in the Miners on Wednesday, we want Gold to do the same. We are over 7 months from the DEC ICL, and the COT is bullish for Gold. Time is running out and we’d rather see a ramp higher than a continuation of this bouncing around at the lows.
.
Enjoy your Thursday trading !!
.
~ALEX
.
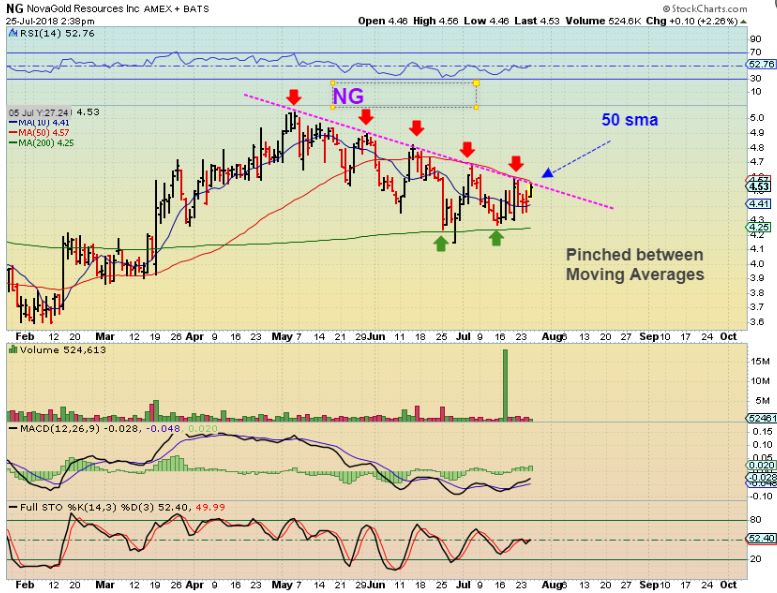
NG – I think that NG would be a buy on the break out above the 50sma & trend line (with a stop at that trend line), or if it drops back down one more time, it can be bought at the green 200sma. I would wait until IT SHOWS SUPPORT or reverses, just in case it does a shake out. Let it show strength in that area first and maybe use a bit of a loose stop below there, until it gets moving higher.
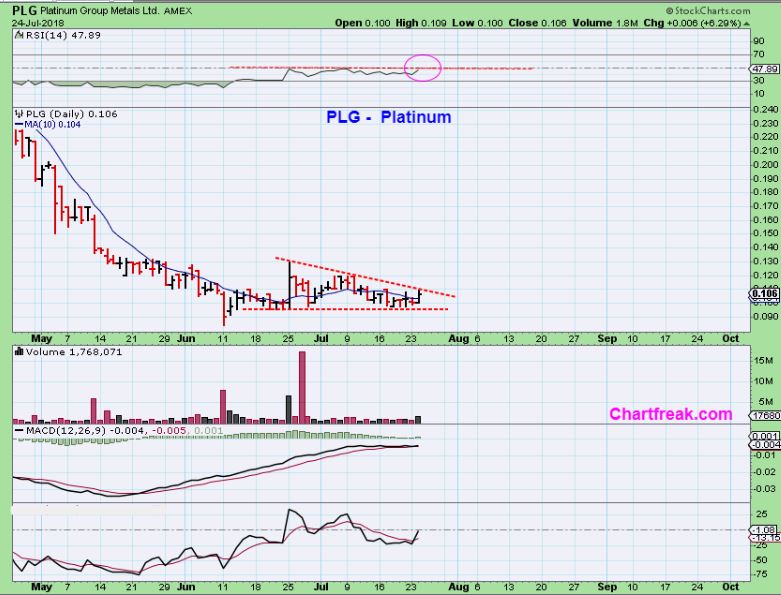
PLG – I meant to put these in yesterdays report. They could be called ‘lottery tickets’, simply because it is a 10 cent stock, but this really looks explosive, pushing on that 50sma. I bought some ( It is not an OTC stock , but they were warned of a de-listing. They are working on ‘compliance’ and I think they have until October.
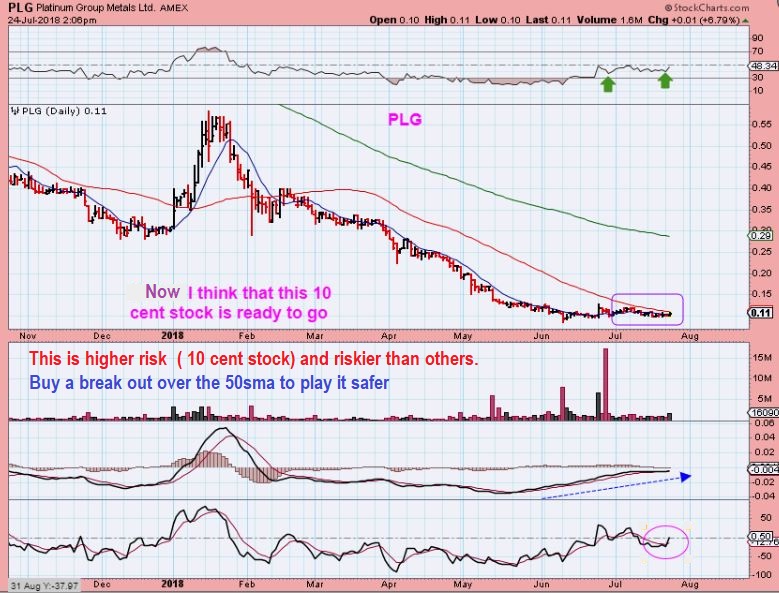
PLG – This is a close up. It is forming a wedge and is near the Apex. It was trapped under that 10sma for quite a while, and now popped above it. I’m just going to buy & hold (Unless it really fails, rolls over & dies).