Beautiful At The Top
I am not saying that we are at THE TOP, but I have been saying that we could be due for A top. One thing that I have found to be true when trading the markets is this: It is always Doom & Gloom right before a bottom is in place, and Everything is Beautiful when we are at or near a top. Right now the buzz is all about bullish earnings, and how you need to be buying the stock market bull run. Well, we were buying at a dcl 3 weeks ago, but now? I discussed my thoughts on Googles earnings yesterday, so lets look at the charts and see what they are telling us…
I’m going to start with GOOG, because all the buzz on Twitter and in trading forums Monday was how it shot up $70 after hrs on Monday, and now GOOG & the NASDAQ would just blast off higher. People were saying that you need to just “buy this Bull Market”. I wrote last week and in Monday nights report a bit of a different take on things, including Googles $60 Gap after hrs…
GOOG – I used this chart to show that it GAPPED OPEN last October after a long sideways chop, and then it just stalled, went sideways for weeks, and drifted down to fill the gap over a month later. It didn’t start a giant rally then, and may not this time due to the ‘timing’ of things.
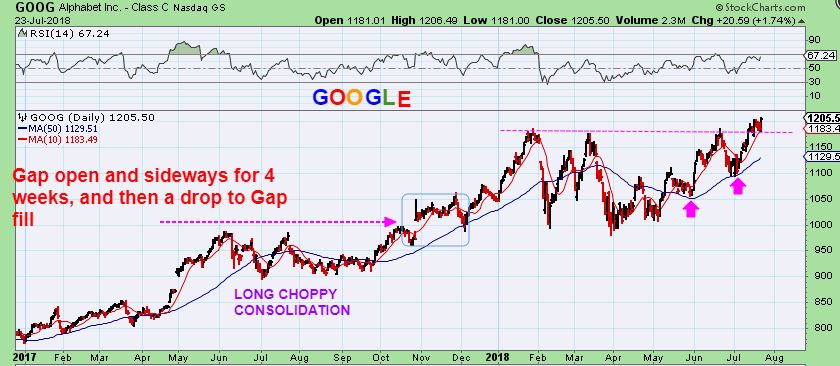
GOOG – Tuesday, Yes Google gapped up but it formed a Black topping candle. Black candles at the top of a move usually exhaust or end the move. I think that GOOGLE is going to stall and drift or drop soon.

Now let’s look at the rest of the markets…
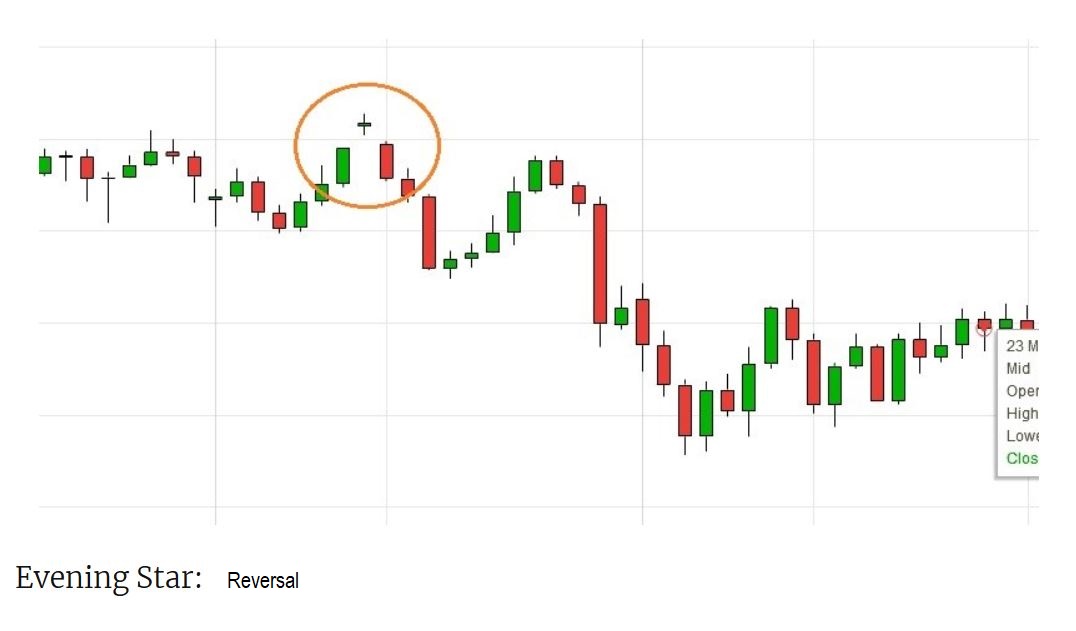
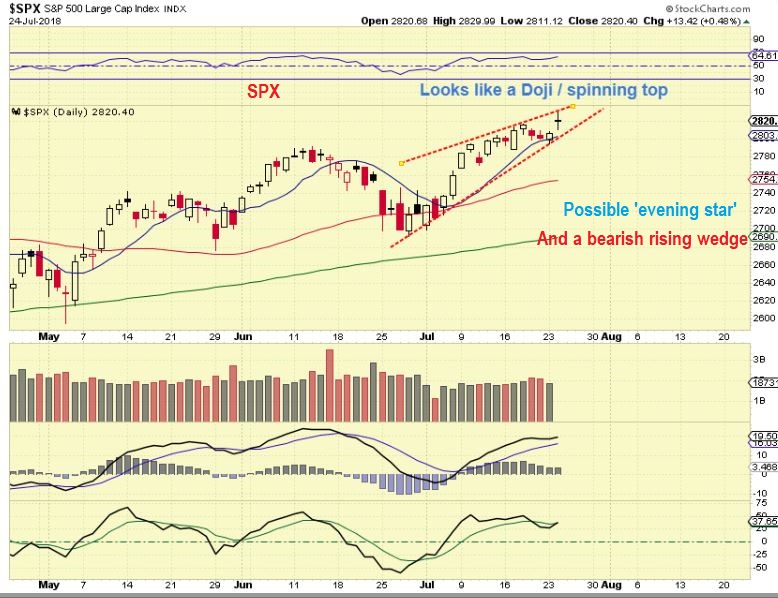
I want to start by showing you an ‘Evening Star’ or also it may be a ‘Doji’. Often retail investors see that Gap Higher and think that it is bullish & powerful, but it usually is not.
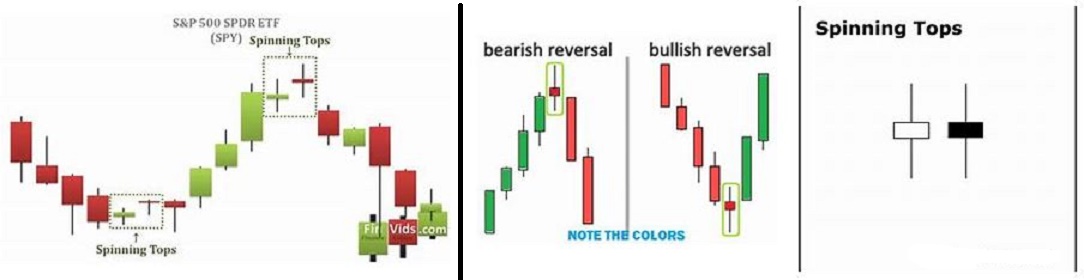
Let me also show you ‘a spinning top’, see the examples below. These indicate that the force of the prior trend is weakening & is indecisive. Often Smart Money can be unloading to dumb money at a top like this.
SPX – Look at Tuesdays candle. Looks like a spinning top, a doji, maybe even an evening star at this point. It Gapped open, and smart money probably sold it off. This was Day 17 & may be the ‘peak’ , please read the chart. This also may be a wedge.
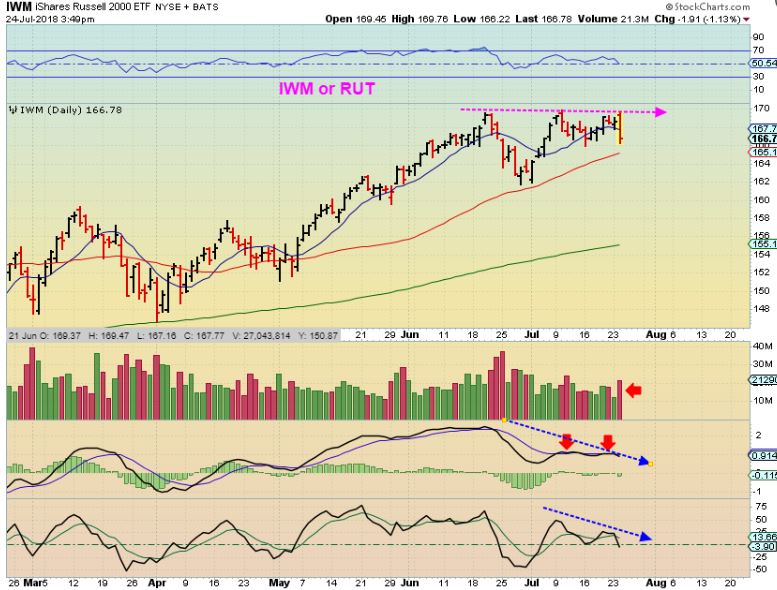
THE RUT ( or IWM) – The Russell 2000 did not have a good day at the top & look at the MACD. Momentum has been dying, not thriving.
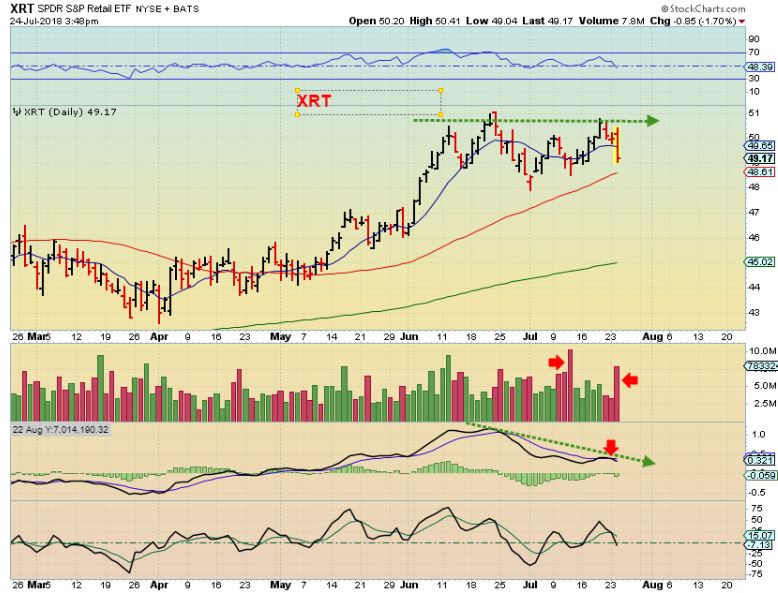
XRT – Another sector that doesn’t look great with the earnings season upon us. That was a weak double top, based on the MACD.
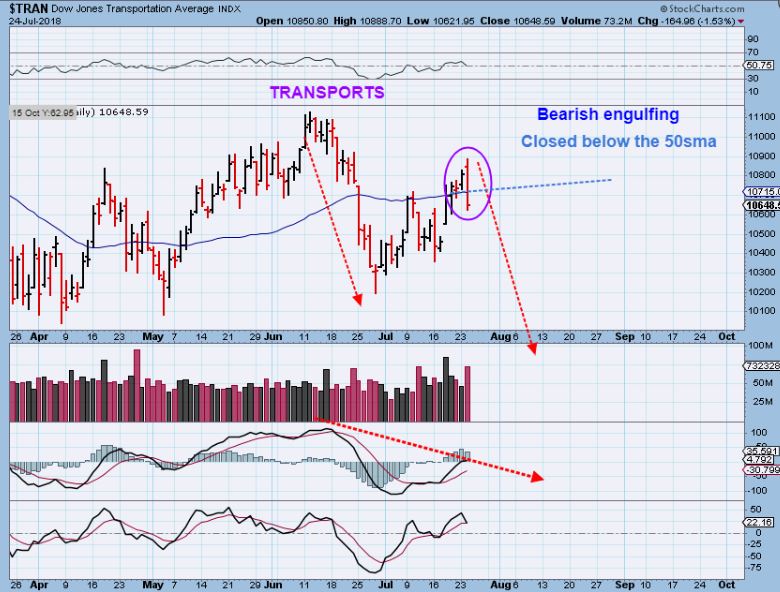
TRANSPORTATION – Signs are now showing up everywhere. This has been choppy and sideways for months.
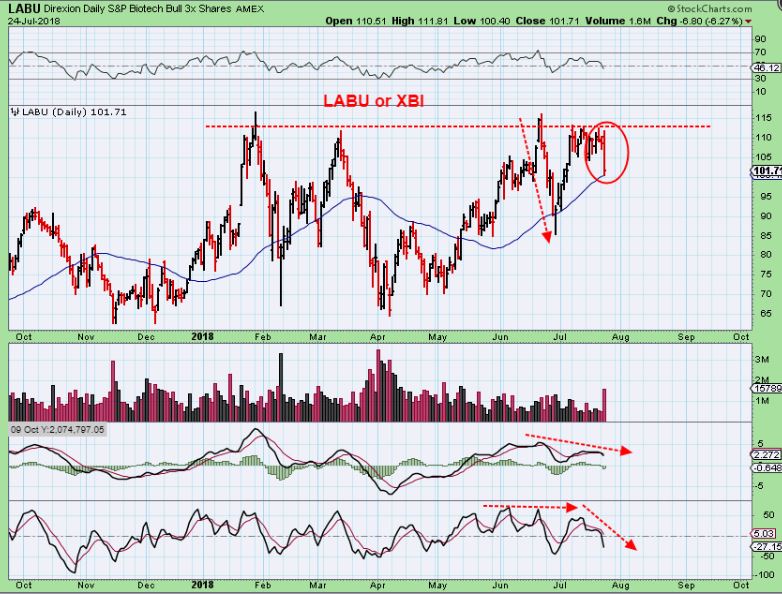
BIOTECH– We have seen large rallies and equally large drops in the XBI ( or LABU) all through 2018.
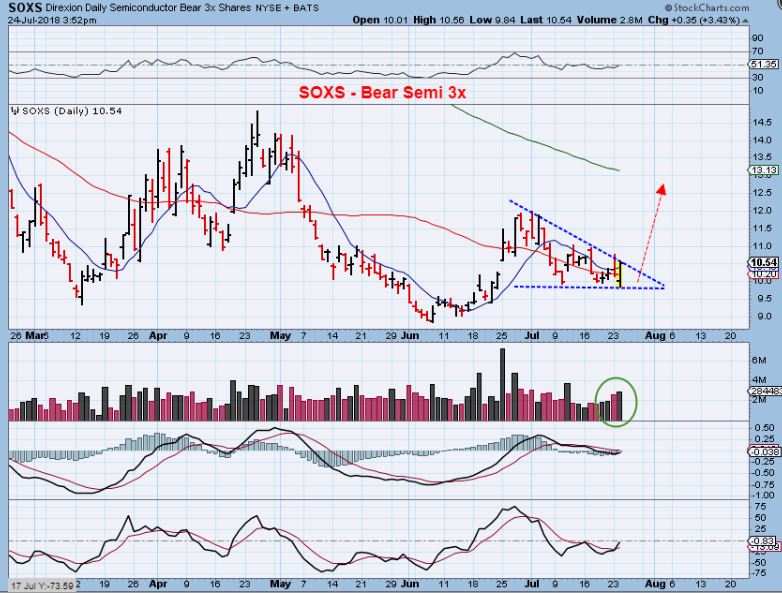
SOXS- And the Bear 3x Semiconductor chart actually looks bullish ( bearish for Semiconductors).
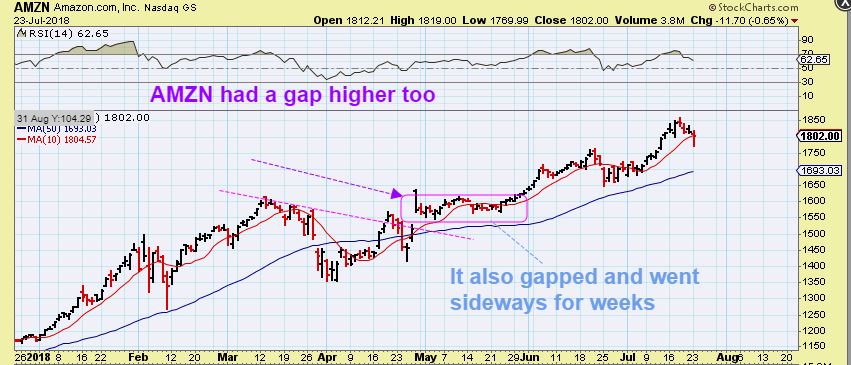
As a sidenote: AMZN has earnings this Thursday. It may do as well as GOOGLE did, but it also Gapped up in the past and went nowhere fast. My point? GOOG and AMZN may not save the day from a market drop here if the gap open and consolidate sideways for weeks.
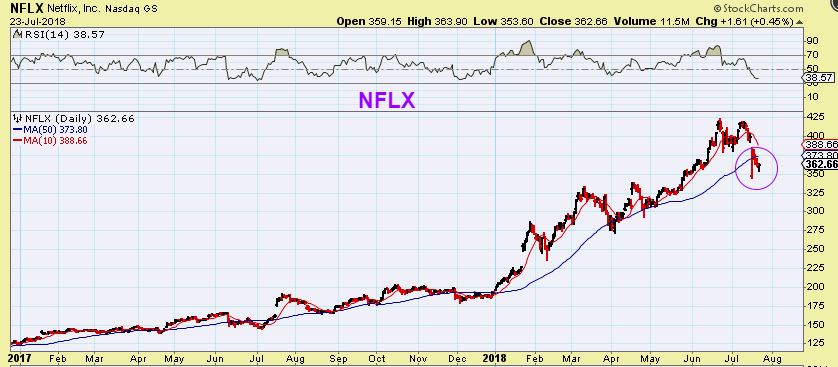
NFLX – And Netflix has yet to recover the 50sma after its double top & earnings drop.
SO I HAVE BEEN SAYING since the DCL, that it is fine to go long, just raise stops, and we’ll see where we are after about day 15. I was expecting a possible L.T. Daily Cycle and a drop to a dcl, and then a possible ICL.
Now I do see weakness, and the IWM, TRAN, SOX, XRT, etc are also showing weakness. I am leaning toward a drop to a dcl from here, and keep in mind that a daily cycle can be 35-40 days long. That could be weeks of choppiness, drifting, or dropping. Stay alert and we’ll see what the rest of this week brings, but I think Smart Money was selling the gap open today. AMZN may give them another chance to sell Thursday A.H.
.
Note: Dips can become buying opportunities later.
.
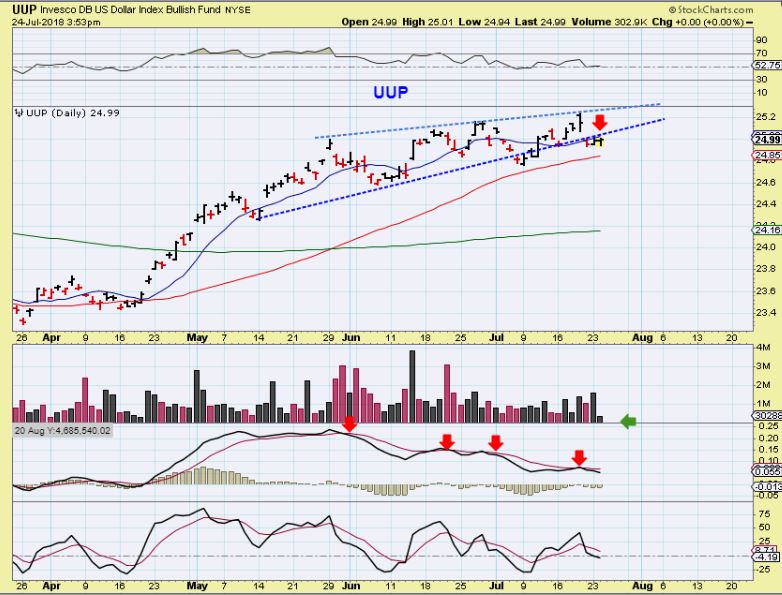
UUP for the USD: The USD looks to be weak and a drop here would be a day 8 peak, quite L.T. This would help the Precious Metals.
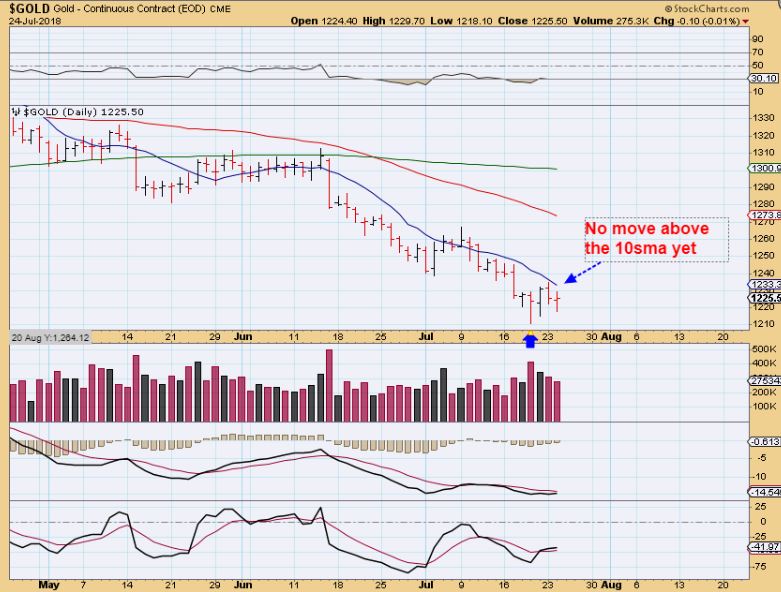
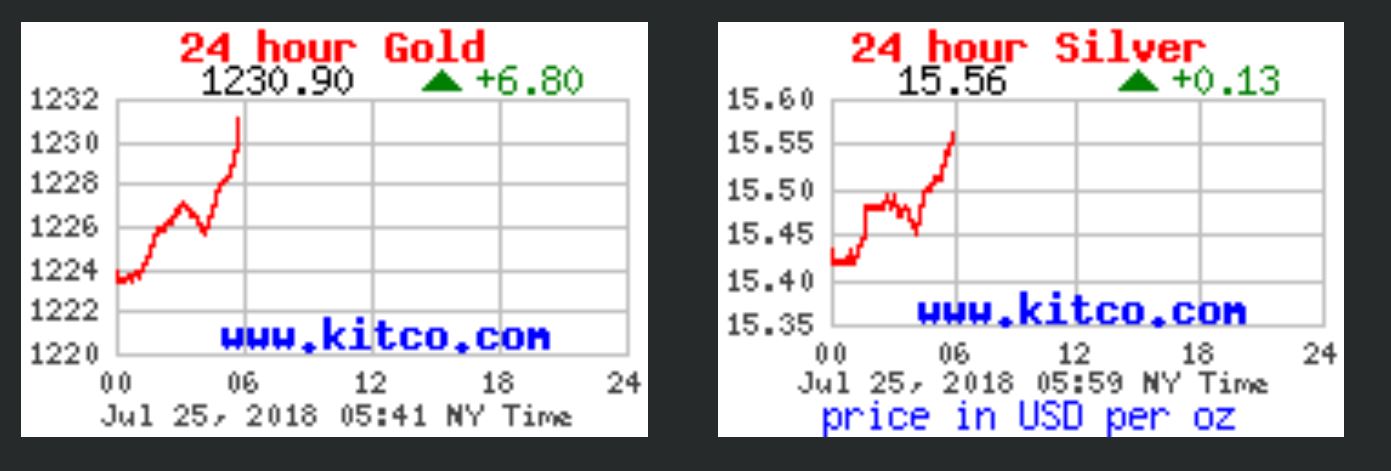
GOLD – A swing low is in place, bit remains unconfirmed, still under the 10sma ( which is at $1233). We need a push higher sooner than later, and we do have bullish divergence, but 1 more quick slam down cannot be ruled out until we make some upside progress.
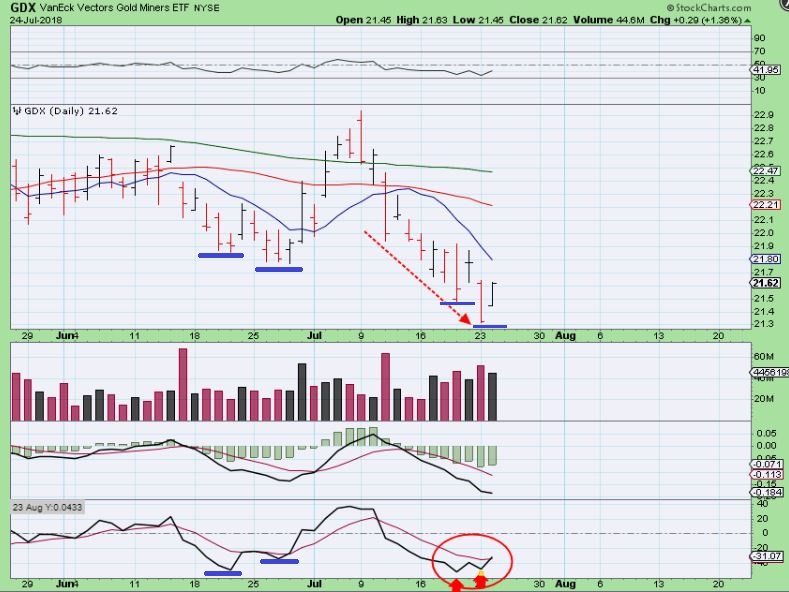
GDX– GDX moved higher today, despite the fact that GOLD was basically unchanged. The lower low Monday has slight divergence on my lower proprietary indicator, similar to Junes double low. It is a bullish start.
GDXJ – GDXJ is also higher with Gold break even. We had divergence in June before a run higher, and we are starting to see some now between the Thursday drop & Monday drop. We need a break above the 10sma. I was asked about ” the light volume Tuesday, is it concerning?” My answer is ‘No’, because…
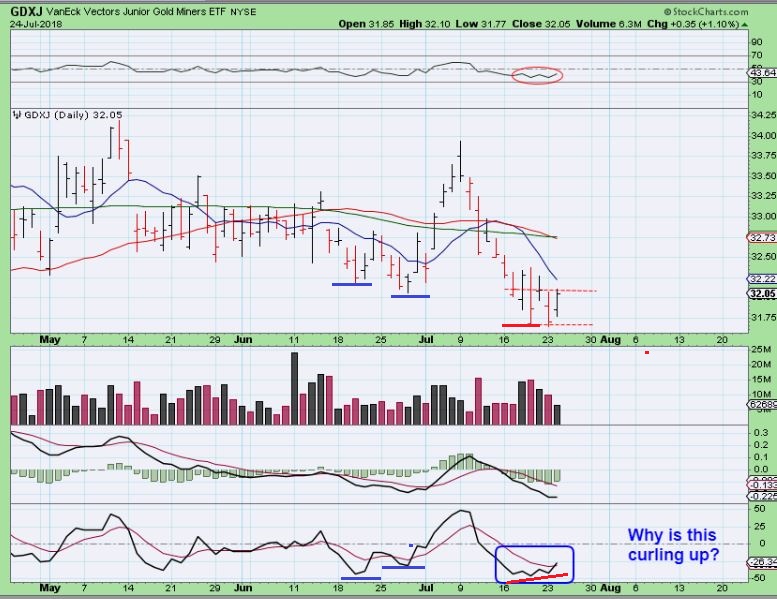
GDXJ DEC ICL 2016- I have seen very light volume at an ICL on day 1, 2, & 3 right before a large volume burst higher, as it crawled along the bottom.
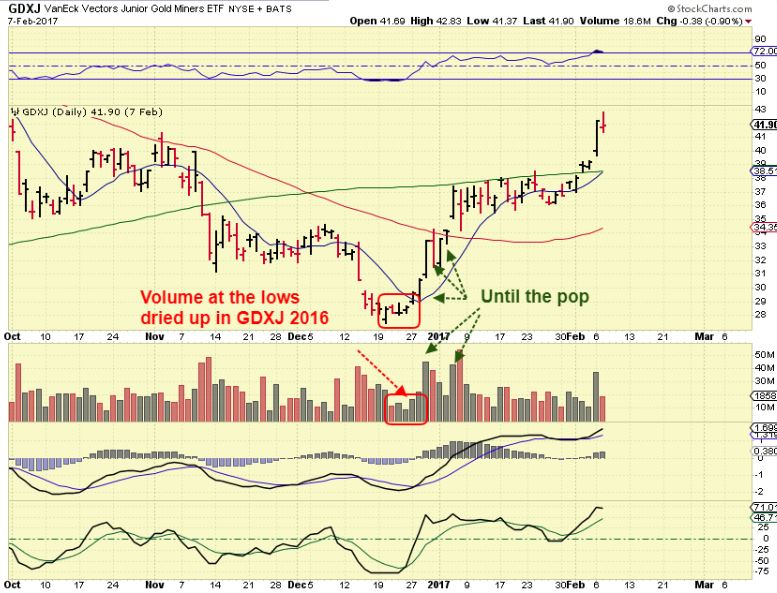
GDXJ DEC ICL 2017 – 1 year later, we had the same thing in GDXJ on day 1,2, & 3 as it crawled along the bottom.
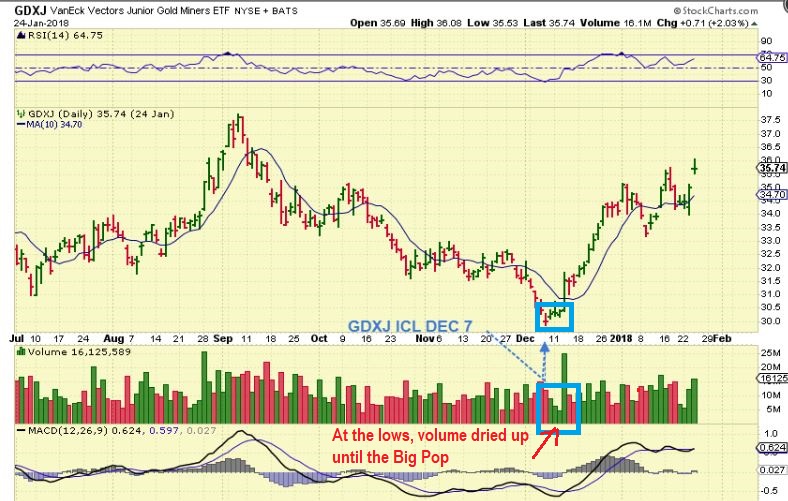
You may have noticed that at the end of the discussion on the last 2 charts, I said, “As it crawled along the lows”. Yes, that is correct, we can spend day 1,2,3, and even more just crawling along the lows until a burst higher comes along. As it crawls along, Bears likely look at it like a weak bear flag, and short it. When Gold POPS, the shorts cover & Miners begin to rally.
So there you have it.
1. The General Markets seem to be acting as I’ve expected. They may be choppy & topping here.
2. The USD looks to be choppy & toppy too.
3. Gold has a swing low unconfirmed ( 1233 is the 10sma), and the Miners were higher on Tuesday while Gold was break even.
All we can do is wait and see if Gold or the Miners can move higher and close above the 10sma, then we will have more confirmation that the lows are finally in. Enjoy your Wednesday trading ( Oil inventory day too) and I will have a few more charts after signing off.
.
EDIT: Gold as of my 6 a.m. spellcheck 🙂 Looks promising, but no swing yet, the 10sma is at $1233
.
~ALEX
.
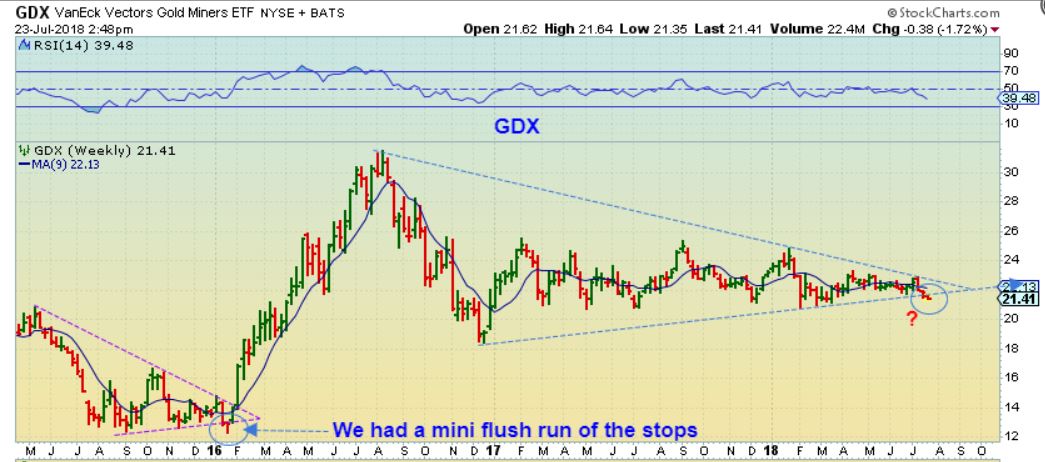
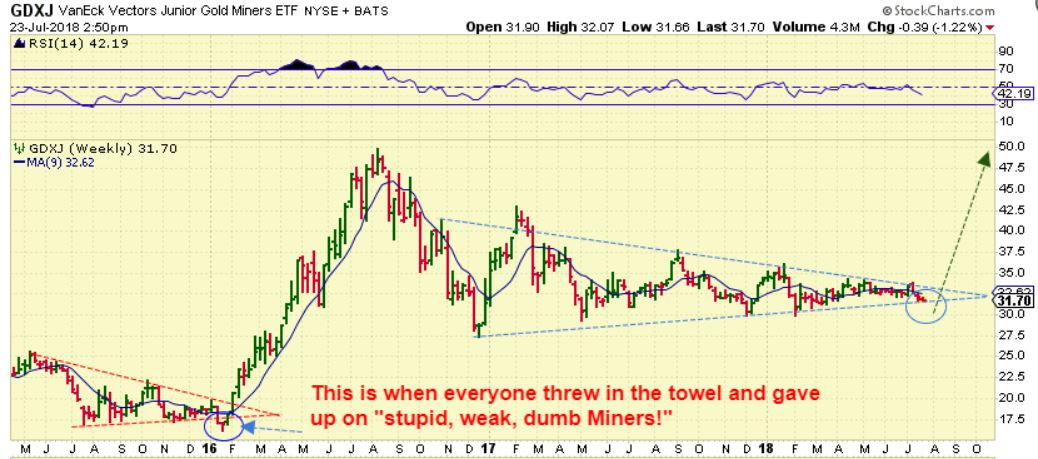
REMINDER – The 2 Most important charts in yesterdays report. We have started seeing a bit of divergence in the Miners , as shown in this report, but if they get a quick slam down ( let’s just say 1-3 days down, boom, boom, boom ), it may just be the flush shown in these 2 weekly charts in 2016, right before a strong rally begins. A break out higher could get very bullish .
GDX 2016 Flush in 2016
GDXJ 2016 Flush in 2016
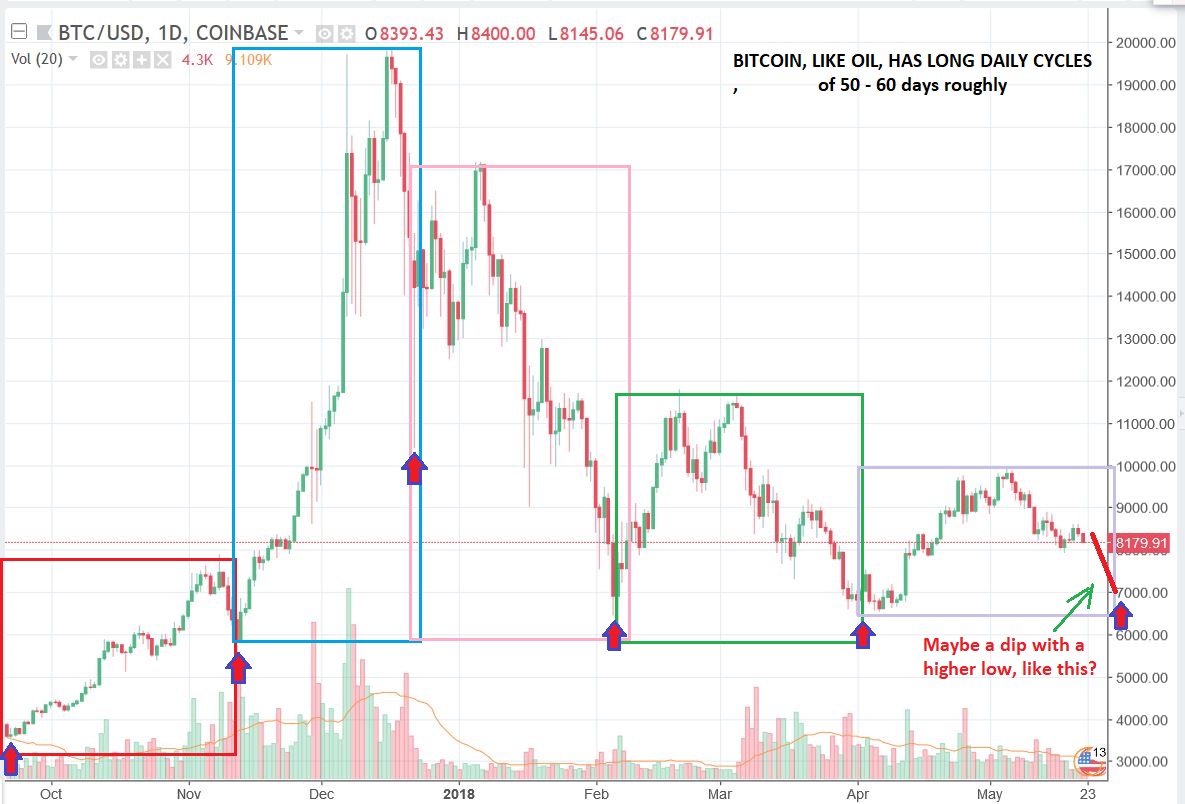
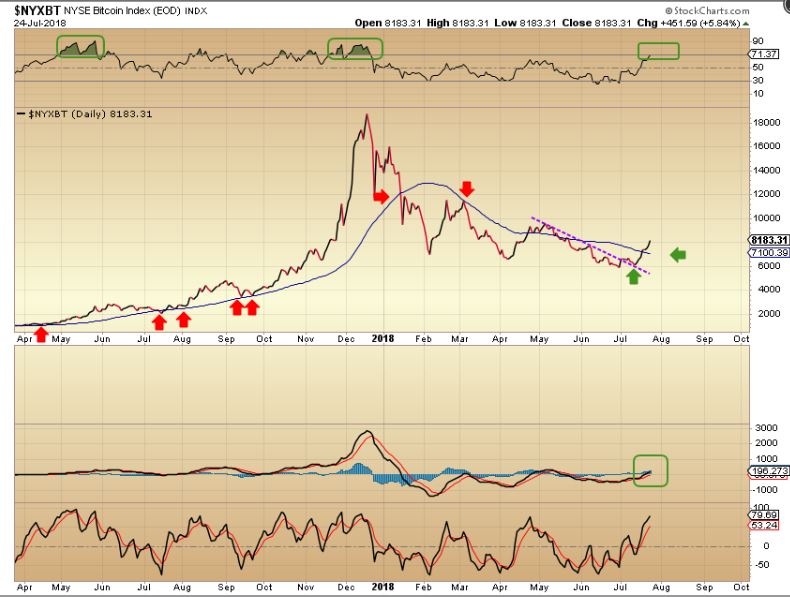
BITCOIN – In May I was asked to look at BITCOIN, but it did not look ready yet. I drew this chart showing how long the daily cycles could be , and I expected a drop to a low into JUNE, and that could be a buy area.
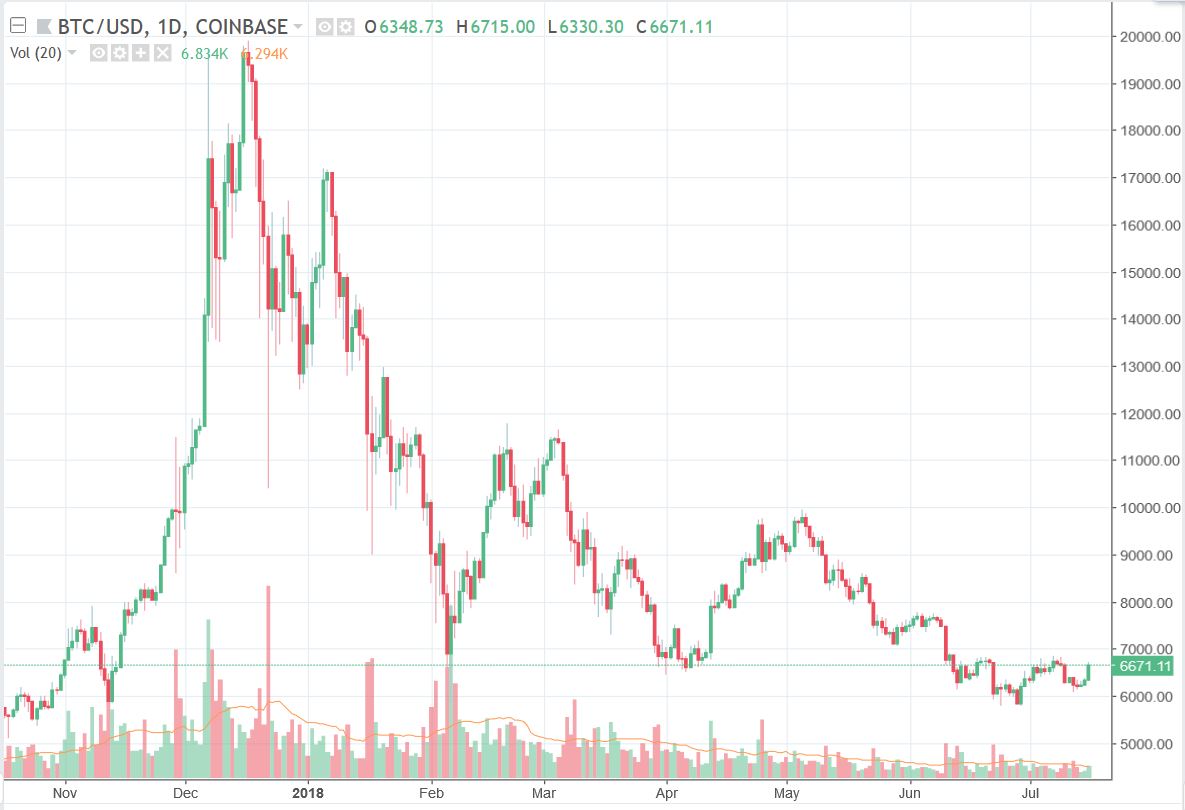
BITCOIN – I posted this chart when I thought we had a BUY in BITCOIN. It bottomed at $6000 and now had a higher low.
BITCOIN – July 17 the trend line broke with a higher low out of the daily cycle low. I had already started taking a look at Block chain trades, since in the past they ran very well when Bitcoin bottoms. They actually run better than Miners , but they drop faster too! Quite tricky.
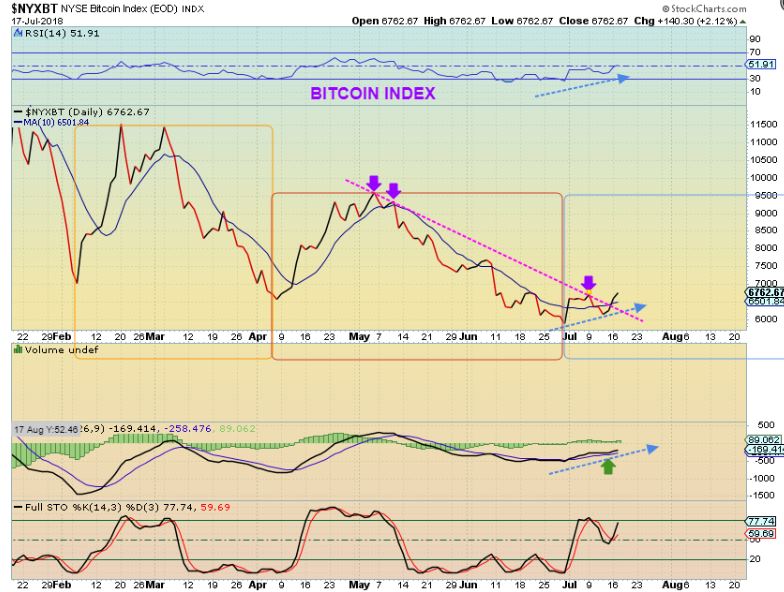
BITCOIN – And now we’ve had a rally from $6000 to $8000+. Blockchain trades have been doing very well. If Bitcoin can break the prior highs in May, this may be the bottom. If not, it is another bounce from a dcl in this base building process. NOTE: Raise stops, BITCOIN could ( Should) Back test the 50sma eventually.
.
BLOCKCHAIN TRADES
.
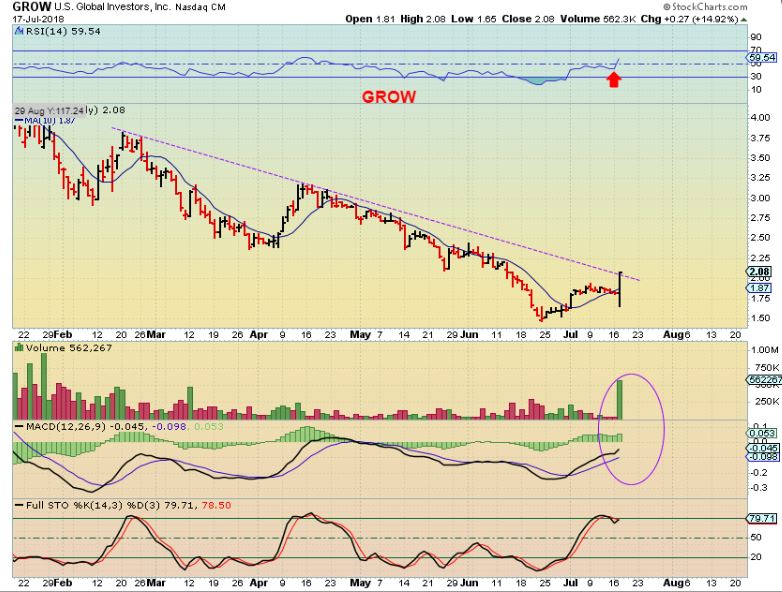
GROW POP JULY 17- Grow popped 15% and reached the down trend line & the 50sma was there.
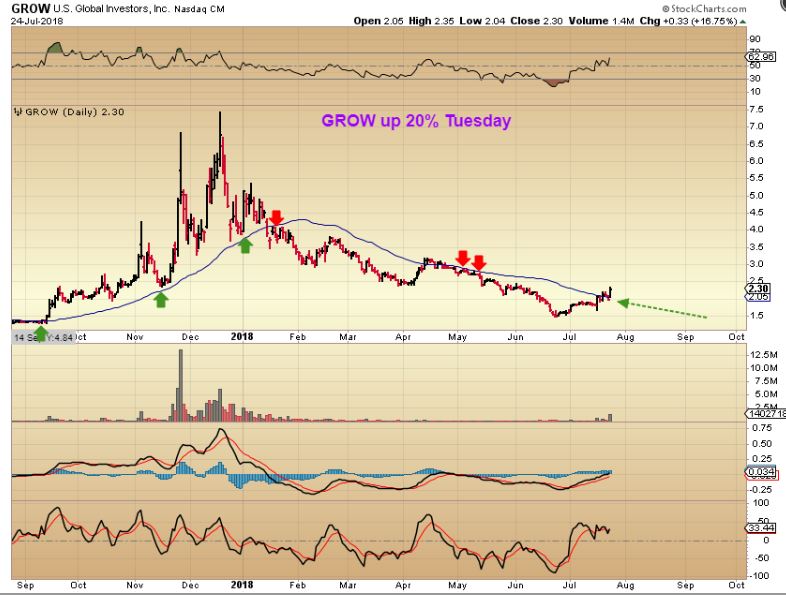
GROW – This popped 20% and is now above the 50sma again. It could run and back test the 50sma, or it may back test sooner than later. Watch Bitcoin.
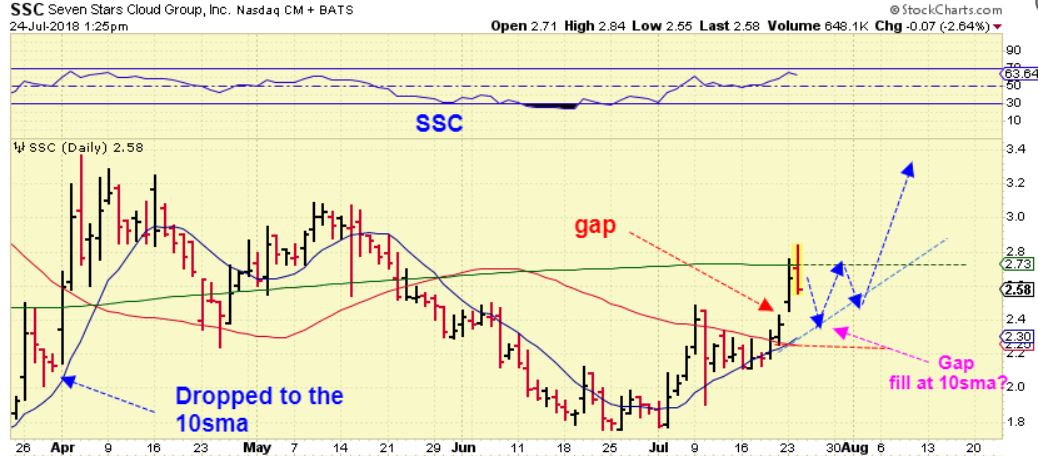
SSC BULL FLAG JULY 19- It could have been bought in the $2.20 area
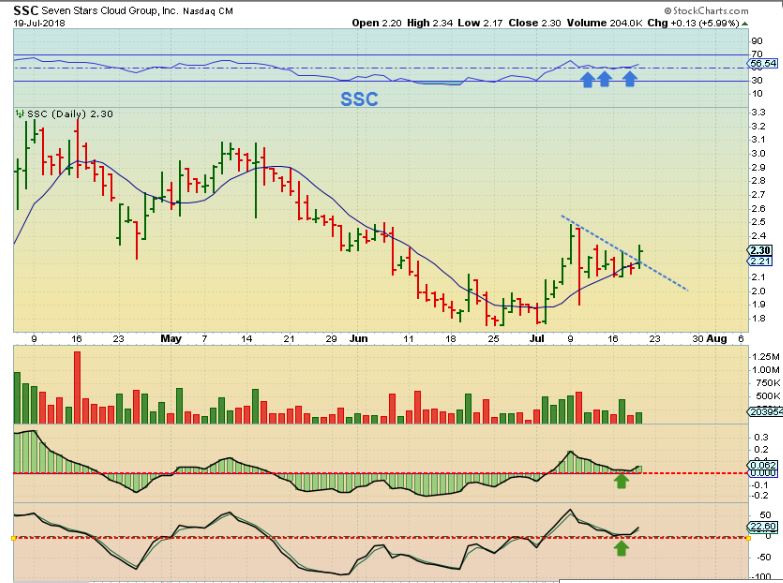
SSC -The bull flag broke higher from $2.20 to $2.84, with a reversal. I see a possible gap fill & test of the 10sma coming, but that is not necessary. If it does, that may be a buy opportunity, also depending on BITCOIN.
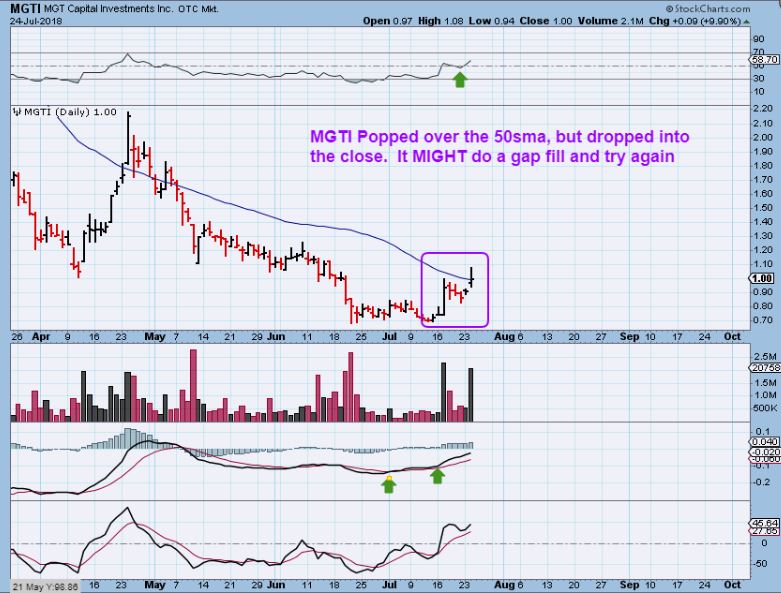
MGTI BULL FLAG JULY 19- I like this one, but did not end up buying it.
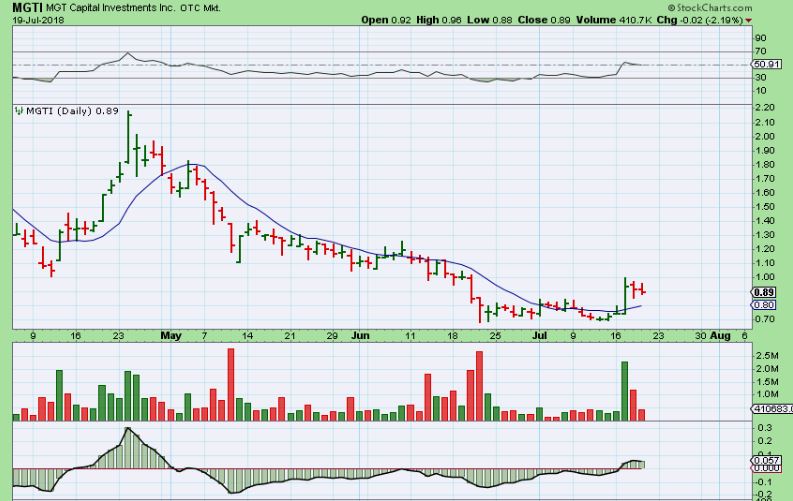
MGTI– The bull flag Popped, but it couldn’t hold the gains yet. I still think it looks good, and volume was healthy, but it may need to close that gap. In April this stock ran up over 100% in 2 weeks.
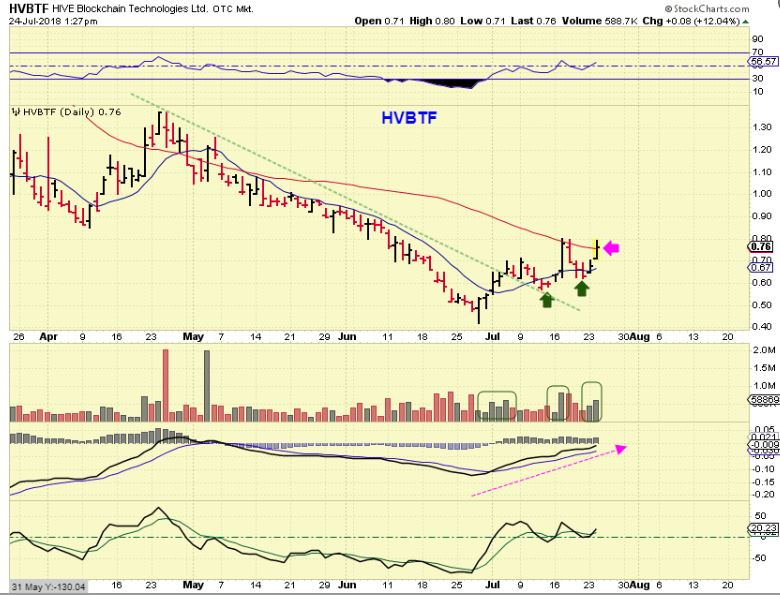
HVBTF – The set up is good, but this is an OTC stock. They are difficult to get in & out of at times, so that adds risk. I did enter a trade right here, hoping that it will be able to push above the 50sma and run further, like others in this sector. This is a bit riskier as an OTC.