July 28th- No, Not Icicles – ICL’s
With every passing day, we are 1 day closer to one of the best trade opportunities that the Precious Metals Markets offers, and they only occur twice a year. Let’s discuss the various market sectors and then we’ll look at Gold, Silver, and the Miners …
In the weekend report I mentioned a few things about the General Markets looking weaker in the Big Picture. I mentioned that they were due for a dcl, and maybe an ICL of their own. Then we got a drop this week and it looks like they will be dropping down to seek out a dcl. Let’s discuss the drop…
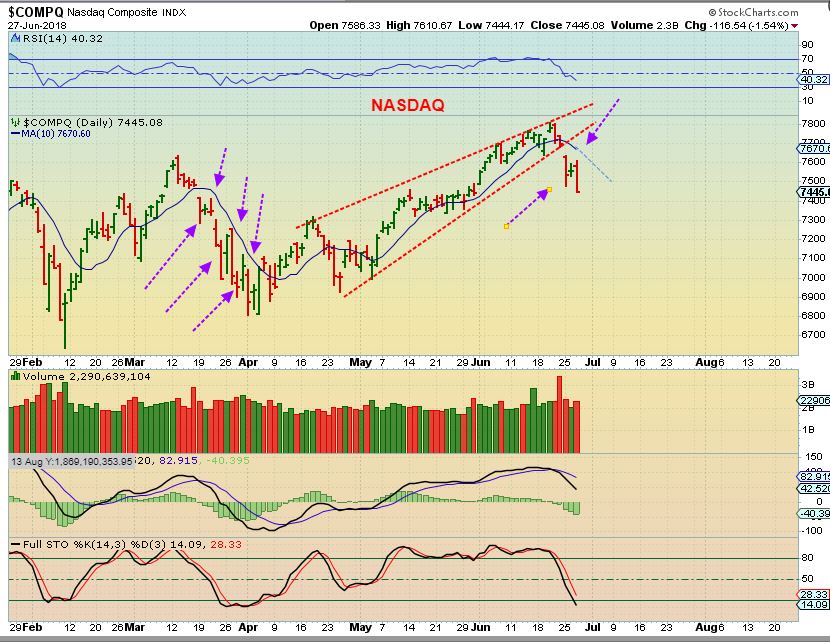
NASDAQ – You remember this bearish wedge. It broke down. We don’t re-enter trades until a swing low forms and the 10sma is re-gained, but if we are holding a stronger stock that didnt break down ( or did not hit a stop) you can hold it or sell & re-enter. The TECH sector has been one of the strongest, but it can still drop swiftly into a DCL or especially an ICL too. Look at the February & March drops. It had a few POPS higher, but was rejected under the 10sma, similar to what we see now. I think this has further to go on the downside. Also, let’s look at something else…
SPX – The SPX was rejected at the 10sma, and…
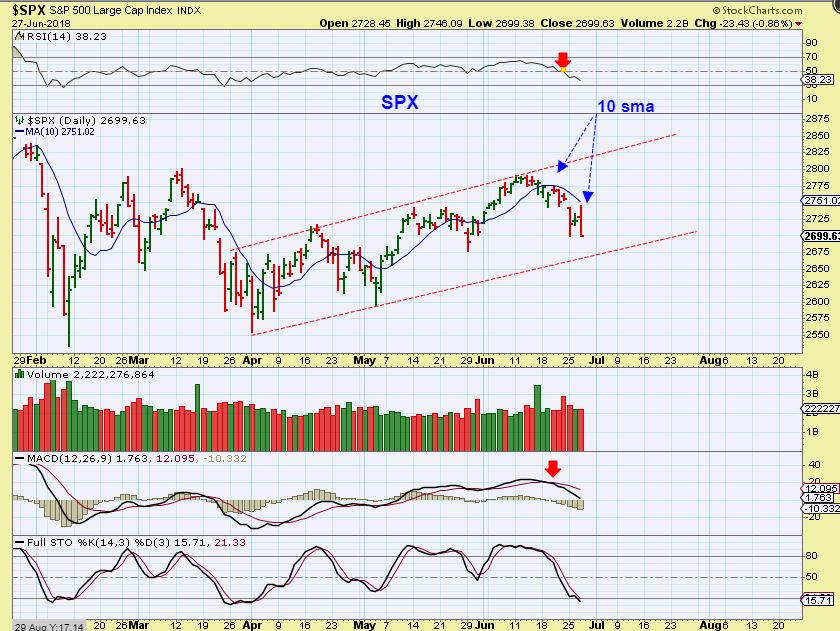
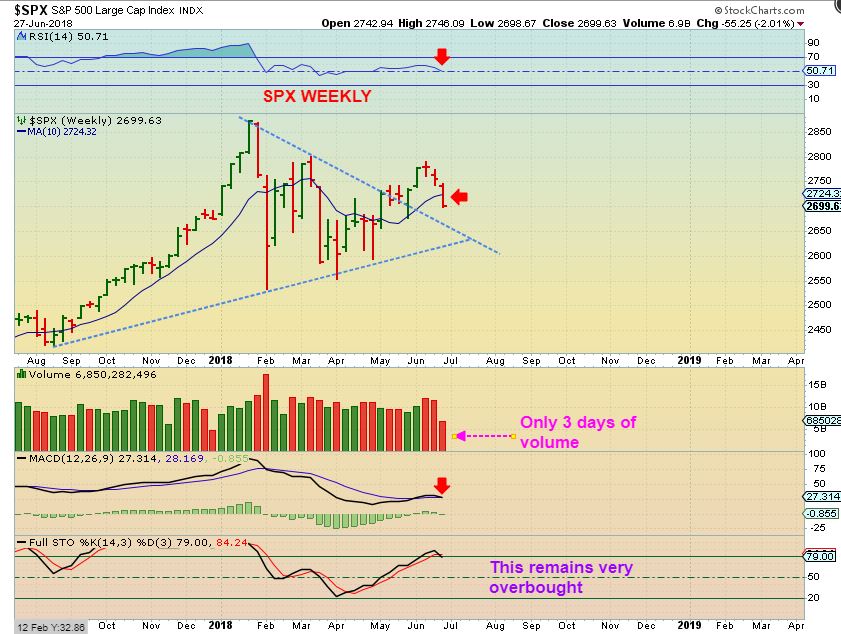
SPX WEEKLY June 22 from the weekend report – Price was 2754 and ‘weekly weakness’ was evident & pointed out in the RSI & a bearish rising wedge. It is also overbought, so if this is dropping into a dcl and then an ICL- It possibly has quite a ways to go.
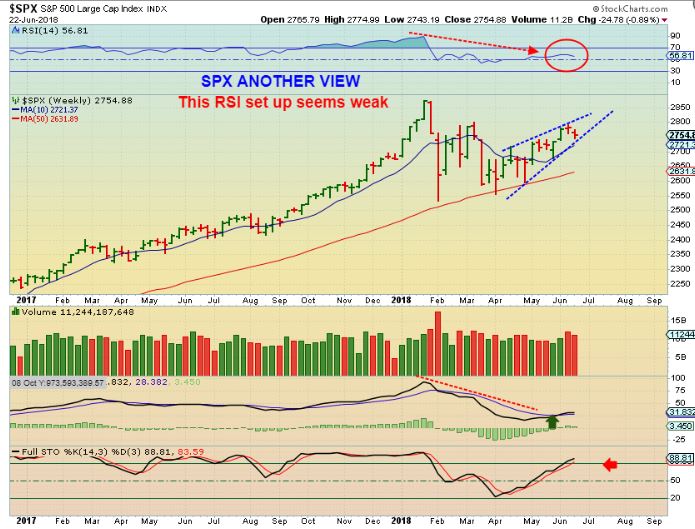
SPX WEEKLY CURRENTLY– A WEEKLY SWING HIGH and Price dropped below the 10 MA on a weekly basis. Weekly Volume seems a bit heavy for a Wednesday. I’m not shorting this, but I would let this play out, it is dropping into its ICL.
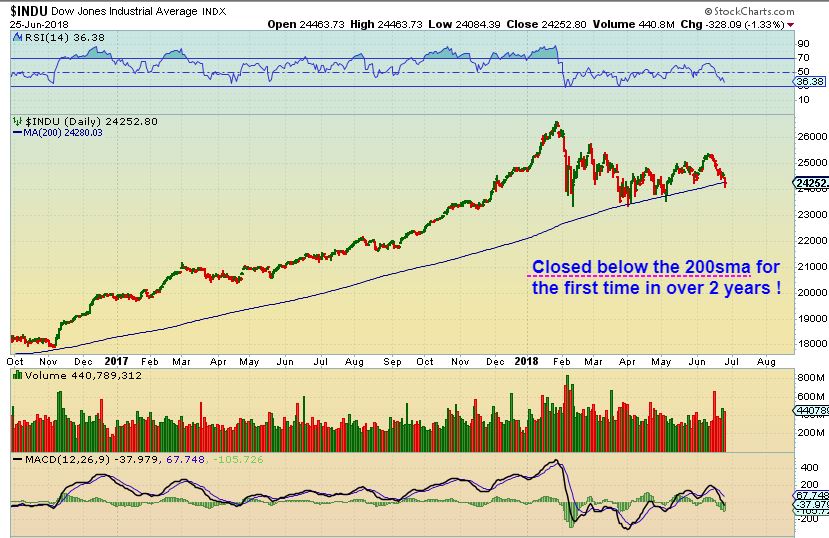
DJIA JUNE 25 (Reminder) – I mentioned that The DJIA broke below the 200sma for the first time in 2 yrs. Today price is over 100 points lower, now closing at 24, 117, so it is even further below the 200sma. I’d let this play out, because if those lows are taken out, we may see heavier selling pick up. ( Maybe money flows into Gold?)
I ALSO DISCUSSED THE VIX – A RALLY IN THE VIX CAN DROP THE MARKETS TO A DCL (ICL). SEE FEB.
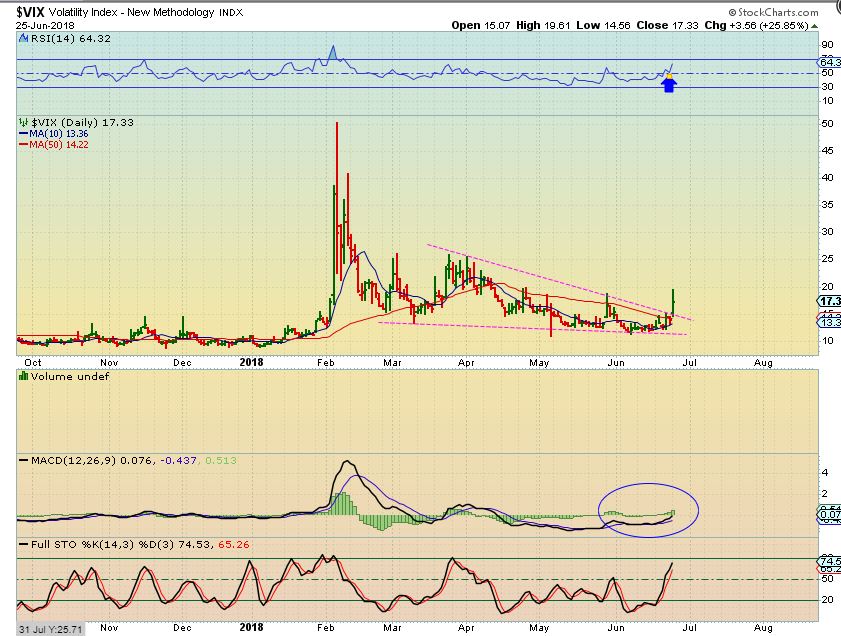
VIX JUNE 19 – Ready to pop? Market would drop.

VIX JUNE 25 – Vix Popped, Markets dropped
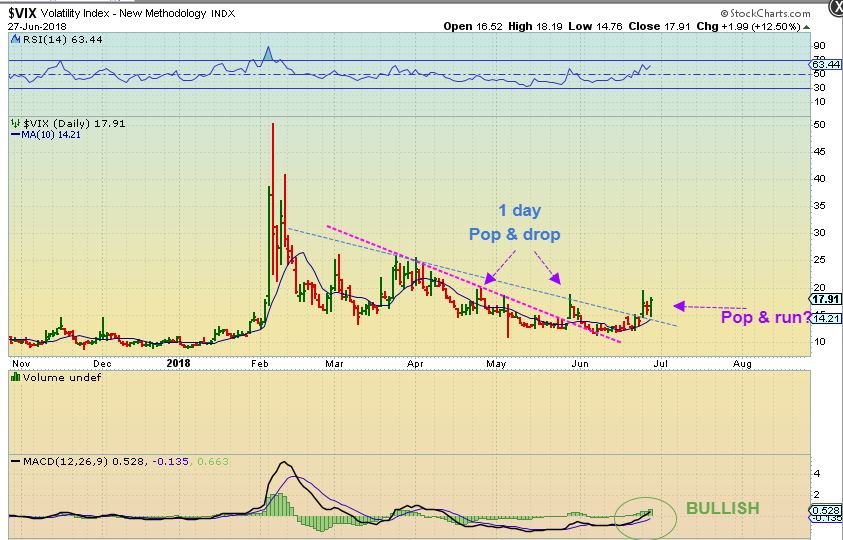
VIX JUNE 27 – Not a 1 day ‘pop’, this looks like it could make a small run, and drop the markets into a dcl.
FOR THE GENERAL MARKETS: There can be UP days in between, but the short term trend may be down until we get a swing low & a move back above the 10sma. I would let this play out from here. I am basically waiting for the precious metals ICL anyway.
.
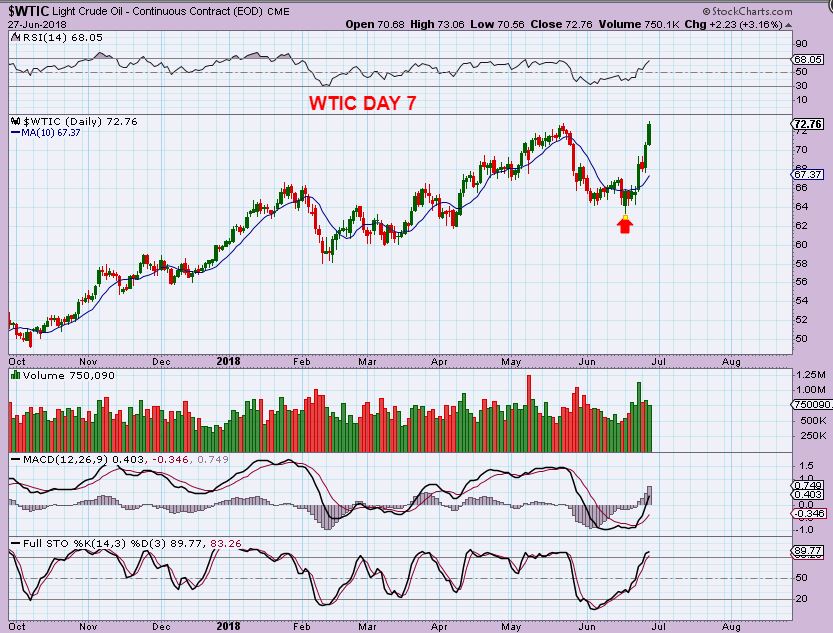
WTIC – I am still puzzled by the strength in OIL out of the recent lows, but…
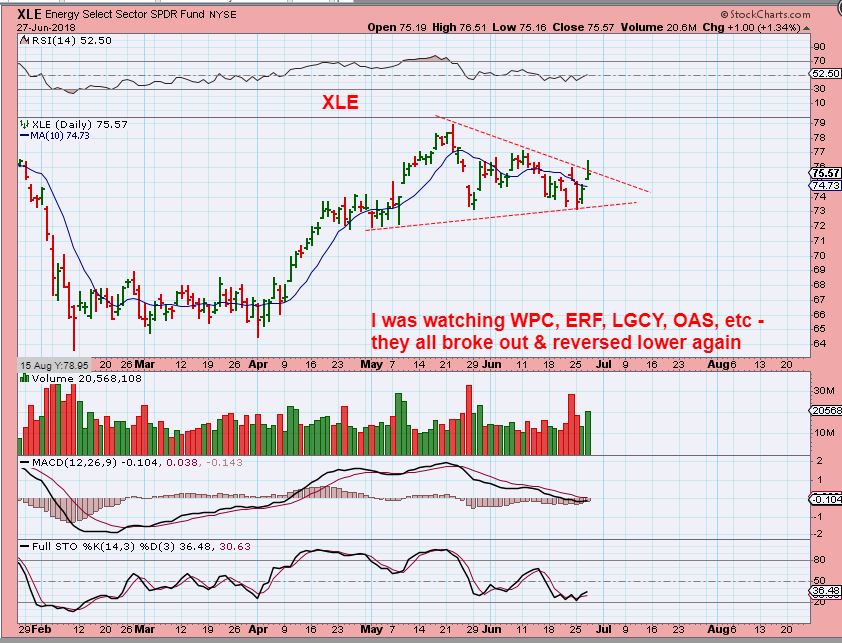
XLE – Still no real follow through. The XLE & many of the Energy stocks that I have been checking popped higher & sold off. It MIGHT BE that they are following the General Markets, but I kind of doubt that. They should reflect a bullish Oil run, so we’ll see if they play catch up or if Oil double tops here.
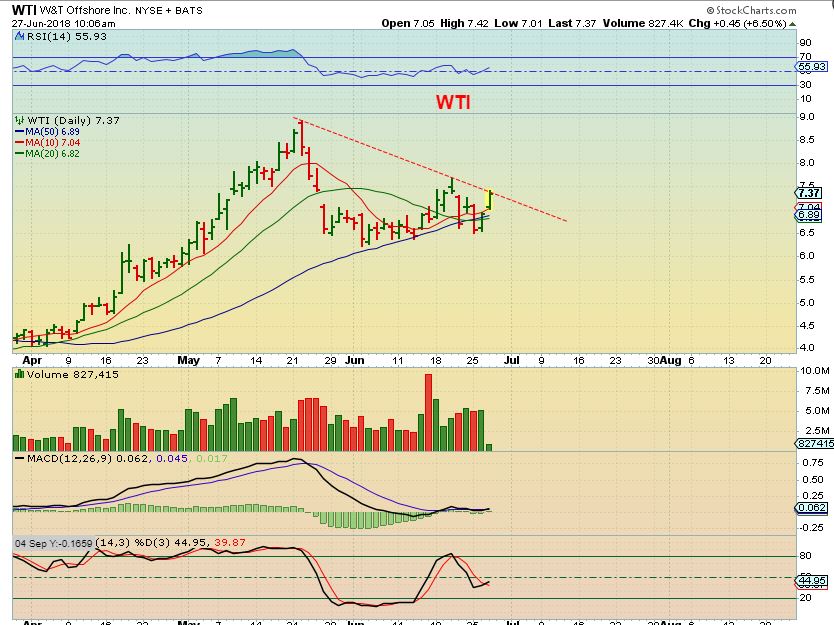
WTI 10 a.m. eastern time: I captured this ( and other) Energy stocks looking ready to break out with Oil. A break out would be Bullish…
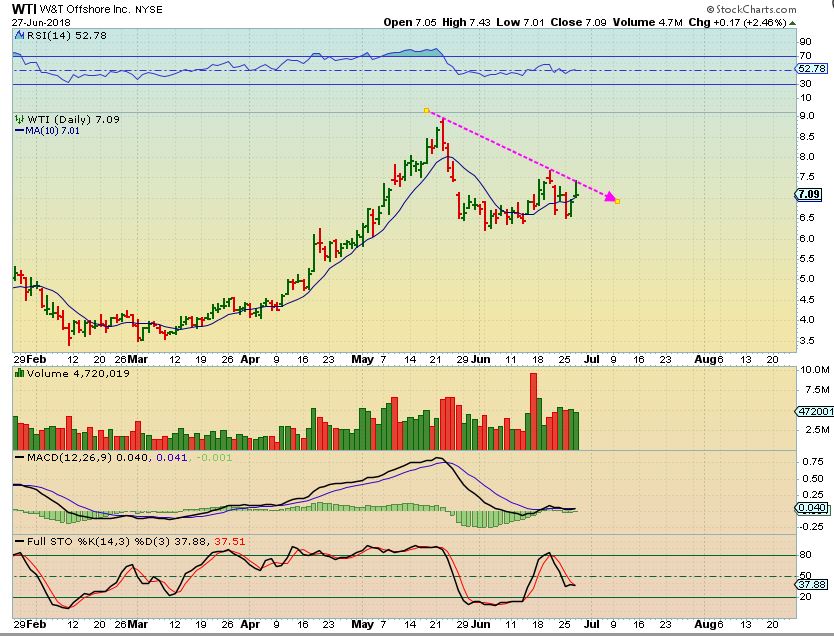
WTI – Then they sold off, along with the XLE. 🙁
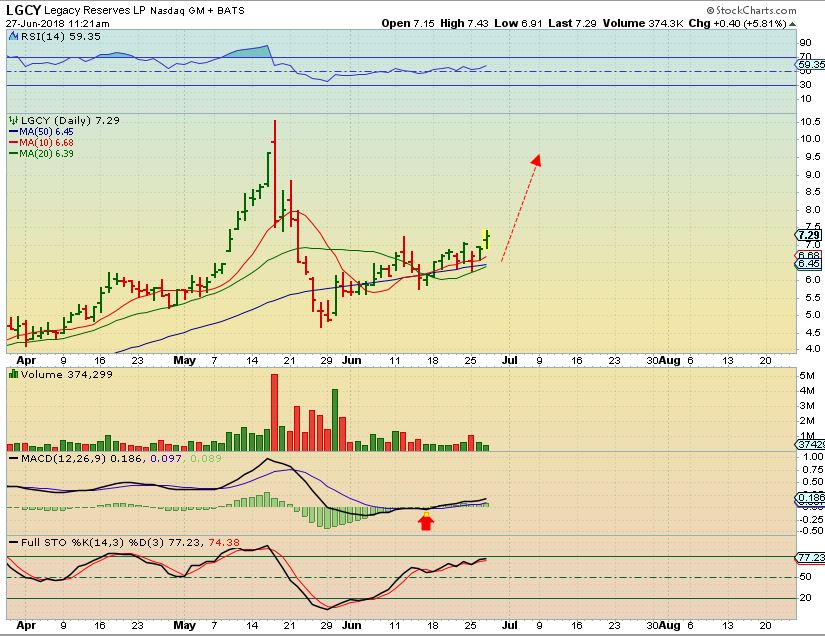
LGCY – At 11 a.m. I liked this set up & entered a trade, and then it sold off in the second half of the day too.
OIL IS BULLISH SHORT TERM, BUT ENERGY HAS RESISTED THE RUN HIGHER. IT IS A BIT TRICKY RIGHT NOW
.
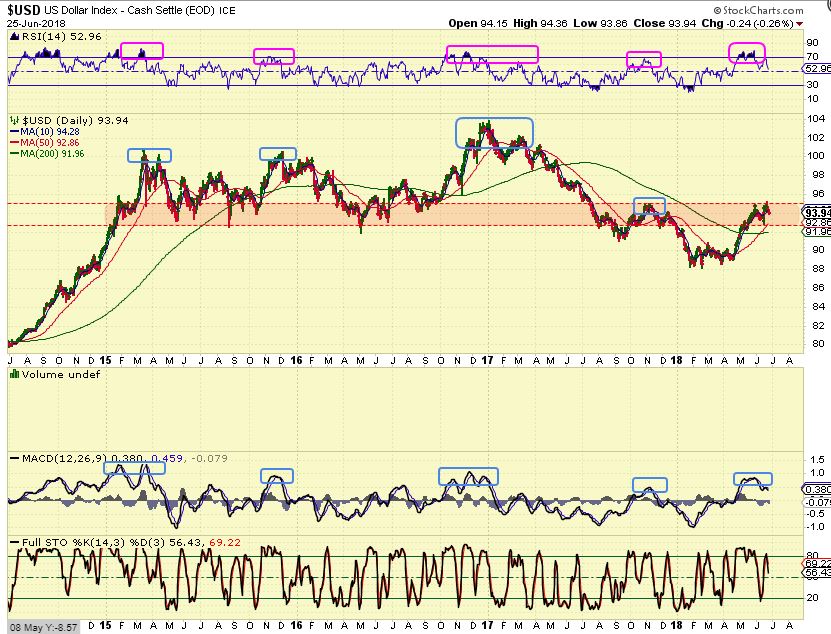
USD REMINDER: The USD dipped and ran higher to the highs again above 95. If it keeps running, I will be surprised, I am expecting it to top out soon and allow GOLD to bottom. It is due for an ICL of its own.
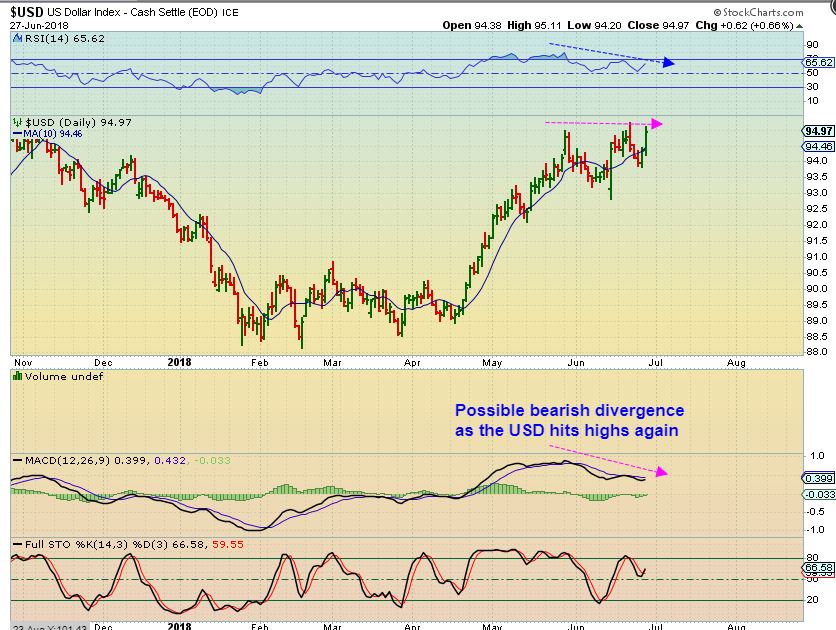
USD – With the USD at highs, the MACD shows weakness. I DON”T like that we could make a new high on day 10 or more, so far we have a day 5 high. This actually looks bullish except for the divergence.
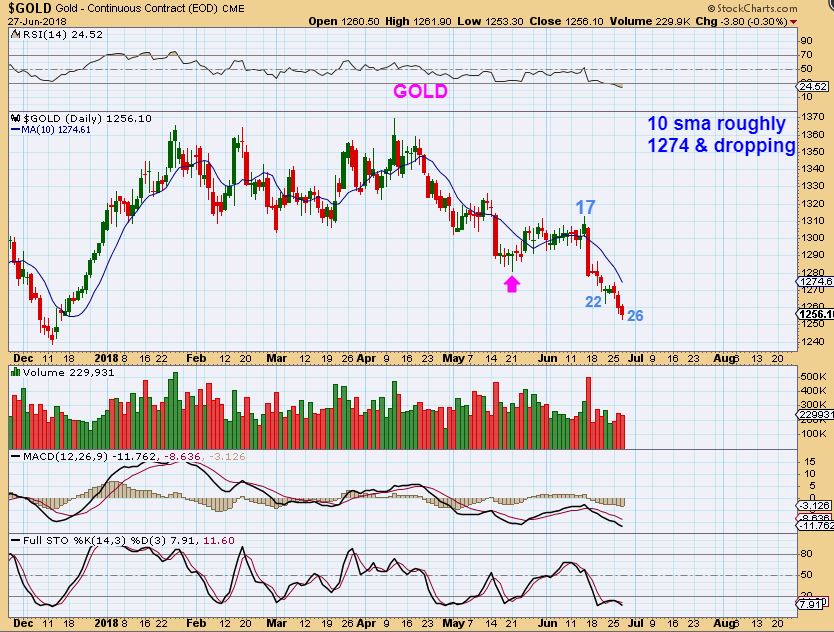
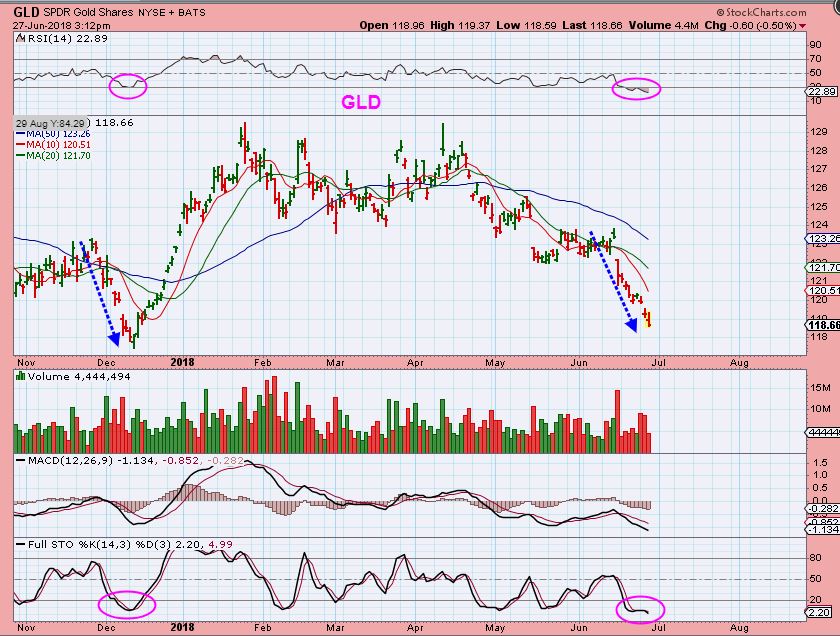
GOLD – Day 26 was a new low for Gold. We are waiting for a swing low and a move ABOVE the 10sma, so 1274 is currently where the 10sma is. The selling is steadier into ICLs.
GLD – This sell off looks similar to the Dec ICL drop, we just need that reversal.
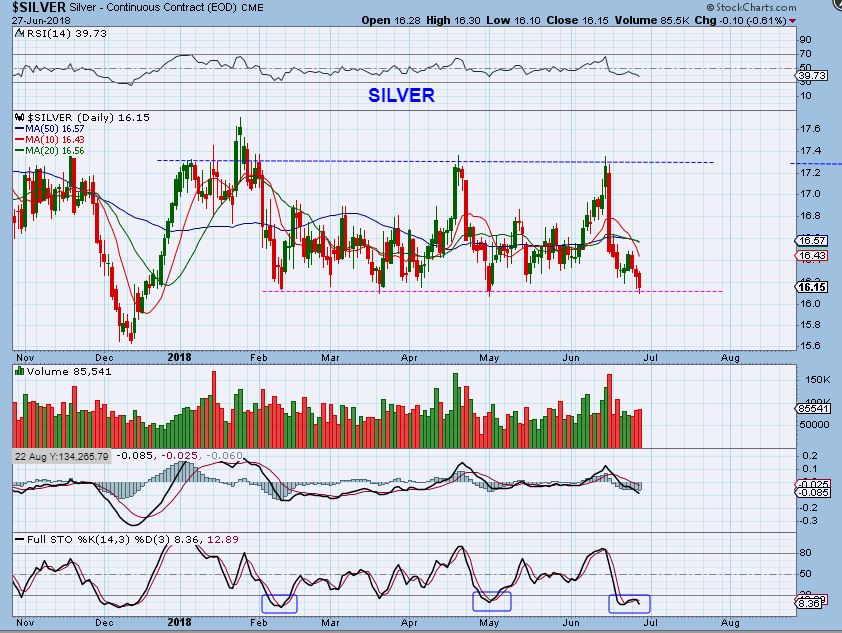
SILVER – Silver hit the lower level of its long consolidation. This chart makes it obvious that Silver Dropped sharply in the 2nd 1/2 of June, but many Silver stocks are still holding up. LOOK AT THE 2nd 1/2 OF JUNEs SILVER DROP.
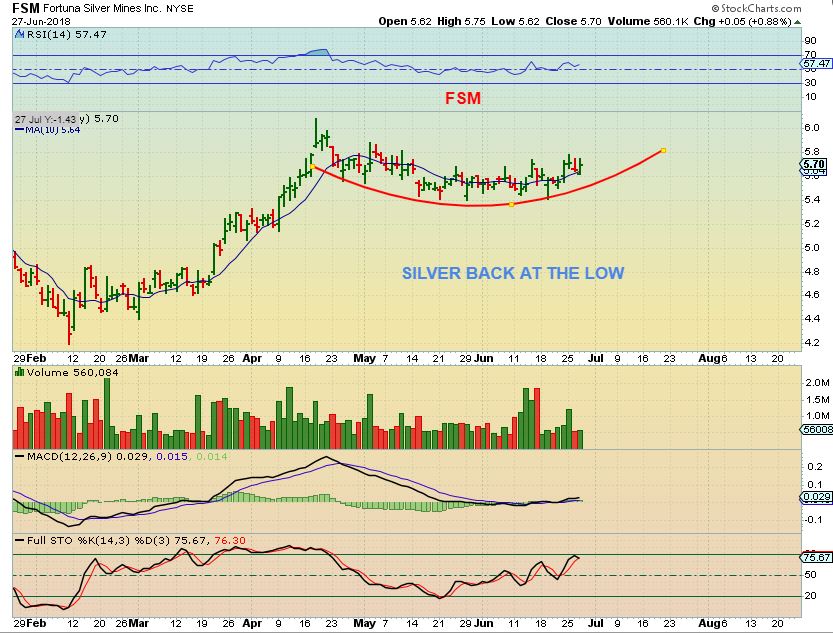
FSM – Then look at this Silver stock, and it is UP in the 2nd 1/2 of June. Seems Bullish to me.
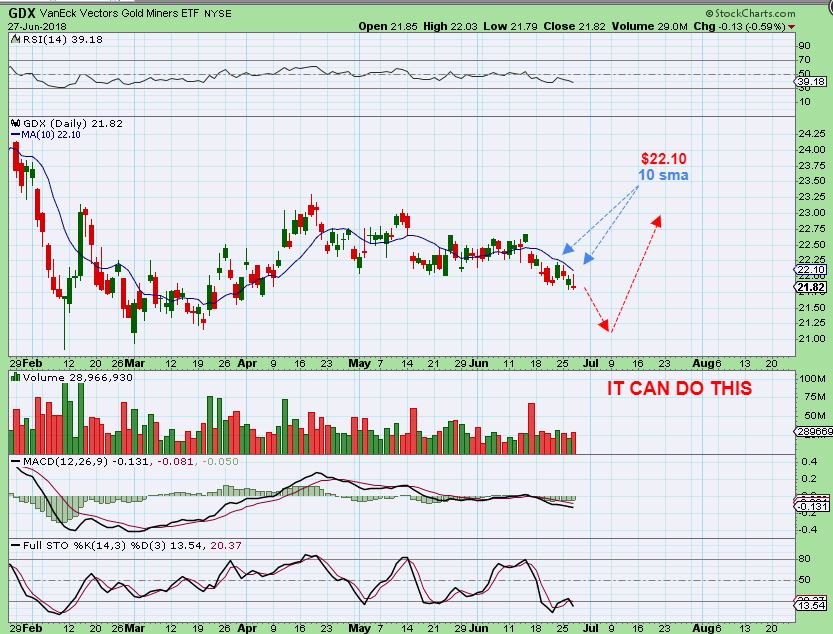
GDX – The 10sma is at $22.10 for the GDX. It is holding price down. The selling has been MILD in GDX & GDXJ so far, but I mentioned before that…
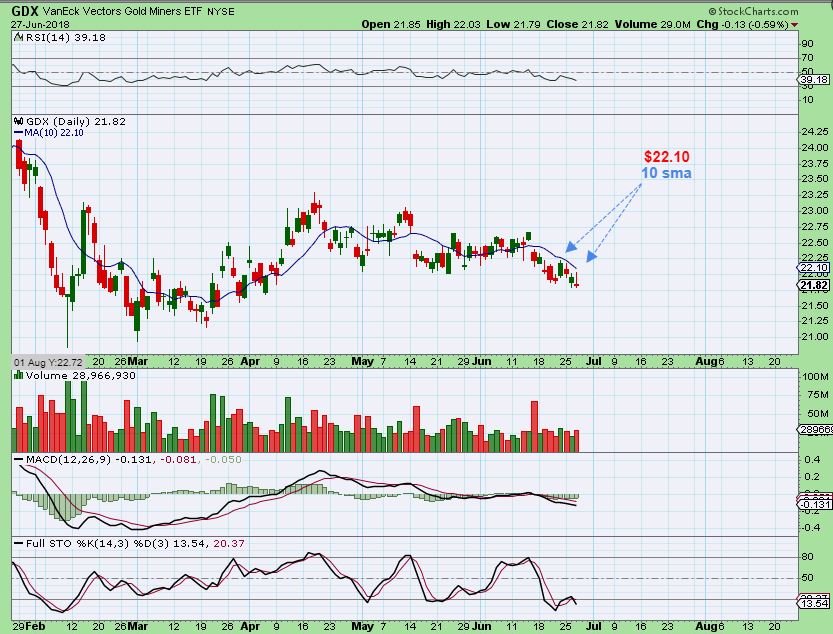
GDX – It can just sell off into an ICL too. Look at last Dec when it actually broke to a new high at the 50sma and then rolled over rapidly. It just closed above the 50sma in June too, and is now selling down. Devious.
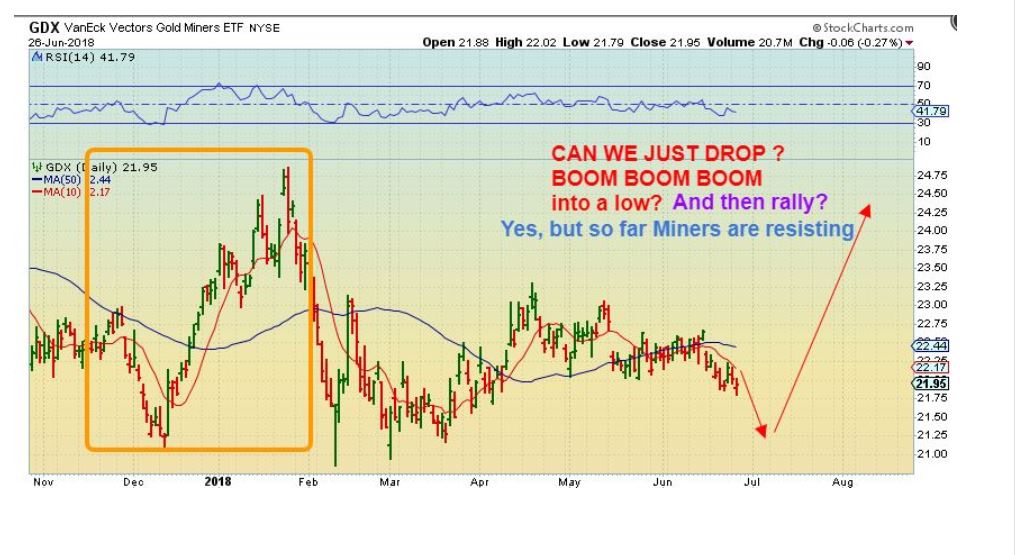
GDX – So lets just PLAN on this drop, and if it doesn’t happen, we’ll just stay focused on that 10sma.
As mentioned yesterday, I am going to be in North Carolina and will not be in front of my screens all day. I hate that we are expecting an ICL and I will be on the road, but such is life. We will not miss the ICL, you know what to look for here. A swing low and a move above the 10sma is a buy signal in my book. The rally that follows will make up for all of the frustrating stop runs & drops that are found on the way to the lows. PATIENCE IS PAYING OFF.
Due to my trip, I will have a brief report Friday and I would expect the weekend report to be shorter & more to the point, but of course I will report everything necessary as things unfold.
.
For now, lets see what the Markets do on Thursday, since they were unable to hold any gains and are due for their own DCL.
.
~ALEX
.
I WILL BE ON THE ROAD FOR THE NEXT FEW DAYS, AND MY REPORTS WILL HAVE TO BE SHORTER. I HATE THE FACT THAT AN ICL MAY FORM WHILE I’M AWAY FROM MY SCREEN, BUT REALLY IT IS NOT A BIG DEAL. I WANT TO ADD THIS TO THE END OF THIS REPORT FOR YOU TO SEE HOW I MIGHT BE PLAYING THE ICL, AS IT APPROACHES.
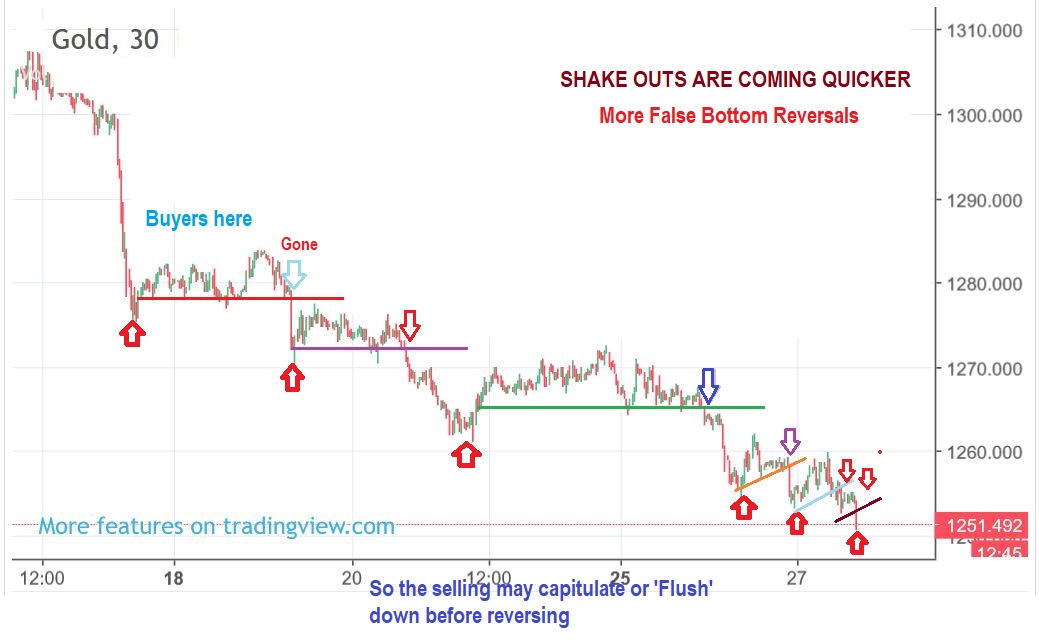
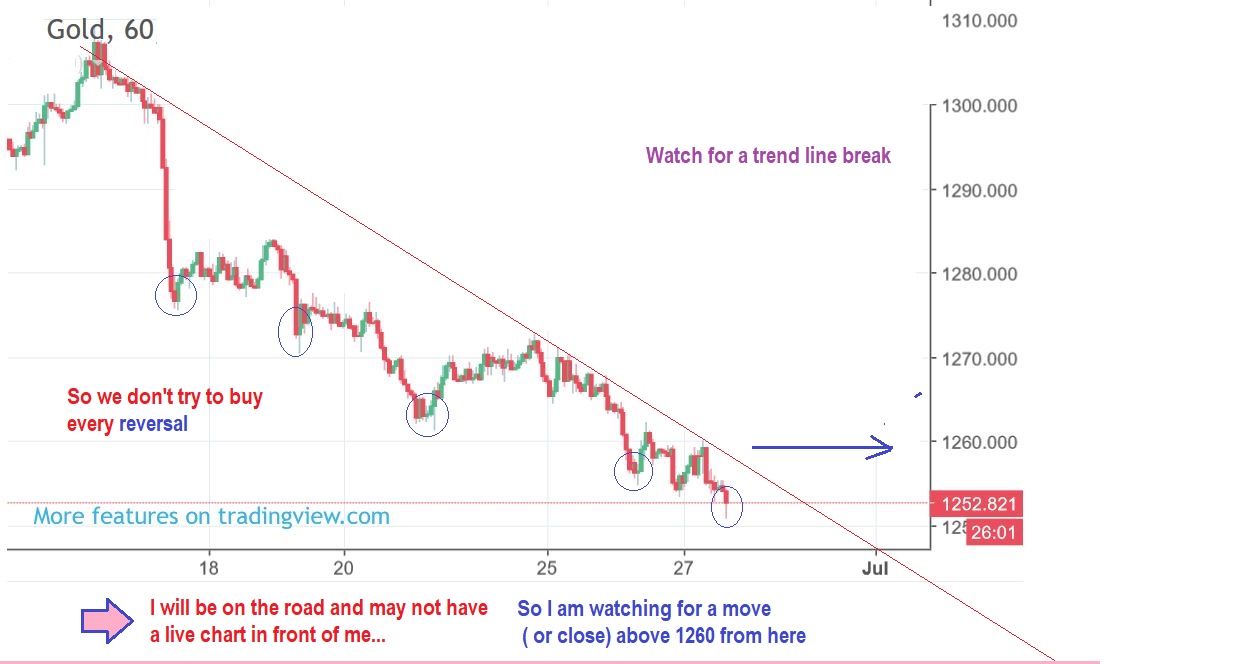
GOLD – Gold has many FALSE reversals as it sells into an ICL. Many inexperienced traders buy these reversals trying to catch the lows. This becomes known as ‘Death by papercut‘ or ‘catching a falling knife. They often give up buying just as the real lows present themselves. Notice that this is a 30 minute chart. Every 2 candles is 1 hr, and that is why people keep buying into it- it goes sideways for hours and then days or more and looks like a low has been put in place. These stop runs are now increasing- we may capitulate soon.
GOLD -I want to show you the JULY 2017 this way too. See how it happened then too? inexperienced buyers keep buying reversals and jumping in, then get stopped out again & again & again. Our patience has paid off, because that gets frustrating. See the chart.
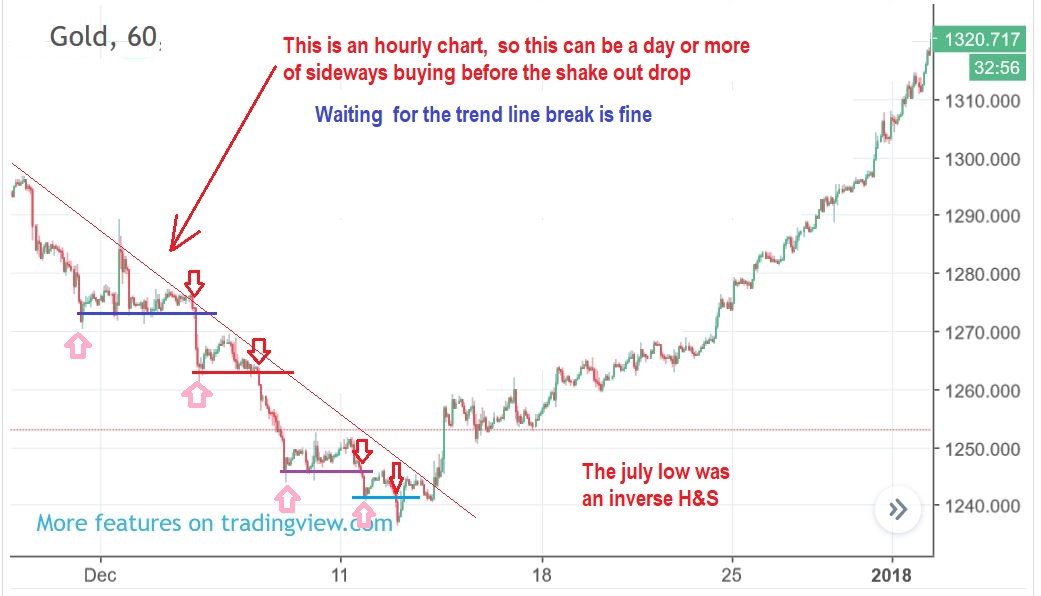
GOLD – So the above July 2017 chart had a trend line break pointed out. Did you see how you could wait for that and still catch a massive rally? I will be on the road, so I am eyeing the trend line & 10sma from my phone occasionally (when my wife is not looking 🙂 . I can get a BUY PRICE by looking where the trend line is. If GOLD passes & closes above 1260, I can probably buy. The 1270 area is the 10sma though.
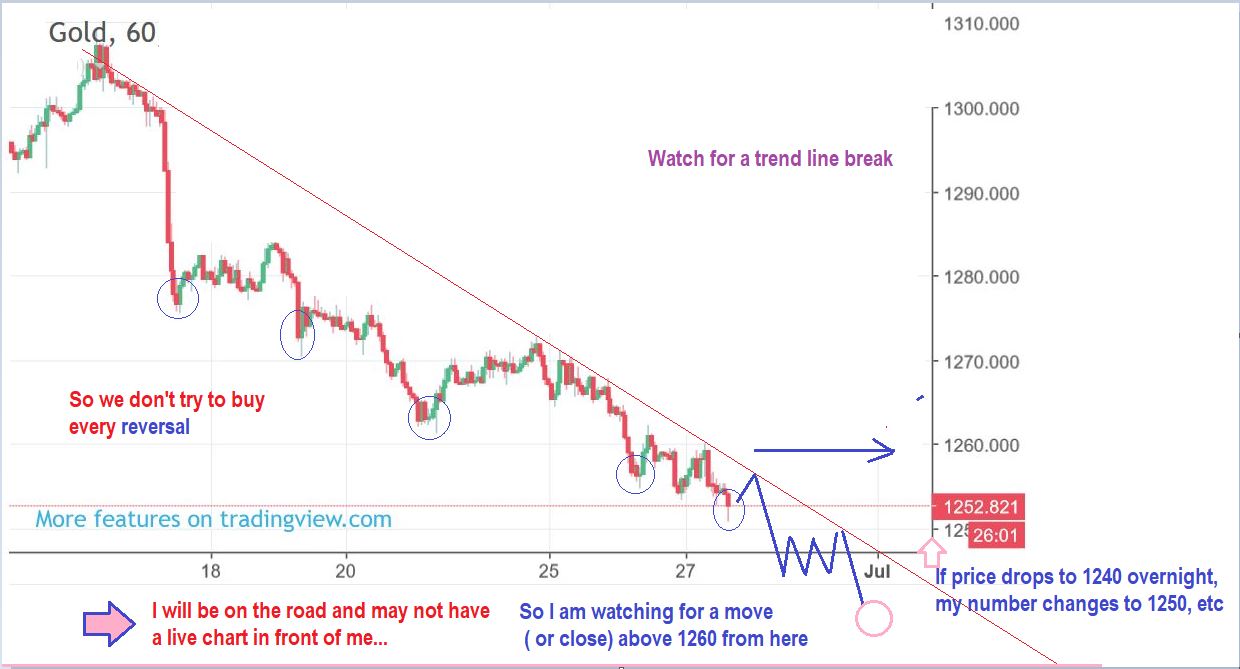
GOLD – We can drop further, and if we do, the trend line & 10sma drops too. So notice that my price to enter or ‘Buy’ drops daily too.
Finally: We had a brief discussion basically mentioning that I see Miners as being more bullish than in 2013, 2014, 2015 in the comments, I’ll share a few charts here.
.
I agree that Gold & The Miners had a bear market correction from 2012 to 2016, and they were beaten down. Many traders got burned at that time. Are all Miners now just a bunch of lame investments? Are they really still bearish and under performing everything else? I say no, and I want to show my readers that, so YOU can choice to trade them or not with visual evidence in front of you.
.
I have been trying to point out to some of those still Bearish on the entire sector that things do change in the markets. If you got burned in 2013 or 2014, that doesn’t mean that we entered ‘the end of Miners bullishness forever’. Currently Inflation seems to be creeping in and I have pointed out the Lows in Gold in 2016 followed by a series of higher lows ( ICLs repeatedly). I dont want my readers to fail to see that markets in a bear market correction CAN CHANGE AGAIN to a Bull Market. They can change from bad – to base – to rally. And I also pointed out a few Miners that certainly do not look to be bear market stocks. They are listed below.
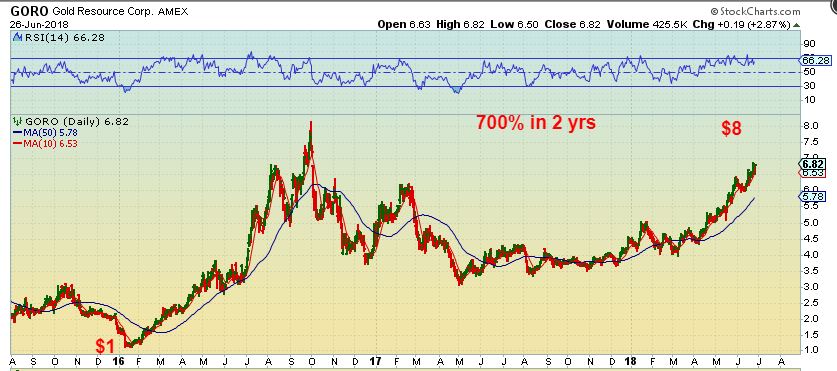
GORO – Still up 700% from 2016 lows
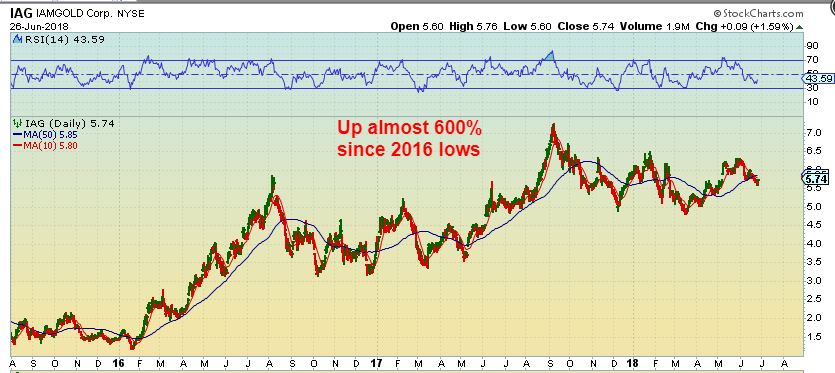
IAG – Still up almost 600% from 2016 lows
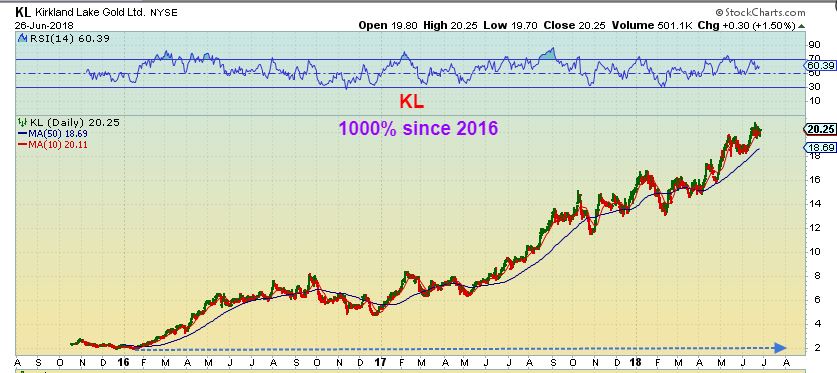
KL – Up 1000% from bear market correction lows.
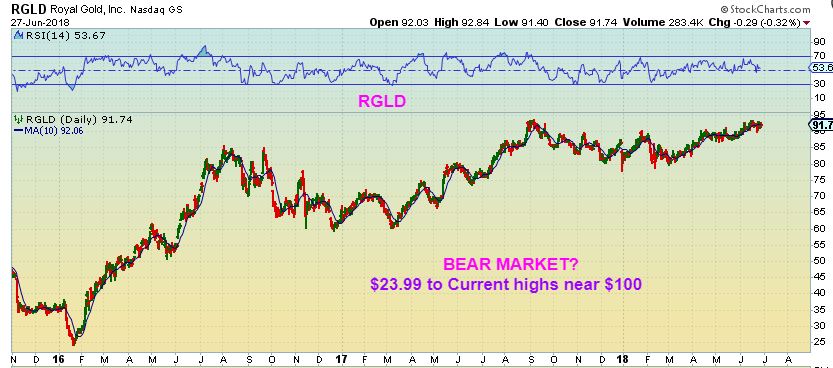
RGLD – $23.99 to $90+