And Next – The E.C.B.
At times the FOMC Meeting and the ECB Meetings can be game changers, but so far we survived the F.O.M.C. Rate hike. Now Thursday at 8 a.m. Eastern time, we face the ECB Mtg.
.
Due to the difference in Time Zones, I believe that we may begin to see some movement in the futures around 3 a.m. Eastern time, and the decision will be announced at 8 a.m. Eastern, so I would like to release this report on Wednesday night. If Draghi decides to slow down easing or make any unexpected changes, you could see it affect the Euro, USD, GOLD, etc. For now, let’s go to the charts and see what happened after the FOMC Decision was released…
.
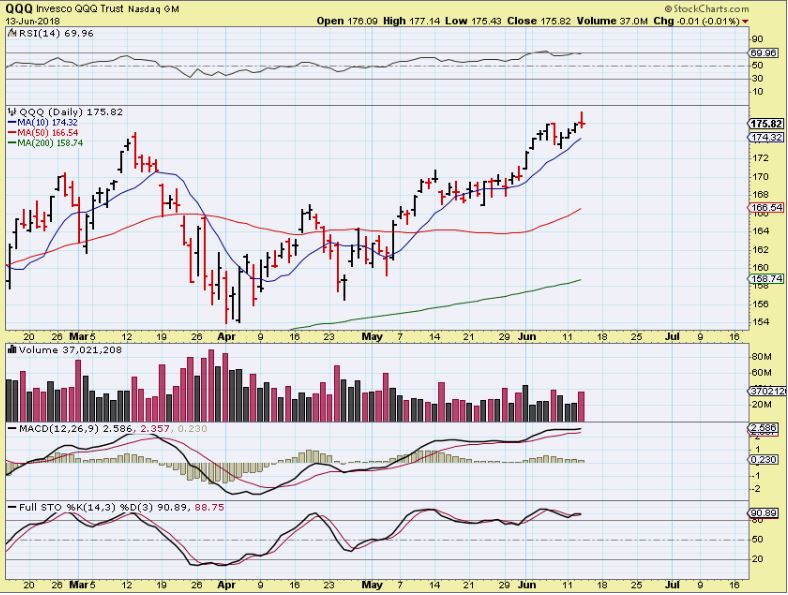
NASDAQ – This looks like a short term topping candle. A reversal after breaking to new highs may indicate a lack of big buyers and even some profit taking.
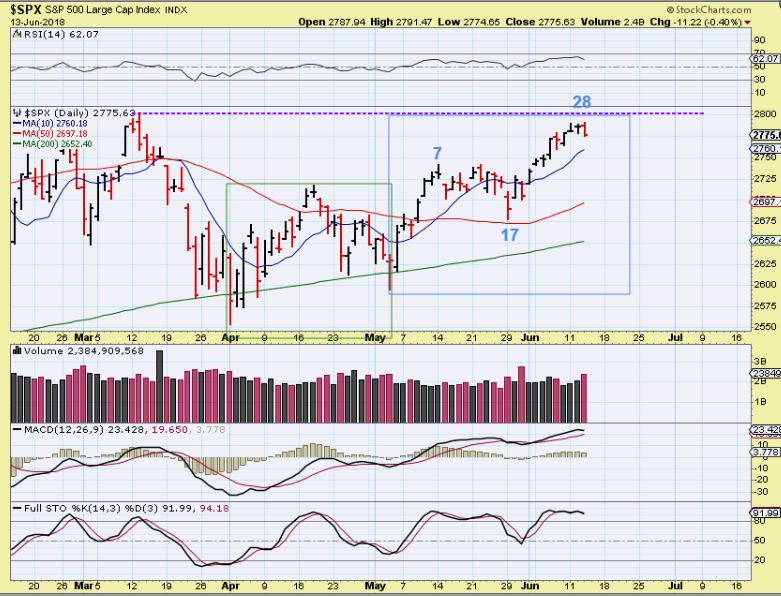
SPX – And the S&P dropped, falling short of the May highs. We are in the timing to seek out a dcl, so I think we are going to see a pull back here.
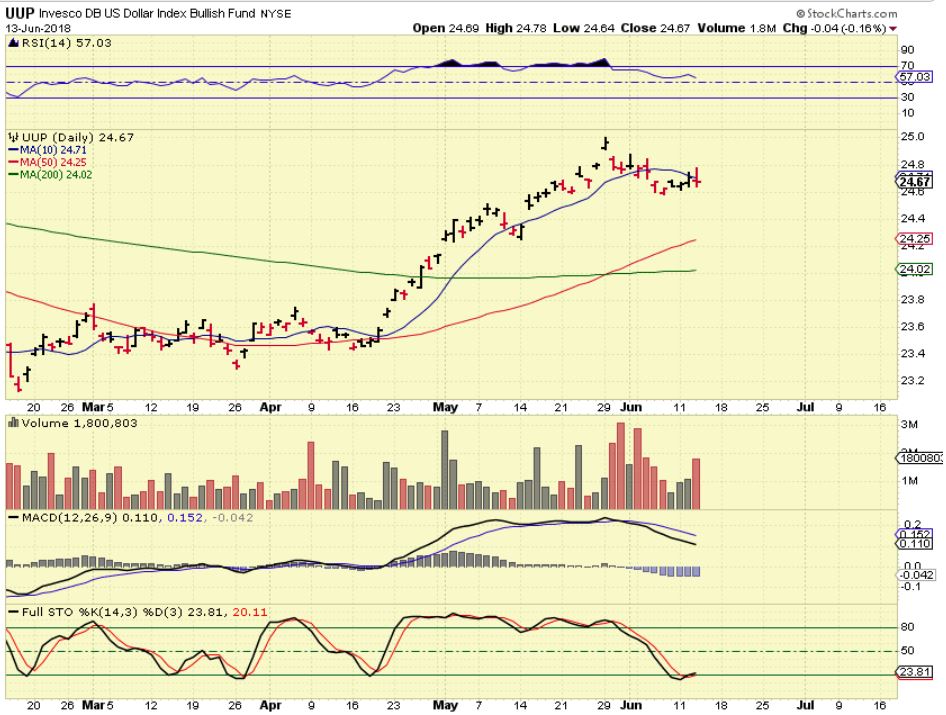
USD – This appears to be a dcl in the USD, but it also sold off after the FED DECISION. We are now getting well along in this intermediate cycle, and this should roll over sooner than later. Remember the weekly chart was rejected at the 200ma.
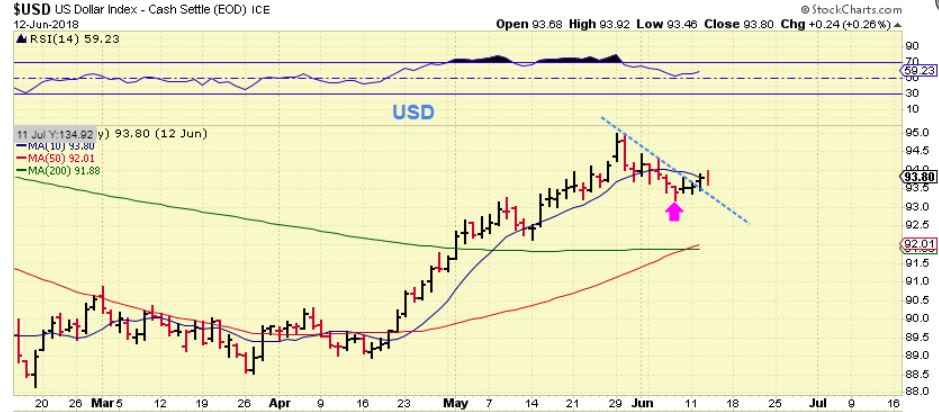
UUP for volume – Volume during selling has been high, the 4 day ‘bounce’ was light volume, and Wednesday was increased volume on the drop again. I would have expected more of a bounce than that, but I will be watching the dollar for weakness as time goes on.
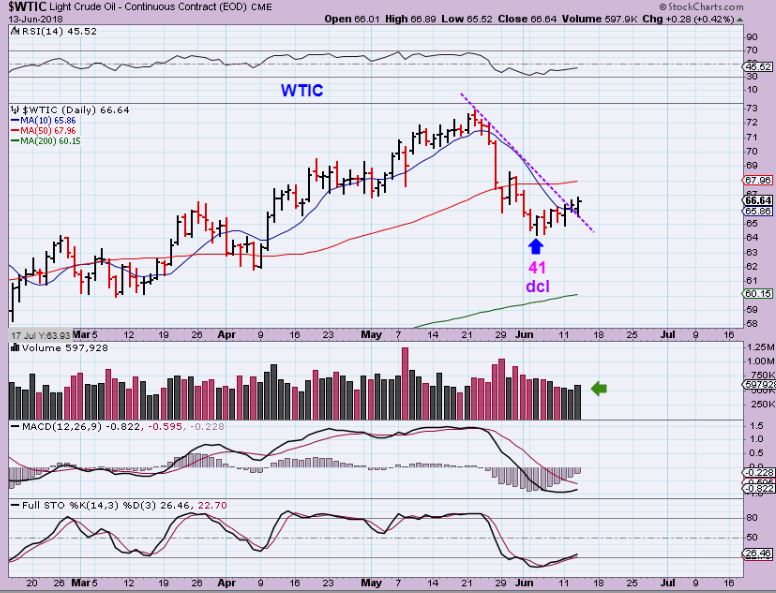
WTIC – Oil looks like it did put in a dcl on day 41, and this should at least back test the 50sma after breaking down through it. We’ll see if it can re-gain it soon or will it struggle. I am thinking that Oil can still drop to the 200 sma, and THIS may be an ICL coming, not what we saw in November, which never really did have the normal criteria for an ICL. I have mentioned this in weekend reports and will continue to do so as things play out.
FOR THE ECB
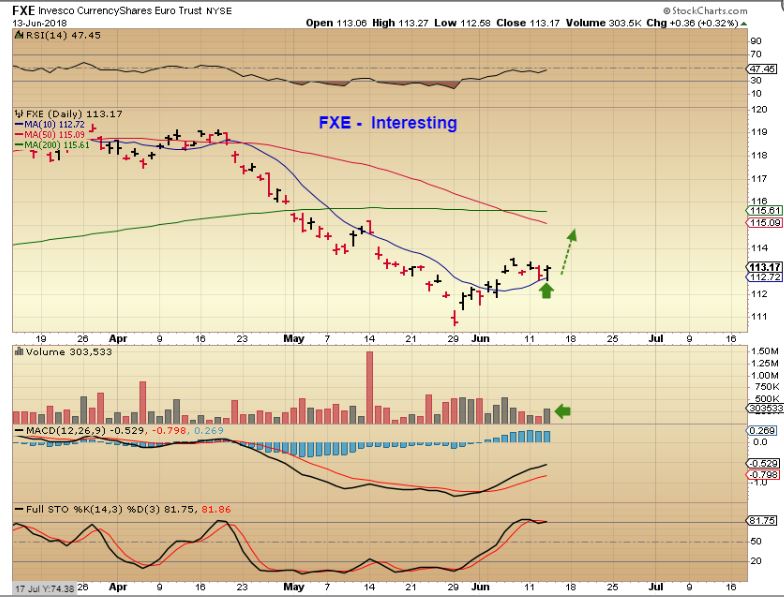
FXE ( EURO) – Honestly, the EURO looks like it wants to go higher. This would likley cause the USD to drop further if it does though.
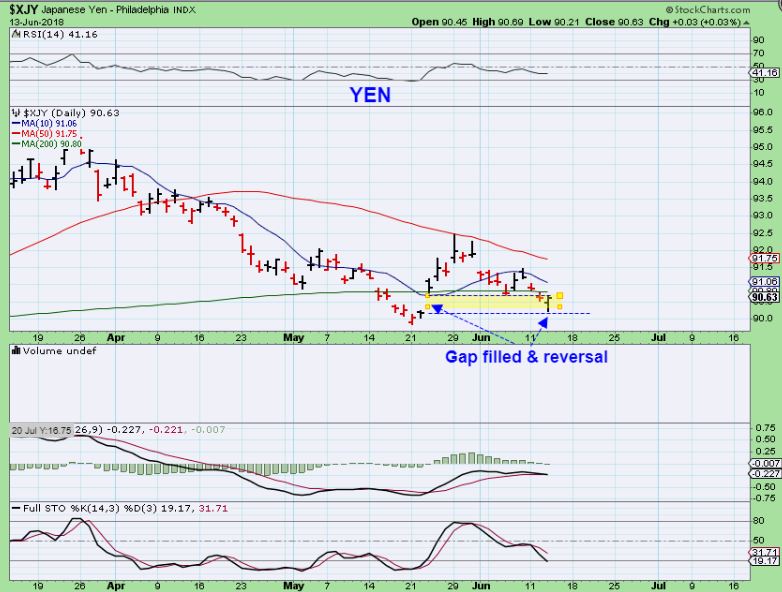
XJY ( YEN) – The YEN looks to have filled an open gap & put in a bullish looking reversal on Wednesday.
THE REACTION AFTER THE FED DECISION- As usual, we got the false move down and then a recovery. This is usually a bullish move, a shake out to drop off some new buyers, so this ‘Looks’ bullish at this point. As you can see, The USD Popped 7 then gave it up.
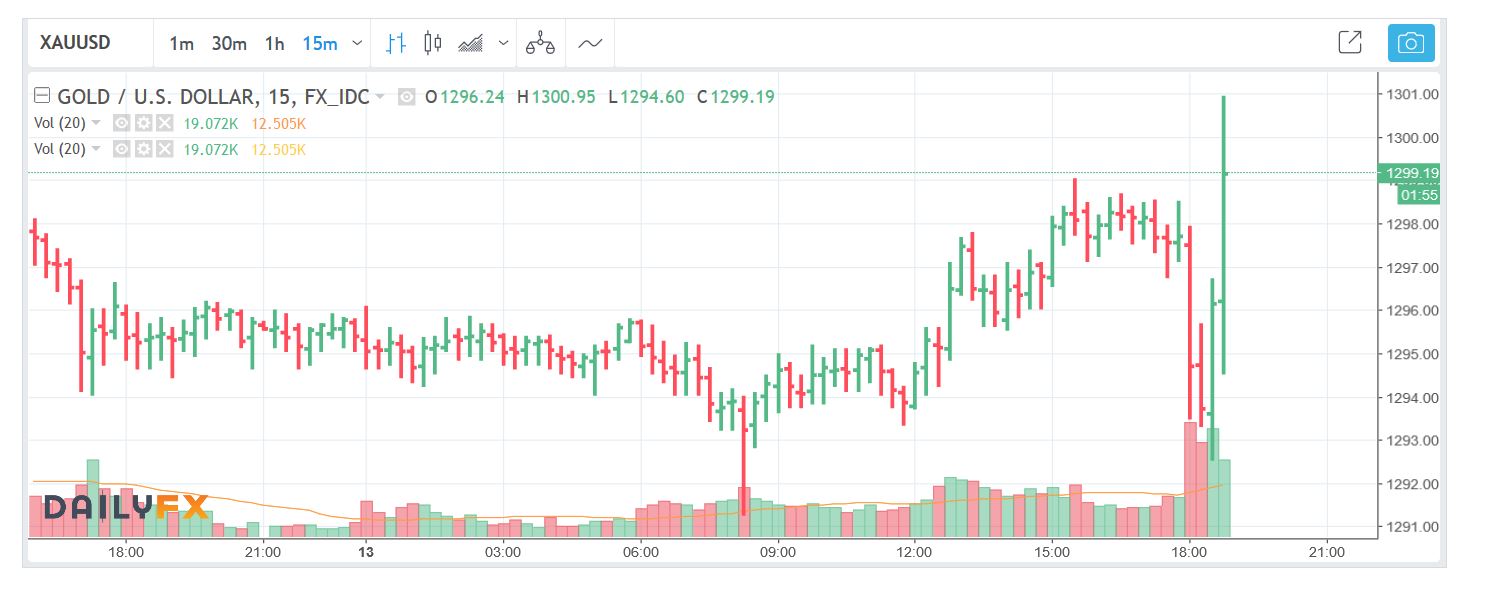
GOLD – I posted these 2 charts of that bullish looking shake out in the comments section, and mentioned that I added to my position with that apparent shake out (Since I can just use that high volume slam down as a point of reference for a stop if I wish). This is a 15 minute chart…
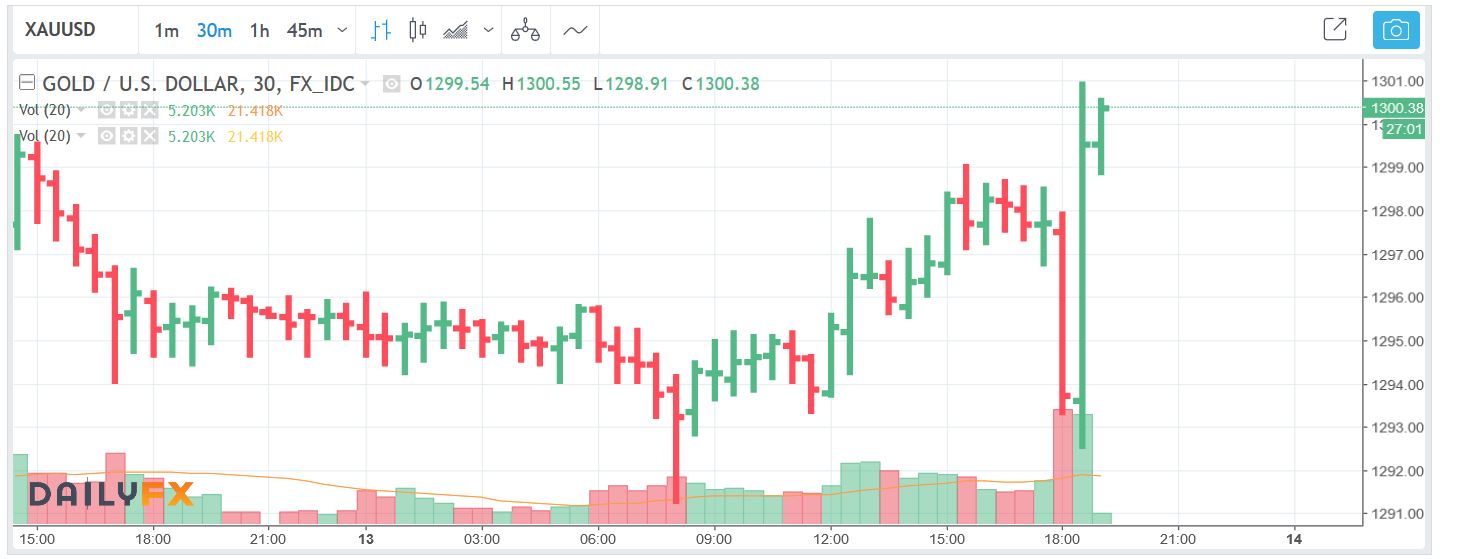
GOLD – This is a 30 minute chart and the sell off did not violate any lows. The reversal higher had as much volume as the drop. “It is bullish until it is not.”
GOLD – The daily looks less dramatic, but this is viewed as a reversal on day 16. Remember that the Dec 2015 ICL also saw price go sideways for weeks before moving higher. So this CAN still be an ICL in place, and we’ll see what the ECB meeting does, if anything.
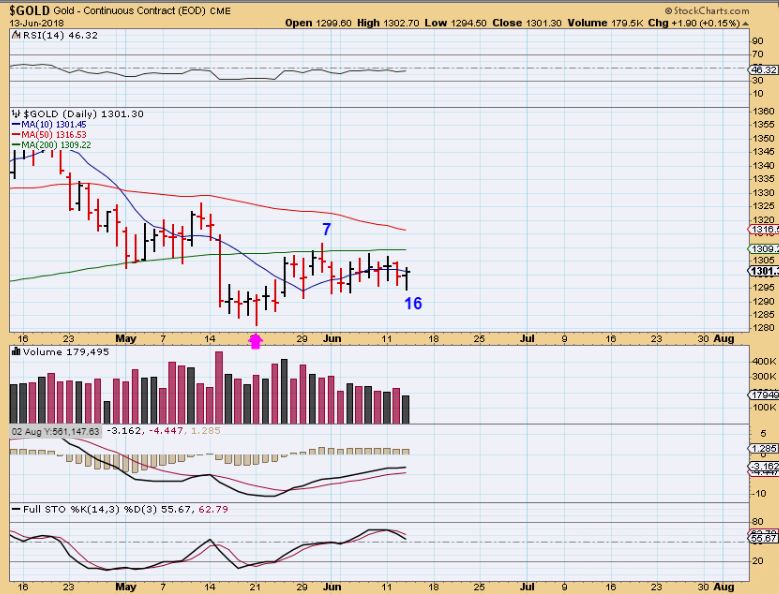
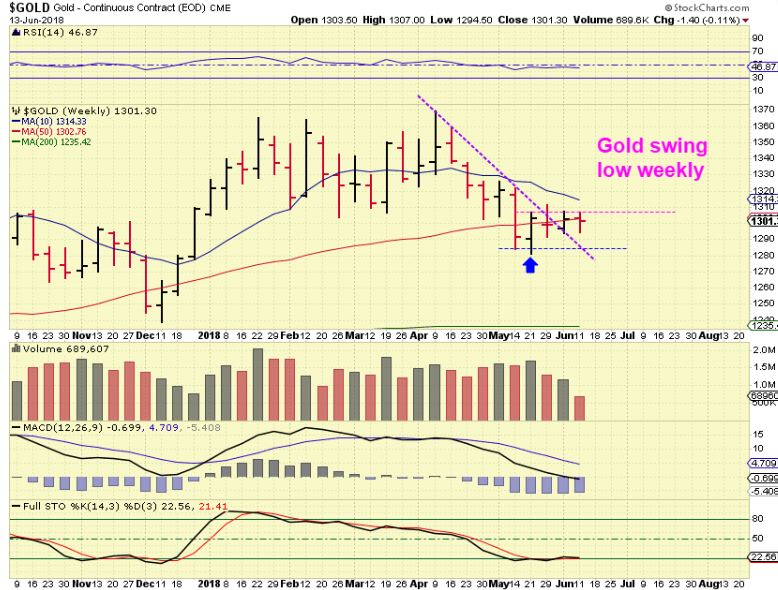
GOLD WEEKLY -We do have a trend line break and a swing low with the arrow pointing out the low, an the next week breaking higher than that candles highs. This is more of a bullish set up than not, but I did see this last October before a final drop, so I am not ‘All in”…
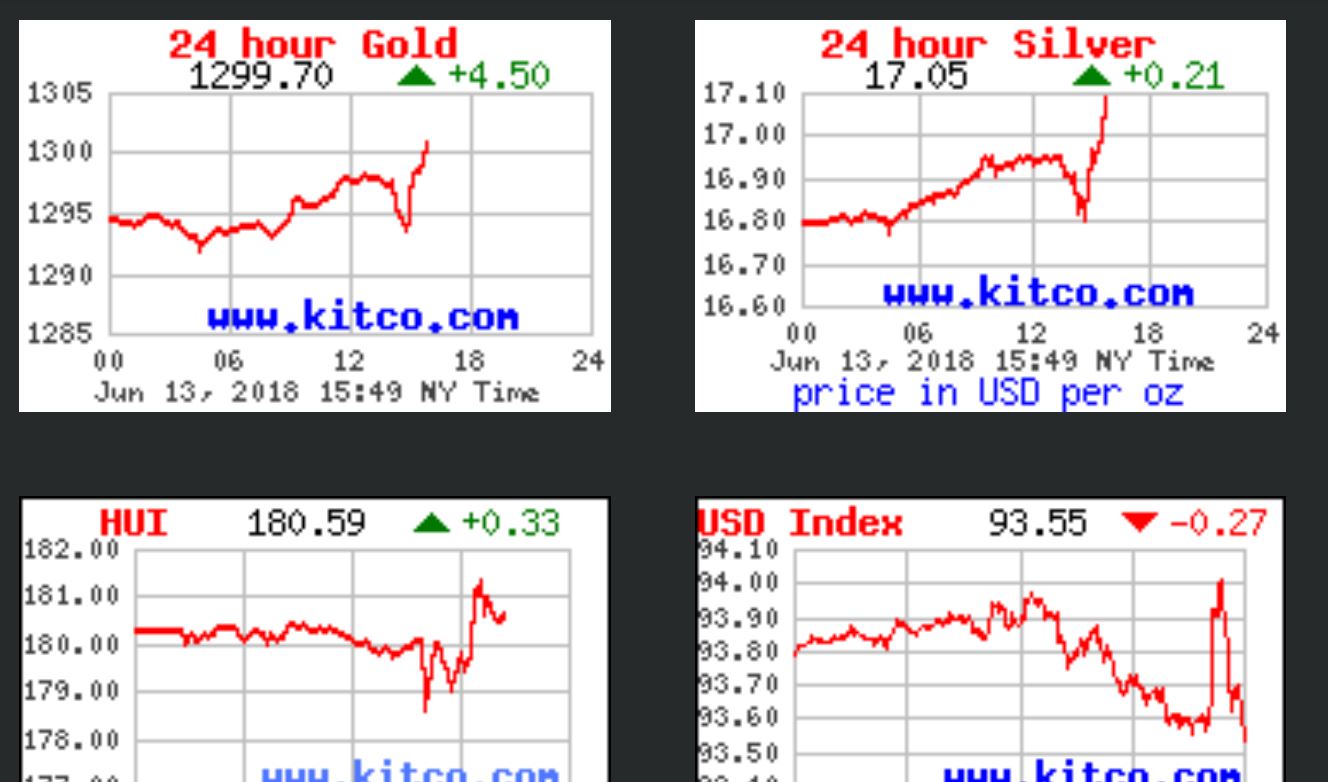
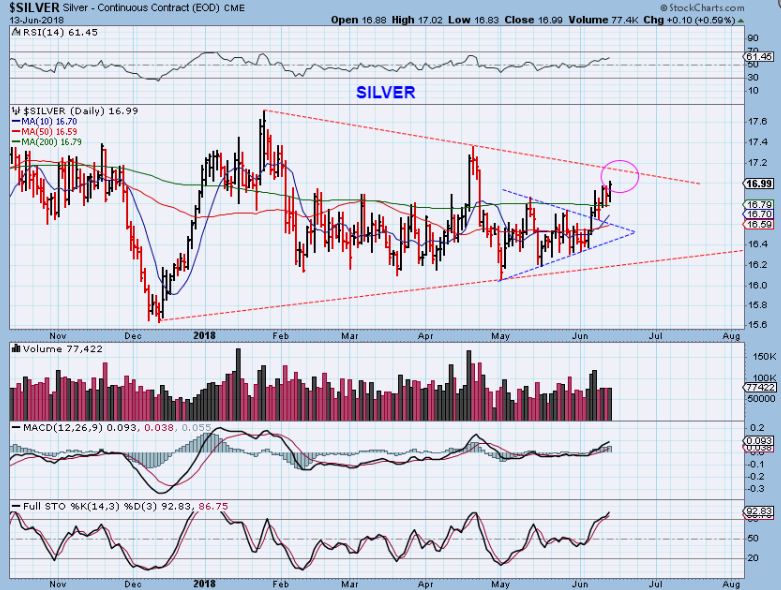
SILVER – Silver continued higher too.
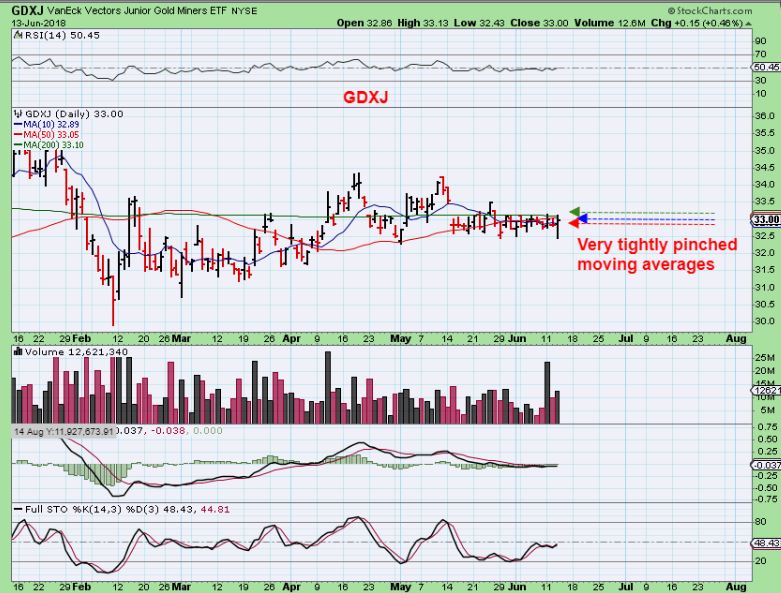
GDXJ – Look at how tightly the moving averages are being pinched. This can lead to explosive moves. I would love to see a solid break & run higher from here.
By the time The Markets open in the U.S., the ECB decision should be behind us and we will know if their decisions and discussions are a catalyst for the Precious metals to start moving one way or the other. We are due for an ICL and as pointed out- We either have one in place now, or we will have one in the near future. Even if we do sell off, I believe that the sell off s downside is limited. Why?
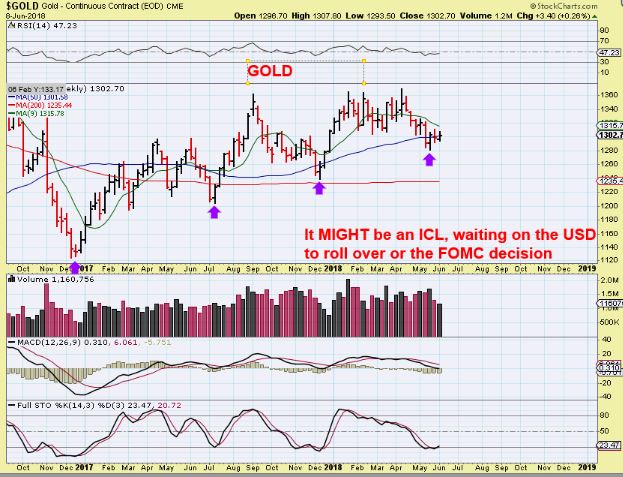
This Weekly Gold Chart from June 9th shows that Gold has been putting in higher lows with each ICL. I DO NOT think that this ICL will break the last low, so downside is limited and the ICL may even already be in place 🙂
I want to point out some more of those Bullish looking charts of Miners at the end of this report. Enjoy your Thursday trading!
.
~ALEX
.
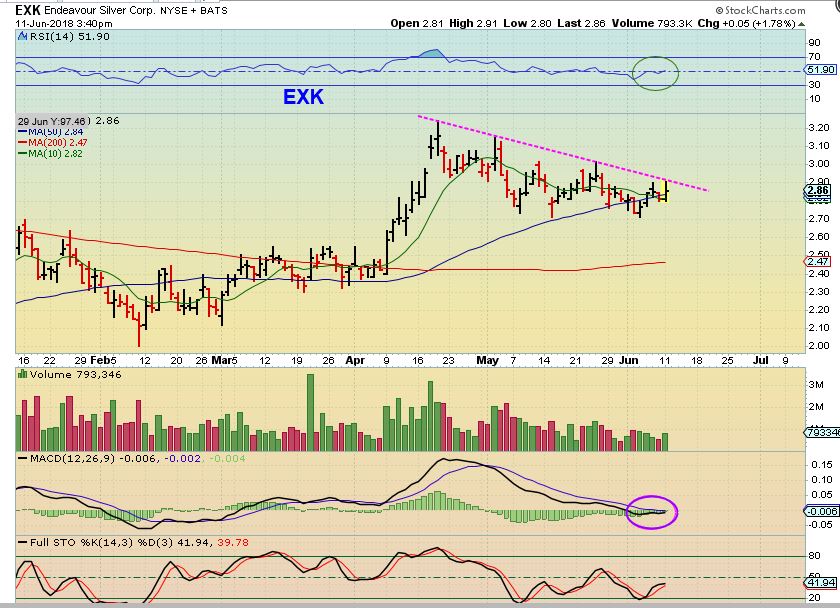
EXK DAILY – I pointed this out as a bullish set up and mentioned that I bought it. STARE AT THIS CHART SET UP & REMEMBER IT.
EXK DAILY – It broke out & really stretched out on Fed Wed. Again, that ‘set up’ looks…
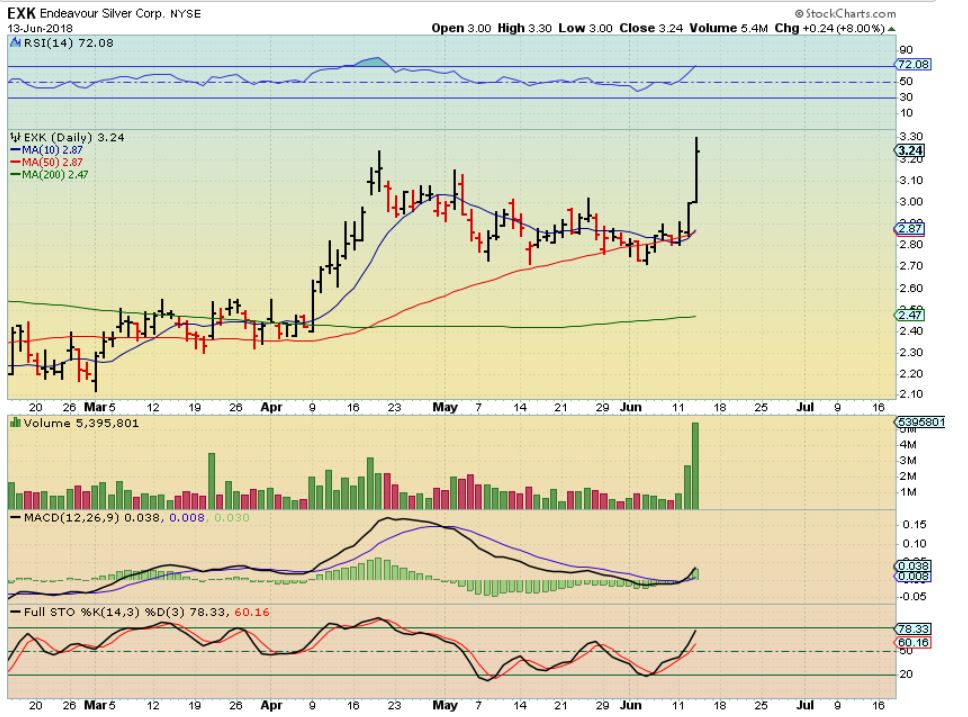
…Very much like this set up
.
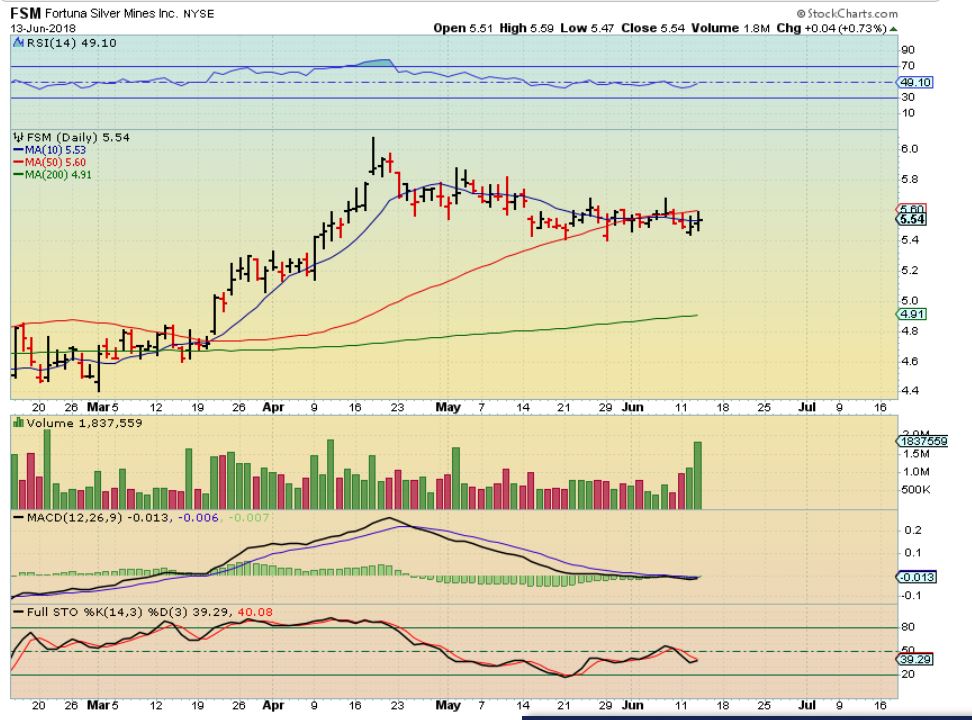
FSM DAILY – Look at the volume surge yesterday. Watch for this to break higher ( like EXK) and if it does, you may want to take a position. And…
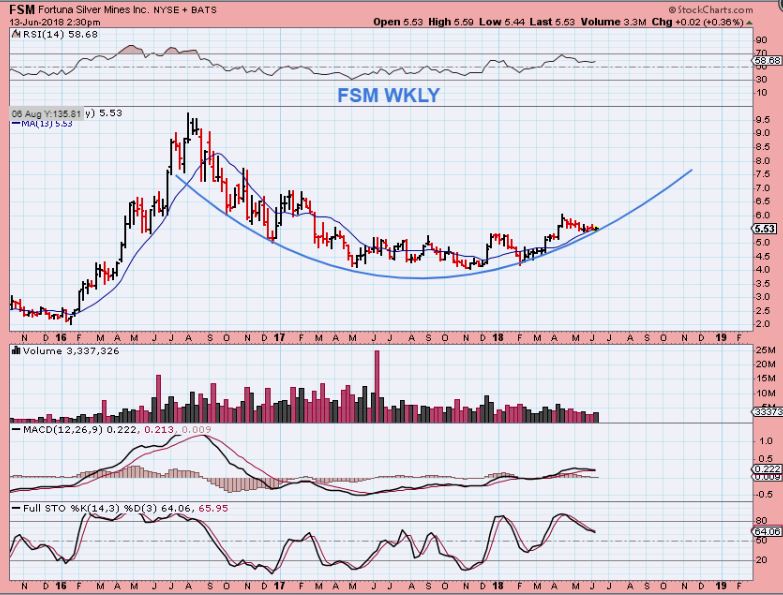
FSM WEEKLY– The weekly long term chart is very nice too, with a rounding bottom base forming.
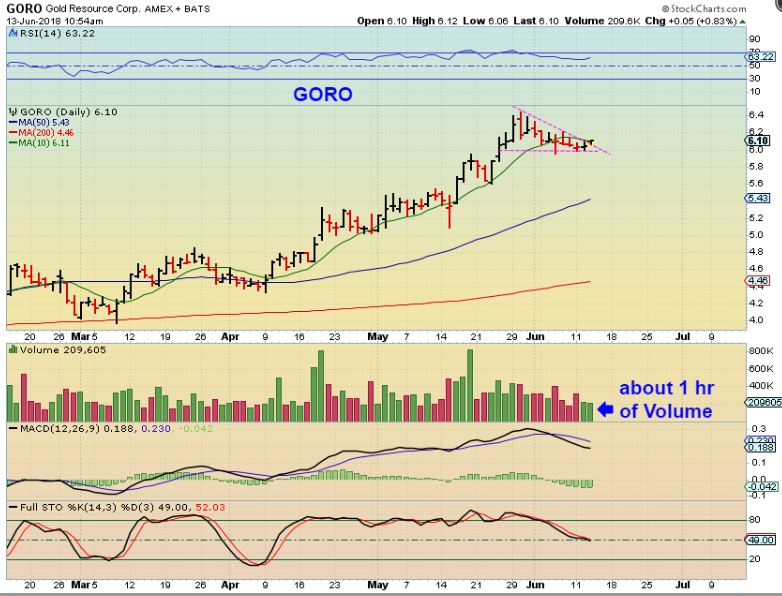
GORO– Goro looks ready for another leg higher, and I posted this in the morning in the comments after just an hour & 1/2 of trading. Look at that volume in just the first hour.
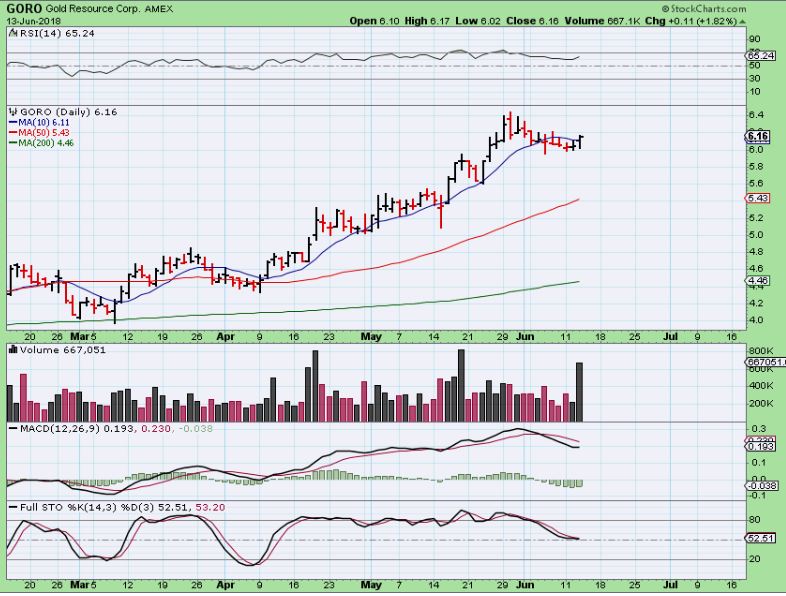
GORO– This is GORO after the Fed and at the close. Now look at the volume and it closed above the 10sma. This also looks very bullish and if the ECB doesn’t drop Gold very much or Pops Gold, it could be bought with a stop below recent lows.
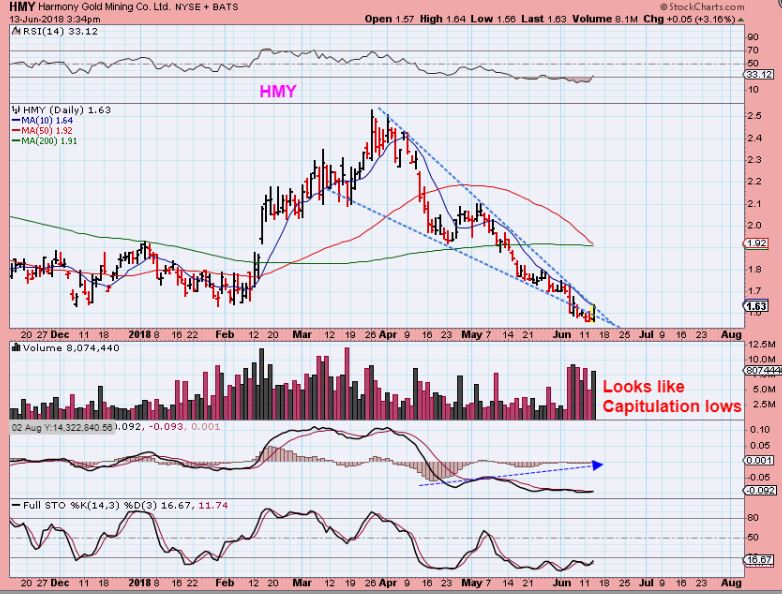
Maria mentioned HMY after the Fed Decision, so I took a look at it, and it does look quite impressive and this one is RIGHT AT THE LOWS. You haven’t missed a thing 🙂
I drew up 2 charts…
HMY #1 – Look at the capitulation volume and a descending wedge appears to be ready to break out. The MACD HIST is rising as price dropped. A break above the blue line is bullish, and …
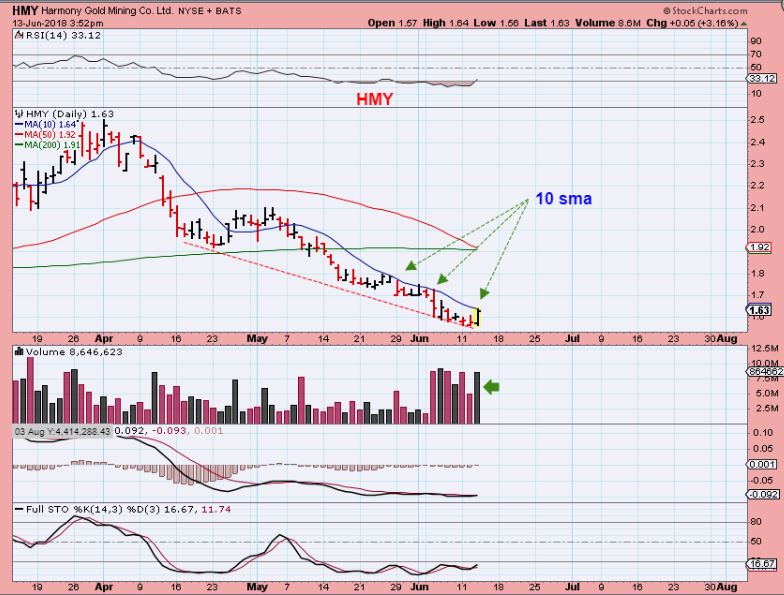
HMY #2 – I wanted to point out also the 10sma and how price pushed with volume on it yesterday. It is very oversold, and a break of the 10sma could easily run to the 200sma for a quick trade, but it also may just break through.
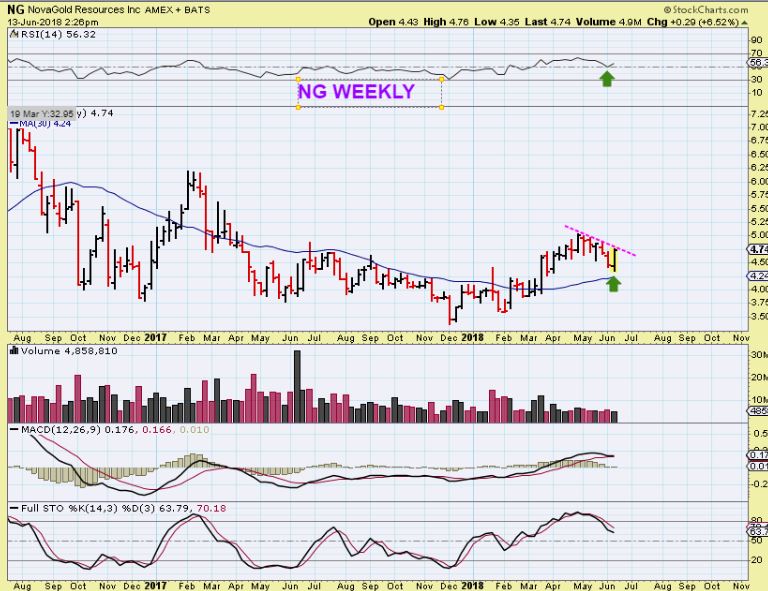
NG – The weekly chart of NG shows that the RSI is reversing higher on the 50% line and price is about to break a mini down trend. MACD is also tagging & curling higher. A break out could be bought with a comfortable stop.
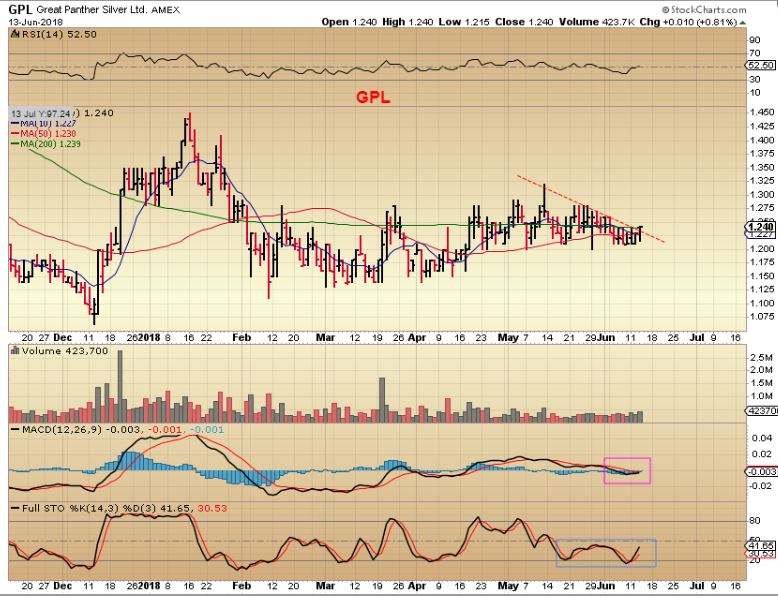
GPL – This is not a super impressive set up, but it is Silver and it is bullish if it breaks higher. Also, look what it did last December after a tight sell off.
SO BASICALLY, THESE & OTHER CHARTS THAT I HAVE SHOWN SHOULD BOOST CONFIDENCE AGAIN. WE ARE SEEING MANY BULLISH SET UPS IN THE MINERS, AND WE SHOULD OWN SOME IN OUR PORTFOLIO BY NOW – WHATEVER SIZE THAT YOU ARE COMFORTABLE HOLDING. KEEP IN MIND THAT I DO NOT EXPECT A BEAR MARKET SELL OFF INTO AN ICL IF GOLD DOES SELL DOWN FROM HERE, WE SHOULD HOLD ABOVE THE LAST ICL.
.
MJ STOCKS
.
We saw a sell off after the Canadian vote passed in some MJ Stocks. I felt that it was just a normal sell off, and even should become a buying opportunity for those that wanted to buy or add. Let’s look at a few nice developments that took place Wednesday.
.
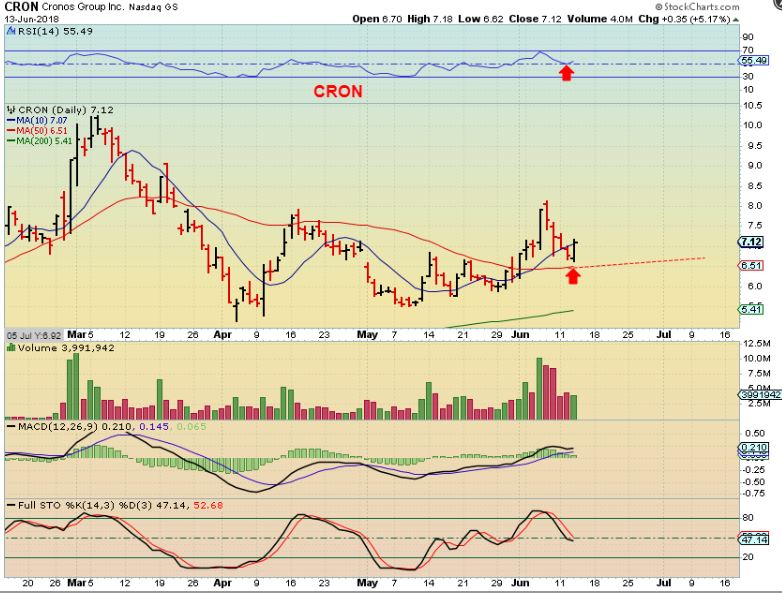
CRON – CRON ( trades on the NASDAQ) put in a reversal on Wednesday and this looks like the selling may be done. That is a bullish engulfing and it even closed above the 10sma. I added to my position and will be looking for follow through .
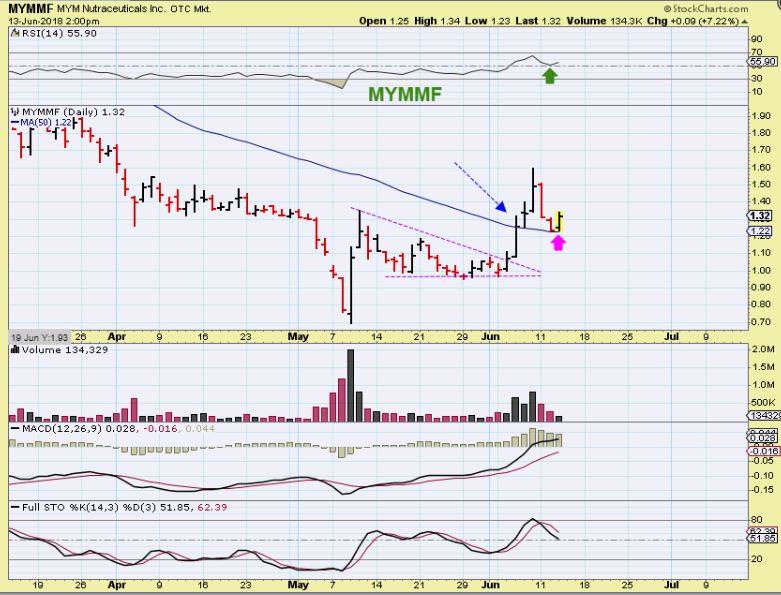
MYMMF – Also putting in a reversal at the 50sma ( break out & back test)
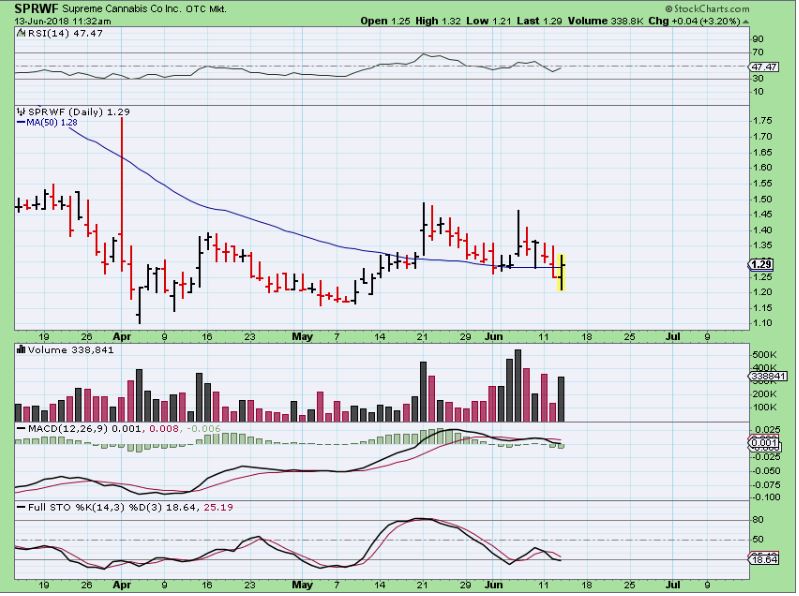
SPRWF – I grabbed this chart at 11:30 a.m. as it dropped below the 50sma Tuesday & tried to recover it with strong volume. By the close the volume was the same as the highest one in the picture. Watch for follow through and this could be bought.