After my long weekend report, I was planning on just a quick cover of the markets and then discussing various Miners. That plan changed a bit when the market action also changed a little bit. I received a few emails discussing concern over Italy leaving the Eurozone, and problems with Greece, the Euro, etc., and the possible affect on US Markets, so now I’ll just briefly discuss this and a number of things…
SPX – I’m looking at 2 things here. Yes,our General Markets dropped a bit, but if Italy and Greece have problems, the US markets could also be considered a bit of a safe haven area. Money could eventually flow into these as an investment, so…
1. If this reversal at the 50sma holds here, this is a nice set up as a low risk entry. It looks like a back test of the recent break out too.
2. If it closes below the 50sma, I would be concerned that things could be breaking down and would become more cautious until things settle down.

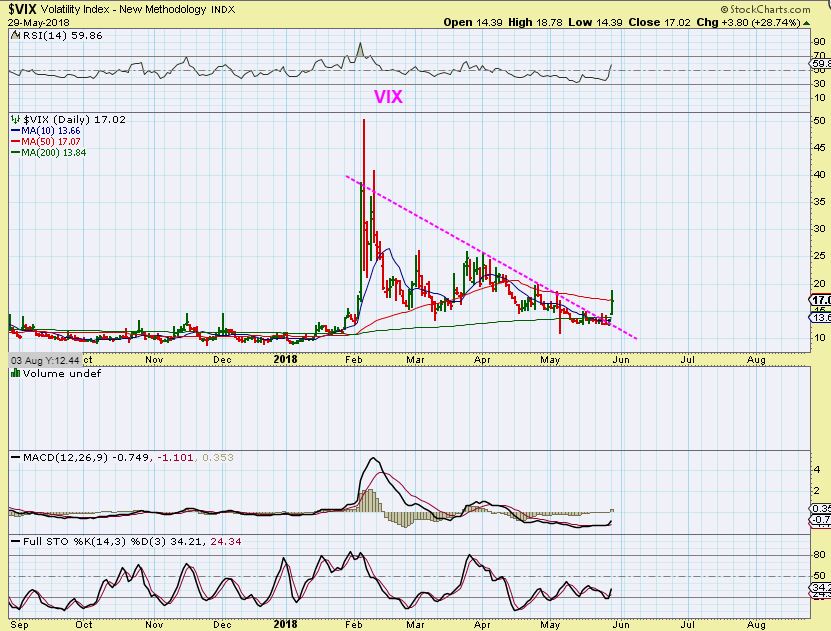
VIX – So the VIX popped after crawling along under the 200sma for weeks. You can see ‘Pops’ in the past that did not have a lot of follow through (Oct , Nov, Dec of 2017), and then when the markets sold off sharply in Feb, the Vix popped and continued higher. So I’ll be watching the VIX Wednesday, among other things. If the VIX keeps running higher, that SPX will likely close below the 50sma.
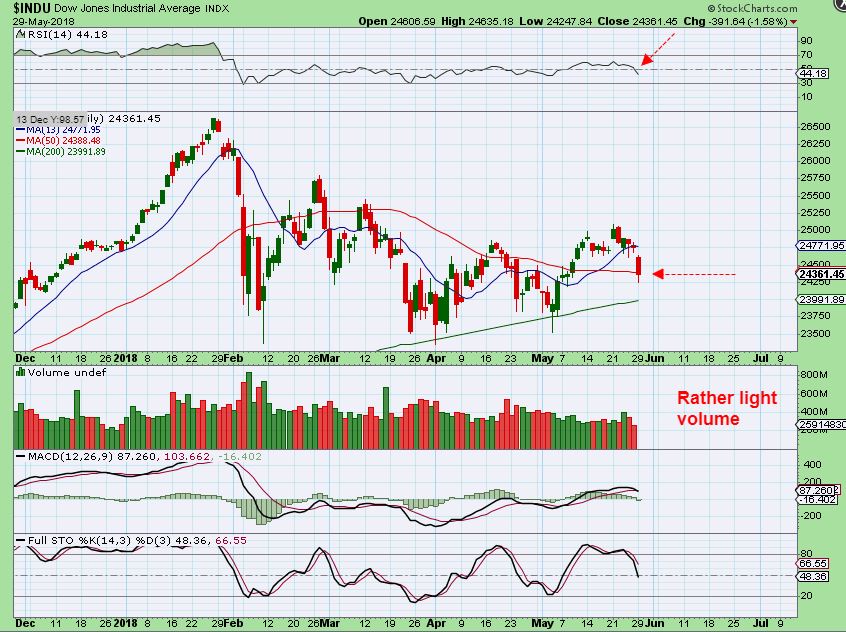
DJIA– The down lost over 500 points , but recovered into the close. This left a possible ‘shake out’ at the 50sma area. Volume seemed light. If this drops to the 200sma, it is not as concerning to me, but we’ll see how this plays out.
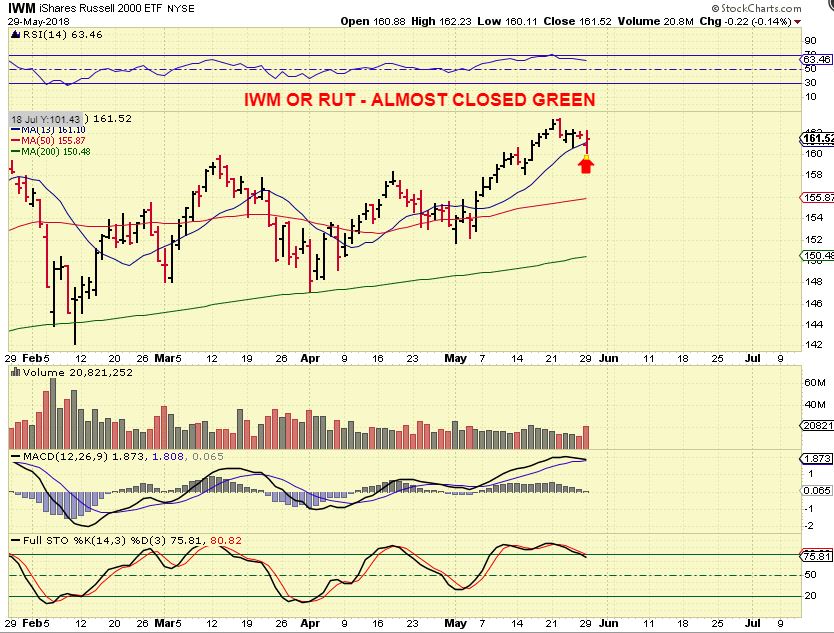
IWM – The IWM & RUT are still up near the highs. IWM lost the 10sma and then recovered it. AT THIS POINT, yesterdays drop was just a wiggle in this chart.
So for the General Markets, there was a bit of a shock-wave, and we’ll have to watch things a bit more as they play out. This could just be another small reaction that recovers quickly. The SPX actually looked like a perfect back test, while CNBC and other Market commentary scrambled to discuss the dangers of Italy, Greece, Portugal, High Yields, Debts, etc. The US Markets could actually become safe haven, AND SO COULD PRECIOUS METALS over time.
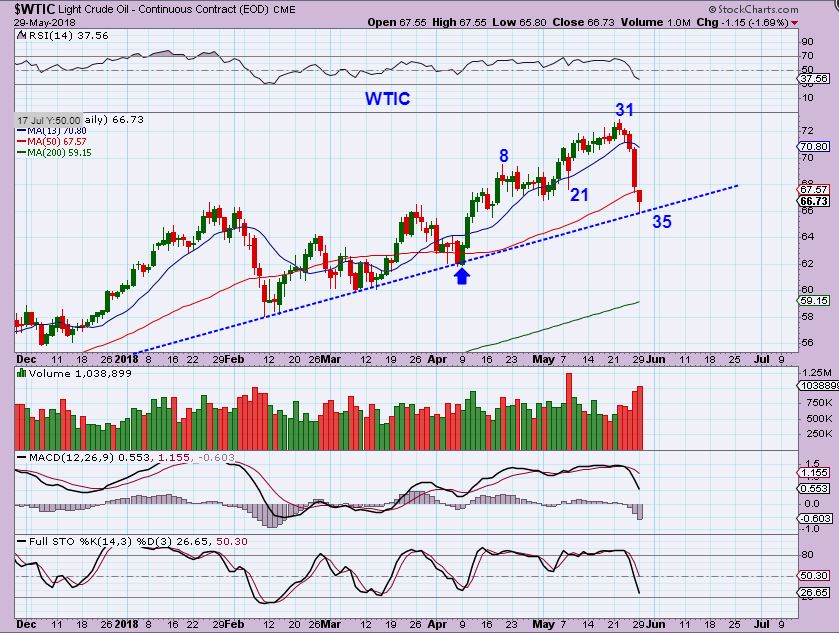
OIL FROM MAY 22 – I was watching for a drop , as this rising bear wedge was forming and the cycle count entered the late 20’s , early 30’s. I mentioned the 50sma a few times.
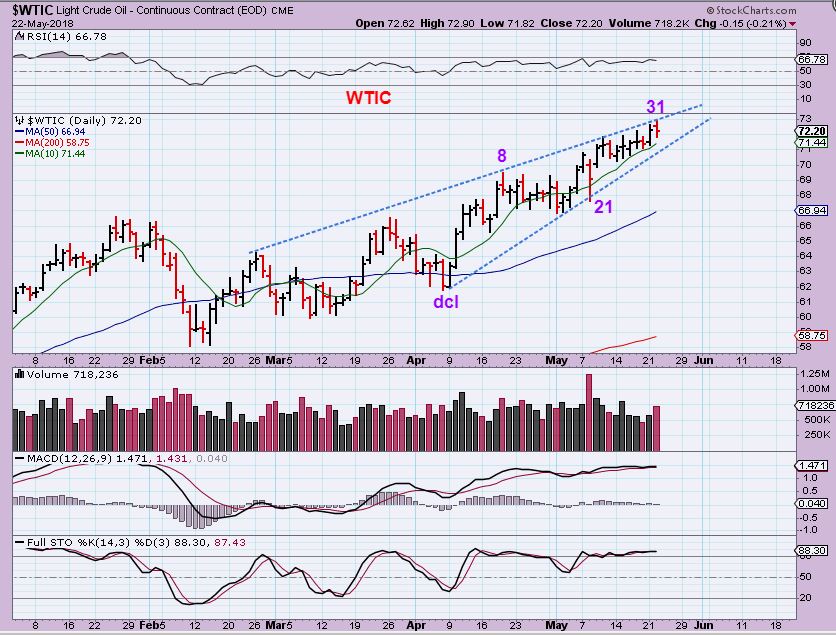
WTIC – We have a reversal on 1 of the trend lines, but lost the 50sma. Many are expecting that OIL will now turn higher and continue the run, but there are reasons to believe that OIL may now consolidate. If you bought this reversal, it could be good for a bounce, just raise your stop if it bounces. I am thinking…
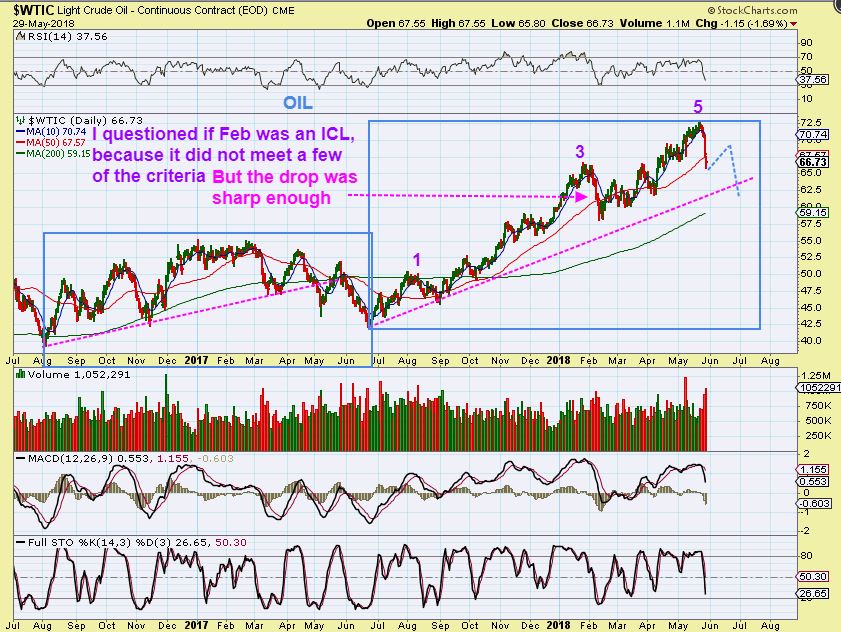
WTIC – I am thinking that we may get that A-B-C Type drop that I usually look for at an ICL. Whether FEB was the real ICL or not ( as mentioned, it did not meet certain criteria that I personally look for, but it was a pretty sharp drop), this could be a 1-2-3-4-5 move ending, and this could signal a deeper drop that DOES break the trend line ( Feb didn’t). Time will tell, but this run to the $72 area met the target that I was mentioning $72-$74. This may be a top for a while, until gains consolidate. WEDNESDAY IS WHEN THE OIL INVENTORY REPORTS ARE RELEASED, let’s watch OIL Wednesday. Raise stops to the 50sma if you bought that reversal and it bounces.
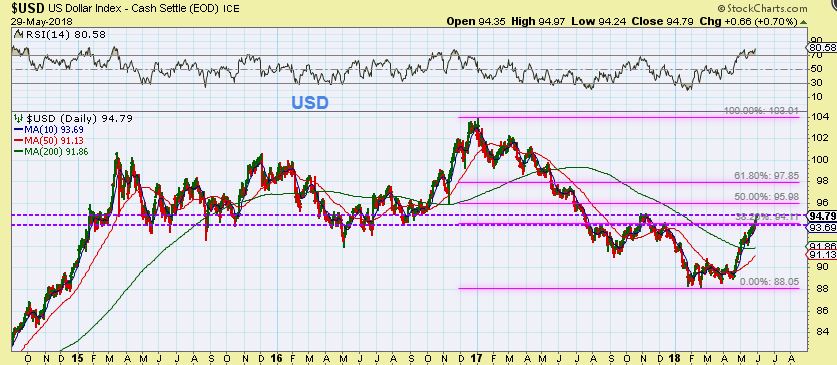
USD #1 – This has been a very strong run out of that multi month mini-base. It has bounced over 38% of the entire 1+ yr drop and could bounce 50% before it is done. It should be in a resistance area, but it still surges on. Lets zoom in for a closer look…
USD #2 – Look at Tuesdays surge, along with the past 2 weeks of almost a straight up run by the USD. Normally we would expect Gold to drop in the same manner, which would be straight down for Gold. Has it?
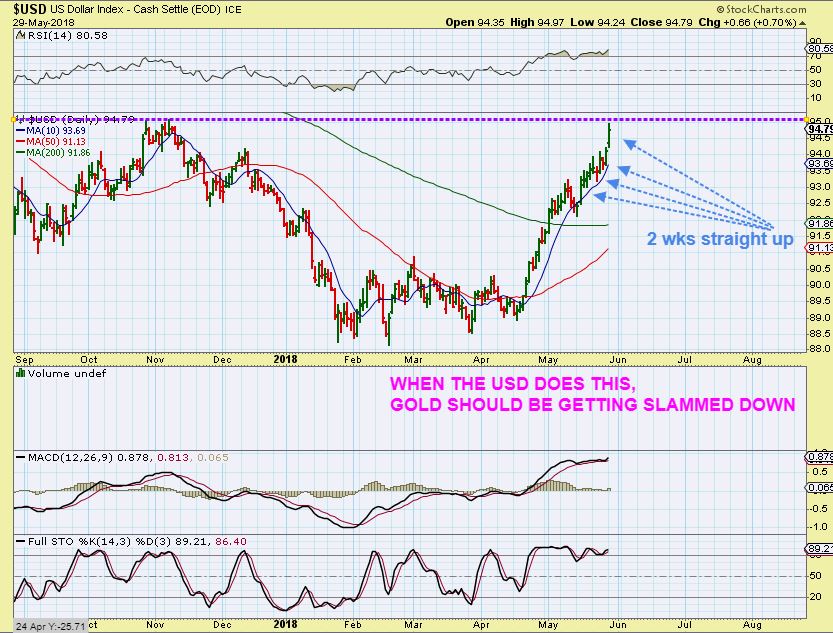
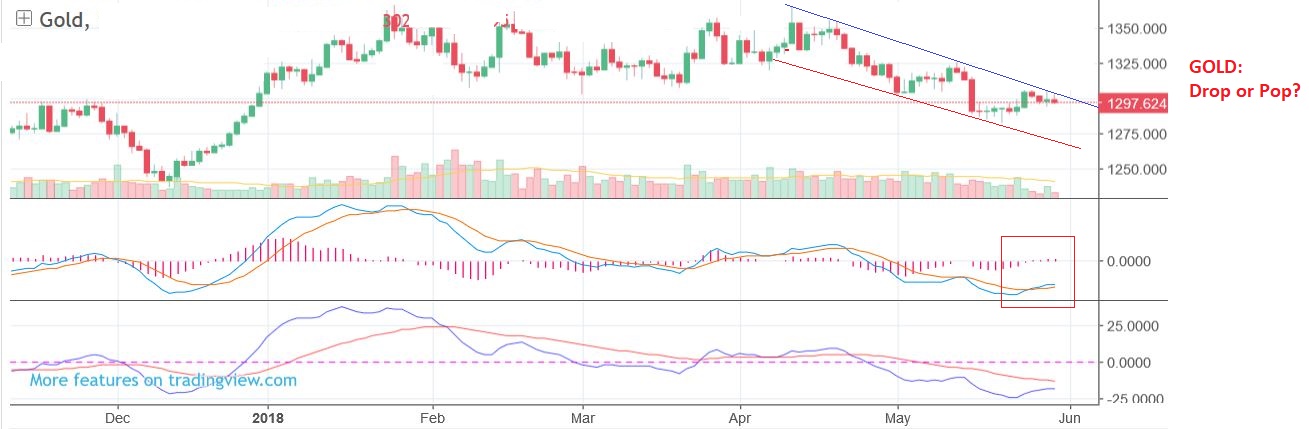
This was a Daily GOLD chart as of Tuesday morning. THAT is not dropping straight down day after day at all. GOLD is holding up very well so far. This is Gold rising up and pushing on resistance, attempting to break out higher as the USD spikes higher. When the USD finally begins to pull back, I think that GOLD is going to break out and rally too.
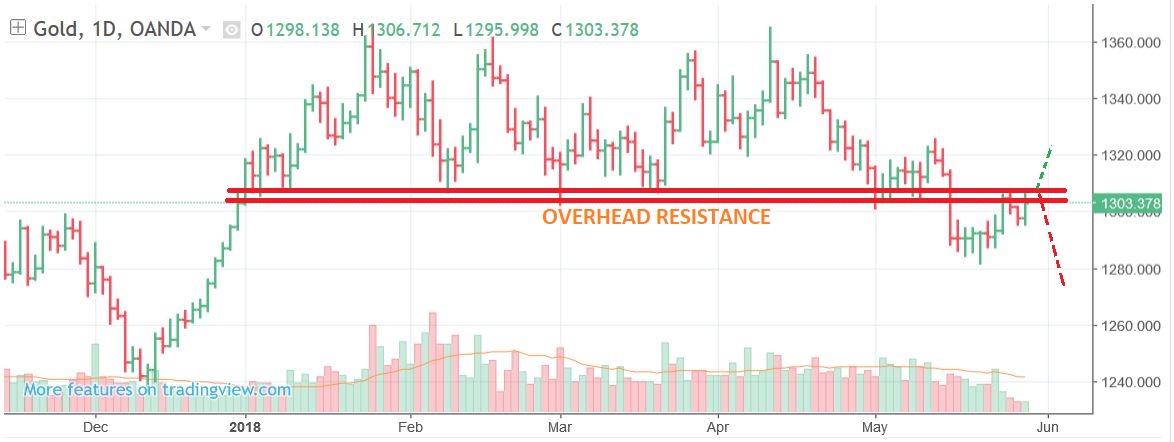
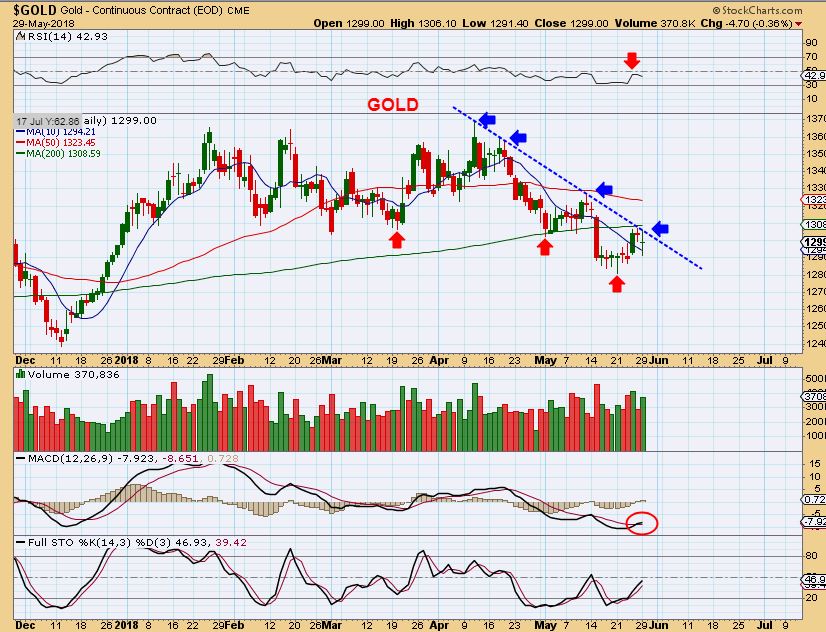
GOLD DAILY – If Gold breaks & closes above this trend line ( and 50sma), it should be viewed as a buy, and the lows could be in place. AT least your stop would be close to your buy. As mentioned in the weekend report, we still may have another sharp drop to an ICL that would scare buyers, shake out those already holding, and dampen sentiment before a sustained lift off- so keep that in the back of your mind as time moves us forward. I would be holding at least a few Miners for insurance, just in case it takes off. If GOLD drops, I’ll then add to my Miners on a reversal, since that could be the final lows. We’ll discuss a few miners at the end of the report.
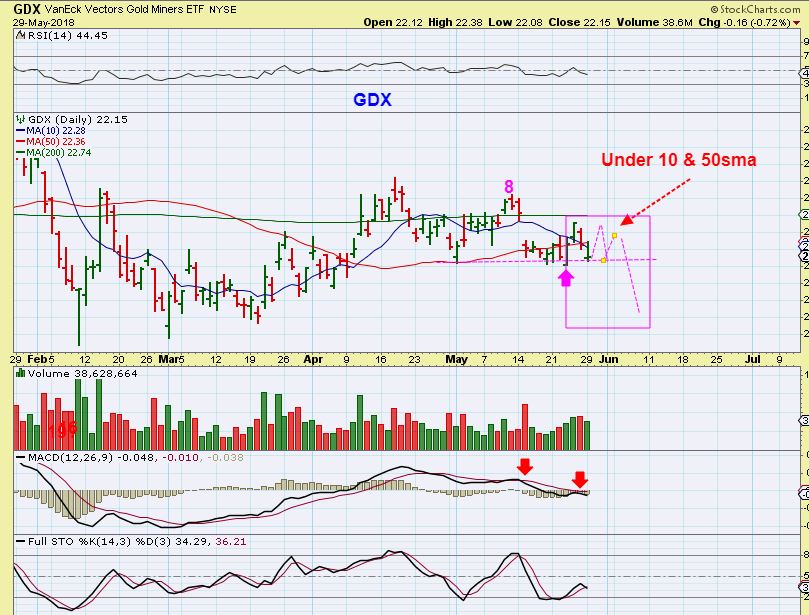
GDX #1 – GDX lost the 10 & 50sma and gapped down, moved higher midday and closed that gap, and was held back at the 10 & 50sma as resistance. This may be day 19, with a day 8 peak. The MACD looks weak.
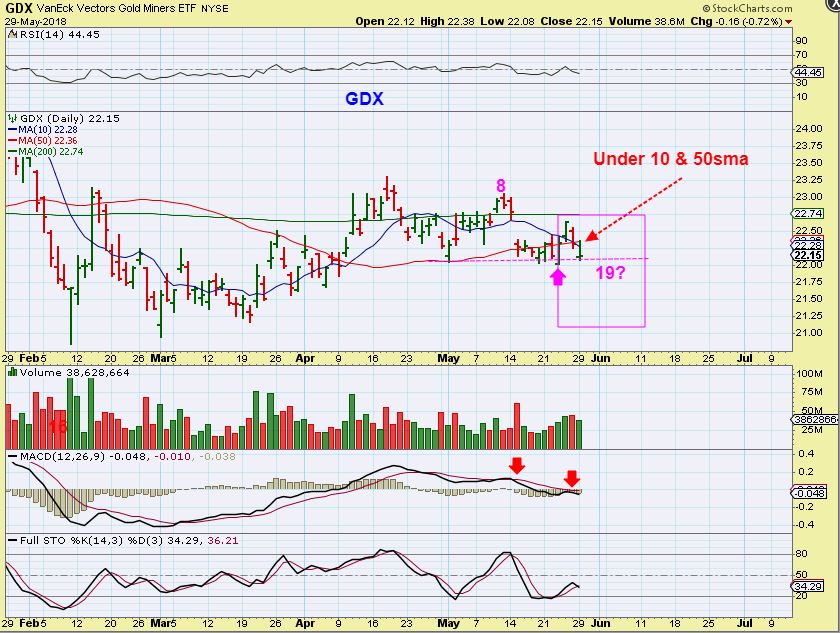
GDX #2 – Just an idea, but we may see a drop to new lows, a back test of the recent lows, and 1 final drop, or…
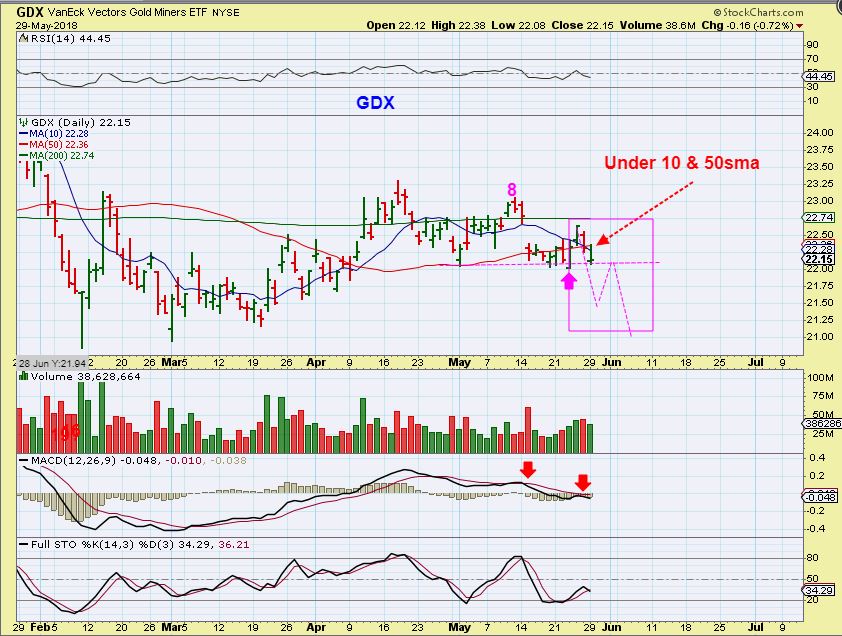
GDX #3 – This sideways chop that is frustrating day after day, may continue, until GOLD is ready to make a move higher.
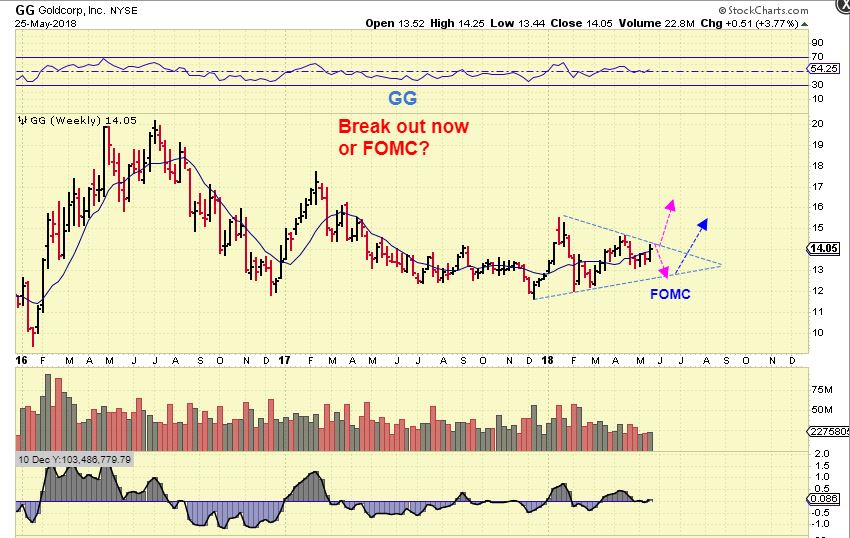
GG MAY 25th – Last week I said that I usually keep an eye on GG, ABX, and NEM when trying to gauge whether GDX will break upward or dip down.
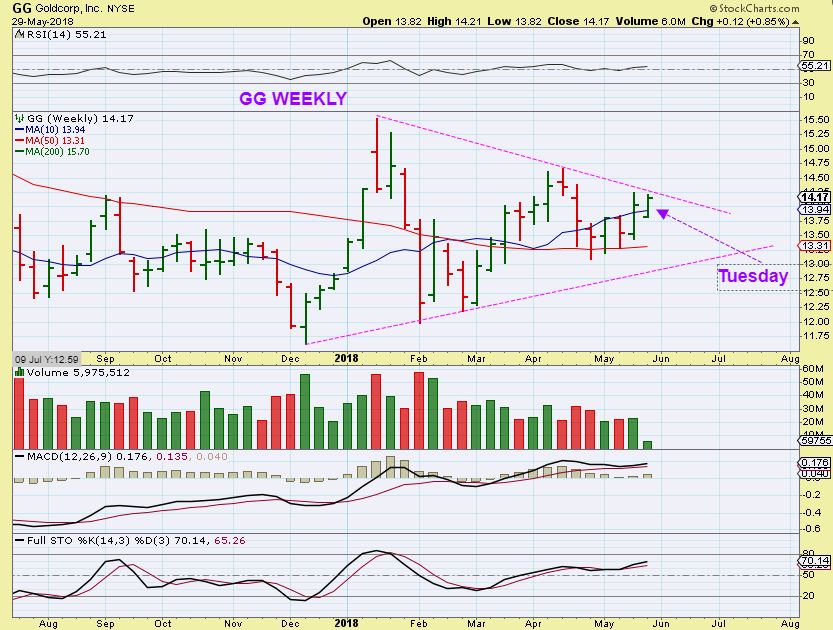
GG WEEKLY NOW – Monday was a holiday, so this is basically the weekly chart as of Tuesday.
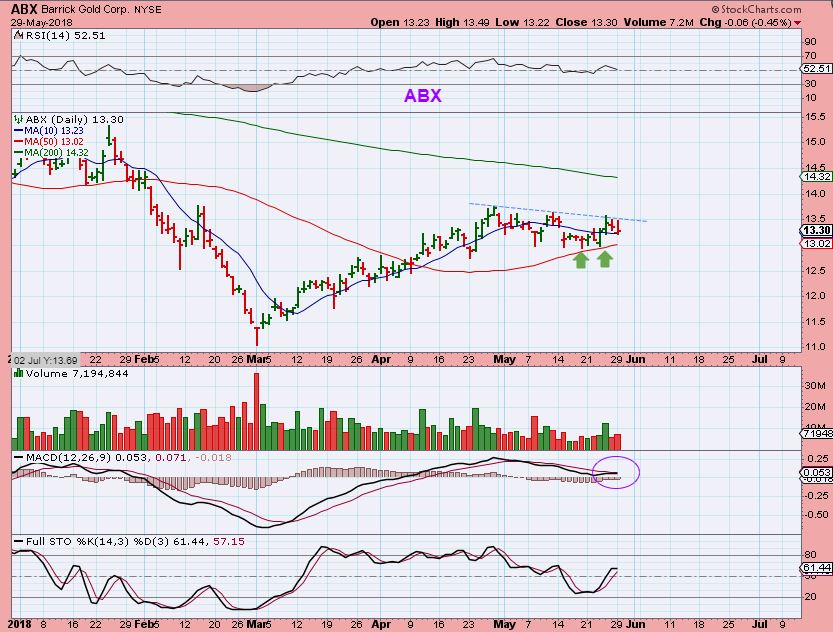
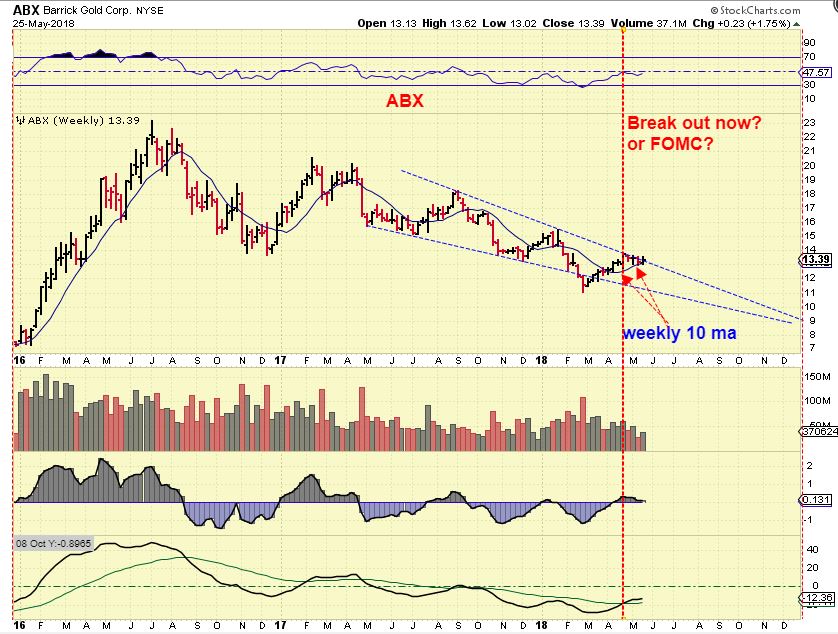
ABX – ABX has a bullish set up, so a break higher or lower could affect GDX in a similar manner.
So at this point, everything from the weekend report mentioned for Precious Metals remains the same. GOLD may have the lows in place and is building steam to break out above that trend line, OR It could have one final slam down low to go. I wanted to simply discuss Miners individually in this report, and let the weekend report speak for the other market sectors, but I got a few emails of concern about Italy, The General Markets, and so on, so I just needed to address that a bit too. That took up most of my time.
Below I am going to discuss 2 trades that I currently am still holding by request, and then I’ll post some charts of Miners in a different way. It may be time to add one or two if you still do not own any Miners. I have recommended several since March & April. If we get a large final drop, it will be time to load up and aim for the fences. If we get a break out above that downtrend line in Gold, and you see Miners taking off higher, that may be time to load up too. I will cover this day to day in the daily reports.
Enjoy your Wednesday trading!
~ALEX
BEFORE WE GET TO MINERS, BY REQUEST…
ENPH MAY 7th – This was a buy around $4 to $4.25 at the 50sma back in early May

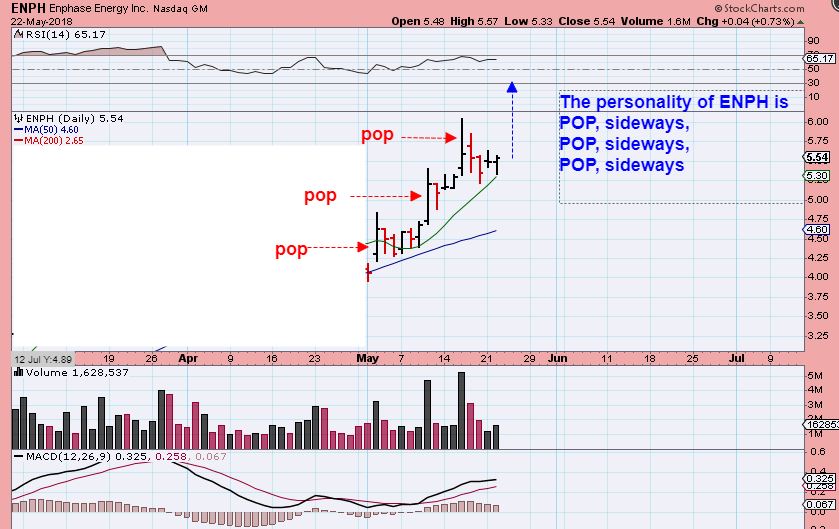
ENPH MAY 22 – As weeks went by, I posted this chart to point out how ENPH Pops, consolidates , POPS, consolidates, Pops. This was a good place to add…
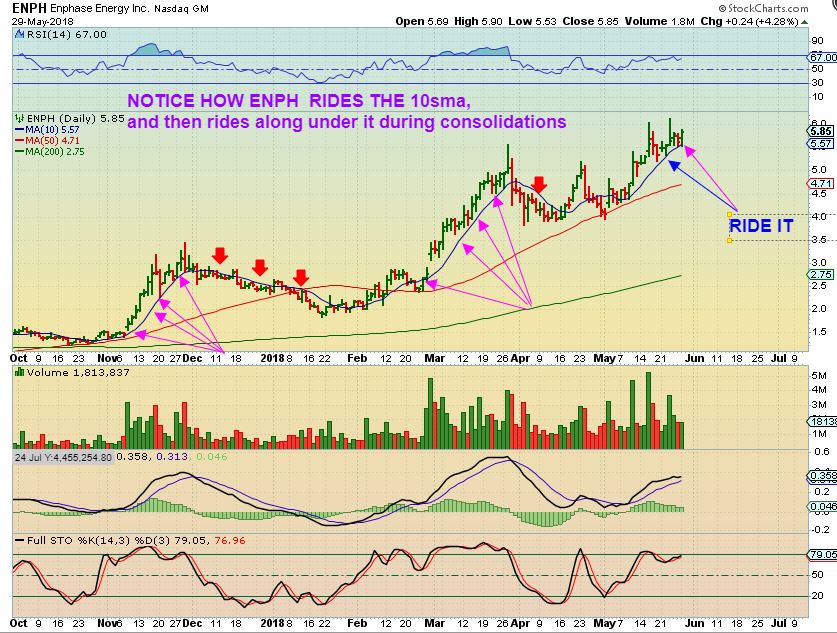
ENPH NOW – It has moved sideways to the 10sma again. It rides the 10sma as it runs higher, so just ride it for now. The Markets were down sharply yesterday and ENPH kept climbing.
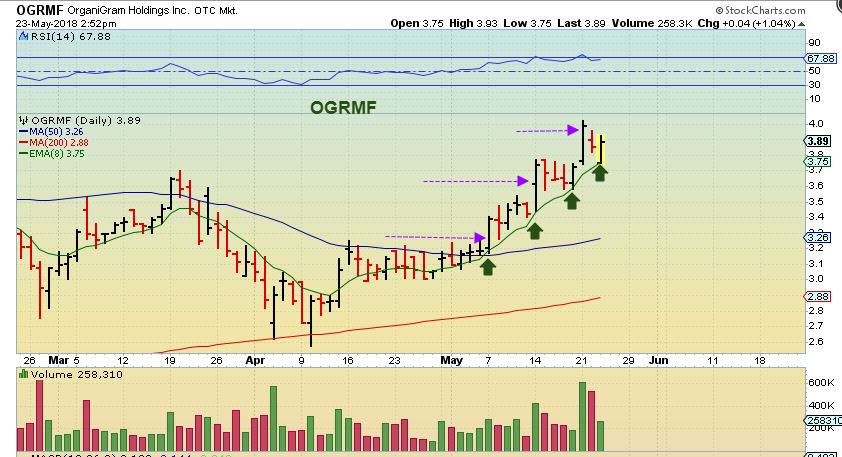
OGRMF MAY 23rd chart– We bought this at $3 in that sideways pattern, and recently I pointed out that it too climbs right up the 8 ema.
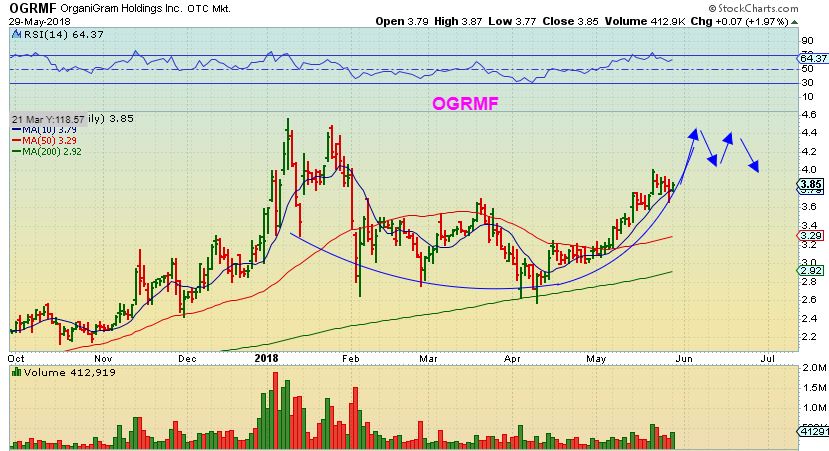
OGRMF – Using the 10sma here, it actually broke the 10sma and recovered on Friday. I still think that this is probably on its way to forming a cup around $4.40ish. I sold some last week, but still own a good portion.
MINERS – JUST THE BIG PICTURE
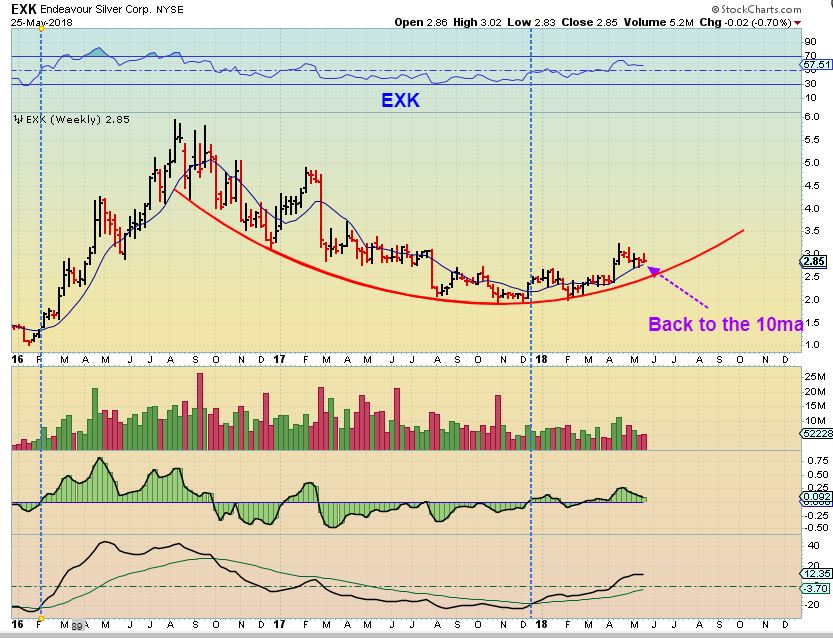
EXK WEEKLY – EXK is a Silver company, and when the Metals break higher, I think that the Silver stocks will out perform. This is a great base in the big picture. Right now it sits on the 10 weekly MA building a large base. A fast drop to an ICL would possibly take it to the red line, but it should then recover quickly. If the ICL is in, this may be all we see for a pull back here. NOTE: Using my special indicators seen at the lows, this was a buy in December (Blue line) and never went to a sell when EXK pulled back. It is above the zero line.
ABX WEEKLY – Is this ready to break out ( And help GDX) or does it need more time? Watch for a break higher by ABX to push GDX higher.
FSM WEEKLY – The last run higher for FSM looks small, but it ran from roughly $4 to $6 and has plenty of upside to go. This is just exiting that base area, and over time this should at least double. I bought this as a silver stock in March and sold it. I have been trying to get back in, and this may be all I get for a pull back- it has been strong. It is at the weekly 10ma, so it can be bought here honestly, if you can withstand the wiggles. Can you take some draw down? If we get a drop into an ICL by Gold & Silver, it may dip or it may even hold up, but it is a big picture bullish chart . THAT is a large round base forming.

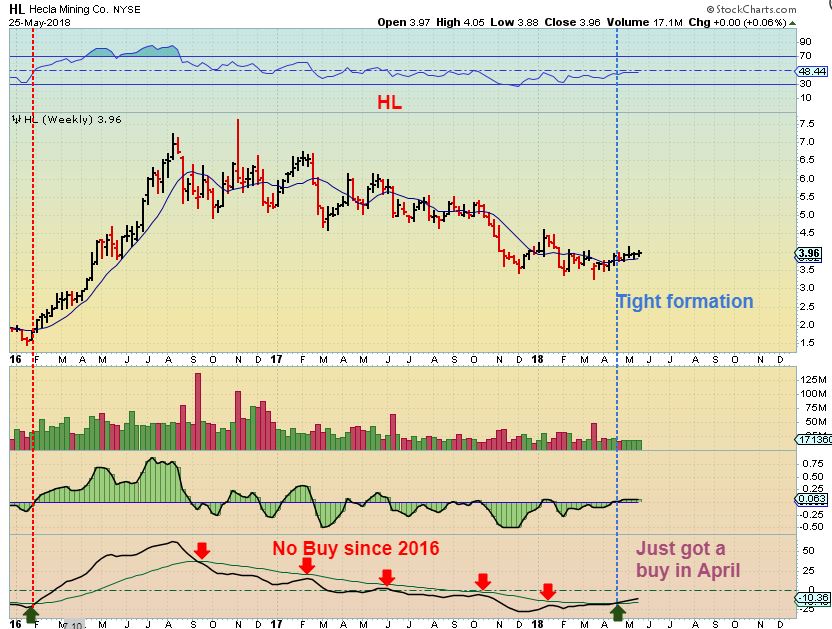
HL WEEKLY – HL has been in a tight sideways formation. The lower indicators show that even though Price has not moved sharply higher, the sideways move is Bullish. I expect HL to break & run higher when the time is right, but for now it has been sideways in the base.
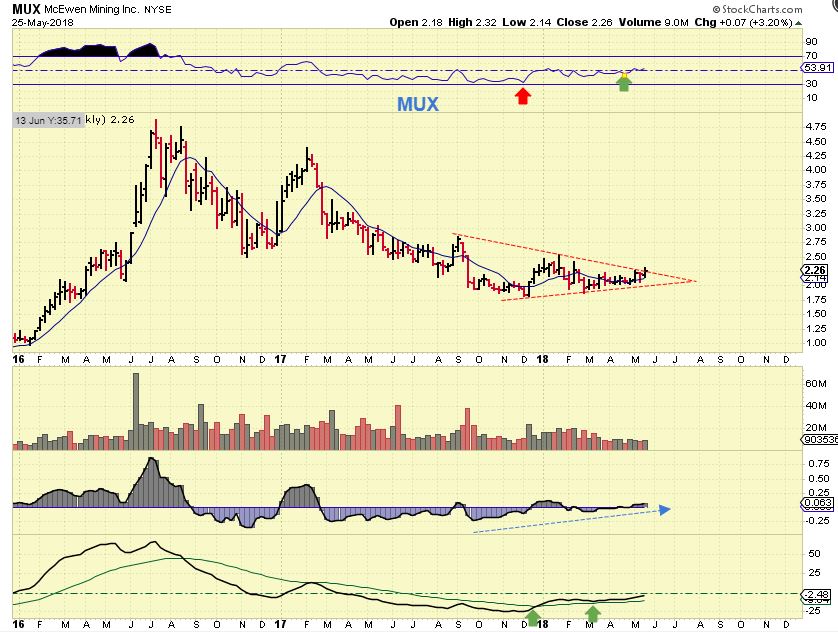
MUX WEEKLY – MUX is a large base and has recently been stabilizing. My indicators show improvement, but it is still below the zero line.
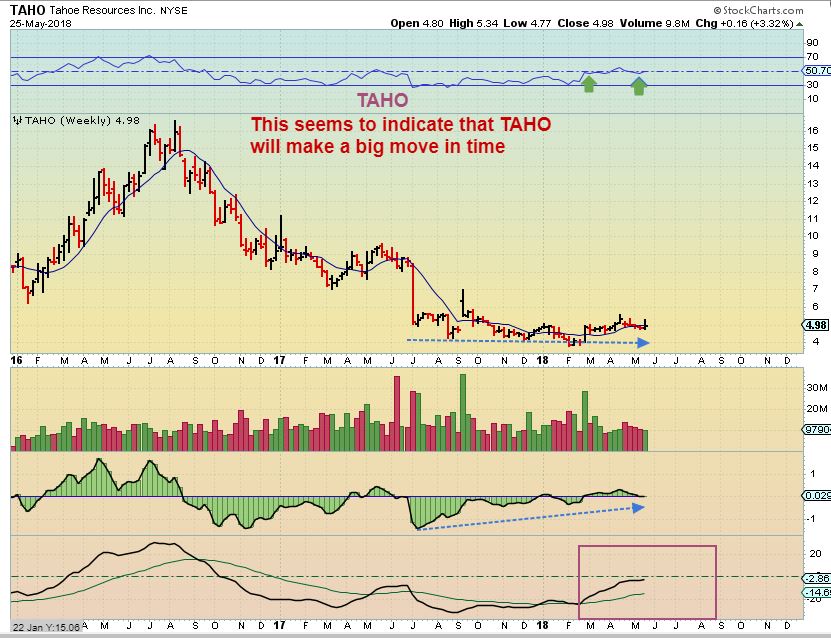
TAHO WEEKLY – We haven’t seen very much upward action out of TAHO in 1 whole year, but this weekly base really looks quite Bullish. This is a good set up and when it starts moving higher, I think that it could make up for lost time.
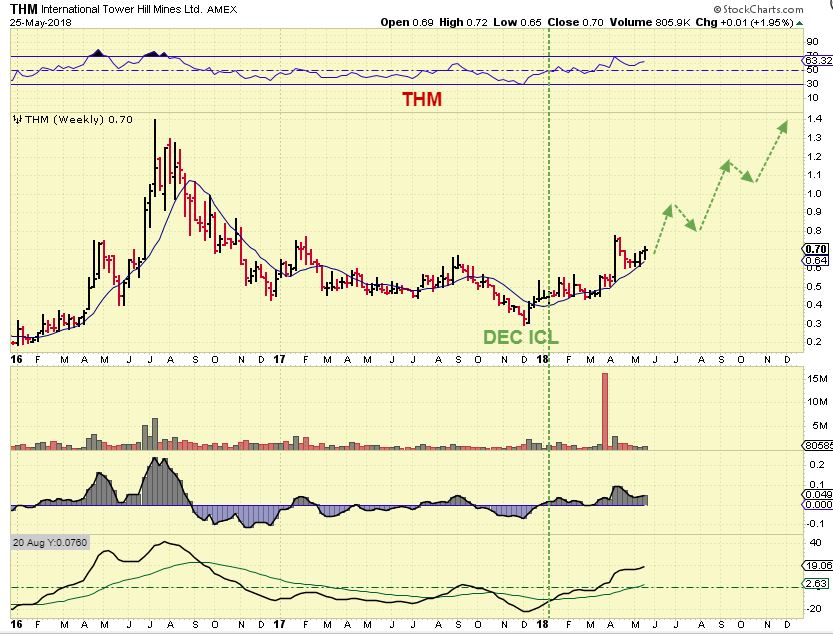
THM WEEKLY – When a chart has a Big break out higher, it often has to consolidate those gains. THM is doing that now, and to remain bullish, I look for a tag of the 10 weekly MA as support. Look how nicely THM is acting at the 10sma lately.
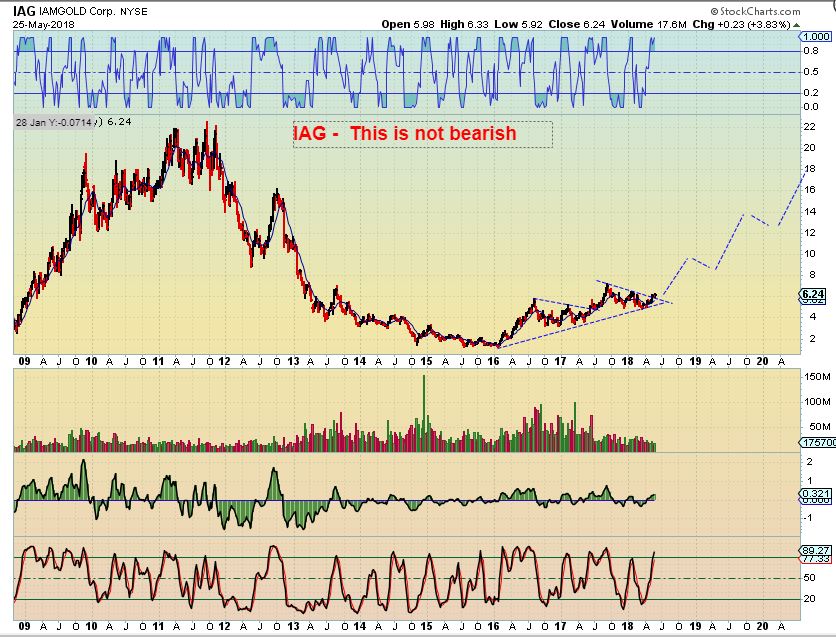
IAG – IAG actually bottomed in 2016 and has climbed higher slowly but surely. It has not been an easy ride, but you can see that it has run from basically $1 to $6+ and has further to go. If you can take the bumpy ride, IAG has been a winner. I have pointed it out in my reports often.
So this was just a chance to step back and look at how bullishly the Miners are setting up. Yes, we could dip down to 1 more drop into an ICL, but it should be a quick drop, and though it may be scary for some, I think that it will be a great buying opportunity. I recommend holding some Miners now anyway. as mentioned in my reports, I bought Silver miners weeks ago, and I want to buy leverage if we drop to an ICL, or already have an ICL in place and it is preparing to break above the trend line.
Currently, it is encouraging to see that GOLD is not selling off at the rate that the USD is rising, and I am watching to see if it can push above the 50sma & break that trend line to run higher, or will it drop 1 more time? THAT break higher would be a strong buy signal , in my opinion.
May 26th Weekend Report 
 May 31st – Waiting For The Fat Pitch
Scroll to top
