We had a lot of movement in the markets on Tuesday, but we did not get the move that we were looking for. What was that?…
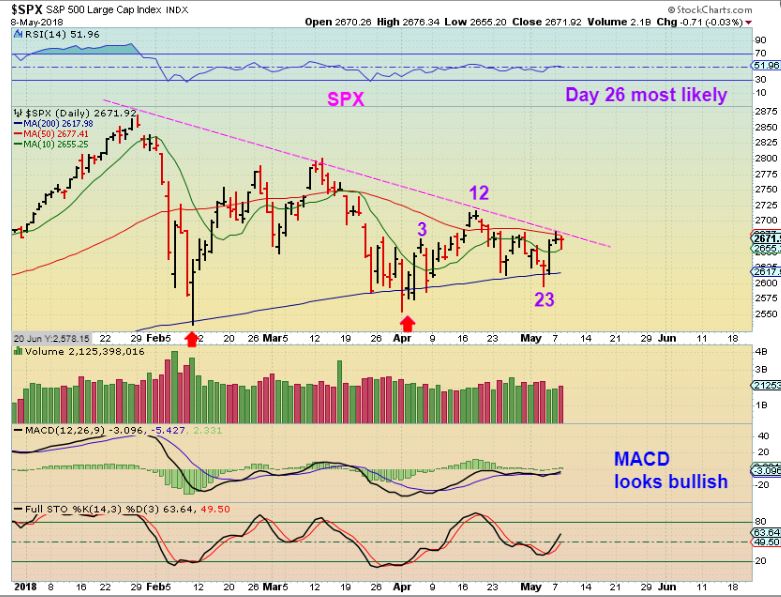
SPX – We did not get a clear break out to add a bullish feel to the SPX or DJIA. The triangle formation is pinching into the apex. This should break sooner than later, and I would expect it to break upside. I will explain…
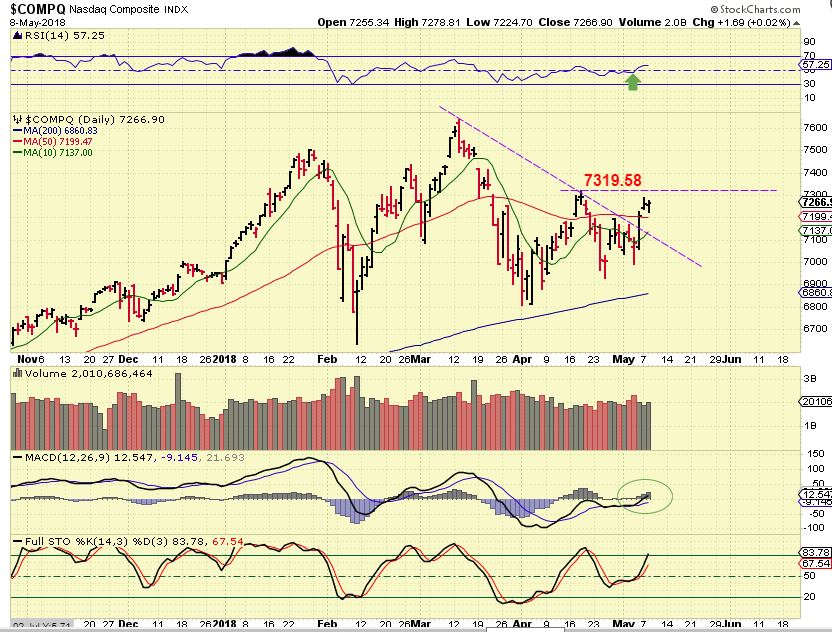
NASDAQ – The NASDAQ did break out Monday and closed above the 50sma Monday & Tuesday. Tech appears stronger again, and the MACD has crossed upward and is moving higher. Some of the charts from yesterdays report actually did very well, despite the fact that the markets were a bit choppy. That is why I would expect an upside break for the General Markets. I will have additional charts at the end of the report.
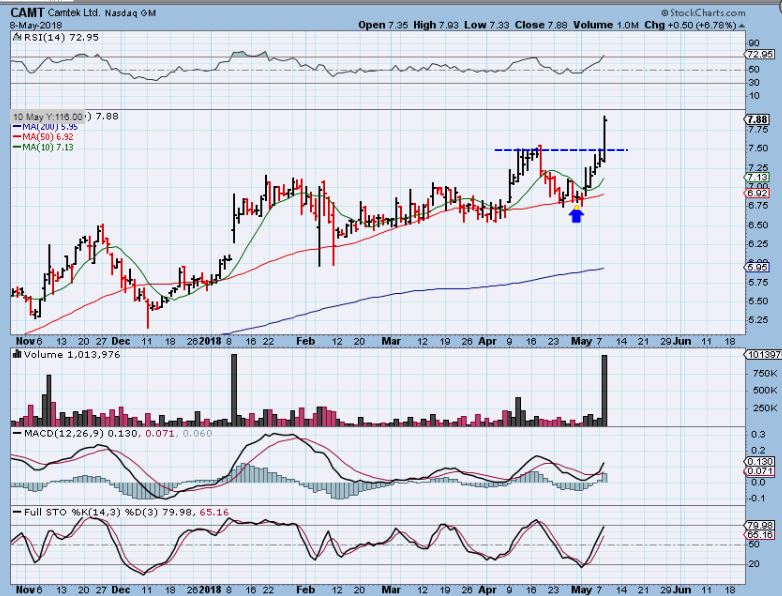
This is just one example of one of the chart set ups from yesterdays report following through upside. Several look Bullish.
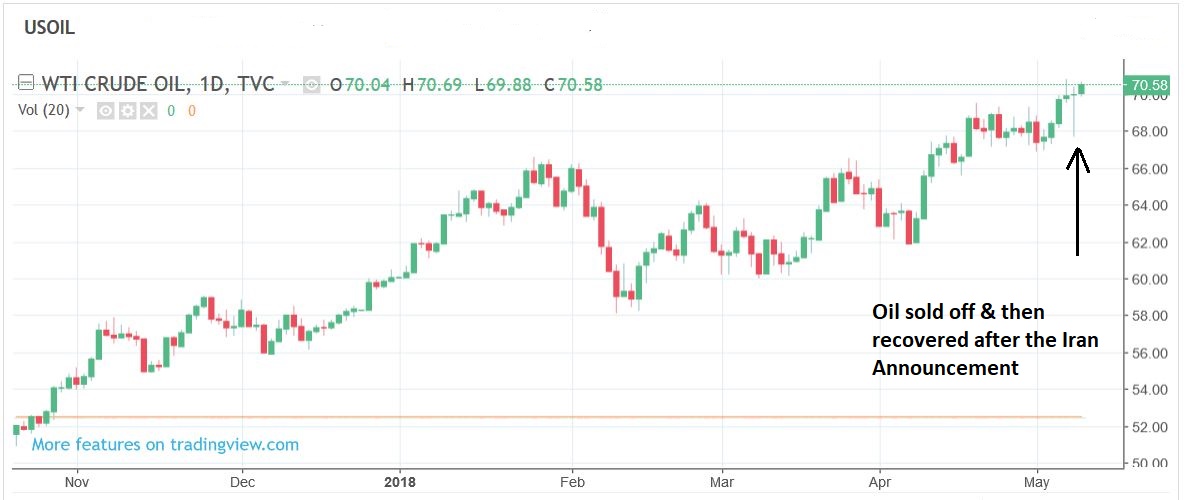
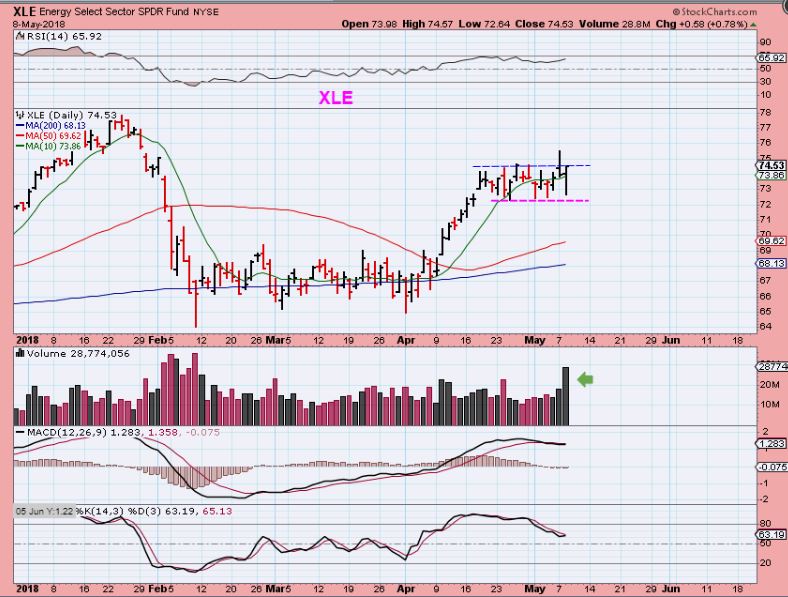
OIL – Oil sold off early on Tuesday, but surged higher and recovered into the close and even into after hours. $72 to $74 is a measured move that I have pointed out, we’ll see if it can get there. Wednesday is oil inventory reports , and we usually have a reaction with that.
XLE – The XLE consolidation got a little tricky this week. Notice that on Monday, it shot higher as a break out and then sold off ( reversal lower). Tuesday it shot down, reversed, and closed higher ( reversal higher). I would expect it to follow Oil higher.
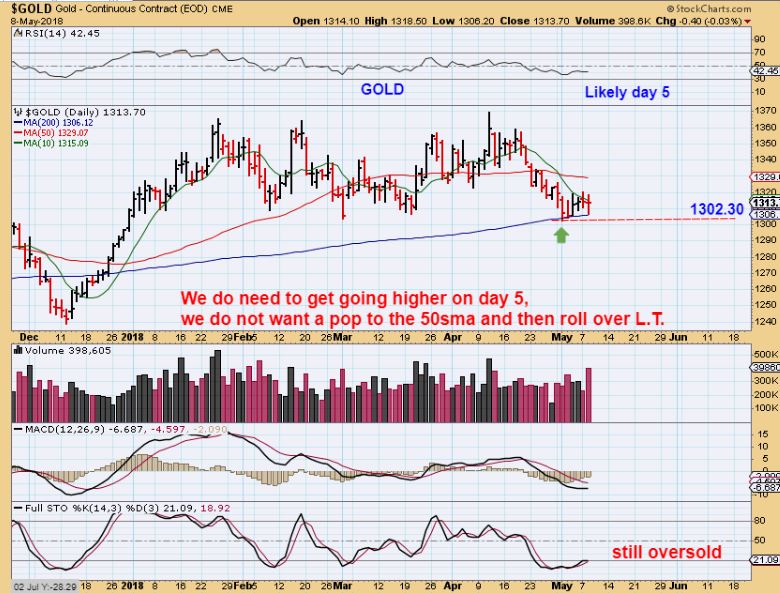
GOLD #1 – Gold sold off in the morning, and it threatened to break the recent lows, but it did not. We are still at the lows on what looks to be day 5 of a new daily cycle. We want this to push higher soon and I really want to see it break above the 50sma.
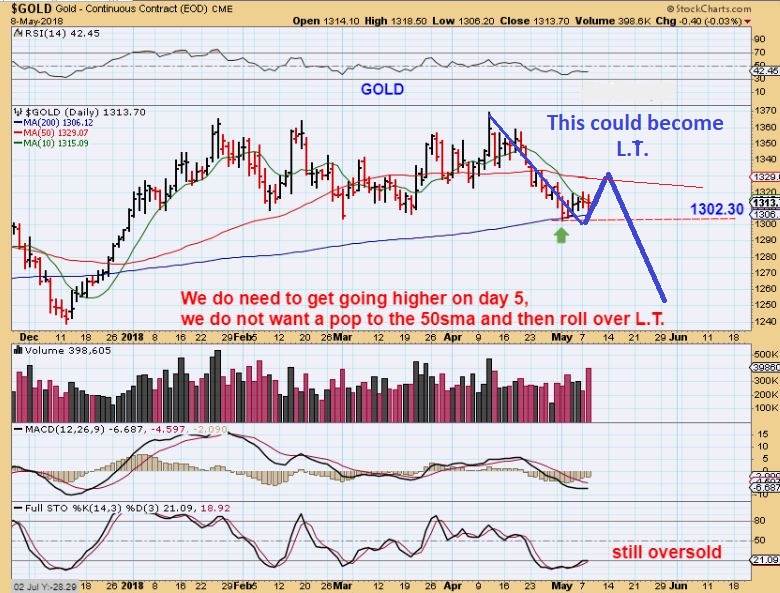
GOLD #2 – The longer that Gold lingers here, I have the concern that this daily cycle remains stagnant and eventually rolls over as Left Translated, down into an ICL. It could be simply forming a bear flag if it doesn’t break higher. So I keep this in the back of my mind, but I dont let a day like Tuesday shake me out- no boundaries were violated. Also a quick drop & recovery of 1302 may extend the daily cycle to day 35, since a confirmed daily cycle did not occur in Gold.
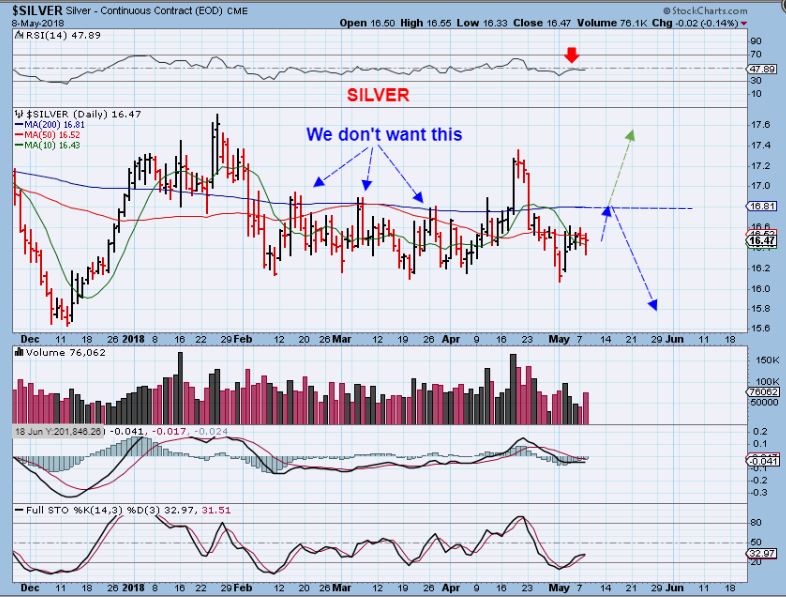
SILVER – We also want Silver to break out higher, and not just give us a weak tag of the 200sma and then roll over either.
GDX – GDX dropped and threatened to break down Tuesday, but after the Iran deal Announcement, it recovered with a reversal too. As long as there is time, there is hope for a push higher, but…
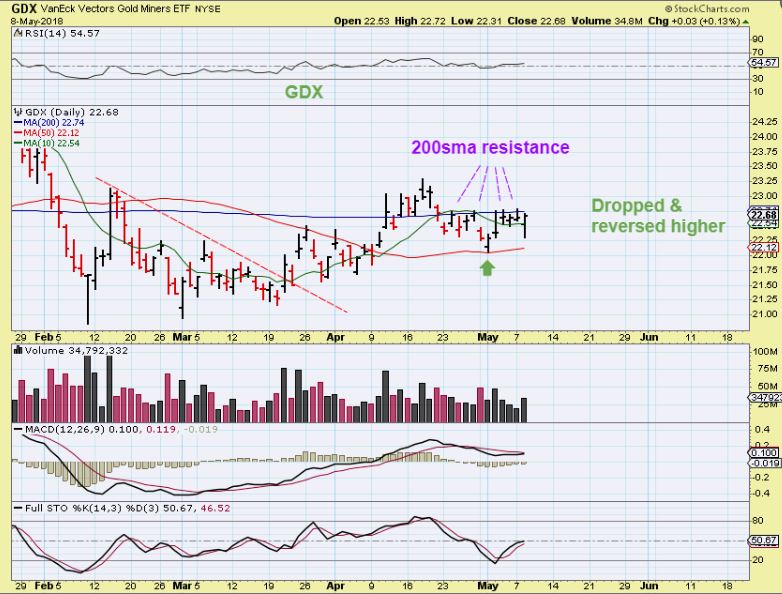
But that is the point, time will eventually run out. Hopefully Tuesdays reversal will be the start of a push higher through resistance. If not, you can see the importance of keeping stops in place. Another dip like Tuesdays that does break the lows is considered a ‘failure’. For now, Miners are safe.
I really wish that Miners rocketed out of the DCL with day 5 GDX at $24, but here on day 5 price dropped down & actually tagged the high of the candle of the Daily Cycle Low from a week ago. A week of sideways action is all we have had so far.

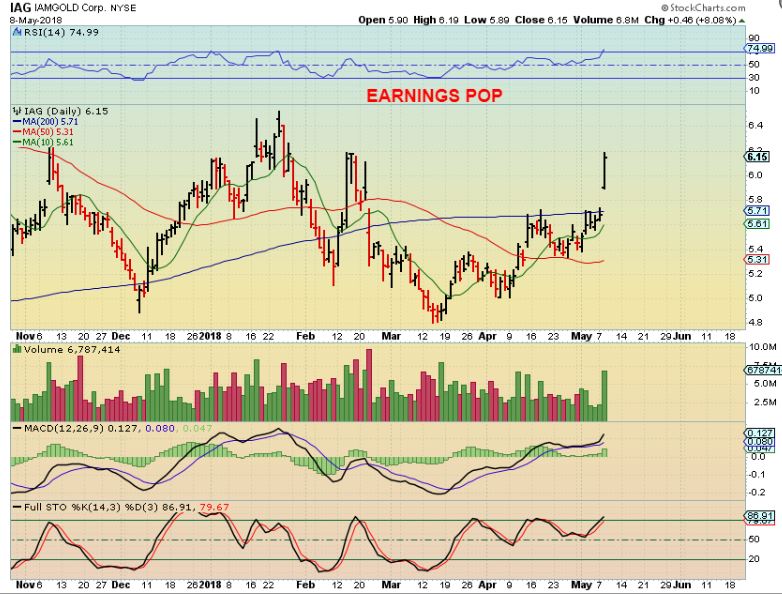
The good news is that some Miners are still out performing and even becoming more bullish. I mentioned the BPGDM in the weekend report as a bullish sign of that. Also some Miners like IAG for example, Popped after earnings and remain bullish.
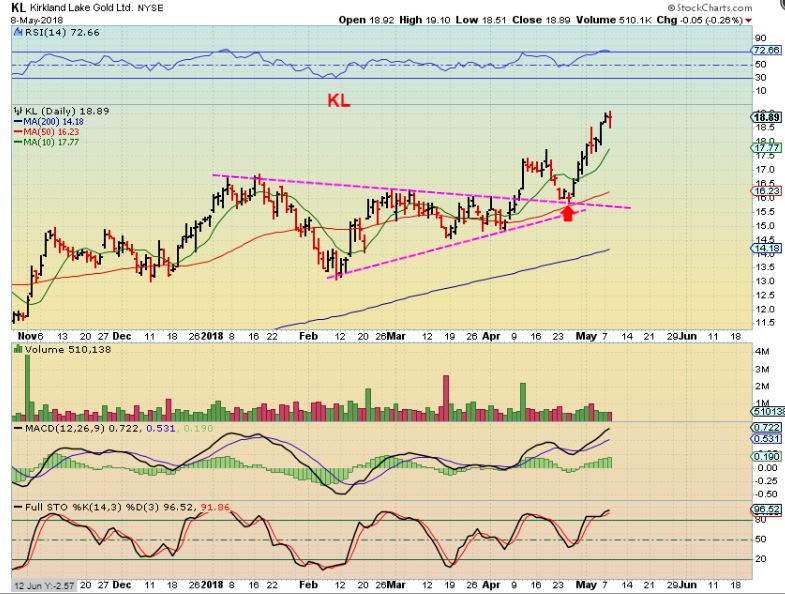
KL is still making new highs after a break out and back testing the 50sma. So several Miners remain very healthy despitre the sideways chop of GDX/GDXJ.
Hopefully we will get that follow through higher in the coming days of this week. Time will tell, enjoy your Wednesday trading!
~ALEX
CAMT was at the highs and looked ready to break out yesterday.

CAMT – Break out. It may bull flag or stall and could still be bought rather low risk if it did.
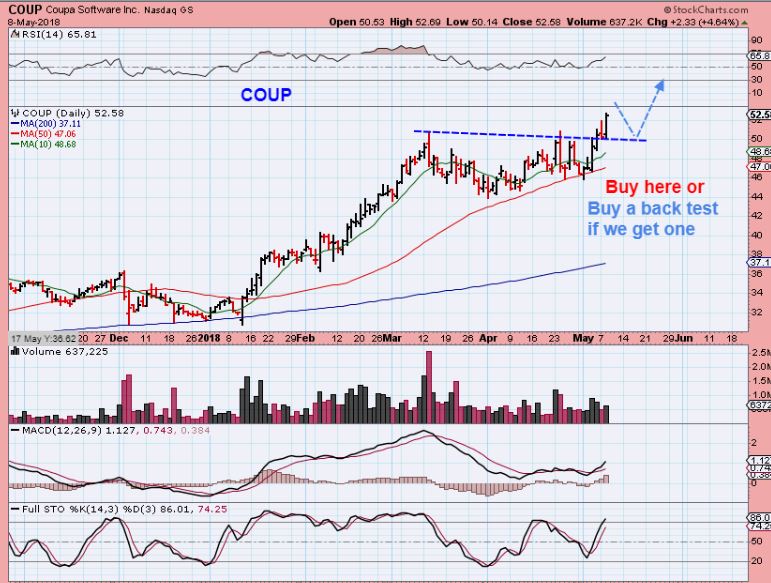
COUP – As a cup, I thought that this might put in a handle after the break out reversed lower. Yesterday…
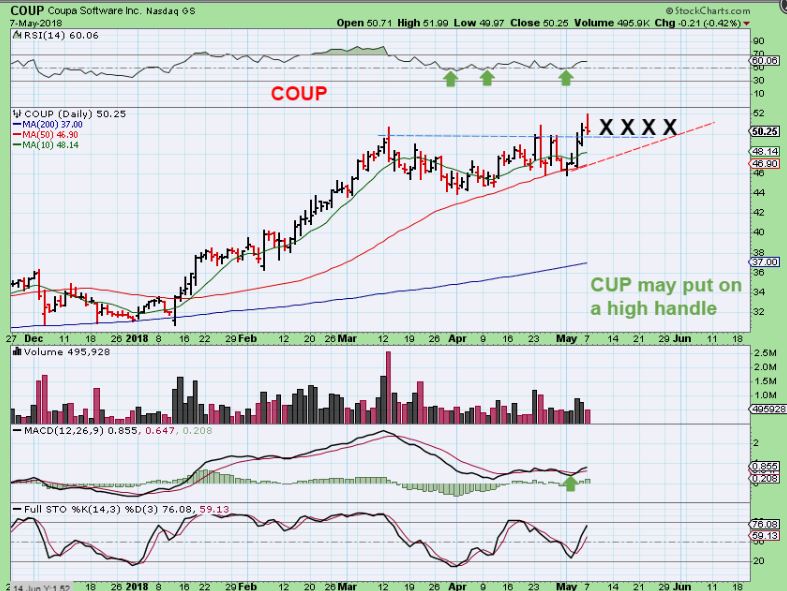
COUP – Coup broke higher again, but this time it held. Nice little move here. It may keep extending, or it could back test, it could be put on a watch list and bought if it does a back test, or just add if you own it or want to own it. This looks like a mid point type of consolidation with a target of $62 if the Markets remain healthy. I DO THINK THAT COUP COULD DROP & BACK TEST FIRST, the MACD is lagging.
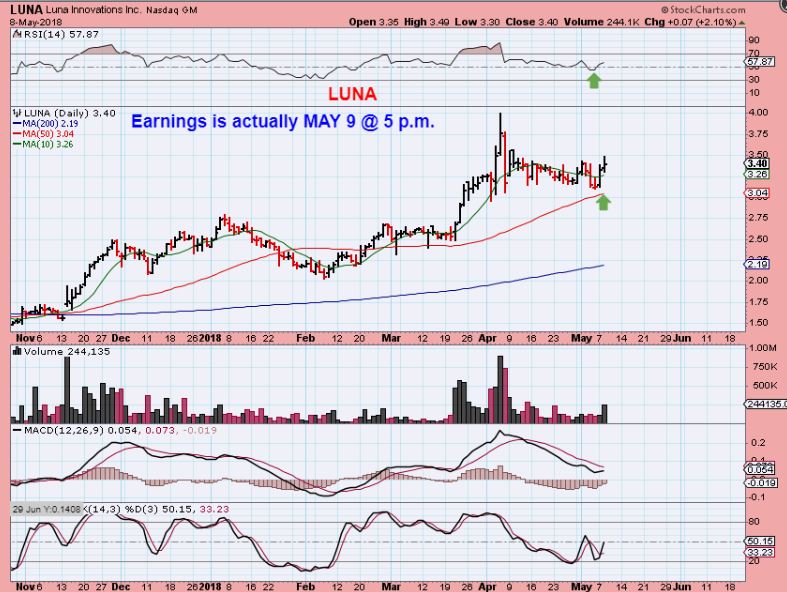
LUNA _ Luna followed through a little bit. This is set up as forming a cup similar to what COUP did. It could still be bought here in my opinion, BUT EARNINGS COME OUT TONIGHT. WATCH LIST?
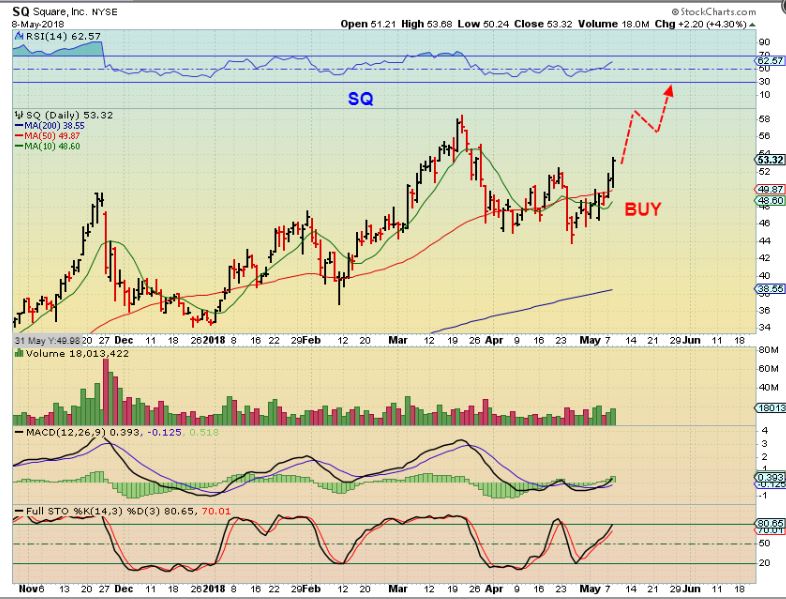
SQ – This also continued higher and is acting bullishly. It should form a cup
RESTAURANT – These continue to do very well, and one more that I have been waiting for is setting up now. I will mention it here…
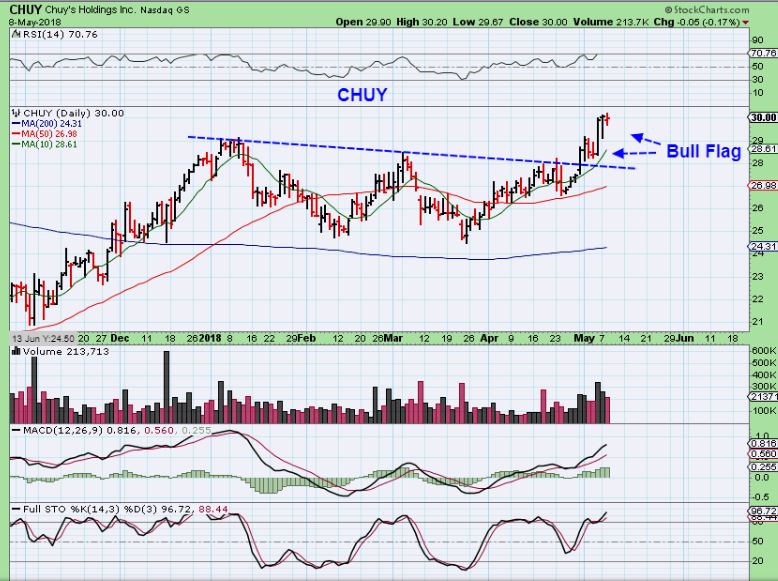
CHUY – I posted this as ready to break out April 26th

CHUY- Break out and Bull flag, break again and another bull flag stall? Buy at the 10sma
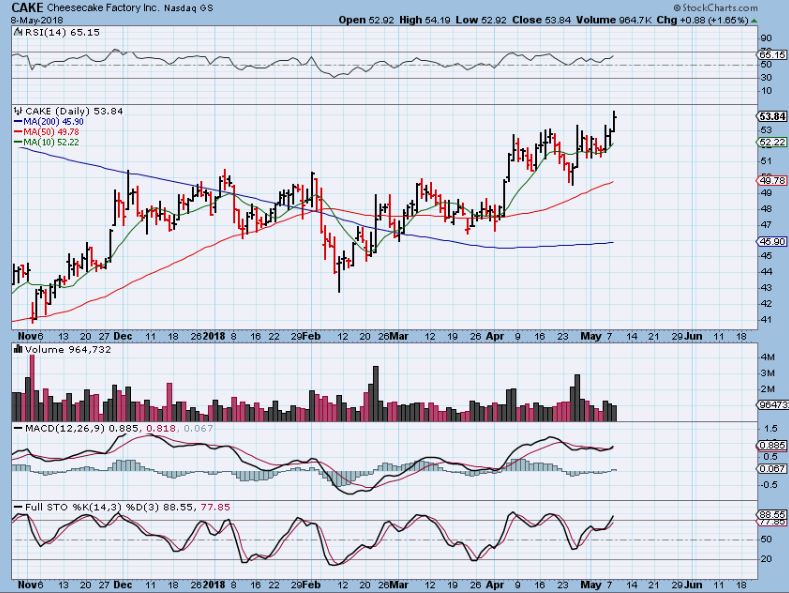
CAKE – Are you sick of hearing about CAKE yet? It broke out and has back tested …
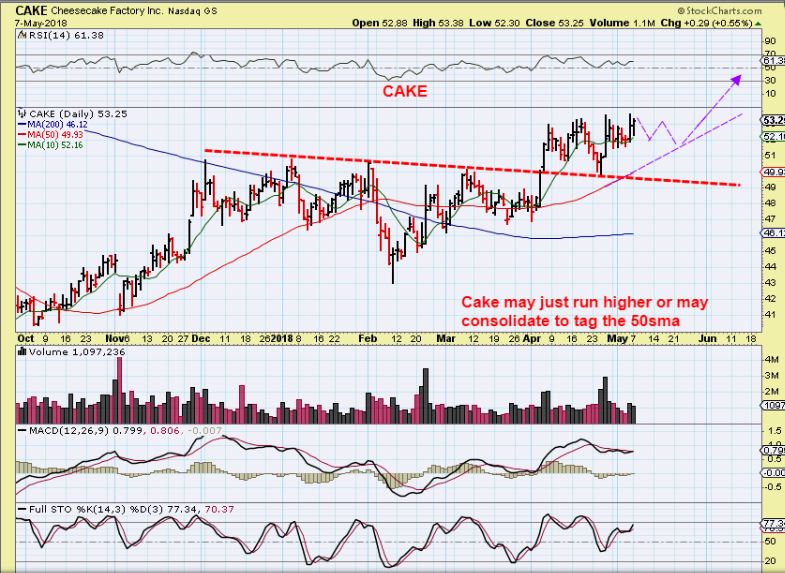
CAKE – And it moved higher yesterday too. As mentioned, the Restaurant sector has ignored the markets recent choppiness.
See also SHAK, TXRH ( has not broken out yet), CHUY, WING, etc as others mentioned, but also I want to include DRI now.
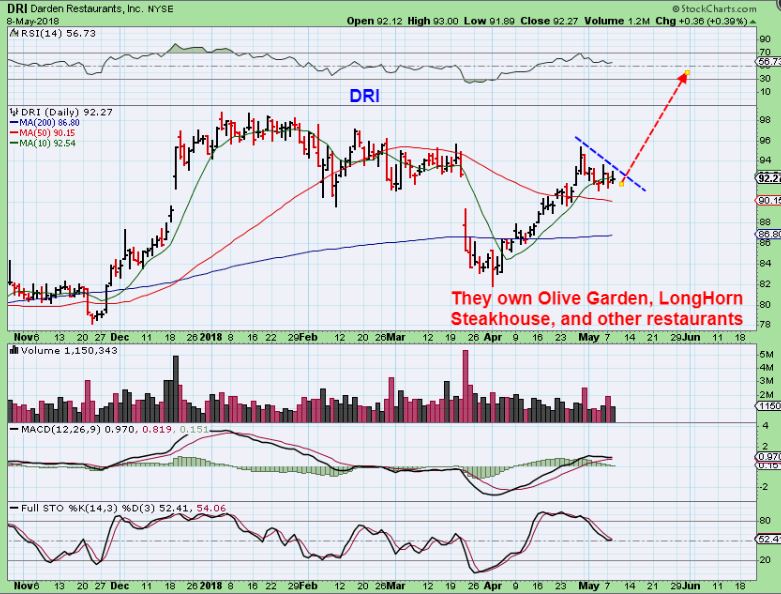
DRI – I think that this one may be ready to go. They own Olive Garden, LongHorn Steakhouse, Fine Dining, Seasons 52 and Bahama Breeze restaurants and more. What I was watching & waiting for on this was a drop (Back test) to the 50sma, but it has formed a flag so I thought that I would post it now. I think a break out above the flag could be bought too. That drop on March 22 was an ‘earnings report’ miss, so earnings should not be due until June. It has recovered since then, and was even upgraded to outperform on April 2 at the lows.
They did increased their full year fiscal outlook, but I wouldn’t hold it through June earnings. It may just be a good trade if it breaks higher.
May 8th Trading 
 May 10th – Cross That Line
Scroll to top

The problem with miners are they look fine until they catch up and get destroyed like hmy. Miners and metals continue to feel like a fools game. I rue the day I became a bug
Buy some CAKE, Coup, Luna then
PI easy buy yesterday… better ER after falling from 60 to under 10.. 46% short.. looking like 20 magnet for gap fill
shippers watch… DRYS DCIX
I saw that DCIX earnings
I figured you’d be day trading that and AMDA
sold rest AMDA PM.. nice run from 2.26 …
TWLO up $3+ – another one at the highs
TRXC – we traded that here, it has been climbing, up nicely in pre-marlet
ROKU CHART – Looks like a break out above the 50sma today too
long TWLO… nice bullish rising wedge PM off ER .. lot of old iconic stocks trying recover TWLO PI AAOI (bad ER)
MTCH long from last week oversold reaction to FB going into dating app.. . gap off ER yesterday
TRIP.. big IHS .. thru neckline could run after long downtrend
Another one with earnings Yesterday. Up 22% today
VDSI BO thru neckline of IHS…
Earnings Yesterday must have been good! What does BO mean?
‘Break Out’
ZAGG gaping after long downtrend..
OK – call me crazy, but different eyes see different things.
HMY actually looks like a bullish chart for the patient ones. Doesn’t look ‘destroyed’, but like it is putting in a higher low.
after a Break out & back test of the 200sma
refresh
200sma finally curling up, nice long consolidation after a stellar run higher.
A quick run to $4 would be 100% gains
I
am not a gold bug, but I know from experience that your entire account
can double triple, quadruple trading Miners when they are in a bull
run.
2016 no one was complaining 🙂
https://uploads.disquscdn.com/images/16e61f8bf6477800dd0859ecd39359143b07c54207d5b03f93f25a16ec193711.jpg
CF now that things are becoming a little bit clearer in the rear view mirror, would you put the Nasdaq on day 10 of this DC??
I personally think that cycles become blurred or changed in triangle consolidations.
SPX i& DJIA look to be in a triangle, NASDAQ looked like a 1/2 cycle low & then higher lows, if really doesn’t look like a dcl, but that may be due to the triangles in SPX & DJIA.
Using tech analysis and other methods can be more helpful at time like this.
NASDAQ & QQQ are fine above the 50sma for now. Timing cycle wise still seems blurred
just trying to build a case for miners here, but the cycles are like a saw blade.
yes,I agree- the cycle counts really can get difficult to follow in triangles and even choppy sideways markets.
In trending markets they usually stand out very well.
do u like GRPN… giggle 😉
I liked it 3 days ago on the 50sma 🙂
i know….
#adNauseum
I know that you knew
#GiggleGaveItAway
THM … (me nibbling on my pinkie ……
Where in the world did those April 9th buyers go with their follow up additions for May 9th?
they’re about to step up ….. ? ;o)
#wishfulThinking
URG and AUMN …. as well
like GRPN
someone like SSRM – 600k shares traded at the open
What’s your favorite buy and hold stock long term (2 year). One that isn’t a commodity or a cake. Looking for one that has good fundamentals and/or a good business model. I was looking at AMZN, NFLX, VSH, LRCX. Would like some others to look at.
2 years thru 2019 into 2020 like HTZ
HTZ is still trending down, even after their stellar earnings on 2-27-18. What do you like about the company?
this is a very long term investment … like Icahn has acquired almost 35% of company buying much higher and even doubling down at $23 share… . When Icahn, practically handpicked Kathryn Marinello as Hertz’ CEO he gave her plenty of room to turn Hertz around. She came in with the plan that throughout 2017 and 2018 Hertz would heavily invest in its brand, regardless of bottom line profitability and that starting 2019, Hertz would be a very different company with strong operations but significantly more profitable…. of course nothing is guaranteed and wouldn’t back up the truck but like icahn being involved.. disclaimer I have traded it off its rounded bottom just under 10 to just over 20 then selling as short term swing… the key to car rental business is the depreciation cars after 2 years and they are sent to auction, that has hurt the last few years, even CAR … so just a stock I put in my IRA and will forget about for now .. when sectors look incredibly bearish like retail last summer and energy few years ago IMO that is the time to start scaling in …
Got, thanks Ron!
I’m not really sure who you are talking to? Anyone? Consensus?
I’ll chime in, but I think 2 years depends on how the markets are going to perform, so I will still use Stops.
The General markets have not proven much here, though some stocks are at new highs. .
It sounds like you only want Tech?
You could research & buy one of the new IPOs that are at new highs, they have no resistance.
SQ, COUP, or one of those.
Look at CAMT on a 2 yr chart $1.50 to $7 trending higher. If that gets over $10, certain funds may start buying.
Whats wrong with MU for 2 yrs using the 50sma
Thanks for the input. I always plan on using stops, but basically just want to ride the wave without all the babysitting. Yes, its an open question to anyone. I’m sure your constituency have some favorites they are watching. Doesn’t have to be tech. I missed the MicroSoft Intel craze when computers were popping up every where (and yes I am that old Maria), I should have spotted Monster MNST check it out, everyone was drinking those energy drinks. What’s the next big stock? Amazon has a bright future but very pricey.
Hey Bill, I’ll take a shot.
With AI creeping into everything, I wouldn’t be surprised to see stocks like NVDA multiples higher in the years ahead. My $.02. Best
I was looking at NVDA this morning. Good pick. Earnings are increasing, and are positive numbers. So, the company is making money. The last two years have been stellar performance. Earnings report on the 10th. Double top right now, if it pushes above I may buy some. Thanks
Nice to see MUX trying to get through it´s 200 MA. http://schrts.co/TvP7Lu
I am a very reluctant PM trader these days because I have been burned so many times in the past, but I want to mention that JNUG looks very bullish to me right now. I’m in JNUG very heavy this week. Many signals on my daily chart are bullish and I have been watching and waiting for JNUG to break out of the mini triangle it has been in for the past few days, it is doing that today (so far) as you can see in my chart below. I even added a little more this morning. Good trading to all!
https://uploads.disquscdn.com/images/70568e3bfae5fcb5b58b3824fb47e94f45369d9bf7bbef3ae1c5e1b0381a076e.png
got a 4hour buy signal yesterday.
nice chart. JNUG stopped at the upper trendline at 15.35…
now at $15 let’s see what it does.
JNUG has pulled back but so far holding above the short-term declining trend line. I drew that small triangle a few days ago using the Fed Day HOD and the last 3 days JNUG was rejected at the declining trend line. I would love to see miners take off and get moving up very soon. I’m not a hardcore goldbug, they have to prove it to me or I will dump them. I agree with Alex, the longer it takes the miners to POP the less faith I have in them.
anyone looking for DCIX pre-pop lookalikey… take a peek at TOPS
just bot some on the off-chance of an instant giraffe
ESV!!
and DNR
For Elliott Wave aficionados — the 15-minute chart of GDXJ shows a clear, seemingly well-formed, 5 waves up from yesterday’s 11am low; however, the strength is in the currently forming 5th wave instead of in yesterday’s 3rd wave. So does it now drop into an ABC down? or not?
I’ve gone through a 12-step program to cure my previous addiction to E.W., but it must not be working…
Can’t speak for everyone.. but I think the verdict here is that its often a pile of poop in its predictive powers.. but still sometimes fun to play along with anyway
Amen to that
On Just a 2 day / 15 minute , I see your 1-2-3-4-5 ( you mentioned ‘from yesterday 11 a.m.’ )
But lets dream big & foolish here – if you use a 10 day, you catch the FOMC lows, and then
refresh – this looks like wave 3 =)
https://uploads.disquscdn.com/images/9039d7ae0656f99739c60dce453ec7a8fd0cdf2e4cb01ba1e2b7b17bdb82aadd.jpg
I’m not really looking at it this way, I just saw your 1-2-3-4-5, and wanted to dream big
I like your count !
giggle.. i see 1, 2 … 1 .. 2 .. .:o)
CANL is up 25%, but 1400 shares?
MYMMF is up double digit gains, but it just crashed & this may be a dead cat bounce
OGRMF – possible follow through today
APHQF – That is good volume off of the lows, that looks pretty good, but is at 50 & 200sma resistance
We traded TRXC, but I sold mine quite a while ago.
Check it out on a 1 year chart = quite nice. Buy a Gap fill/ Pull back?
Crude oil just moved over $71.
I promise not to say “MUX SUX” if it can close above the 200…Pls MrMcEwen….:-)
It pushed through, that could be a pretty good sign of things to come if it can hold
CF, just for learning purposes [since you have all this time :-))] when you get a chance do you see an ascending triangle on the weekly from Mar 26 with resistance at 2.20 or am I making this stuff up? I see the other triangles on daily…but curious about weekly. Thx muchly
I do see what you are looking at, I’m not so sure about a good bullish ascending triangle. IT looks a bit sloppy & loose, but I do see a triangle formation of sorts.
One thing that stinks on the weekly is the 50ma weekly., unless it can rise above
Well, MAYBE I could see one when I draw the lines in- I thought that the bottom was too rough, but I could draw one in if I needed to
I was looking for the feedback you gave. So thx. Just trying to get better at this stuff. Thx
Earnings came out already too last week
CF – KEM is looking good again…
Yes it does.
That is one that I actually never traded, but I like the 3 & 6 month chart
Its been in a range, almost easy money buy at the bottom sell at the top (if only right?) lol
Wow
I saw HOS get slammed down last week, just did a V-Bottom & came right back
HOS, CHK, NOG, GST, PEIX, popping.
I think GST looks ready to go, but it has been basing & that could continue. tough to tell, but very big 1st hr volume.
LGCY 6 month chart? Unbelievable
Good morning Chartfreak1 & crew. Do you have any CDE targets you don’t mind sharing? It’s been holding up fairly well over recent days, but dull strength to the upside thus far recently…I was hoping to see a pop to 8.9 by end of week, or early next week, but wondering now if I had been wrongly hoping, and maybe a run to 10ish by midJune before a deep ICL for miners in general in july/august, and then ripping rally till year end at least. Any near-term CDE targets you care to share?..like for this week, this daily trading cycle, or into month end, or midJune…just wanting to see if my near-term personal targets are pie in the sky and if I should just be trading silver instead until summer is over. Thank you
Hi Monica, I’ll take a shot. CDE see attached link. Looks like it broke the trend line then retested now moving higher. The MACD looks promising and its above the 10sma. The 10sma needs to start trending higher. IF we are in a new DC then I would expect to make 8.50. If we are in a new ICL then I would expect to make 9.00 at least. Just my 2 cents.
https://www.tradingview.com/x/Ew0IhBcL/
Yes, needs some gusto !
And if GLD cannot break above the 10 soon and we go for a fresh ICL the target is __________?
IF this is a new ICL, then CDE should hit $10. A lot of resistance there.
You pretty much summed it up, the rise has been fairly dull.
I think going forward it depends on Silver, because when SIlver gets running higher, it and silver stocks can make “pie in the sky’ highs reality.
I still own mine, and we had a nice break out from a triangle a while back, but it ended up giving up the gains.
refresh for 2 charts that I used in past reports , and then I will draw a current one with targets possible IF SILVER GETS GOING
https://uploads.disquscdn.com/images/ce9644127609b0edd82ea1ba48da4a6a5e6ddfd1d275681880e4b9850ef82803.jpg
https://uploads.disquscdn.com/images/244ac2fcb0fc95ac0b1d94551a825cf827a22a67d547233c434a416bd3e362aa.jpg
This is CDE now, but again, the rise has been dull and lack-luster.
We need stronger buying (And maybe short cover) soon, or this may just be a final weak DCL, and the ICL is ahead for Gold & Silver.
https://uploads.disquscdn.com/images/0c793c38109ed03fb081342d4f7ef753b8d8bd9f79c4441ac4326e9df68e40ee.jpg
CF, CWBTF? What do you think? Support at 1.14 doesn’t look like its going to hold. We need those moving averages to turn higher soooooon!
I own it, I’m just seeing it as a nice long base. I dont care about support at $1.14, but if you do- that is your line in the sand. I liked the company and mine is a buy & hold unless it drops in an ugly manner
refresh- I just see it as a base that takes time, but has higher lows.
https://uploads.disquscdn.com/images/99b249d8bd4f0ca44c35975be9596e1bed678c829637f1fb6b1fa480a66182b7.jpg
EDXC? Perhaps a glimmer of hope………
Perhaps you jinxed it? 🙂
Perhaps I didn’t. Don’t jump the gun #RustySticks
No. EDXC sucks. It’s worse than MUX!
GBLX – check that out on a 3 month chart with a 50sma. Nice reversal today ( MJ Stock)
PI nice follow thru +25% on entry yesterday.. 20 gap fill, will sell 1/2 up here
I (Intelsat) nice 6 month chart…
2’s to 13’s.. I would say 🙂
Sweet chart
CLF keeps going & volume looks sustainable
Hows MU look now… Im still shakey with Tech…
Looking good, but especially if it breaks the down trend line drawn from March highs
CLF is HOT right now!
we need some buying on JNUG. Where’s Maria and her block shares?
https://uploads.disquscdn.com/images/5f77462ad6ed1db9706363a5c148b48b0a07e50db5aa7c4a916817ab97c3ec54.gif
added to RNN in the low 2’s
me too…
Ditto – posted above
*clearly she’s already in ….. 😉
I got out of CRK ahead of earnings 🙂
I got out of my darling AAXN ahead of earnings yesterday…. only to have the stock up $10 today…. grrrrr
nice BO SPX.. target now 2720 ..
MYMMF – washout low yesterday?
CF, check out that Volume!
I saw that , I believe that I mentioned it below earlier this morning
I added to GBLX- I really like that reversal off of the 50sma
OK, I just checked it out again- its up about 20% MORE than when I looked this morning 🙂
I was away for a couple of hours, just checking things out…
I’m not waiting until the end of the day ( Though it may reverse higher) CDE dropping below the 50 & 200sma with volume is not what I wanted to see
Out for now /
SOLD KSHB ( Nothing wrong with it, I just have good gains) and added to GBLX
OGRMF & SSC positions looking good, MIGHT Buy a bit more OGRMF too
My TQQQ is kicking butt … unfortunately it’s just a small starter position. Meanwhile my big position in JNUG continues to tease and disappoint, like my first girlfriend. I probably going lighten up on my JNUG very soon because it’s not making me feel very comfortable right now.
Man steve, I thought we had a deal. You let me know before you enter so we can bank on TQQQ together, and if it goes south I can blame you… come onnnnn
TQQQ looks really good on my charts, the only reason I hesitate to buy is because I prefer to buy at the bottom of big dips and TQQQ is currently pressing up against is upper BB. But it is above it’s 50 day MA for the first time in a couple of months and looks to be in an UP trend. I should have added more TQQQ yesterday on the dip down to its 5 day EMA, sometimes that’s all you get when it’s in a strong up trend. Meanwhile, I have lightened up on JNUG. I’m still holding some, but it is looking less and less certain as each day goes by. I was expecting a rally similar to what JNUG did in December after the Fed meeting, but that is not happening. The move is weak and volume is low.
Ill take that as an apology – lmfao
Bay, sorry I don’t get what you are saying.
Im giving u a hard time, I was too chicken to add tqqq and jsut watching it fly…
Oh, well I was too. I bot a tiny amount by my standards, only 5% per account last Friday. Normally I would go in at least 20-30% per account to start. I was hoping for a pullback on Monday that never came.
I’m a little torn on this.- I feel about 50/50 at this point.
I am sick of holding JNUG & GDX GDXJ are going nowhere, but at the same time, I look at the USD ( or UUP) and it seems to be that it would be close to a top on this run.
If the USD drops, I would imagine that these sideways Miners would pop.
With Miners on day 6, I dont want to be holding on to JNUG if we get a Left Translated Daily cycle – which can top anytime now .
I am hedged with MJ stocks and BITCOIN stocks, etc – and JNUG is not a large full position, but I’d rather sell with a little profit than to be stopped out. For now I am still holding & watching UUP.
Yea Im there with ya… I was looking at the banks also, BAC looking good again….
Yeah, I was way too heavy in JNUG thinking it was “sure” to pop this week. I sold a big chunk for a tiny profit. This is the 6th day in a row that it has rallied and faded into the close, so I cut back quite a bit. I thought today might be the day it finally broke out, but as usual it’s fading into the close. 🙁
The USD looks like it SHOULD top, but I have also seen some very bullish analysis on the dollar saying it’s finally breaking out of its 30 year long term down trend.
Check out 1 yr chart of IMLFF- use only a 200sma – Pretty cool 🙂
I like the look of FTSSF (First Cobalt Corp) here. At a good support. Volkswagon announced they’re doubling their battery purchases. Cobalt itself looks like a bull flag.
My GGIFF making higher highs here. It’s at resistance but a very nice rounded cup here. Just like NSRPF.
I bought MYMMF two days ago and held it through yesterday. Expecting it to trend upwards from here. I’ve gotten better at position sizing over the years.
I used to trade GGB and BBG
Did something happen to BBG? I can’t find it and I don’t remember the name of the company.
Bill Barrett? looking to see if I can find it….
That sounds a bit familiar
Name changed to High Point Resources….HPR….I didn’t realize, used to have BBG in my watch list…..have to change it to HPR….
Me too- Thanks!
Looks like it changed names back in March…
Exiting rest of my ETF’s LABU SOXL here from last week as hitting target 2700 on this wave 2 rally off last week low….. looking for wave 3 PB if SPX breaks back down thru 2674.. then 2600 or lower comes into play again.. thru 2720 then will reevaluate long ETF’s and thru 2760 likely bottom in IMO and on way to new highs and 3000 by year end… that said just trading stocks as always a setup somewhere and again this is not trading advice, just how I trade off EW ping pong on indexes 🙂
Very nice Ron…
Solars with Volume Pops… CA to require all new homes have solar roofs…Top 4 solar companies, SunPower (NASDAQ:SPWR), Sunrun (NASDAQ:RUN), and Vivint Solar (NYSE:VSLR)
also SEDG .. which sells to solar companies
Why top 4?
What about FSLR & CSIQ?
Check out RGSE on a 6 month chart :)And VSLR did quite a reversal
Oh I just copied and pasted this lol
🙂
my ENPH turned higher on the news too ( They provide for the solar industry).
Maybe it was top for responding %-Wise at that time?
TSLA (which bought solar city). They are big in San Diego, trying to steal business from RUN.
I remember that totally unbiased purchase by TSLA 🙂
totally unbiased. aahhah
TSLA is very suave in their approach. Came up more expensive than SUN RUN.
TSLA chart is screaming he wants more.
How did we not see that coming?
What, A law that houses in Cali need to have solar? I would have never guessed.
Maybe we should invest in a future Law in New England where
we Must have Metal roofs so the snow rolls off:)
CLF & X anyone?
GBT getting some https://uploads.disquscdn.com/images/8c2c82f5aeac30d4f0fb29126446520ee1ab1bbfdb1c6f581834fae6b8d982d7.png
Added RNN here at 2.04
CHECK OUT RGSE & WNDW on that solar news.
Sorry, I meant SUNW & RGSE
Oh I know! lol good catch tho CF
No, I missed it- it was up a bit when I saw it, but it just ripped higher.
Watch for RUN earnings afterhours today.
CAMT turned into a beauty of a chart. Sold mine while it was a sideways consolidation though : – (
Couldn’t resist.. Musk new GF at last night event… TSLA currently losing $7K a minute… Model 3 projections if they actually sell the promised $35k model they will lose $15k per car… no position just fun to follow 🙂 .. have nice evening https://uploads.disquscdn.com/images/0741e545a6932473b40ffa0bdbea95c0e8df925060998aead5cb16984f4649ad.png
he can get ANY girls he wants… .and he picked a witch?
the boots are a nice touch 🙂
never mind the boots, she is wearing a Tesla logo choker. Now, thats love. 🙂
K…Mux…(fill in the blank)…today’s finish looks like a lot of other past attempts over the 200…several lousy days may await. 🙁
CF, out of curiosity, when you have a buy and set a mental stop how frequently do you move that up with the trade? Is it based on hitting MAs, gain on position? or some other metric? Apologies if question has been asked before.
I don’t always raise the stops – like my JNUG position right now, I could sell it if I dont want to wait & see what happens, but I haven’t raised the stops. Lets say we get to day 10 & we are still in this area, I’d raise my stops or just sell.
Other trades I raise stops if they are getting extended ( Like if I was in UUP right now, it has been a vertical rise so I would raise it on the way up- to lock in gains at some point).
I use mental stops, so it is more of a feel for my trade too. If I feel bullish about the sector & stock, I barley think of it, if I am not bullish on the sector, I decide where I do not want this to drop to.
Other trades may be due to Moving Averages as you mentioned. Say price is below the 200sma and the 50sma is even higher, I could enter and when price gets above the 200sma, put my stop under the 200sma. Then if it gets above the 50sma even higher up, I could move it to under the 50sma – all to lock in gains if it sells off later.
Today, CDE dropped below the 50 & 200sma, volume was strong- I stopped out there.
It is all situational for me and has a lot to do with my feel for a trade & sector that it is in too.
I had to figure this all out on my own, so I try to suggest that others do the same.
I read in a book that with a good set up & a low risk entry , you can accept a 10% loss.
The bullish set ups will win more than getting stopped out. I personally didn’t find that to always be true, especially choppy markets.
His rule would be
BUY AT $50, Stop at $45. Buy at $85 , Stop at $77. RAISE THEM AS PRICE RISES, EQUAL AMOUNTS TO THE PRICE RISE, DO NOT LOWER THEM EVER WHEN PRICE PULLS BACK.
And if your entries are well thought out, the runners will make gains, the losers will be short lived.
Thx CF very helpful! Have a great night.
I really like the look of HD
The report for Thursday has been released tonight