
Friday May 4th
SPX – We saw a reversal midday and I posted this daily chart in the comments / chat section at 1 p.m.
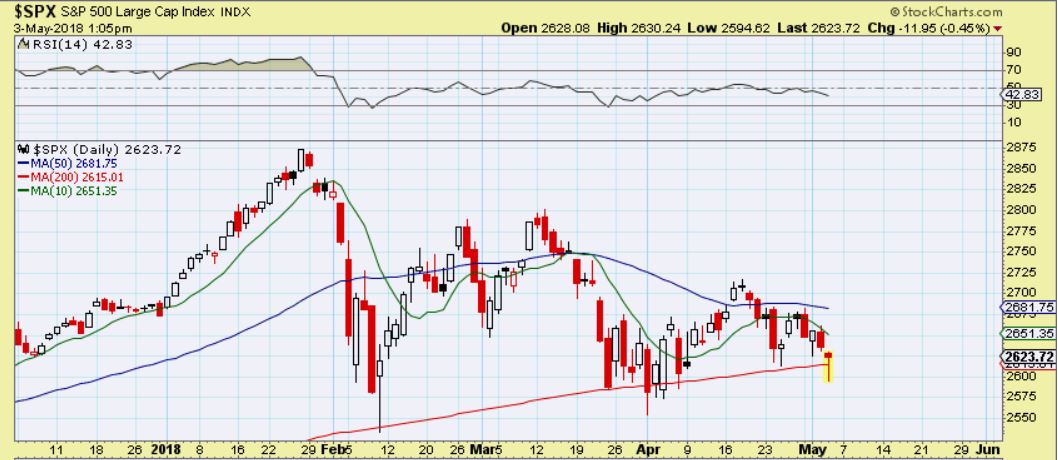
Let’s discuss this further …
SPX FROM YESTERDAYS REPORT – Look how choppy the SPX, DJIA, and NAZ have been. Yesterday was day 23, and this can run to day 30 or so before dropping , so the reversal CAN BE BOUGHT with a tight stop, but I cant tell if this is going to blast higher or just continue to chop. We don’t want the lows shown taken out after the jobs report. And …
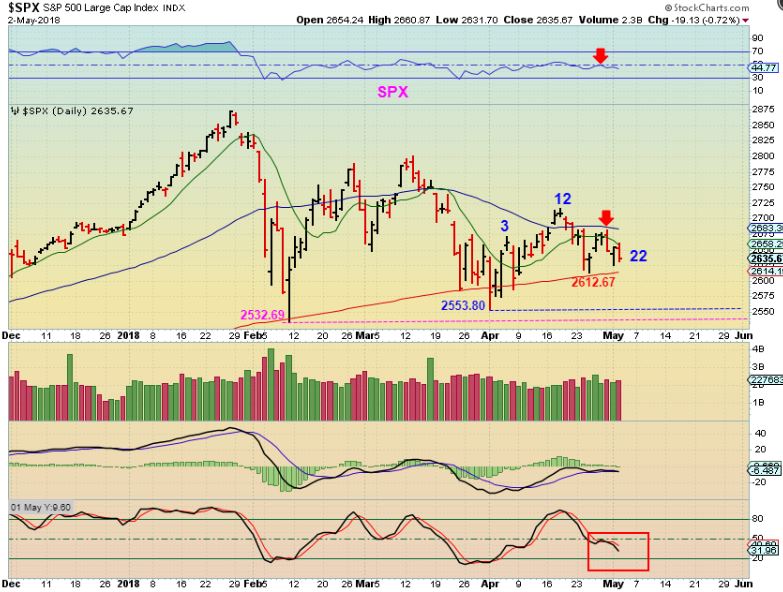
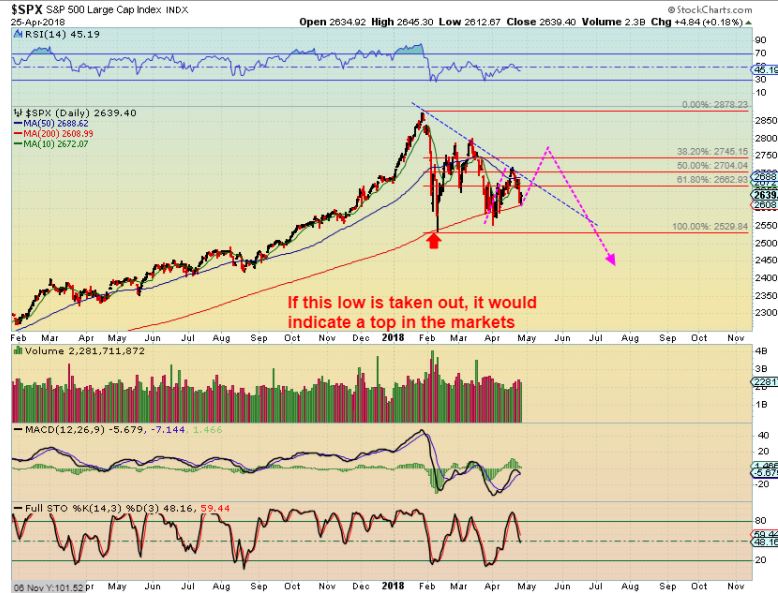
SPX BIG PIC – This was in yesterdays report too, a Big Picture that remains bullish for now, but again, we dont want those lows taken out first.

With that reversal yesterday, we may still get this, this was from the big picture report on the weekend. For now I am not in the general Markets, I am focused on Precious Metals and some block chain trades. I will discuss that at the end of the report. We could get a run after the jobs report, but even if we do, be aware that around day 30 you want to expect some weakness to come along.
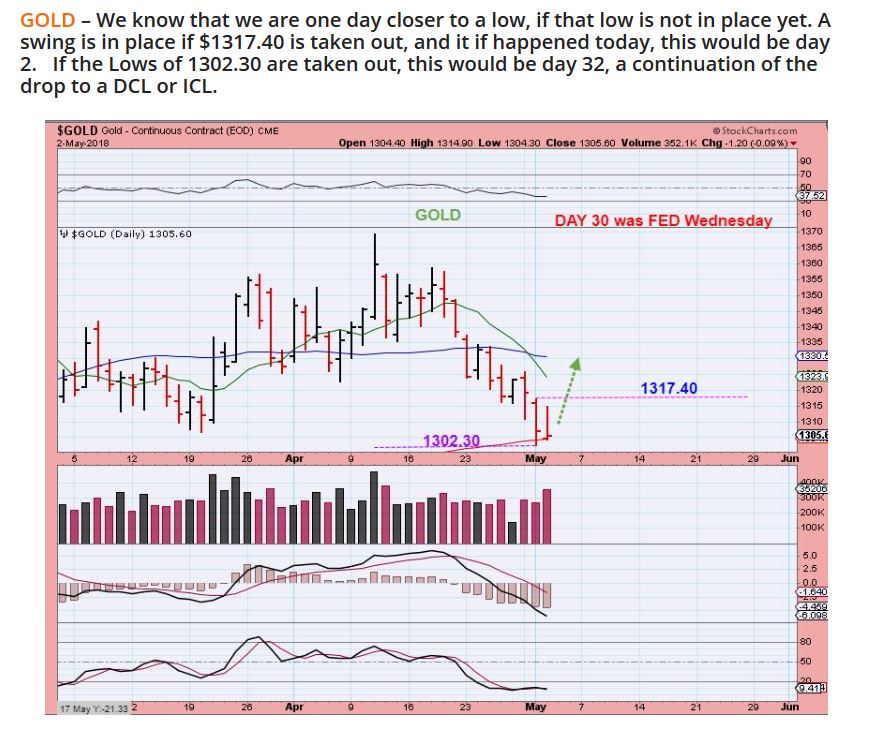
GOLD FROM YESTERDAYS REPORT – Day 30 or day 1? Watch the lows…
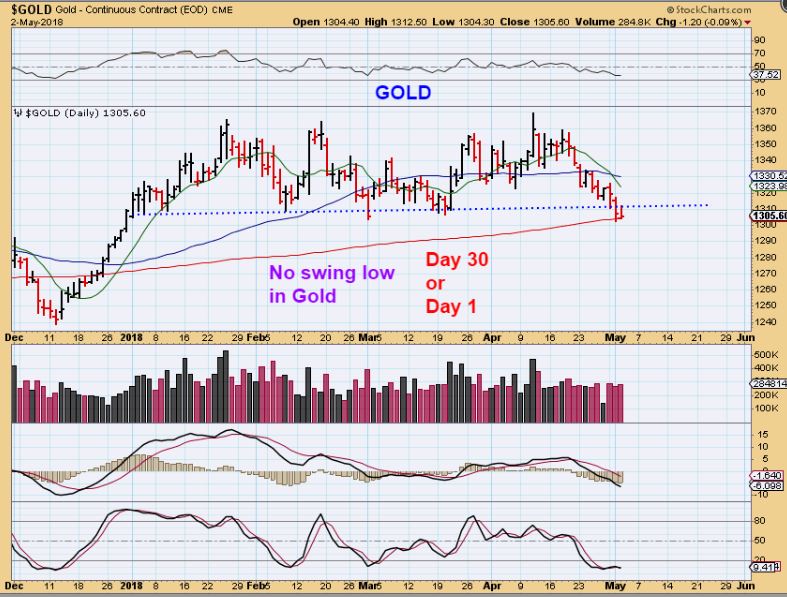
I also wrote this about GOLD FROM YESTERDAYS REPORT – Watch 1317.40 & 1302.20. Watch those today too.
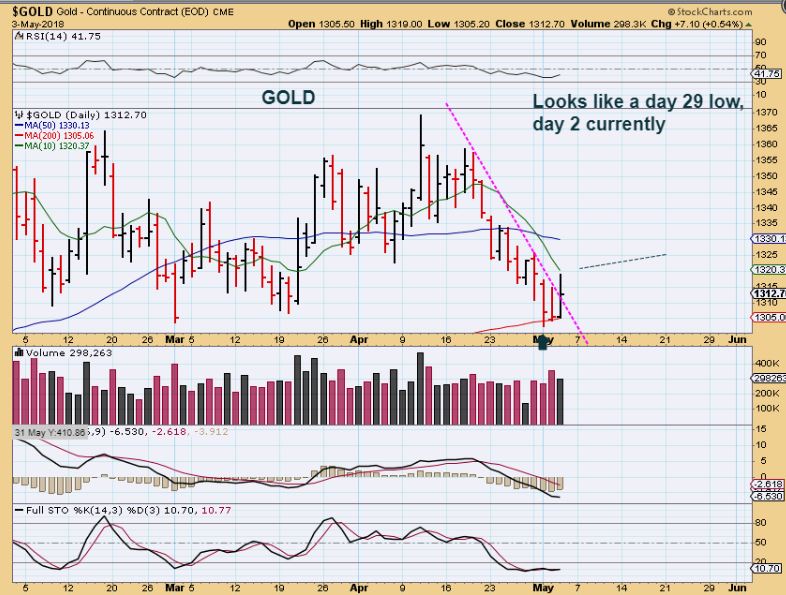
GOLD – We have a ‘swing low’ in place, but it did not close above the 10sma. I would venture to say that this is the lows, because the Miners are looking like they put in their swing low. Let’s look at Miners…
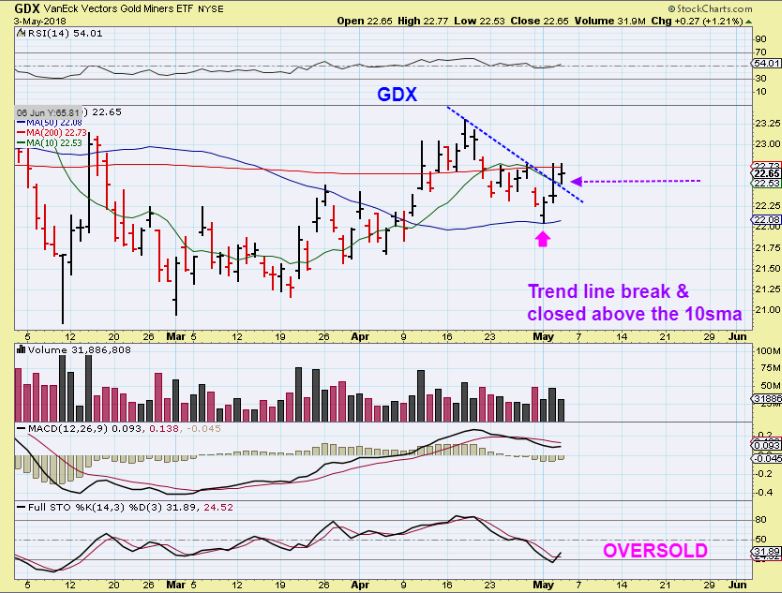
GDX – Closed above the trend lime and the 10sma, but is still stalling at the 200sma.
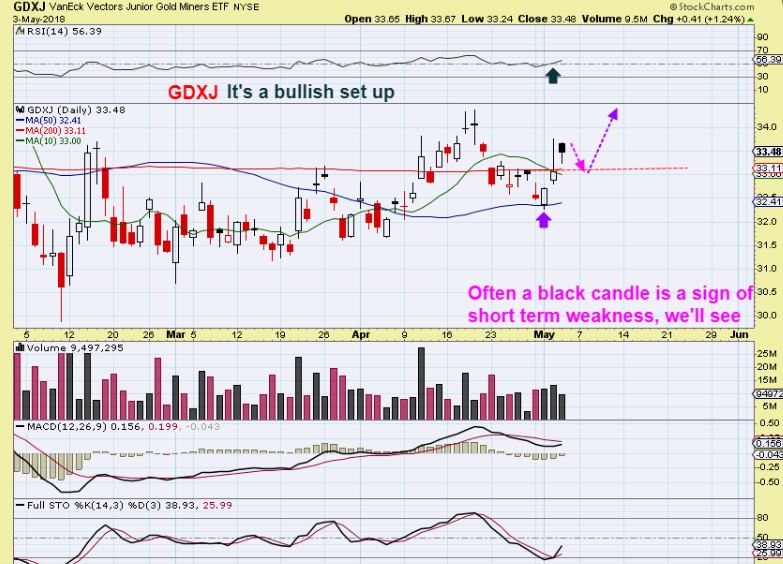
GDXJ – Maybe GOLD drops to a new low ,and Miners just pull back a bit? I only say this because we got a black candle on the GDXJ chart.
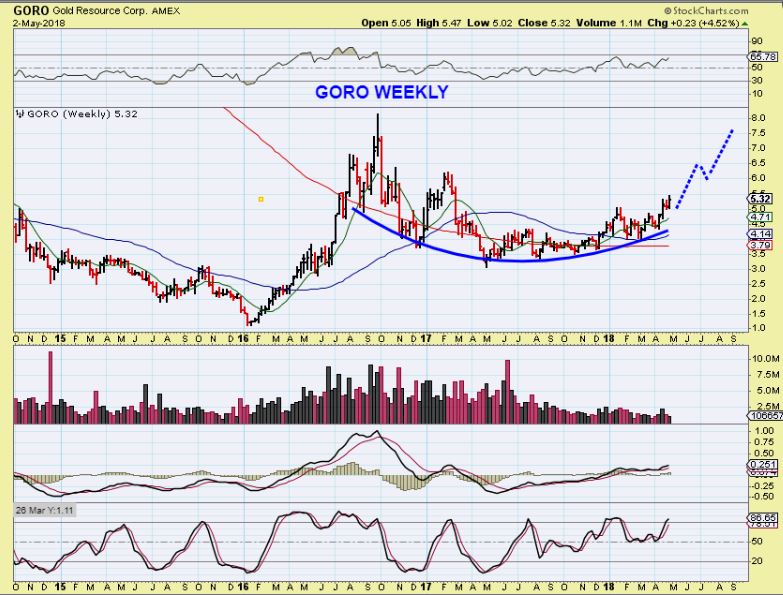
GORA WEEKLY – The Big Picture whether it drops 1 more time or Pops.
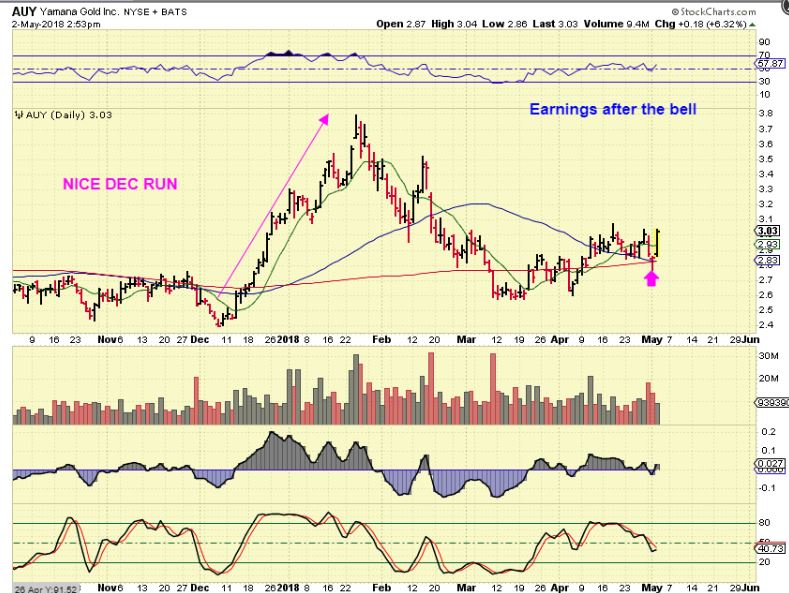
AUY – I posted this chart yesterday to say that they released their earnings. I also ended up buying this yesterday, basically right at this price. I got some at $3.00 & more at $3.05. It closed at $3.01 yesterday, so I am practically even. As long as I have a basket of stocks, I’ll hold this one too, at least for a trade.
After Fridays job report and daily action plays out, things may be a bit clearer for the Big Picture Weekend report. Enjoy your Friday trading & the weekend.
.
~ALEX
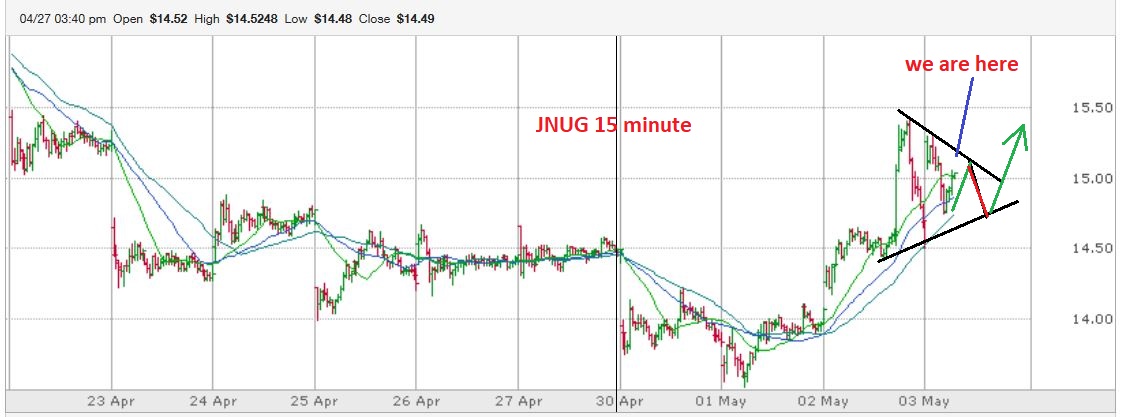
JNUG ACTIVITY – Since we are looking for a low and the timing is right, I decided to post some charts showing how I look at a trade set up in smaller time frames. I posted these real time for the readers to be able to see things the way that I do when I am looking for an entry or to dd to a current position.
JNUG #1 of 4– In the Morning, I said that I thought we would just see JNUG bounce around for a while and NOT run away higher. JNUG was overbought on the 15 minute chart, and a POSSIBLE TRIANGLE was forming. I drew in the last green, then red, then green break out lines, and mentioned that if I saw this form, I would expect a lower price mid day ( It was around $15.05 here, and I pointed ‘we are here’.).
JNUG #2 of 4 – As the day went on, it bounced around sideways as expected, wearing off short term overbought conditions. Then it hit my lower trend line, so I bought hat at $14.80. SO FAR, it never saw $14.80 again
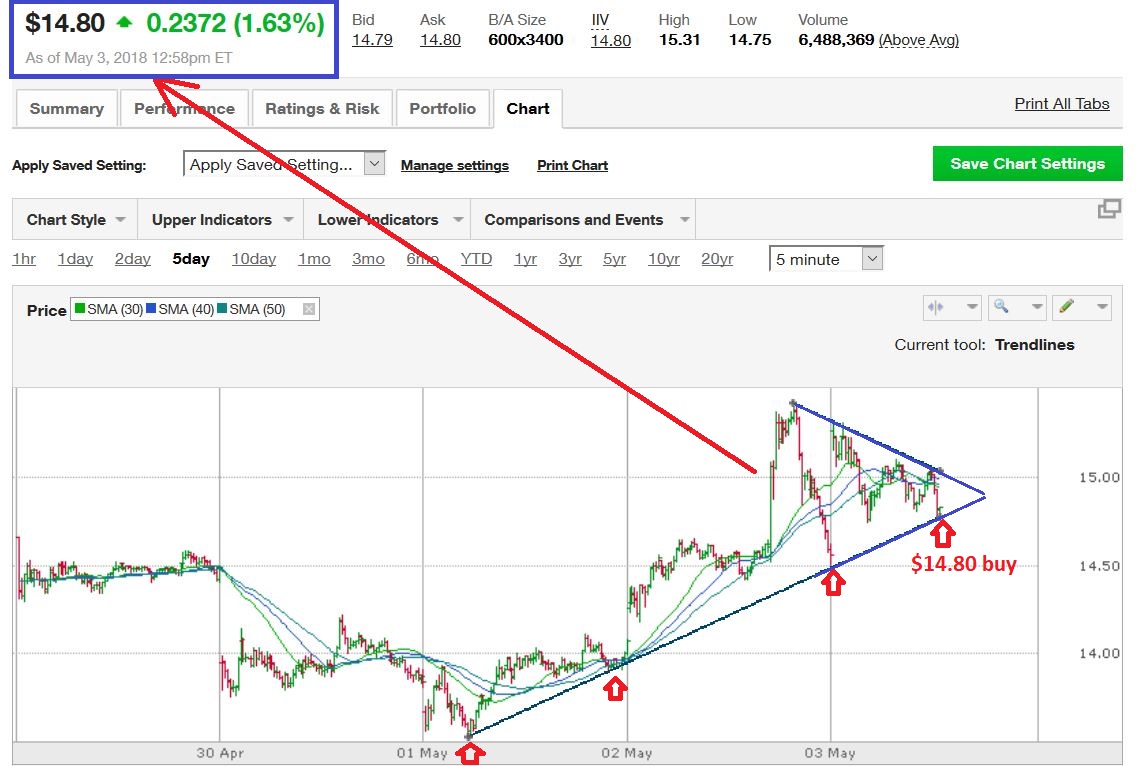
JNUG #3 of 4- I didn’t post this chart, but it was one that I was watching right as I bought that final dip, and before JNUG broke above the triangle. You will notice that JNUG CAN drop down to $14.50-$14.75. That could still happen, but notice what happened next…
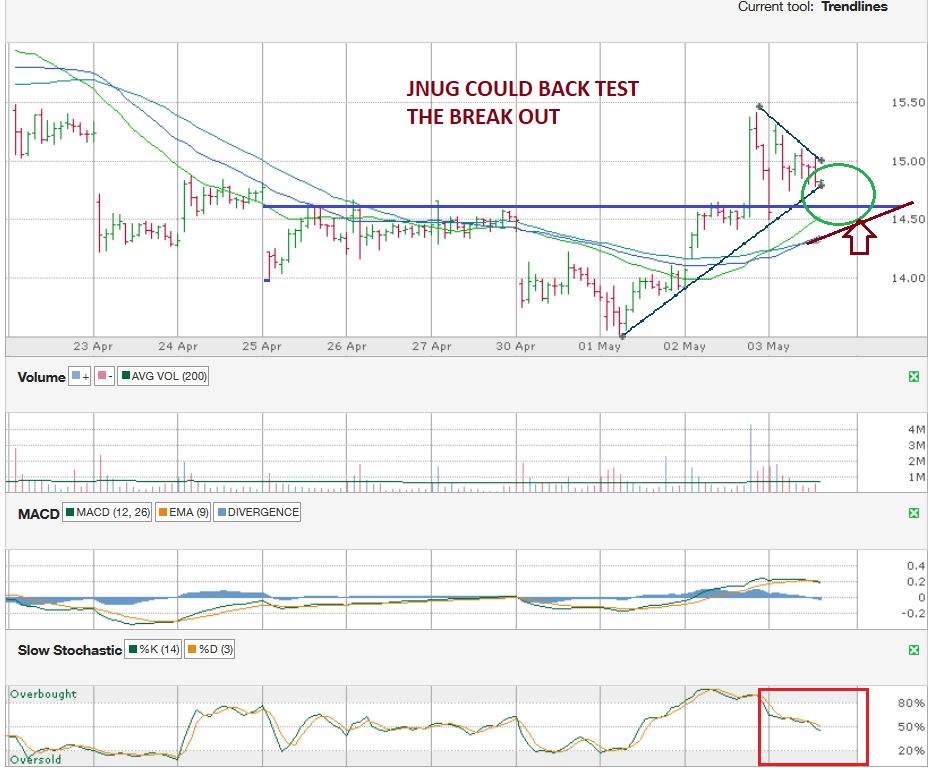
JNUG #4- It then went on to break out, and seemed to back test the apex. That is usually bullish, but it still may back test that area that I pointed out in the chart #3 ( $14.50+), if that black candle on GDXJ does cause a dip on Friday. To drop below $15 again, it would simply climb down that upper trend line. I will not sell if it did that, because I bought some lower too on Wed, so my Dollar Cost Average is lower that $14.80, plus I think that the timing is late enough that any selling should be short lived. Anyone else that is buying JNUG needs to decide now where they’ll put their stop.

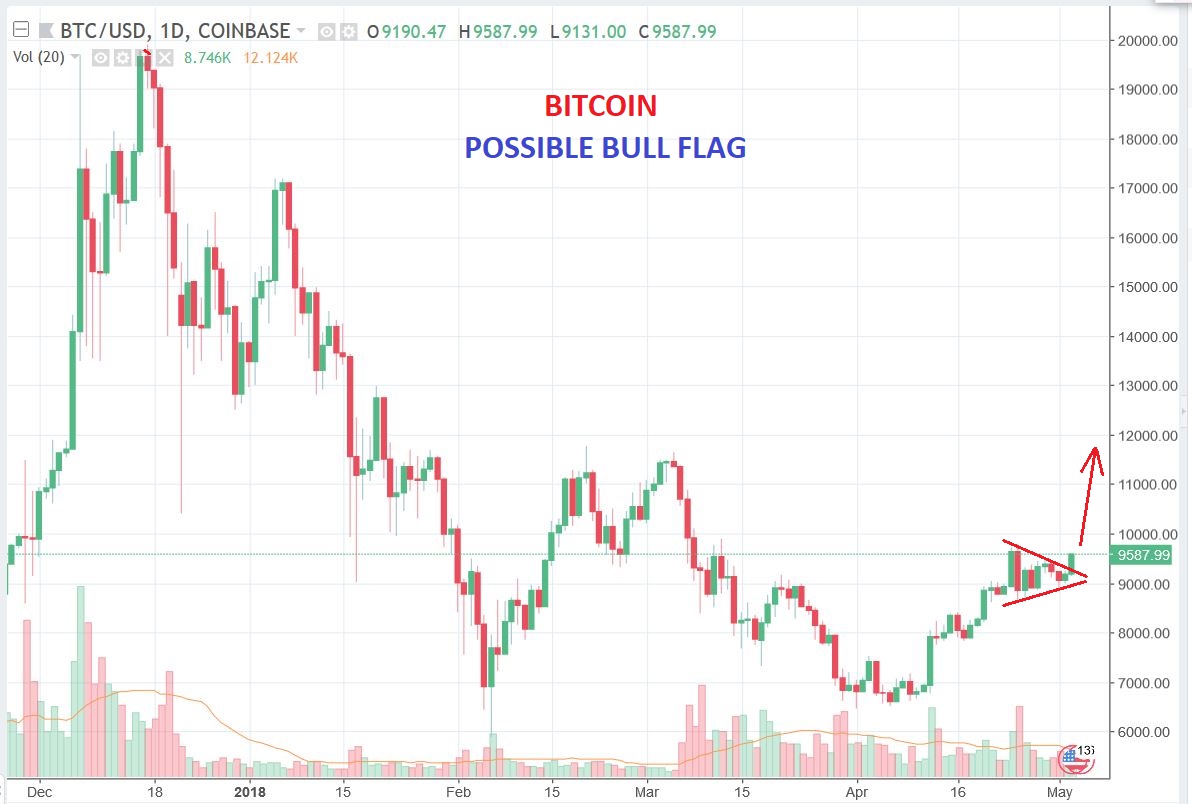
BITCOIN – I drew this and mentioned that some Block chain stocks were acting bullishly again.
MARA– Mara regained the 50sma, this looks bullish for at least a run to the 200sma. That is a good %-Gainer

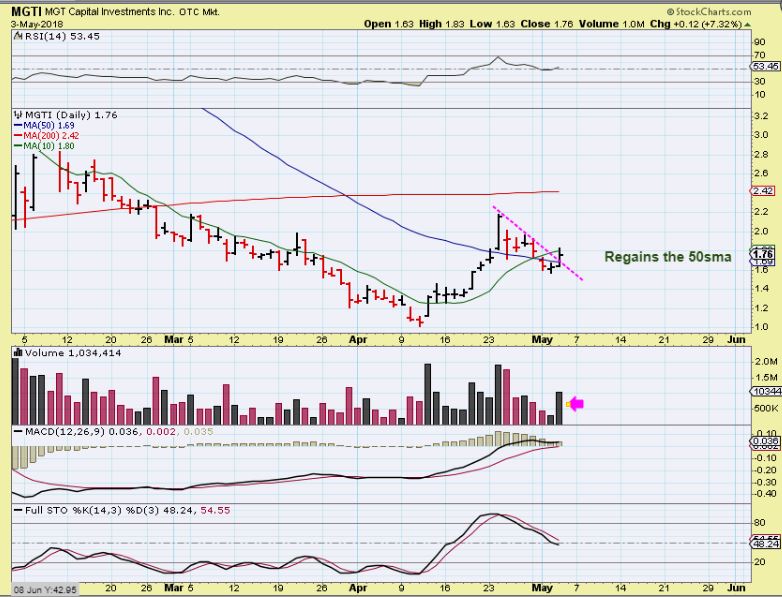
MGTI – This also broke above the 50sma, so it can be bought with a stop there.
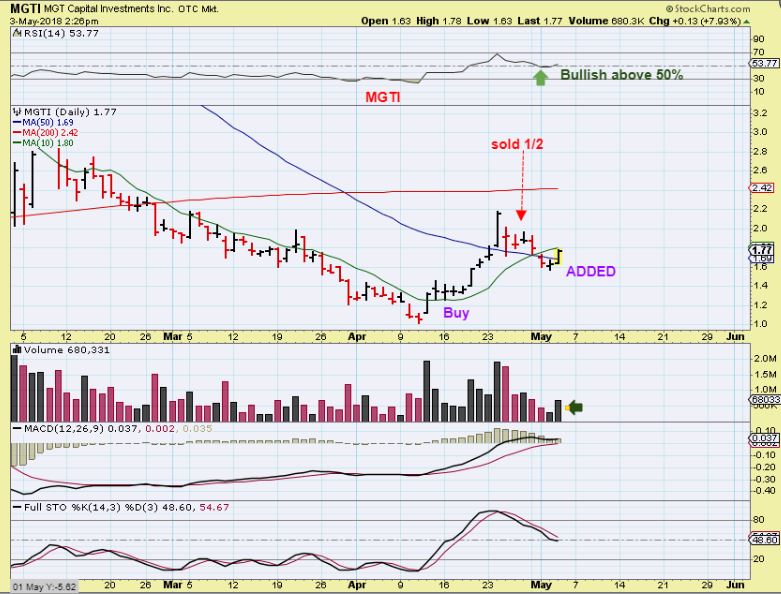
MGTI – I added yesterday, I had sold 1/2
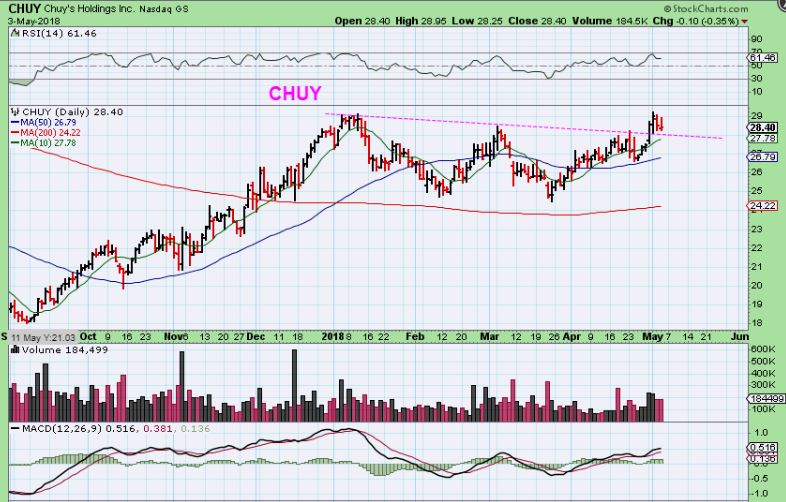
CHUY – I pointed out food, restaurant stocks as bullish. CHUY looked ready to break out like CAKE, SHAK, etc.

CHUY -It broke out & stalled. Is this normal? Yes it is , so this is still a buy. It could be forming a ‘handle’, but at the same time, break outs often put in small sideways crawls too, let me show you…
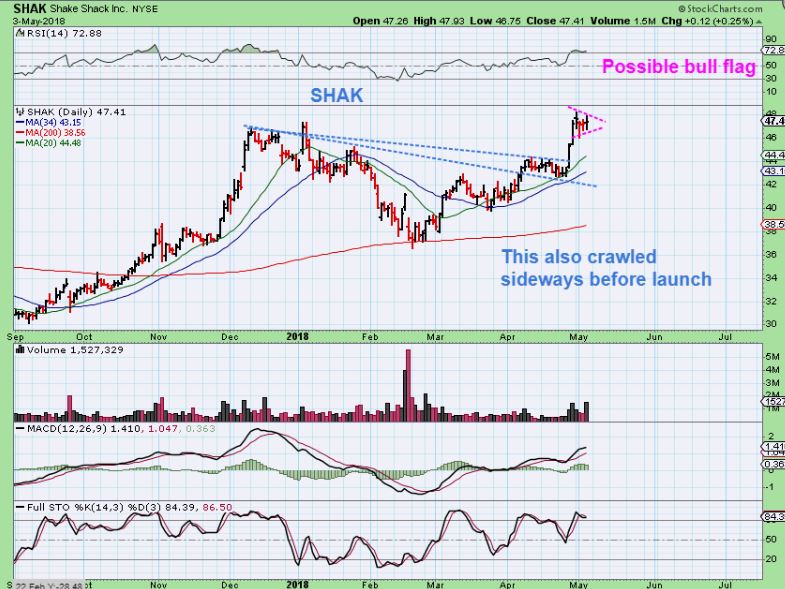
SHAK – Notice that SHAK went sideways for 2 weeks in April and then blasted off higher. It is bull flagging sideways again too.
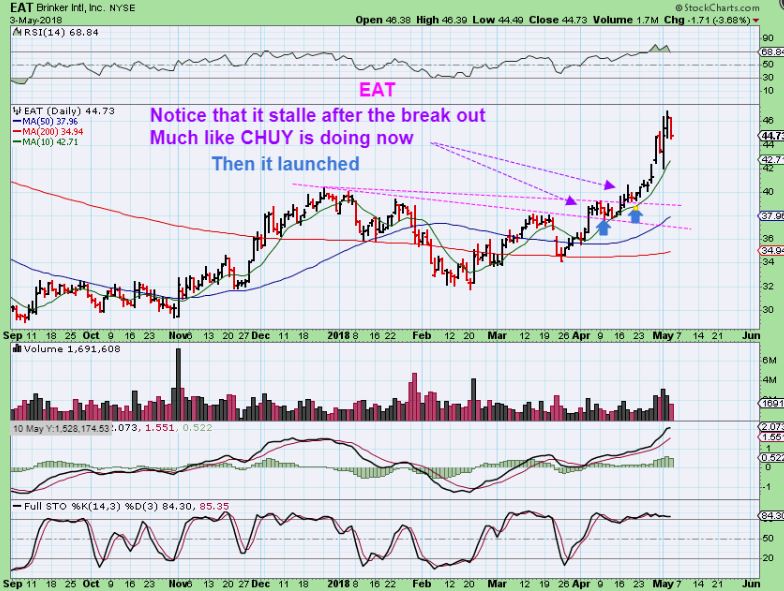
EAT – (Blue arrows) This went sideways for a little over a week, broke out & went sideways for a week, and then took off. So, CHUY is still a buy * hold, but it might be a tad boring.
ENPH #1 – I drew in another drop fir today. If it dropsas shown, I am still fine with it. ENPH is a bullish set up, and I showed this…
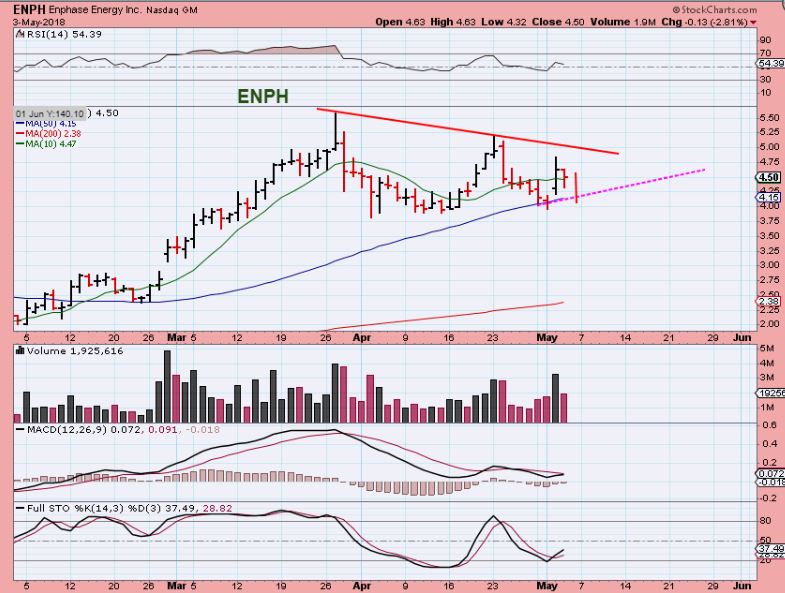
ENPH #2 – The big picture is great looking on this chart with a long strong base.

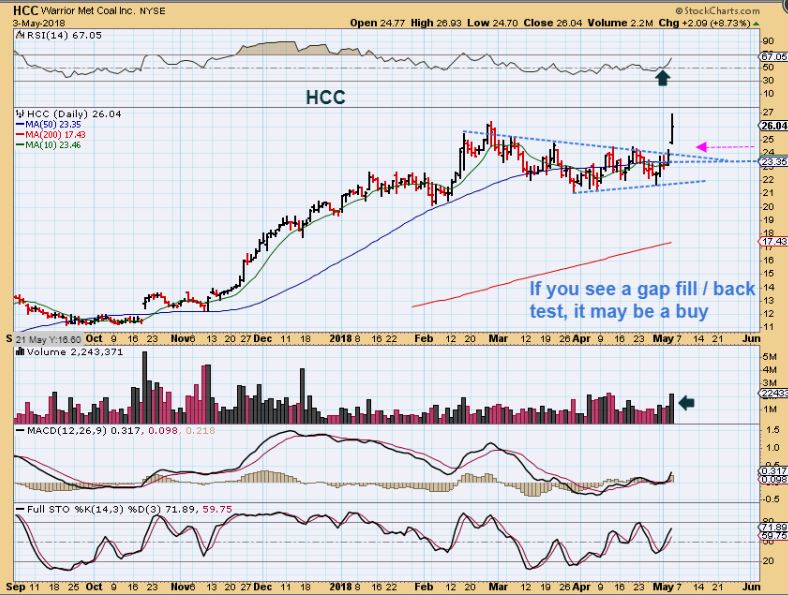
HCC MARCH 18 – This one I posted in March at the 50sma, but as the markets churned & sold off, so did HCC, into a consolidation…

HCC – It crawled sideways along the 50sma, and POPPED yesterday on earnings & a stock repurchase program. If that gap fills & back tests, this could be bought there, so I would put this on a watch list and see how it platys out for future possibilities.


Thanks for the report Alex, in relation to the SPX big picture, is it so bad if the Feb lows get taken out? In comparison I’m looking at the DAX and Nikkei225, the Feb lows were taken out but since then they kind of rocketed higher and seems like a shakeout below the Feb lows. What do you think?
That’s what I think is going to happen. My favorite trade setup is a shakeout and reversal, though…so I definitely have a bias.
Refresh,
I didnt say that the markets will crash immediately if they break Feb lows, but those FEB lows should be an ICL, and if we go below an ICL, you have a failure. That could possibly be the start of a down trend. Topping is slow process, so it could be a top, or just the start of that long boring choppy consolidation. that I have been mentioning.
Can it then bounce? Yes, but then you could have that mulit month / yr long consolidation of choppiness, and that eats people up. That is what I’d rather not see. I’d rather see the FEB lows hold as an ICL, and the highs taken out, but so far we have chop.
So the Nikkei & the DAX may be ‘rocketing’ higher out of a low, but will it last? They seem also to be forming into a bearish rising wedge, and that could lead to the end of a short covering run.
We;’ll see. – No, I dont want to see the FEB lows taken out on the general markets, it would be a failed intermediate cycle. You can play the bounce, but the choppiness that we see now has not been a good environment, and it could continue.
https://uploads.disquscdn.com/images/7e8b3a6b065dfc2cb59c23062b0e0c2943bf71f8897ba680199975f897332fbc.jpg
https://uploads.disquscdn.com/images/d4dd0e73ed2a8c3dea9ebf58426022401bdcb5c585ed9e96f44ea5ba80fea8ac.jpg
I’m NOT saying that the DAX is a H&S- I am just pointing out that if the recent run runs out of steam, a top can form
Thanks Alex, appreciate your insight
Sure, and I dont want to be misunderstood, I’m not bearish yet. The SPX is still a bullish chart, as I have mentioned in my reports, and in THIS report I wrote that the SPX is still a bullish chart….
but this choppiness needs to be monitored, and breaking below the FEB lows is not usually a sign of good things to come- to me it is a failure that signals weak choppiness going forward.
Alex, I’ve been watching TQQQ. I think its likely we get a few more days down or sideways before the low is in. I have the DC at about 22 days. In the past we have seen 30 days as the average. Just something to consider when judging the SPX above. Im looking to buy in the low $132 area. https://uploads.disquscdn.com/images/de2ef9c004bbb4c24342b5f99c9ee5dd696db2371e477d14a2c6725672b5309d.jpg
Alex, thoughts on WHEAT? Looks to be turning bullish to me. Higher highs now off the bottom? Click the link below………
https://www.tradingview.com/x/G8vUE7lF/
CORN, WHEAT, SOIL BEAN, RICE – Looks like inflation
Alex, I’m still ascairt to get in too heavy until I can tell whether we have a ICL here. Is it just a gamble or will we have some cues along the way?
Im with you H50! I don’t believe this is an ICL……….yet!
We dont even have a confirmed swing low in Gold
Trade according to your own style, comfort level, experience, ability, etc
and dont fear “missing the move”.
Good morning, Alex – nicely comprehensive report, Thanks!
For the first JNUG chart, you mention that JNUG was overbought on the 15-minute chart
What indicator told you that? Slow Stochastics? I saw that on a subsequent JNUG chart you included
I try to “finesse” my entries (each one starting as a quick trade if necessary, while I see if it can turn into a longer lasting holding), and I’m thinking I need to add that to my screens.
Yes, it was a stochastics, HOWEVER, they can stay overbought on a 15 minute chart for long periods of time.
I jump around from 5 minute, 15, 30, 60, etc & look for many things -and all together, it looked to me like that was not going to be a GAP OPEN HIGHER & RUN AWAY type move. It looked more like it would stall, maybe get choppy, and try to wear off that short term overbought. Divergence was showing up in the MACD in various time frames too.
Sounds like the accumulation of a lot of experience – that’s why we’re here!
Great report Alex. I did notice that XLF undercut both Feb 9 and April 2 yesterday. Recent history has it moving a bit ahead of the crowd.
Yeah, Financials. The high volume makes FEB look like the ICL, so that would be a failure, but the reversal should lead to a shake out. I would expect a bounce
Gotta love this choppiness?
refresh
https://uploads.disquscdn.com/images/7c72009dffd209efdf89582a89e14ed732ae1992b337bfeb983c3ad64e6a5feb.jpg
Started a position in AKS this morning. Might add and hold long term. ( that’s about 2 weeks for me,lol) any thoughts CF? Thanks
SHAKis about to break that bull flag in a big way this morning.
refresh – Boom
https://uploads.disquscdn.com/images/71802953682be2ee207933a6a1a05a7b3e6023ad8fb15b6a1b5c22d8e557f3e0.jpg
The back test from the 3rd JNUG chart in the report. Hopefully, that is enough.
refresh
https://uploads.disquscdn.com/images/d2dfe7f143928fbfd30e7e8472f42fbbf56bfffbdc285ac290ebf7a61be9fde3.jpg
FLR – a good reminder of why not to hold through earnings
AAPL over 180 again… sheesh
Refresh : Here is a different perspective.
It you bought it in the beginning of November as a ‘BUY & HOLD” Bull stock, you’re up $5 7 months later
Its a BULL stock, but not always easy to ride BUY & HOLD. Just another perspective
https://uploads.disquscdn.com/images/b624845c87d8dd9fa213f45177e89d0061843dcd676efa485418091f2152629d.jpg
75 million shares of AAPL bought by Berkshire Hathaway in Q1 – thats a BIG load of money going into AAPL
BKD backtest, lets get that curl
I like that chart on the 10 & 50sma
This seems like it may be one of those boring Fridays
not too sure what the USD has up it’s sleeve here
MAYBE I WAS WRONG, maybe it wont be a boring Friday
I’m seeing many Miners turning green.
and your TQQQ call yesterday – MONEY
Yeah, it actually just dropped down & filled that open gap- pretty much bounced off of the 200sma.
I didnt take the trade myself though.
I did, and FINALLY taking a 3x paid off. However, I only took 100 shares
Ive been on the wrong end of TQQQ 4x now with some size-able losses.. so this felt great
I can’t believe I got stopped out a week or so ago at loss, the Big boys got me. Held just a little longer and would have had a solid gain. Grrr…
Would have paid for a full year of CF with just that 1 trade!! Argh
RNN
Nice- pushing on the 200sma ( May stall & crawl if it cant get through).
GPRO has a nice looking base on a 6 month chart, released earnings and actually looks good now
refresh
https://uploads.disquscdn.com/images/78283f4f31e387b6864cff0762376ae3feb7a390faa86f1b47e160ab7587cb75.jpg
CRC broke out in a big way too.
Alex are you still holding on to any pot stocks?
Yes, all that I mentioned that I bought have given me no reason to sell
KSHB near the recent highs, GBLX above the 50sma, CNBX in a base pushing on the 50sma, but it needs a bit more strength , etc etc
Convincing move on the SPX. Might have the bottom. 1hr chart
AAPL looks like its propelling the markets right now
ENPH – I want to add, but I also want to be patient and see if I can get another tag of the 50dma, and that gap filled at the same time. Very light volume today so far
Decisions, Decisions, Decision….
refresh
https://uploads.disquscdn.com/images/446339996f60889e19c3208992ee3d4f6b7e6b1b547ef34039ad6f8a9ee7e418.jpg
Don’t you want to see the price close above the 10sma and the MACD cross over?
eventually, of course, right now ENPH has been in a nice bill run, I liked the earnings, etc etc
It is above the 50sma
likn NOG and DQ … ER soon tho
EGG NOG?
yes.. that’s exactly correct
😀
CHK ….
CHK Filet, not the restaurant
shooFlyShoo
😉
I’ve been watching too long, want me some ENPH next week. Have plenty of $$ to deploy!!!
SHAK up 22%
CAKE & CHUY looking very good
Good call on those goodies! 🙂
CRC another steller follow thru
Not crazy about the volume but $OGRMF is making a slow and steady climb above the 50ma
GLOG huge reversal candle with vol off double bottom ..
AKS picking up a head of steam. Not too late on this name. : ) Coming off the triple bottom.
I like it here, I took SID Today at 2.5 pretty sizeable… riding support.. Good catch on AKS brotha
Thanks BT. Bought this morning at 4.30 and 4.34….AKS
VALE coming out of the handle.
Nice!!! Looks like it wants to POP….I’m getting in that. Thanks!! Only thing I don’t like is they have over 5B share outstanding. Will keep close eye on for entry.
I’ve been in for a few days and added here to 1/2 position. Blue sky coming up which means a) there are probably lots of insiders and algos ready to sell into any bump (aren’t I cynical) and b) once it gets going it should be a fun ride
Yup, will keep watch.
lots lookn good …
I agree
Along with many other COMMODOTOY stocks, check out ( Boy I hate to say this) NAK 🙂
I still own it
yes..
*me2
it’s really takn some discipline not to buy widowmaker… sat in that puppy 2 long … waiting.. zzzzz
want to wait till it clears the 200 day……………..
The AUMN widowmaker? I know
… im weak …
giggle
It is a good looking set up & does look like a handle
oil … slick 😉
CLF likn that
I didnt see this post, I went away for a bit, so I posted a chart above. I agree, CLF looking good off of the major moving averages too
https://uploads.disquscdn.com/images/12b60e8f86908e0a588ea02e95016b7d9f802ee06df718ea543b3448d2633f00.png
Alex, SPX will likely close above the 10sma today after the engulfing candle. Do you think we are on day 1 of the new cycle?
I wouldnt rule it out, but it does seem a bit short for a daily cycle.
Look at day 3 out of the APRIL DCL. Day 3 looks exactly like today, then look at day 5 – it dropped about as much as the POP on day 3, so .
when you have this kind of CHOPPINESS, it is hard to say.
You stole my question, bro.
#GreatMinds
AG – any idea when it will report? There is nothing on it’s website or in Marketsmith. It should be/could be around today.
It’s showing up on Fidelity as 5/7, however, not sure what time.
NASDAQ.com is “expecting” 5/9 after closing……so we are in the ballpark
Thanks!!
WEED.TO (love the ticker) aka TWMJF coiling
I like the chart of HL – I like what it is doing today, I HATE the volume though ( And I own it)
Same with TRX – Love the chart, hate the volume
I’m holding TRX. I mean it’s done so well with GLD down if we hit an ICL it could take off again!
Now SAIL looks good – like it wants to break to all time highs with the MACD crossing up.
It was definitley one of the better tech stocks in this choppiness. SQ trying to get back on track
And CREE- After that big GAP OPEN reversal and drop, has slowly recovered the 50sma
HCC- follow through
Interesting stuff right across the many sectors
even CASA is a little tiny bit green after kickin’ my assa
lol – it has been tough for some of the little techies
refresh for 3 charts
https://uploads.disquscdn.com/images/1de907868d2d9be1219487d40cd20b21ed0cc9f47f45e29c4ea34d8fa7258f6c.jpg https://uploads.disquscdn.com/images/78283f4f31e387b6864cff0762376ae3feb7a390faa86f1b47e160ab7587cb75.jpg https://uploads.disquscdn.com/images/374bfd2acf87d0ea6809e88f1742a7a4a25a159369880d2fa80e8e6a9208cb7a.jpg
yahMon … 😀
They Be Jammin’
Go CLF!!!!!
NSU looks like a solid break out too
I thought I mentioned that this morning as it started moving, but I dont see my comment down below
wow…. nice
too grandiose? (from 2006 low)
https://www.tradingview.com/x/2b0lBCxw/
Alex. Thoughts on NAK. I have it from .98. Add here or wait until it’s over the 50 day?
lode… maybe wants to finally go too.. 😉
RNN .. nice
GREAT WEEKEND ALL .. .it’s BEEE YOUUUU TIFUL here ….
😀
RNN…. just realized you’ve been saying it all day! I got an alert and bought at 2.2! ahaahahahh ,
$3 target
… or 3.25… yes ;o)
😀
cheers FRENCH MAN … ;o)
lol
RNN (weekly)
https://uploads.disquscdn.com/images/aba88979f1a3ab6a8727da51bbdd36acb742b7d533acc3cb2d9234e9ec36c065.png
mmmHmmmmm … https://uploads.disquscdn.com/images/a9c82b322d0c5291b884ec20608821a66d412d726f7d8ecc1d11c4481bc1a645.jpg
… annnd i would be mad.. if it wanted a reDo of that leg….;)
https://www.tradingview.com/x/KGnSvloV/
$2.28 ah
guessing that some shorts with tight stops got caught today with their pants down today- especially SOXX
I had some VXX as a hedge, had to let it go today, down maybe 2% so no biggie. But yeah shorts hurting here, otherwise I’m all long right now.
I’m looking at ACIA for 5pts https://uploads.disquscdn.com/images/cb2afdfb6b639c3b363d907a44cc78521d13901705784eccb3d1c920179b07e1.jpg
Got an evening star candle on the upswing?
The COT hasn´t meant much lately, but very interesting this week! https://www.cftc.gov/dea/futures/other_sf.htm
Ralph, could you tell me what that means in your opinion? I appreciate it very much. it’s Greek to me. Thanks
Well recently, positive readings for silver haven´t meant anything so I would not get too excited, except for the fact that gold and silver were giving opposite signals, that is gold´s COT was pointing to lower prices, while silver´s was bullish. At least now they are both suggesting higher prices, as the speculators are usually wrong and are increasing bets on the downside, while the commercials are covering their shorts (and they are usually correct). There are no guarantees, but a signal is more likely to work out when everything is in sync.
In short, its quite bullish for both metals now. Let´s see if it means something this time around.
I wouldn´t make buy or sell decisions on the COT by itself, but at times it is a good indicator that many have finally decided what side of the boat they want to be on.
Thanks Ralph, that was very helpful as I really couldn’t make anything out of the COT. May the stars be with us this time.
WORKING ON THE WEEKEND REPORT. IT MIGHT BE OUT LATER TONIGHT, OR IT MAY BE SUNDAY, IT WILL TAKE A FEW HOURS>
IF IT IS NOT OUT UNTIL TOMORROW, IT WILL BE WORTH THE WAIT FOR ME TO GET THIS ONE COMPLETE.
I WANT TO ADD A BONUS SECTION AT THE END FOR GOLD- THINGS THAT I HAVE BEEN TAKING NOTE OF ALONG THE WAY, AND IT INVOLVES A FEW ENCOURAGING Observations 🙂
THANK YOU FOR YOUR PATIENCE!