We saw reversals in the General Markets yesterday, and it does look as though we had a 1/2 cycle low and next would be a move higher. We will probably put in a swing low on Thursday. The question is, will it just be a bounce or a decent rally? I am leaning toward just a bounce, maybe for a week and we will know how strong it is after it begins to gain traction. I see internal signs of weakness so far, and it takes energy to get a sustained rally. Until we see buying power step in, it will probably just be a bounce, but it could be a trade-able bounce for those that want to play it on the long side or still get out of current positions. Let me show what I am thinking…
SPX – I see strong divergence at these lows and a reversal off of the 200sma, a good set up for a bounce here. That first run off of the 200sma in April was weak. I think that the next one could be weak too, and Let me show you something that is good to keep in mind…
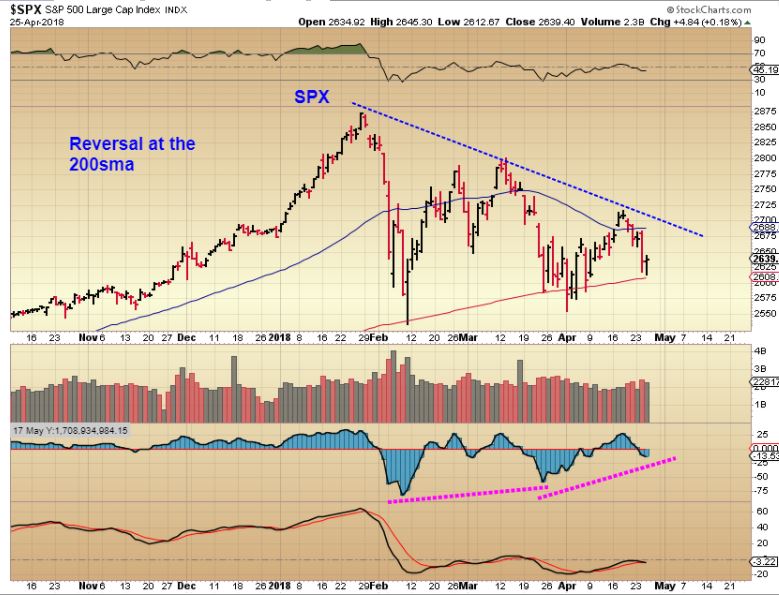
Let me show you something that is good to keep in mind…
SPX HISTORY WITH THE NEW FED CHAIRMAN – SO FAR, the markets have sold off around any Fed News or speech, and that includes both 2018 FOMC Meetings. Now we have the next one next week on May 2. That is at least something to keep in mind, right?
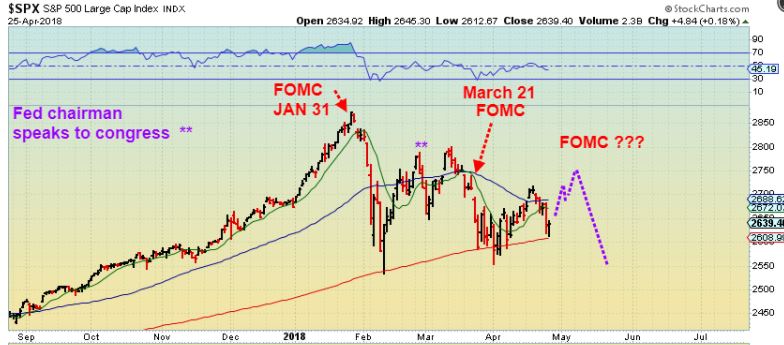
So at this point I think that we could get a weak bounce and the markets may rollover around the MAY 2 FOMC Mtg. THIS OUTLOOK CAN CHANGE, but for now, that is what I will be looking for going forward, and the cycle timing fits that idea. You can go long an ETF or maybe your favorite stock, or you can simply wait and see how things play out. Maybe even wait for a better set up in other areas ( Miners).
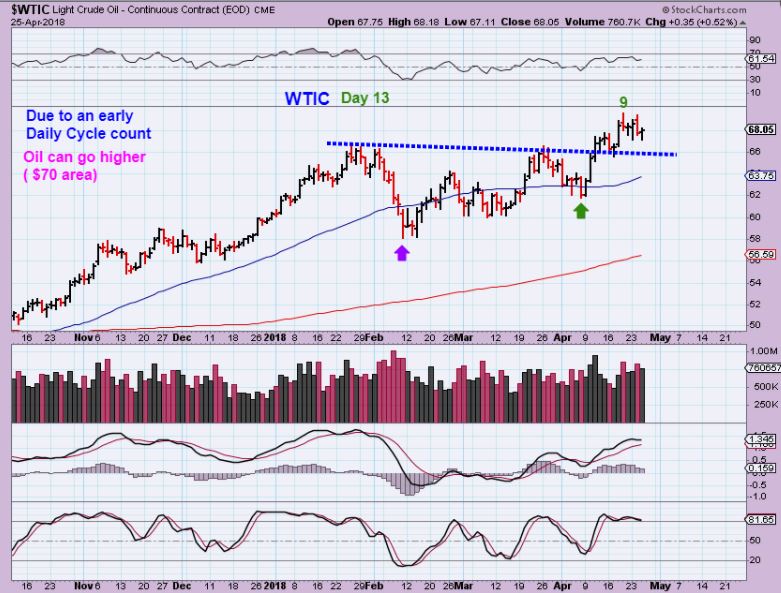
WTIC – I have mentioned recently that I would think that OIL can get to the $70 area, but I also expect this to be a L.T. Daily cycle. Time will tell, but lets take a peak at energy stocks.
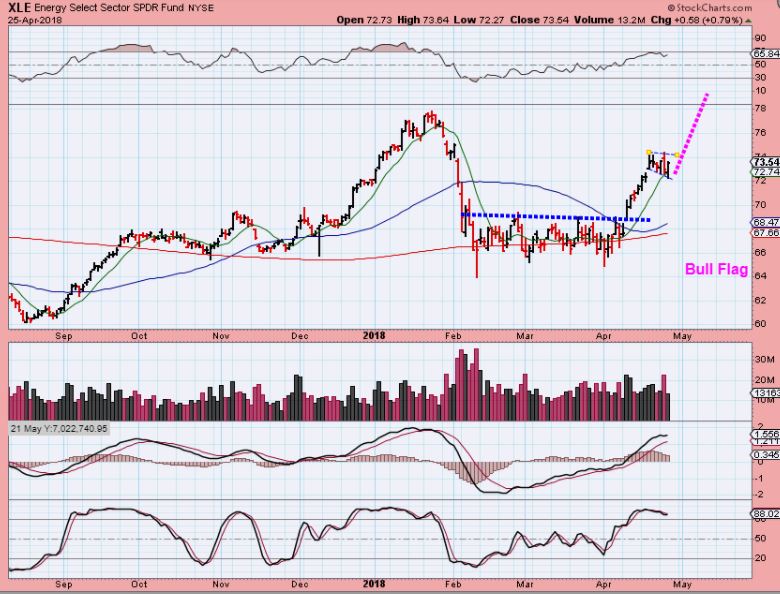
XLE – I feel that this is a bull flag, a mid point stall in the climb out of this base.
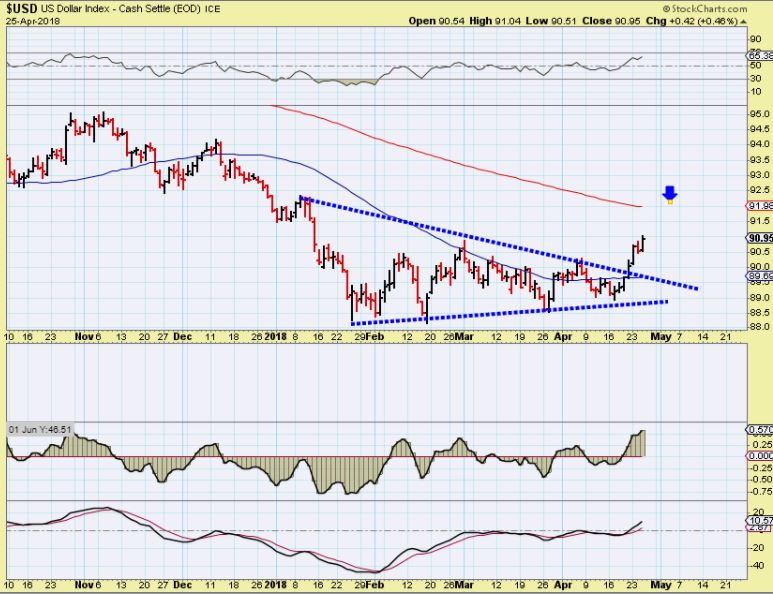
USD – Upside until the FOMC too? That is what I have been pointing to. Gold dips as the USD pops higher.
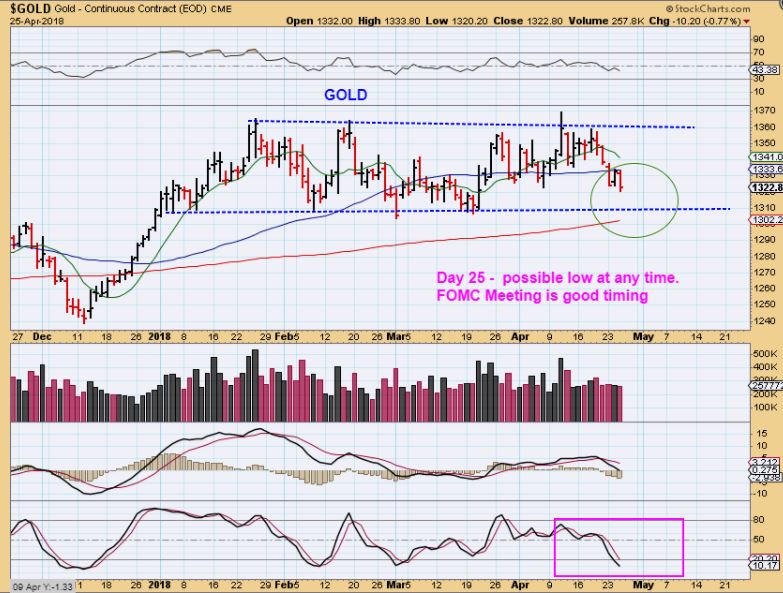
GOLD – So Gold could bounce around or drop into the FOMC MTG too. We are already within the timing for a dcl, but lately they happen closer to day 30.
GDX #1 – Day 25 and even when GOLD & SILVER Drops, Miners are holding up better than they used to. I have drawn a channel, but …
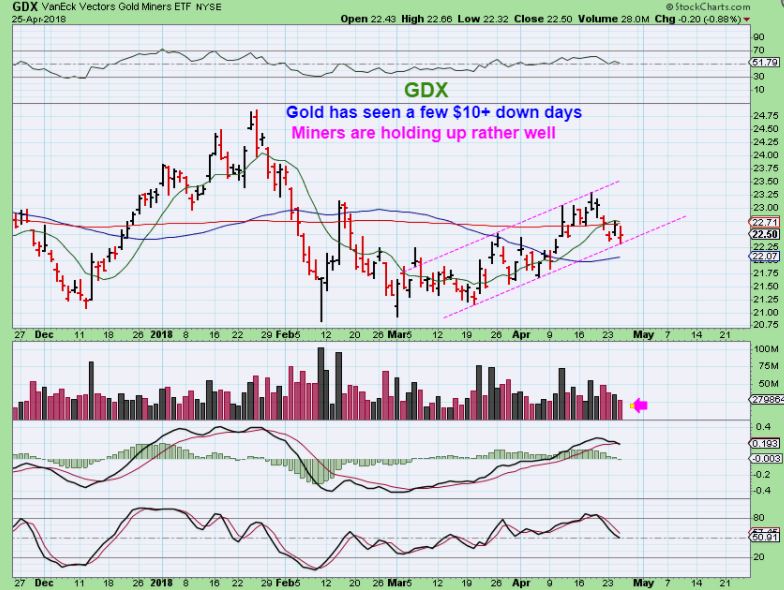
GDX #2– During a dip into a DCL, channels can be broken, so be aware of this type of move as a possibility too.
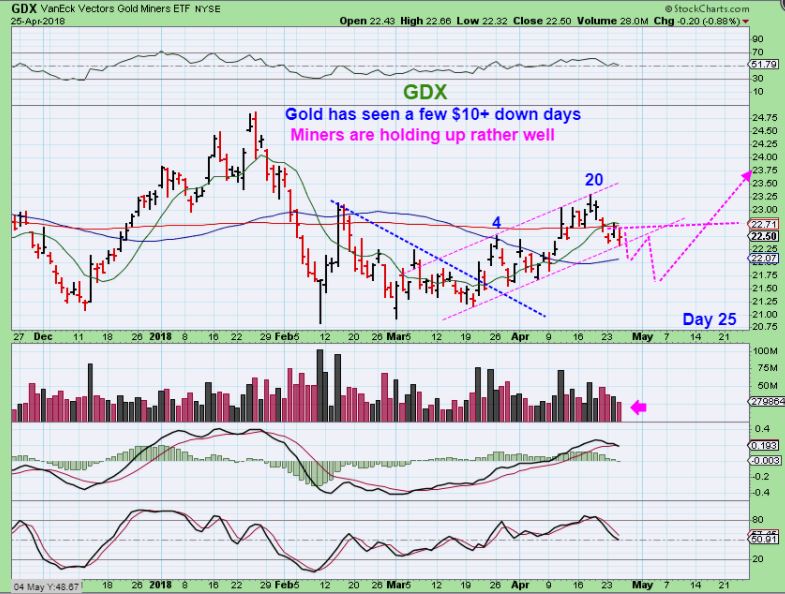
GDX #3 – Or it could hold on the 50sma , in more of a bullish manner. I say this because…
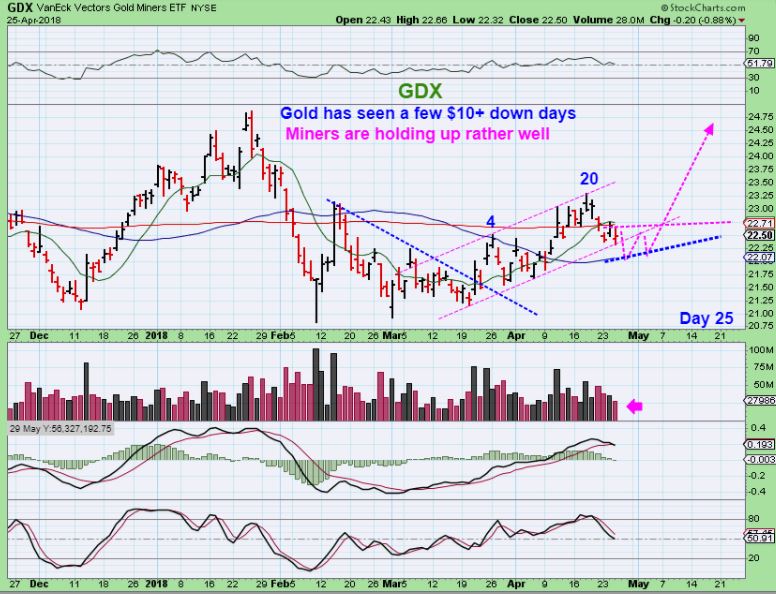
I say this because even when GOLD drops $10/day, some Miners are not really selling off in a bearish manner. For example:
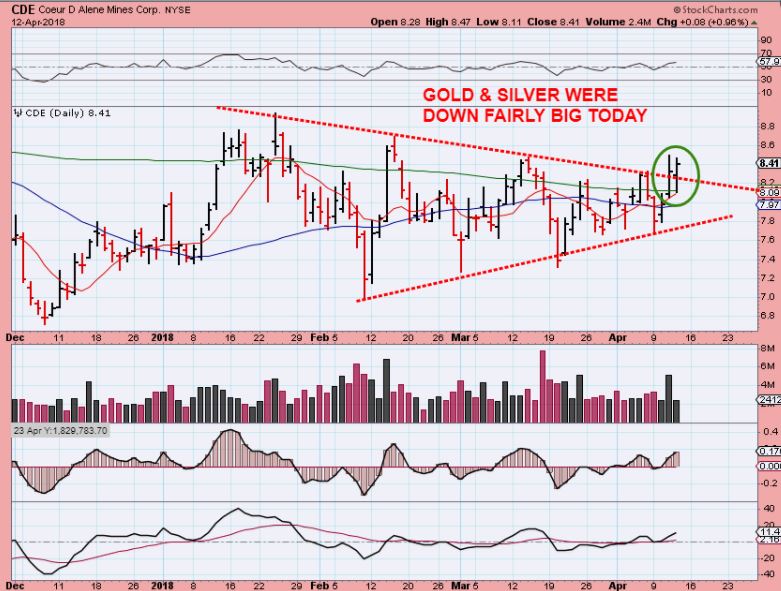
CDE ON APRIL 13 – Some Miners have been acting bullishly, even on days when Gold & Silver sell off, as shown here back on April 13th when Gold dropped sharply.
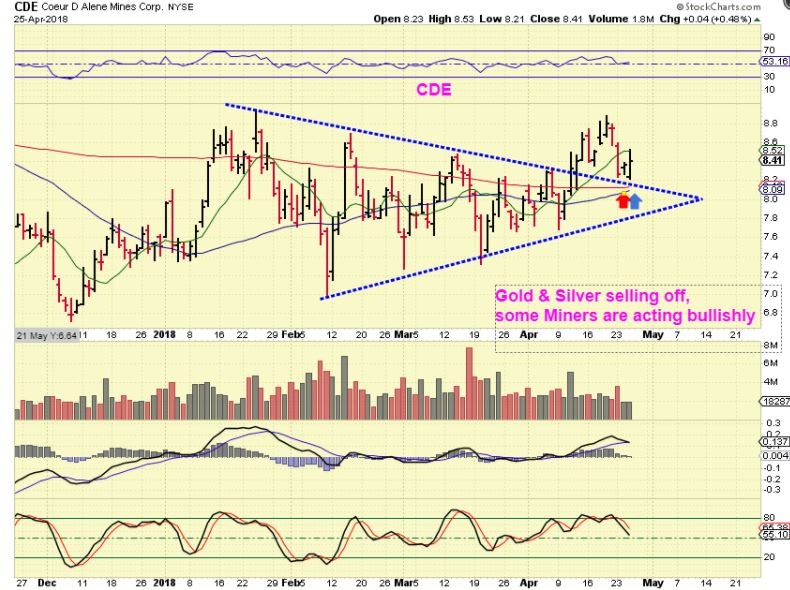
CDE – And CDE also closed green yesterday too, with Gold & Silver selling off. If you examine the chart, it is a normal bullish ‘ Break out and back test’. I own this and almost added yesterday, but I’m going to wait and see if we dip again going into the FOMC. This dip MIGHT be all we get for CDE, that is a good triple support area.
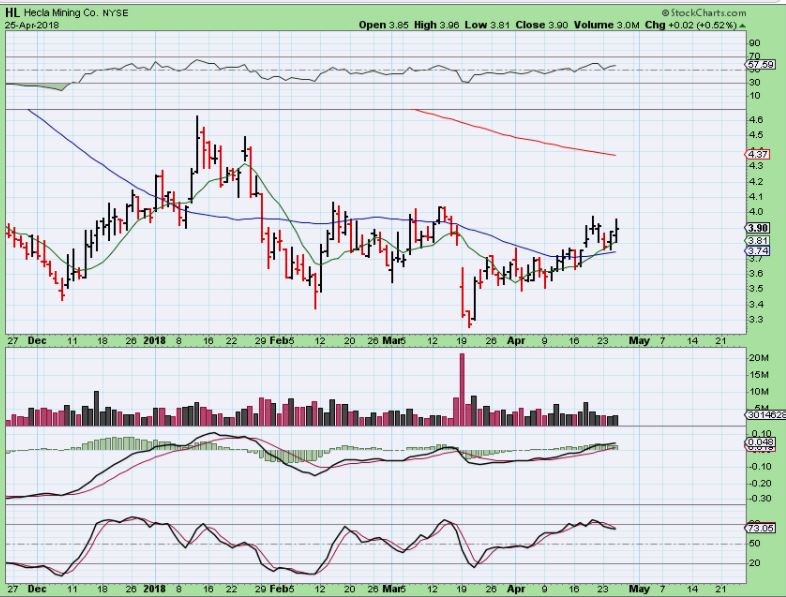
HL – Hecla Mining also closed green yesterday, and held support too.
AG – AG was green too, now pushing against the 200 sma.
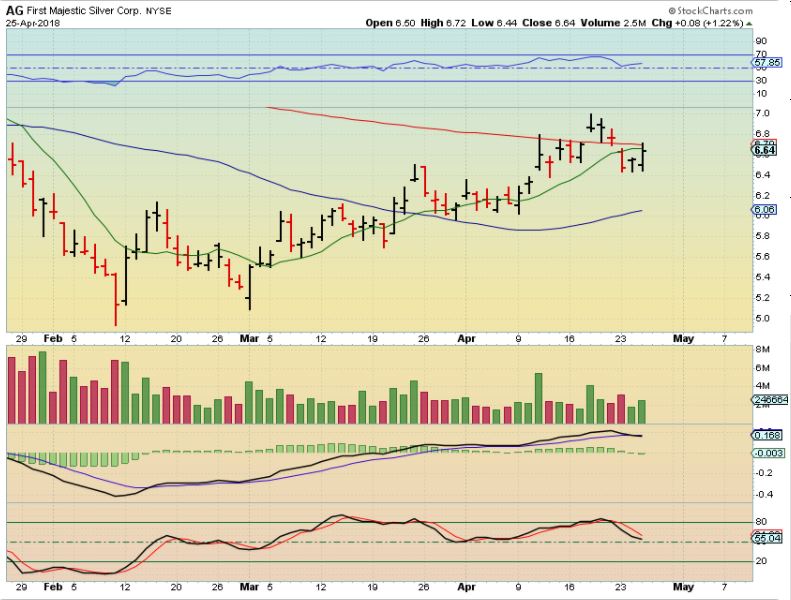
Just look at those charts of CDE, HL, and AG ( and there are others) and compare them to the sell off in the base metals. It does seem that some Miners may not sell off as much as we used to see when heading into the timing for a dcl. Weeks ago I mentioned buying Miners , especially silver stocks ( I bought TRX, CDE, HL, FSM, AXU, ) and I am still holding them. The way Miners are holding up when the metals sell off, I do not plan on selling them. I have repeatedly mentioned that ” It would not hurt to at least own a Miner or two’ , and surprises to the upside in TRX, AKG, THM, and a few others have been rewarding. CDE is at support and back testing a break out, a starter position there is an easy purchase with a tight stop ( or even a looser one at this point). Many miners now look like Bullish set ups.
The markets have been choppy and difficult to enjoy recently, as they have bounced around for most of 2018 so far. I have made money In CASA, SAIL, AQ, SQ, HCC, SGH, and a few others in 2018, HOWEVER, it is so choppy & toppy lately, that I have given some of those gains back too. It has not been a good BUY & HOLD relaxing environment, it has been choppy, so if you ‘buy’ reversals today, keep that in mind. Investing long term remains a bit difficult until the markets find a directional trend, and we need solid buying and accumulation for that. Short term trades may work best for now.
With Interest rate hikes possibly threatening the balance, but corporate tax cuts designed to help the bottom line, we will need more time to see how this sector will play out longer term. My Big Picture Weekend reports will keep an eye on things as they play out. It could be any of the following in the long run…
1. Are the General Markets topping? Maybe a double top from here as I originally anticipated?
2. Or are they starting a prolonged consolidation period, as mentioned in the past, similar to 2015-2016 area within the purple lines?
3. Or is this a Bull Flag with another leg higher to follow? We look to be at a short term buy , and we’ll see if it turns into a longer term buy or a failure. Monthly Charts pointed toward a topping process.
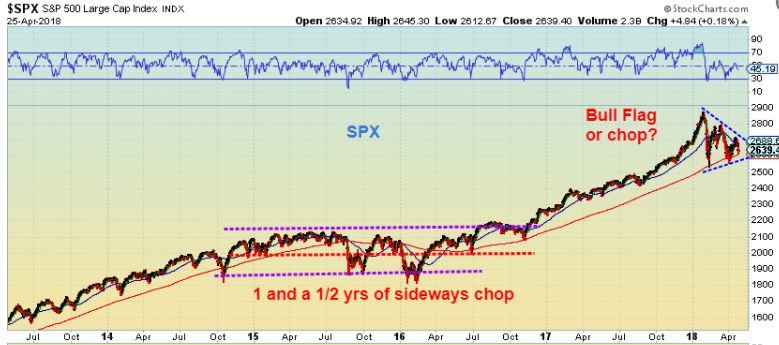
Above is the big picture view, just to give us hope that clarity isn’t that far off. For now we take it step by step, and trade according to the current set ups and timing within daily cycles. Currently, We do look like we have a 1/2 cycle low ( selling was a bit deeper than expected) and with yesterdays reversals, we should get s bounce. We will watch how this bounce unfolds to see if it can gain traction and rally higher, or will it roll over. I am leaning toward weakness after the FOMC, but that remains to be seen.
Enjoy your Thursday trading, I have a few ideas below.
~ALEX
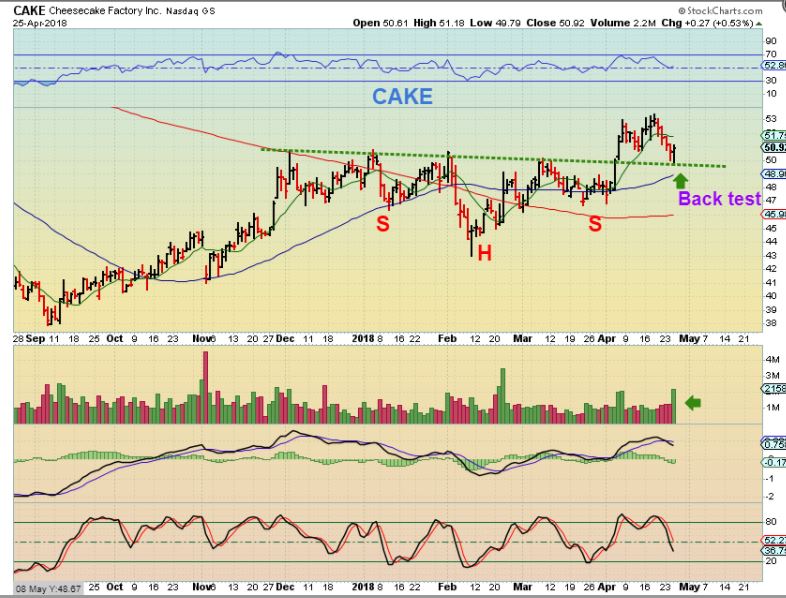
CAKE – I love this chart set up ( AND THEIR PRODUCT) as a break out an back test. It reversed and may be done selling down.
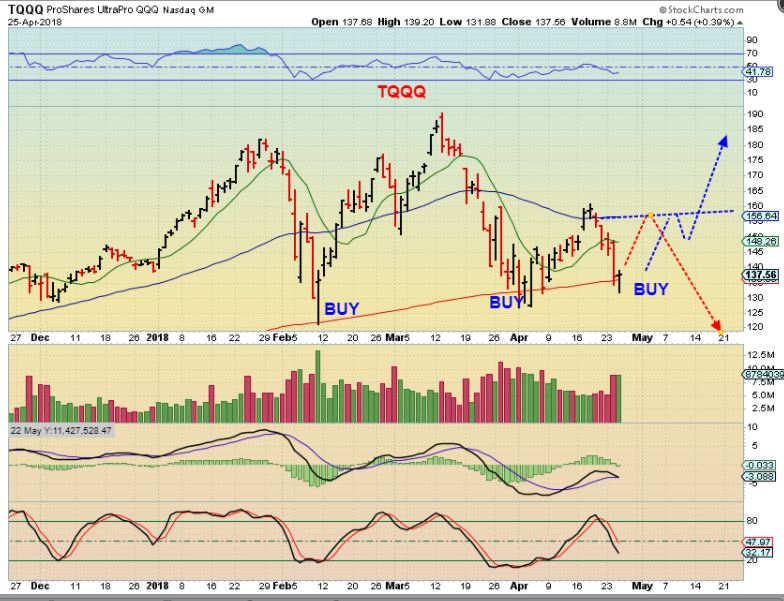
TQQQ (Or UPRO , UDOW, TNA, ETC) – The reversal is a trade set up considered low risk, because you can use a tight stop. The possible outcome is shown in a bullish and bearish manner. The recent choppiness has made these trades difficult.
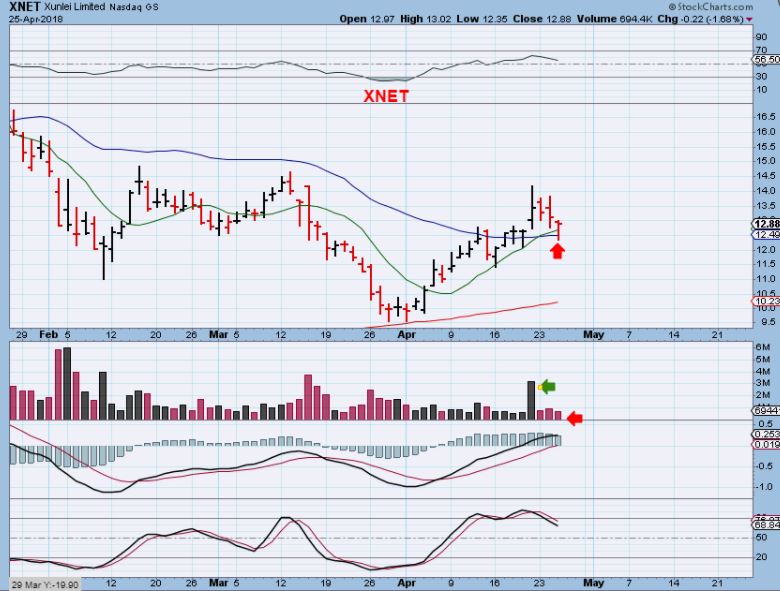
XNET MONDAY – I said that I was thinking of buying this if it tags the 50sma
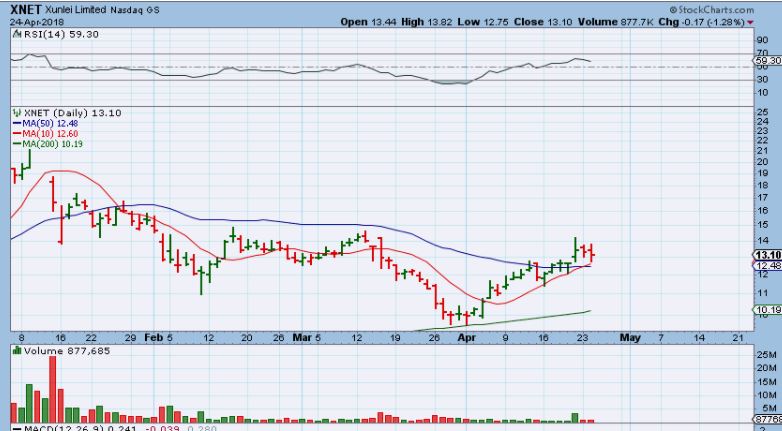
XNET – It tagged it and reversed, yet I did not add. I already own a few block chain trades and they move so quickly, I want to be able to track them clearly. I still may buy this in the near future, but I am also trying to prepare for a dcl ( ICL?) in precious Metals, and need to focus on that too. Basically, this is a buy with a stop under recent lows.
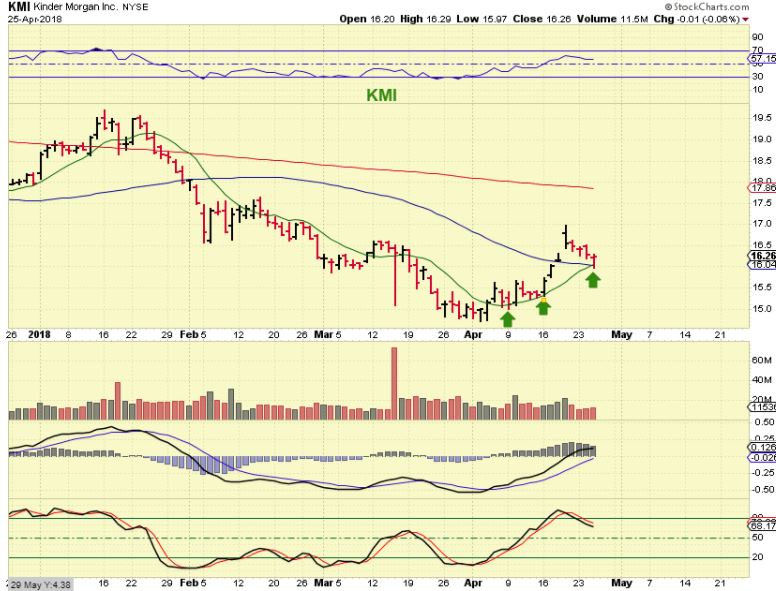
KMI -Kinder Morgan engages in the operation of pipelines and terminals that transport natural gas; gasoline; crude oil; carbon dioxide (CO2) and other products and stores petroleum products chemicals; and handles bulk materials like ethanol, coal, petroleum coke and steel. I would say that yesterdays reversal is a buy on support with a stop under maybe $15.50 – $15.75ish.
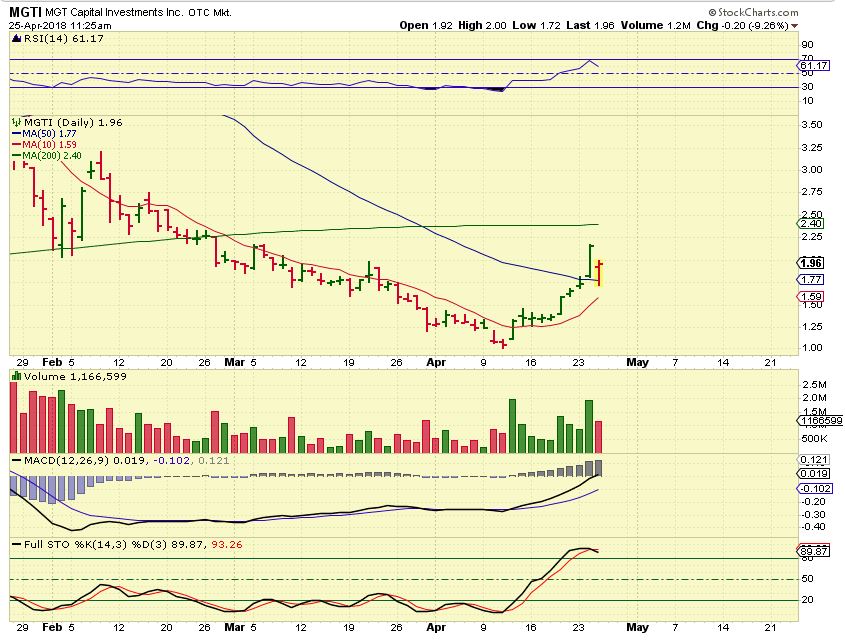
MGTI ( Blockchain) – I own this from the $1.20 area and I know that others do too. It dropped to support & reversed yesterday. It remains healthy, but as I warned, this was about a 20% drop, and closed down 9%. VERY difficult to ride unless you buy low.
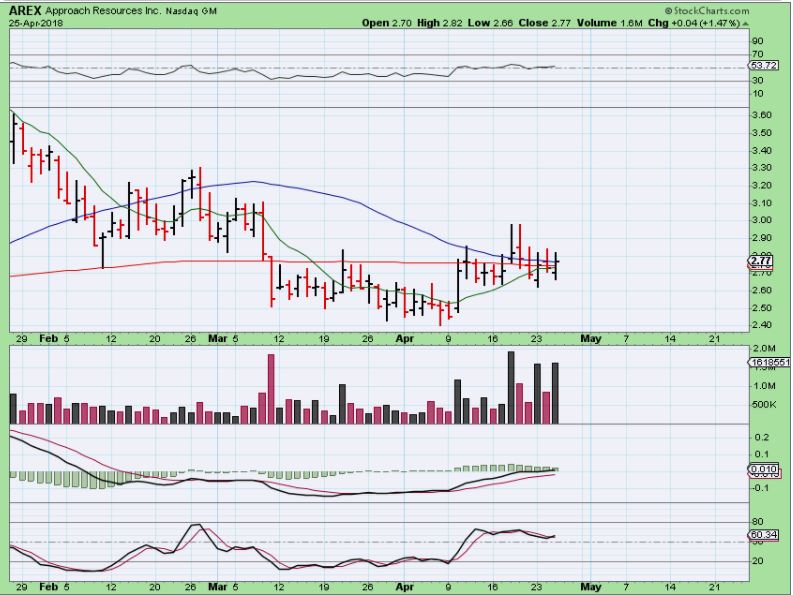
AREX ( Energy)- It continues to sell off and recover with large volume up days. I still own this.
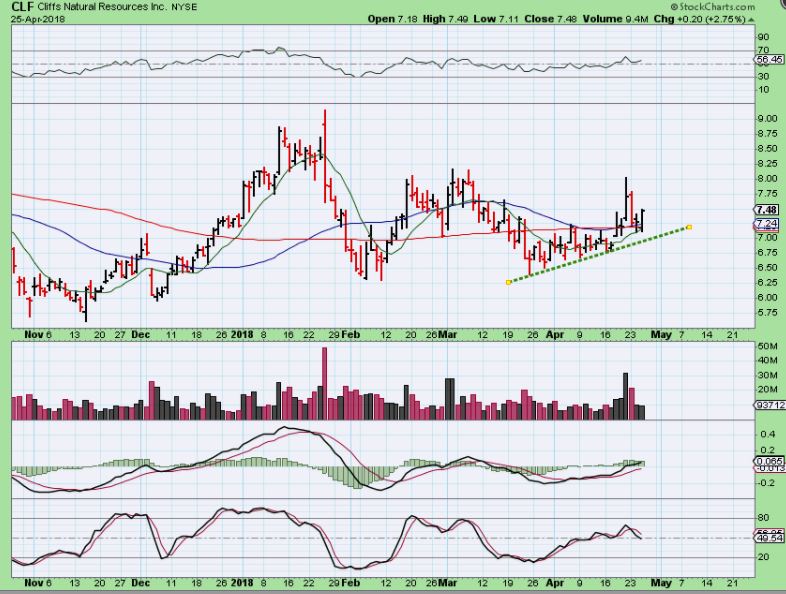
CLF – CLF, AKS, and a few other commodity stocks reversed and did not sell off with the markets yesterday. CLF is above the 50 & 200 sma and looks ready to move higher.
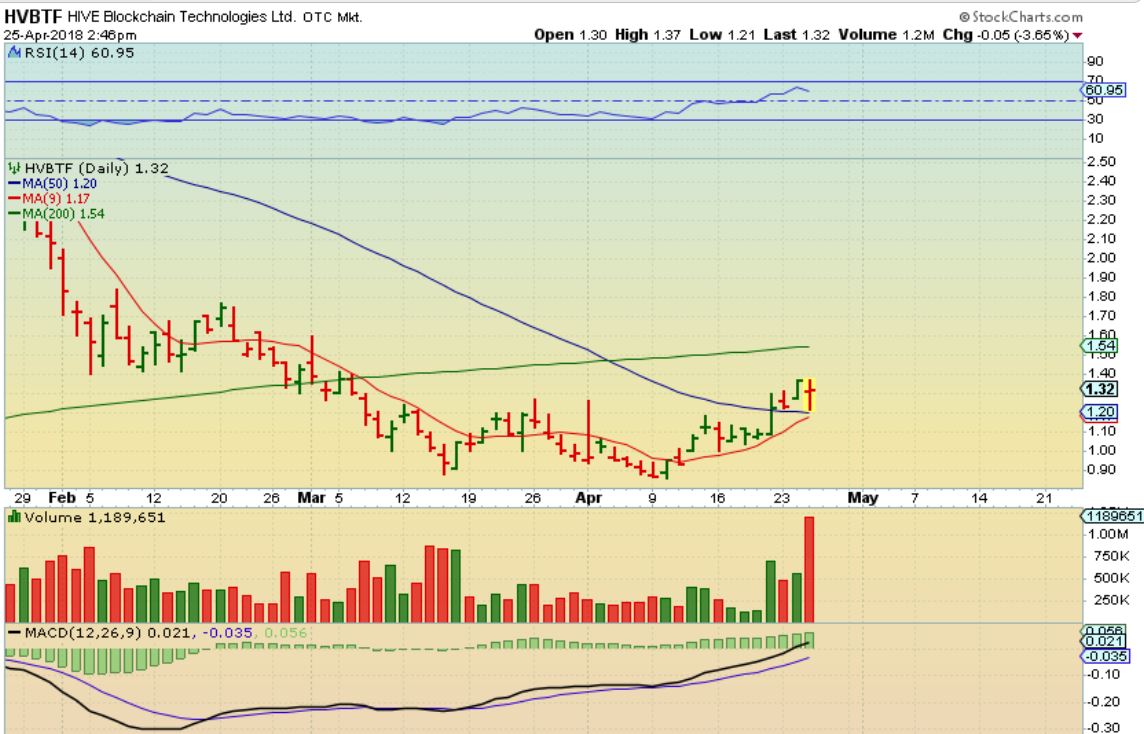
HVBTF ( Blockchain) – From yesterdays report. Laned on support and bounced.
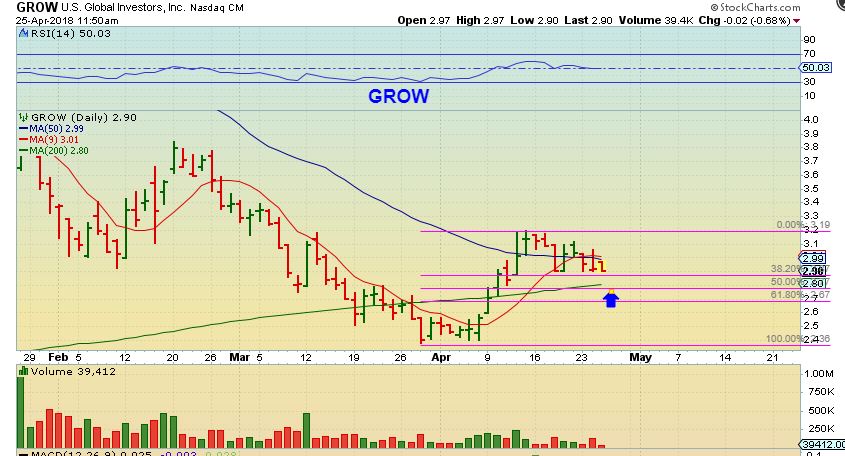
GROW – Could dip to the 50% retrace and the 200sma, but remains healthy looking.
4-25-2018 – Hanging On 
 Fridays Assortment
Scroll to top
CF, given the strength in $energy equities but your expectation of a LT cycle in $oil would you suggest holding off buying now given the run up or do you think they might uncouple here for awhile? Thx for amazing reports as usual!!
I bought AREX, and mentioned that in a recent report.
Oils daily cycles can be 50 days long, that is almost 3 months of trading. To be L.T. it would top by day 25, that is 6 weeks out of the lows. If it is to be a 30 day daily cycle, it needs to top by day 15, 3 weeks out of the lows.
I showed the XLE and my expectation of that being a mid point move.
I showed OIL as possibly getting to the $70 area .
lately cycles for gold and pm stocks have been unclear. do you think sometime soon they are going to get back in sinc?
I dont know how to answer this
yes, I understand that
I tried 3 times, but it was a lengthy history lesson each time, so I gave up. -lol
The answer is basically MAYBE.
In 2016, the ICLs were 1 month apart in DEC for GOLD/ Jan for Miners.
Their ICLS matched up later in May
I am hoping that BITCOIN breaks higher today after the drop & pause that looked like it formed an inverse H&S.
If Bitcoin rise, say to $9100 or so, it may drag up the block chain trades again, since some reversed off of support
refresh
https://uploads.disquscdn.com/images/11353c7723ca0b0eb0ac62dfd7a89be1d78081d4114c6ad6538abc4c7419a7f9.jpg
Would like to see some late morning weakness to add to my SILJ position. Other than that, I don´t think there will be much to be done in my accounts today.
Does anyone understand what CASA is doing?
They announced a public offering, with current share holders selling their stock to buyers at $25,
AND CASA will not receive any of the proceeds from the sale of shares by the selling stockholders.
I’m not sure that I understand the point, if it is not to raise cash & pay down debt. Has anyone seen this before? I think this is a first for me.
And they did this before earnings? knowing that it would trip the price? so does that mean the report is expected to be bad? It sounds like the shareholders decided the best course of action was to fleece the lambs. I saw the huge debt sitting there and kick myself for ignoring it. I wonder if the SEC will go after them.
I dont know that there is anything wrong with what they are doing ( illegal), but I dont understand the benefit gained by those selling at $25. And the Company doesn’t reap he money either.
All of the shares are being offered by certain stockholders of the company.
Sounds like its from insiders, board members etc. So the company may not profit, but the insiders will. It may dilute the stock pool if these shares were not originally considered part of the “common” shares.
It looks like the total sale of shares could equal about 10% of the total shares. If you sell 10% of the outstanding shares at $25, then the price is probably just adjusting to meet that number. BTW, 35% of the shares are held by insiders.
https://finance.yahoo.com/quote/CASA/key-statistics?p=CASA
That WAS a good buy opportunity on the back test for CDE yesterday.
Nice buying coming in today after that back test on support
https://uploads.disquscdn.com/images/3e40814ffc51418a67a4a379856490c02592472eab8d9d2a232b9afc3840b8a4.jpg
I did end up adding to CDE
they reported yesterday
Glad they didn’t disappoint, I’ve been holding a decent chunk
Sold CVSI in one account on that pop this morning, still holding some in another account….really want this one long term, but…
Nice trade Tammie, and I also think that some can be traded while some can be buy & hold.
It is an excellent chart, one of the better ones, because the recent sell off in MJ stocks caused many to drop down a lot into a long rounding bottom type low.
CVSI dropped and went sideways and formed more of a cup & handle. ( Pan / handle) in Jan to April. You may have sold near the top of a measured move and if it pulls back, I will be buying it again too ( I sold mine early)
Refresh
https://uploads.disquscdn.com/images/635dbcf851c428dba79882a2cf9400b8e545ad5589adf25a89c442f1fe8a4b94.jpg
Thanks! Is there any usual length of time for waiting on the handle to form? Like, after a certain amount of time is it negated….or can it just take a few days and be done with the handle? It seems like it might be forming a little flag on the day right here…..
Different time frames produce different patterns and an intraday flag can form & push this higher, a handle doesn’t have to form right her & now.
A normal Cup & Handle on daily charts can take weeks for the cup , and even weeks on a handle, depending on the size of the cup that formed.
CDE and HL nice!!
I thought CDE reported earnings last night, it must have been very good
Whelp not as nice.. the other miners moving up now slowly but surely… HL and CDE seem to want to pull back a bit here
Hey CF
Where do you think a decent target for IPI is on the top side
I dont know what time frame you are discussing, I have had very long term charts in past reports showing it as a recovery stock, but short term, it can probably run to over 6 in future weeks if there is no bad news, public offering, etc – based on a weekly chart
IPI H&S maybe……..daily chart
Good morning, Alex –
I may be seeing what I want to see, but in your first chart of GDX, is it possible that it could be making a cup & handle? Inside another larger cup & handle to come?
Thanks for another great report!
Hi Cal
Refresh
A TRUE TO FORM CUP & HANDLE does not come at lows. The real original definition is that a cup forms as a consolidation after a long run up. This, to me , is still the range bound area, and it just has rounding bottom formations at the lows ( to me).
https://uploads.disquscdn.com/images/275192936d01ecf8ea4702966f34033dcb414e3deff0d90a112ea3ab8fcf32ae.jpg
Thanks, Alex – that helps
LABU looking good on the hourly chart. Taking a chance here.
https://www.tradingview.com/x/eku1ccte/
Check out CF’s CAKE it’s been running like LABU in terms of percentage
Its a tasty stock for sure. Had earnings yesterday and missed. Surprised its up this much after the miss.
I usually eat cheesecake cold from the refrigerator, but They have a chocolate chip swirl cheese cake , that I put in the microwave for 10 seconds and I just LOVE that!
Oh wait- we’re talking about the chart- I love that chart too
lol… go make ur eggs
YES!!!!!!!!!!!!!!!!!!
I thought you lived in the woods?
Yup. ..bought it
Yep. Apologies. Meant short term
Thanks was thinking the same thing
It is down today, but I like the chart shirt & long term.
Definitely no apologies needed-
I just didn’t know what view you were asking
me to look at = )
ACBFF seems like it might be trying to reverse up here…maybe
Sold 1/4 of my AMAT from end of day add yesterday
CAKE is rocking
MNTR HEAR RNN …
wow CRK …
watchn CMCM as well
would it be too much to ask for this pattern to repeat?
meow
https://www.tradingview.com/x/FSsW5jQM/
MEDFF
regarding my CAKE chart- I actually found a bullish sector and wanted to do a whole report about it, but I get so many emails asking me to cover the general markets , and there is only so much time in a day.
look at CAKE, then look at EAT, WEN (wendys) , DIN, JACK, etc etc etc
I wanted to do a report on FOODS &RESTAURANTS , I see a bull running there, even with the recent pull back. I have over 20 stcosk, but check out the ones mentioned above
*GoFigure 😉
Check out CMG.
You’re supposed to tell us about those before they take off 🙂
SHAK too
SHAK, BLMN, EAT, WING, etc etc – all bullish set ups
Yeah, it was on my list. Most know about that one, it was outrageously good for years.
The sector as a whole is bullish
I think Maria does freelancing. Maybe she could help you? #HFT
https://uploads.disquscdn.com/images/223df5e5ab2a790cfe17aa216bc57dea1bd06dd25eeec309e03487a9a518fbb0.png
And the Yankees hate just killed the deal………..Go Sox!
yeah… i just dress up 2bugU
lmao
Hmmm! 🙁
EAT was one I swung months ago! Glad its back. I like this area, not really hit by trade talks
That’s not pretty what’s happening to gold and silver today, or maybe it is
It is pretty
GLD & SLV break below yesterdays lows
GDX/GDXJ stayed green so far. Kind of nice
is FB the cause of this green action?
FB AMD etc…
I don’t know if anyone followed me into Uranium trades a while back, but I am about to dump my DNN.
Just bored with it, and I am holding more positions that I like to hold at any given time lately.
The 1 yr chart is fine, and as a long term hold, the Uranium sector looks good, but I just want to go to cash in a few positions.
I really only like to hold 5-10 stocks. Lately I’ve had almost 15-20
damn… too early for this pattern …?
im really likin it above the 200 day
https://www.tradingview.com/x/jIZTO8Rj/
It could do that with a dcl
I followed you in with UEC, URA and CCJ and only am currently holding CCJ. CCJ has not done anything but is easier to watch in a portfolio than on a watch list.
Tammie your POTN just reported sales in the first qtr 28% greater than the last qtr
Thanks for the heads up, haven’t looked at that this morning yet!…….still sitting on some at a loss so glad maybe now it’ll go up….! Probably might try and average down at some point…will keep an eye on it!
well I got prematurely excited and Added back my HL at 3.93 quite heavy today in the IRA (not the trading acct where I have my initial buy at 3.79) and as soon as I entered, it dropped. What do ya know. Guess they dont always go up as soon as u buy lol
I hate that, need to find a better entry system……..
Yea, hate entering something an instantly being down 200$ lol oh well.
Guess I shoulda drawn my fibs again for entry. 3.79 was decent for the last one, but .93 not so bueno… oh well!
Maybe Alex will give us a good system to time the entry?
I think Im ok with out that, my 3.79 entry was off the 50% fib.. And a great spot.. But i jsut got excited today and added thinking we were breaking out… Was up 300$ after the add. Went to make coffee and eggs and then came back down 200 lol
Trouble with FiBo is there are so many likely points. 61.8% and 38.2% are probably more likely than 50%
True, but when at the 50 I added… But you are def correct. Im just kicking myself for not adding it in the other acct that had a lower avg. Id still be nicely green.. Instead i get to the ride the red river for a while
Lol……….
AG, IAG AUY etc… offered lower risk adds today. Again I got prematurely happy and added HL agin thinking we were going to break out. up 300 down 200.. Its the IRA so Im ok holding for a bit. Def wont let this drop to 300+ tho…
Anyone have any opinions on natural gas? I bought some BOIL on Friday and it’s up a little, but doesn’t seem like a “run,” per se. Trying to decide to sell here or if it looks good to hold.
The daily chart looks of NATGAS looks good to me. I would bet it kisses the upper trend line, see below link. “Bort”
https://www.tradingview.com/x/vteW2MU5/
Ah, thanks for the chart Bill. Happy Friday. *bort!*
I checked out the chart of BOIL, actually looks good
#TodayIsOnlyThursday Bort! 🙂
Looking ahead! “Bort!”
Happy Saturday , Bill.
And to you! I will be golfing and drinking Tree House, so yes! It will be……..
Nice!
If I don’t start getting more stock returns I might have to change to Pabst!
And Mini-Golf
Opened a FB put… looking for this gap to fill.
Will be a week or two hold max. (Or a day if best case worked out.)
Can’t help it. Greed.
July timeframe
AQMS, bot a starter https://uploads.disquscdn.com/images/39fca03534668b9e13cd7d757b913b0faf078ba9a2567ac4c2361e50a9f57781.png
AAOI nice flag on daily
SSC- Bounced off of the 50sma, trying to regain the 200sma. I still own this from weeks ago, tempted to add.
MARA still holding up too.
ALSO that XNET still holding up.
I am tempted to add, because the gains in these are so good. Maybe I need to go back outside & enjoy the spring weather?
Refresh = 2 charts
https://uploads.disquscdn.com/images/08527656c80a27acca8232095bc93f43787c094dfa182dcbc19fb21b16b43202.jpg
https://uploads.disquscdn.com/images/c06678cb7bdd354d3e2eb7142e9fc5ae1b2c9eefb51fbd156fdb674a9dc08d96.jpg
SSC just pushed a bit higher, now back above the 200sma too. IF it closes above the 10sma, I might have to add to my current position
Are you still in MGTI? Low volume today.
Yes, and MGTI is holding above the 50sma
Thanks for the observation.
Uh Oh, I sold my DNN , and that was fine, but URG & UEC just threw in some nice reversals. Usually they lead the way .
Thoughts on NAK. I cut my exposure in half and will just ride it for now.
DNJR just took off like a rocket ship – I dont see any news, but wow
Boy that was the kiss of death.
Crazy move
I’m still trading the “boring” stock index ETF’s. Bot some TQQQ and TNA this morning to play the bounce. TNA is lagging today but it has been leading over the past few weeks/months. May only hold these positions a few days and have a tight stop. Going fairly light (by my standards) and saving cash to buy miners when the time is right, hopefully around Fed day next week.
Good trading to all!
https://uploads.disquscdn.com/images/62f10070b31660f63d249310492226b42085af9bcb4c1e4e03e35a12e1b2c849.gif
I’m in them both too. The only way to get a feel for these is to actually trade them. JNUG is sure tempting me but it would be nice to get a shake out first.
You just don’t know. This could be a short time bounce, it could be a resumption of the uptrend. I like TQQQ I don’t consider steady gains boring…….Good luck Captain Nugt!
Based on my cycle counts, we probably just had a 1/2 cycle low. This is around day 17, unless its a LT cycle, we should move steadily higher. Having said that, I am still mostly cash! #chicken
https://www.tradingview.com/x/cQGhOuUy/
That 1/2 cycle move probably took a lot of the weak hands out (me) but the market is pretty crazy so I pared down the number of positions just so I can react quicker.
Yep. I just sold right at another low. AGAIN!
well youre ripping after hours now!
Yeah, I had a feeling AMZN earnings would come in well.
Now CE has a pop and reversal all in 1 day.
‘Sell the news’
SSC continues its move higher today, now up 12%
I keep jinxing them…no more play by play 🙂
Guess they are not happy with NGD’s numbers. Momma told me there would be days like this! AG and AUY softening the blow.
AMZN & INTC up nicely earnings beat
AMZN new highs
Fridays report has been released