As mentioned in many of the 2018 reports, and especially in the weekend report delivered 2 weeks ago, we are seeing many changes slowly taking place in the markets. Today we will do our very important Big Picture Review, and along the way , I will discuss what I am seeing.
SPX DAILY – So far we still have our low on day 34. The SPX is going on day 10, and we are awaiting an upside break out.

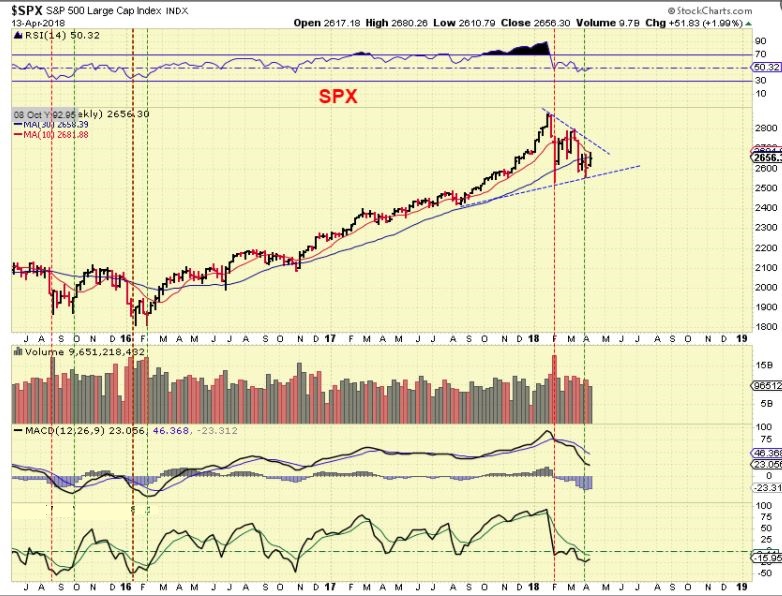
So the daily chart for SPX is bullish, but the weekly charts gives us clues about the longer term action that we should expect. Keep in mind that it is normal for Long Term ideas to morph or change along the way as time & price begin to reveal future strength or weakness.
SPX WEEKLY– I do see a indications of a weaker market, but if this breaks higher ( as expected) it is best to wait and see how things look then. Currently I am expecting a break higher out of a day 34 daily cycle low, so I am positioned on the long side.
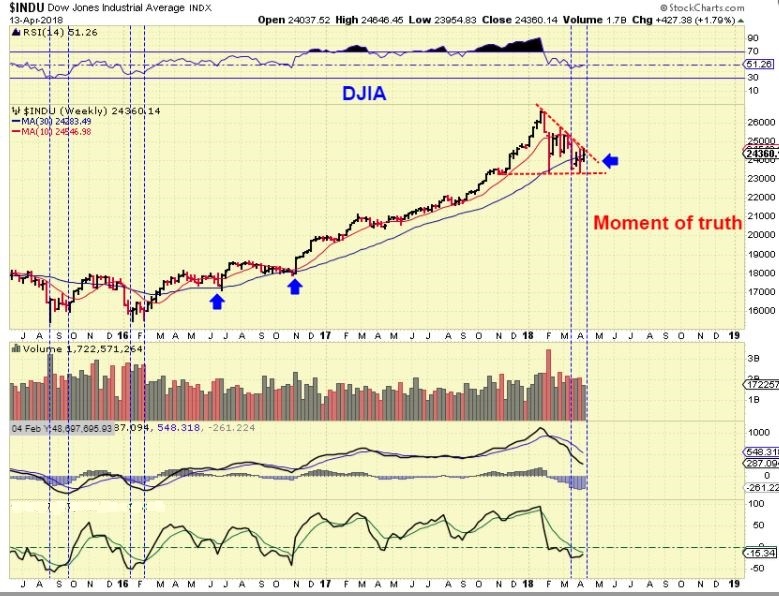
DJIA – The moment of truth is the apex, and markets usually break before they reach the apex of a triangle. On this chart, I do also see signs of weakness at the double bottom lows. We will monitor it as time goes on. I do still expect a break out.
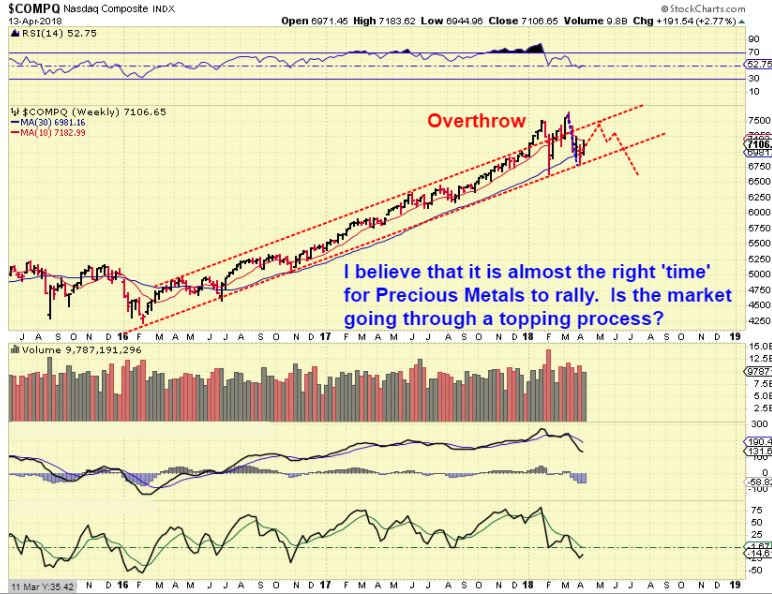
NASDAQ – We broke out of this channel, and then back inside. Though I expect a rally in the short term, I have mentioned that this is starting to resemble a topping process ( OR JUST AN EXTENDED CONSOLIDATION SIDEWAYS). Please read the chart and I will post a LINK at the end of this report for you to consider later.
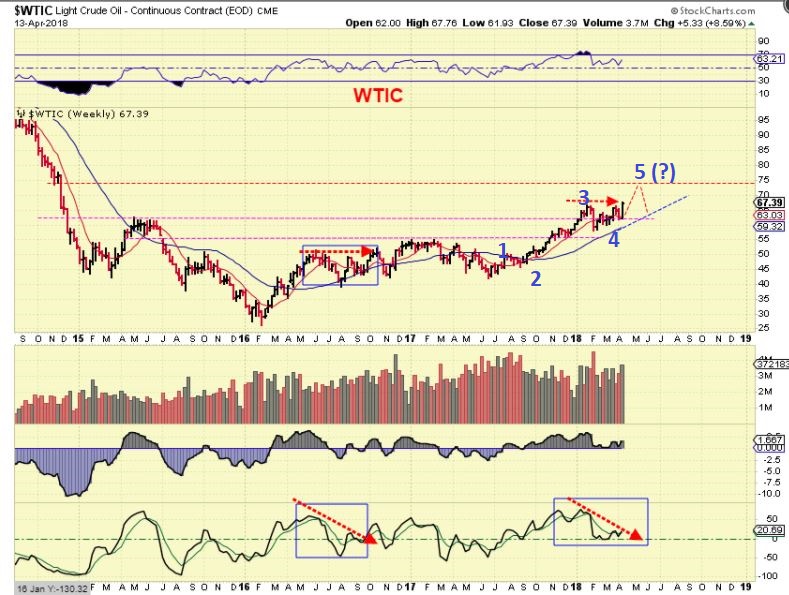
WTIC WEEKLY – Oil is breaking higher after breaking from this long multi-year base. I do see strong divergence, so I am thinking that it will pull back after this 5th wave completes what is probably wave 1 of 3. Inflation?
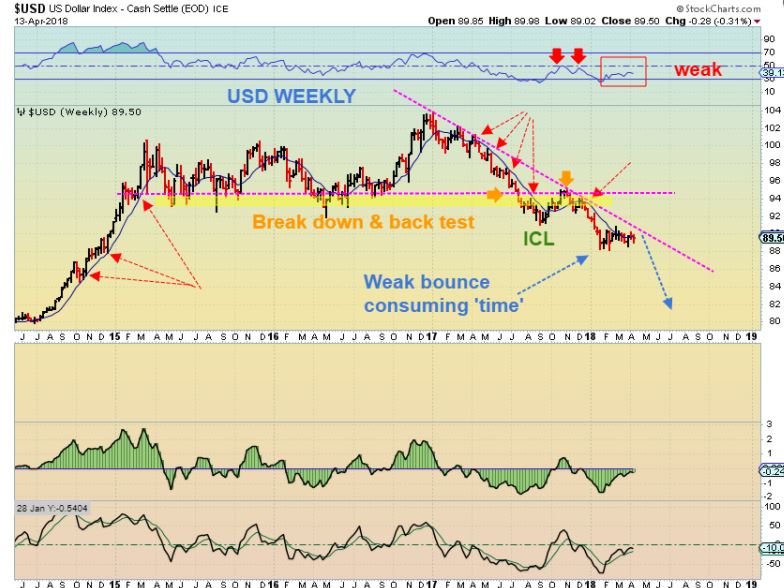
USD – The USD is weak, and the daily cycle already sems to have formed a swing high, closing below the 10sma. The Big Picture break down that occurred in mid-2017 should eventually lead it back to the lows. Gold should rally. (Inflationary?).
PRECIOUS METALS
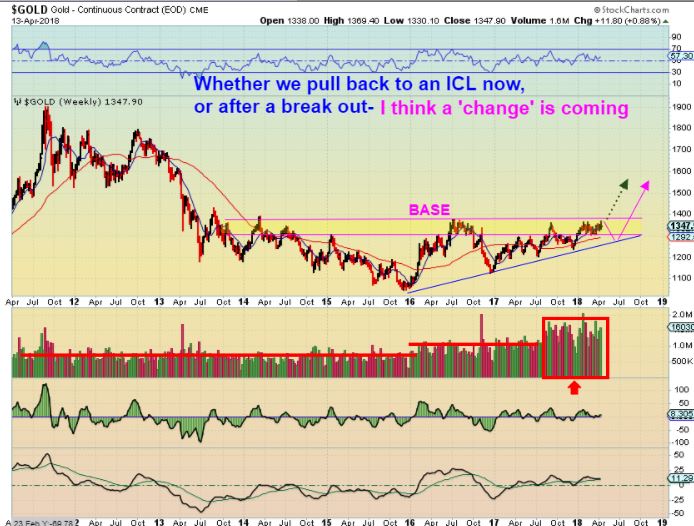
GOLD #1 – Gold has been Bullishly climbing out of the lows of a Giant Base. ICL after ICL has now been a higher low. I believe that we are going to break out soon, and that 2018 will be an exceptional year to be invested in this sector.
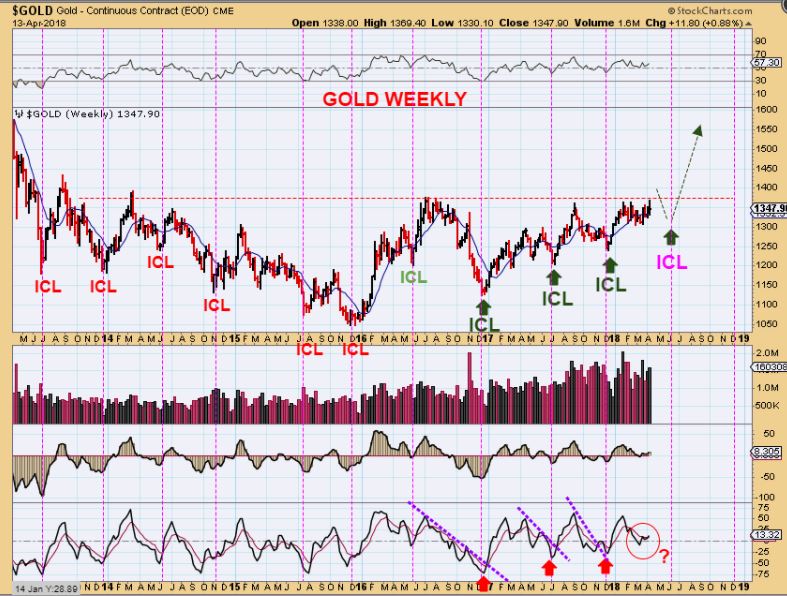
GOLD #2 – Cycles have a deeper dip or an ICL ( intermediate Cycle Low) that come roughly at even intervals. The last one was in Dec, so the next one should come in roughly May or June. The big question becomes will GOLD dip into the FOMC meeting, like I originally was thinking? Maybe an ICL in Mays FOMC Mtg? See the chart, Or…
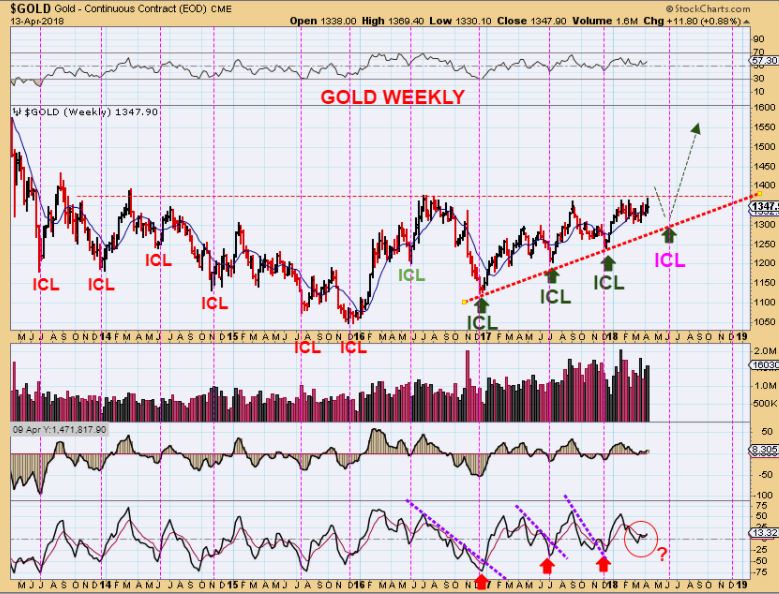
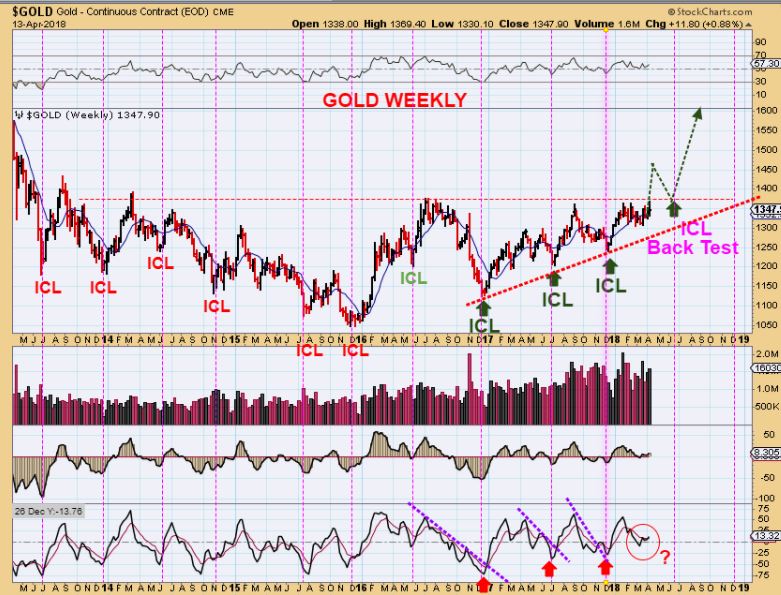
GOLD #3 – Is gold about to break out and the ICL comes later as a back test, as shown here? I have to wonder, because many Miners have begun to Pop. I still lean toward a pull back & ICL before a major break out & run higher, but things are changing to bullish rapidly. Only time will tell.
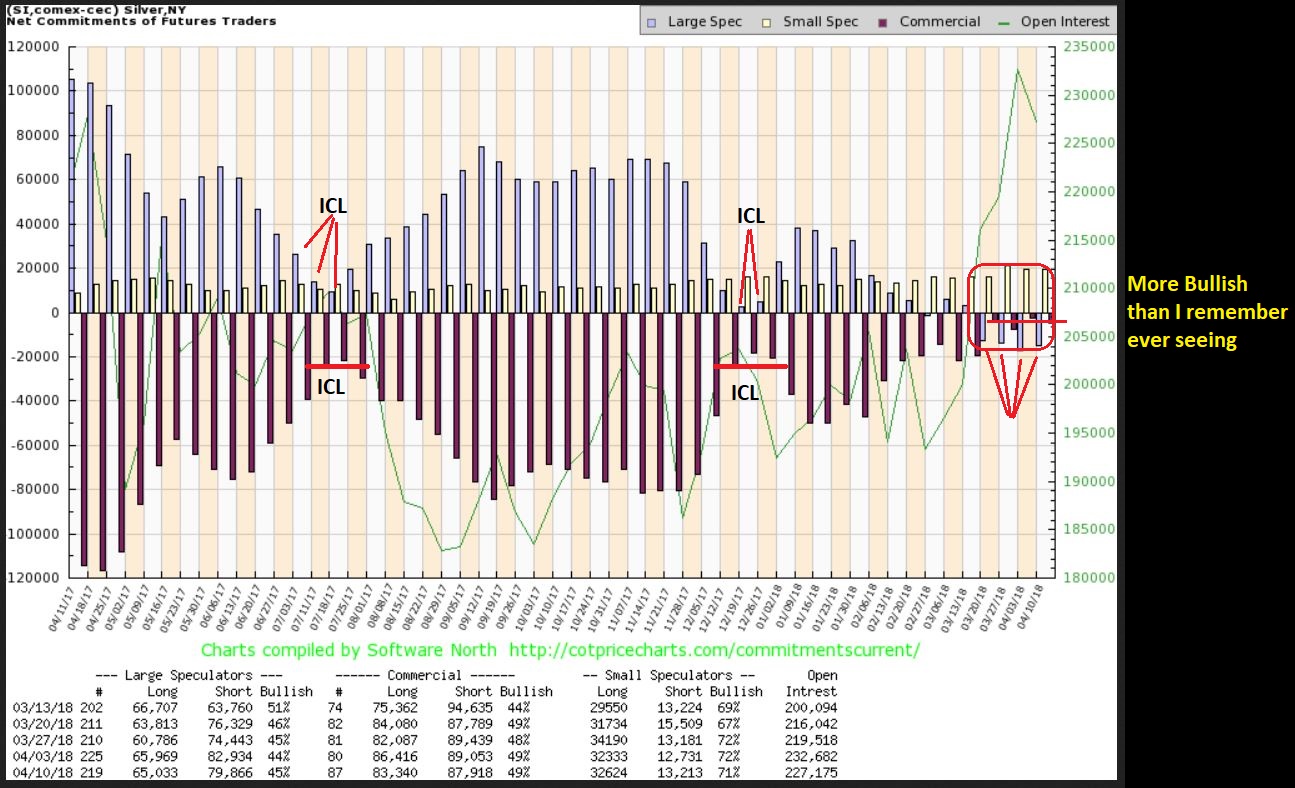
COT SILVER -This COT remains very Bullish for Silver.
SILVER#1 – The weekly chart , if drawn this way, would also have time for an ICL in Gold in May or June.
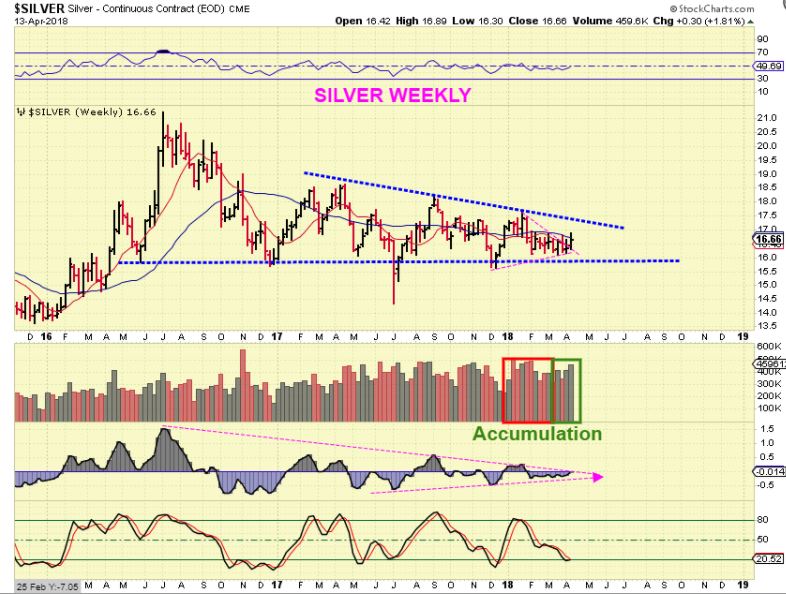
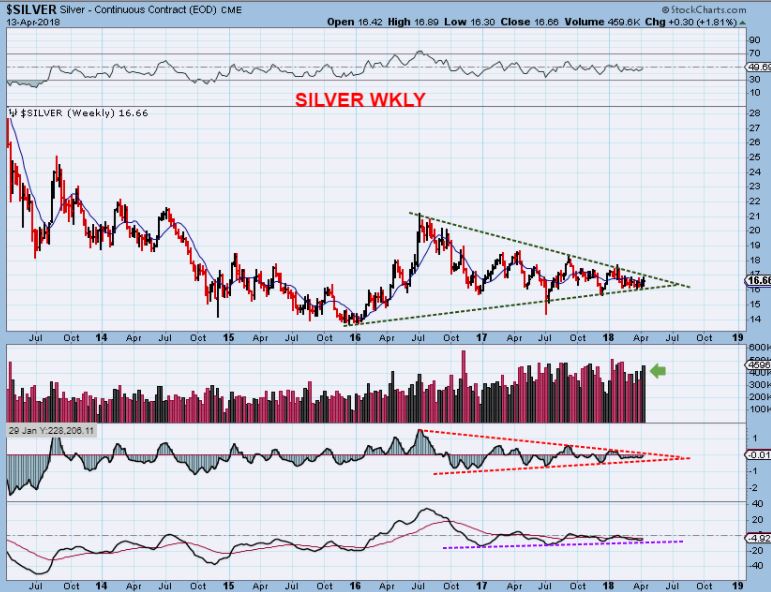
SILVER #2– Drawn this way, we are almost at the APEX and Silver would break out one way or the other very soon. My indicators have become ‘pinched’ bullishly. Look at the Volume on that small push higher- That looks ready to break out.
As mentioned 2 weeks ago, Silver miners began to ‘set up’ properly, and now Silver Miners have begun to lead the way. I mentioned that I bought FSM, CDE, EXK ( EXK was just for a trade), and AG is looking good now too. We will look at a few at the end of the report.
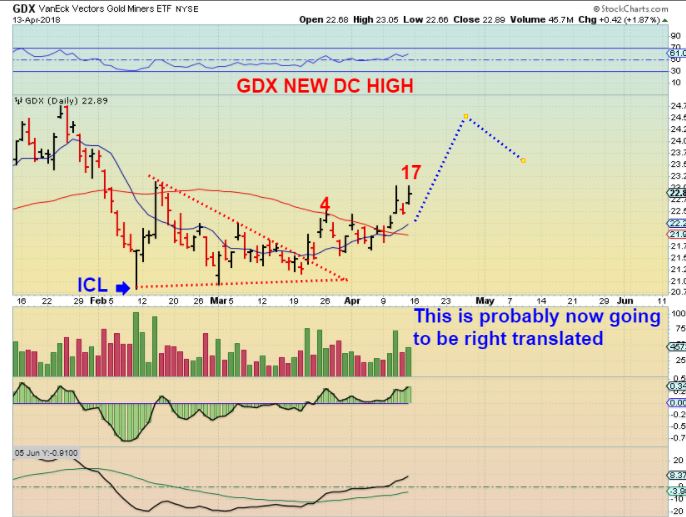
GDX DAILY – I wanted to throw in the daily chart,, because it turned very bullish recently
1. I mentioned that possibly Miners put in an ICL in FEB ( Then it formed a triangle).
2. A break from the triangle starts the daily cycle count, and we just saw a peak on day 17- This should be Right Translated, and can continue higher. I drew it this way.
3. Miners now look very bullish after an ICL in Feb to me. I played JNUG & bought Miners coming out of the Triangle lows, but I sold JNUG in the next sideways move. ( Look close, that sideways move from day 4 forward is a small bullish triangle too).
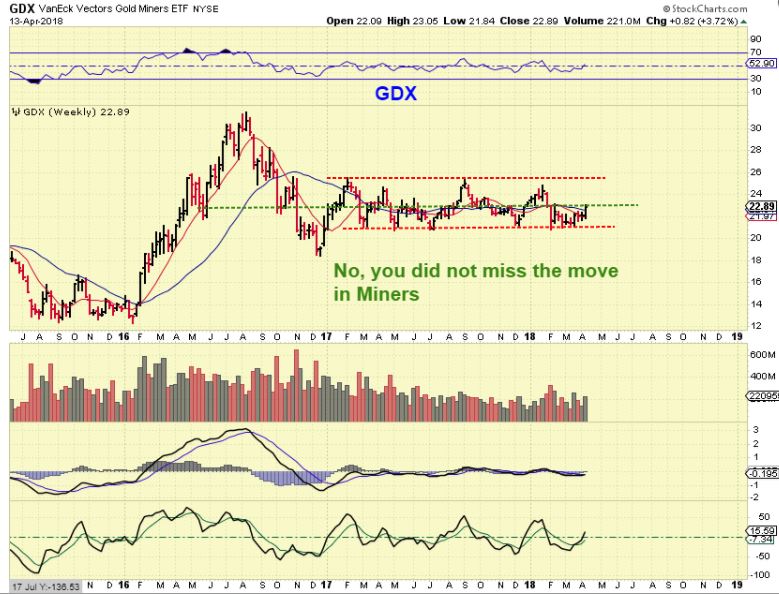
The email Question: ” I didn’t buy Miners when you did. Did I miss the move in Miners?”
GDX #1 – The answer is , ” Not at all.” This has a LOT further to run when the ‘time’ is right. We are only 1/2 way into the consolidation zone. As seen on this chart, last weeks move was really just a was a minor miner move. 🙂 From here, My thinking leans bullishly, let me show you why.
GDX #2 – Can Miners continue higher, running back to the highs, and then dip before breaking out in a Big Way? Absolutely, it could look like this. 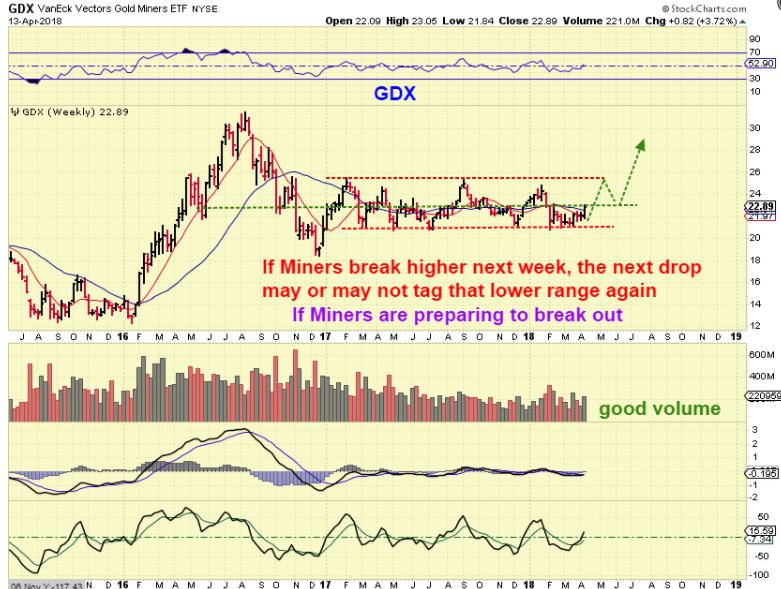
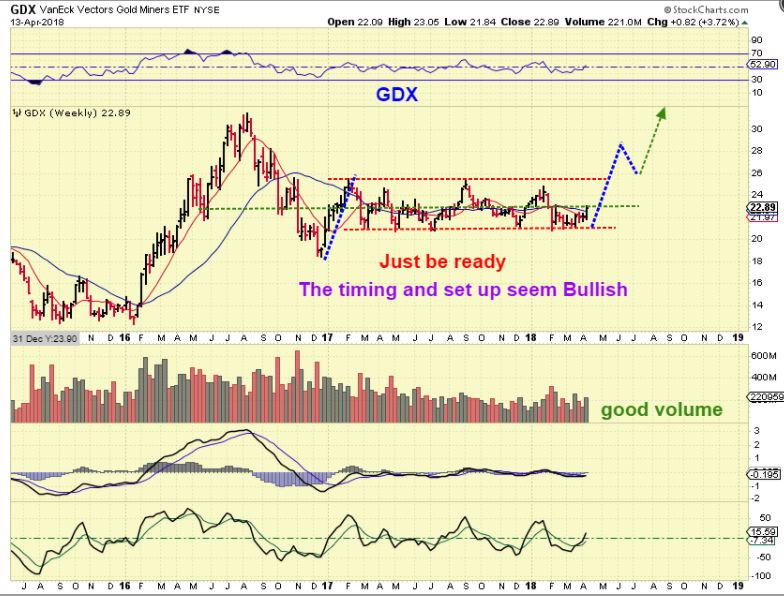
GDX #3 – It also could be the start of a major move higher, so I think that it is a good idea to at least own a couple of Miners, just in case this scenario did play out. I like Silver Miners, since Silver looks pretty explosive.
I have mentioned in past reports that I actually bought some Silver Miners, because I like Silvers set up very much. I bought TRX, FSM, AXU, CDE, for now.
MINERS – It even gets better
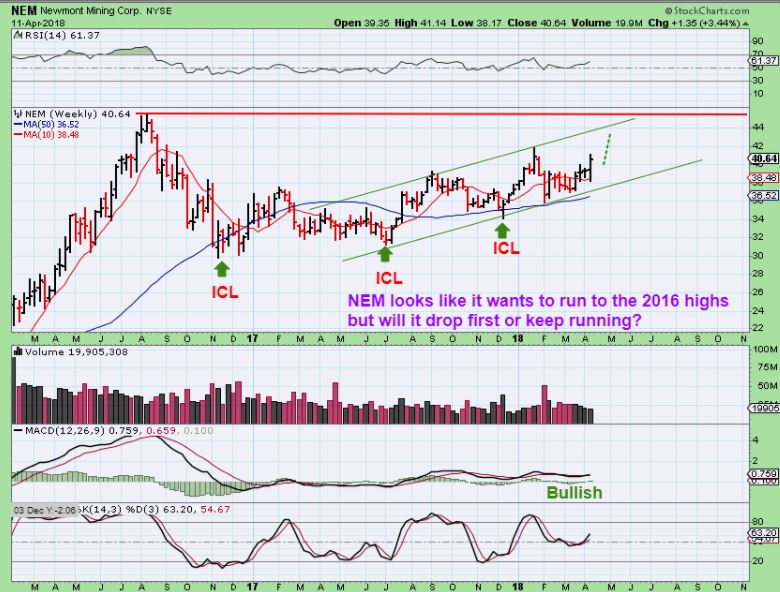
REVIEW: Among other stocks, last week I also stated that I’m watching NEM, as a Gold Stock leader. It is a bit of a slow mover, but it is acting correctly, so let’s take a look again.
This chart was from March 27 and was a break out & back test. It ran from $37 to $39
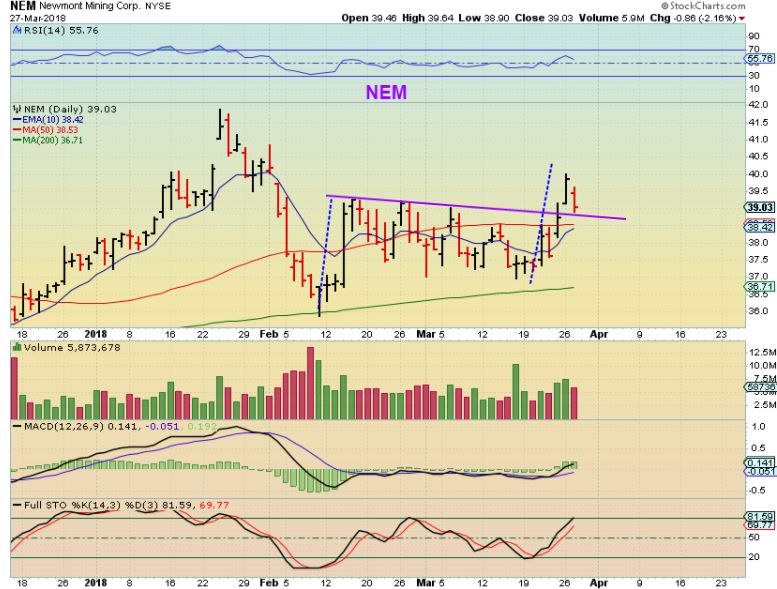
April 11- I used this in the weekly report last week to show how NEM is putting in higher lows at each ICL. That means we do have leaders leading the way, even though GDX & GDXJ have gone sideways. THIS is telling me that when GDX breaks out from that sideways move, IT SHOULD BE UPSIDE. The question last week was “it looks like it wants to run to the highs near $45, will it?”
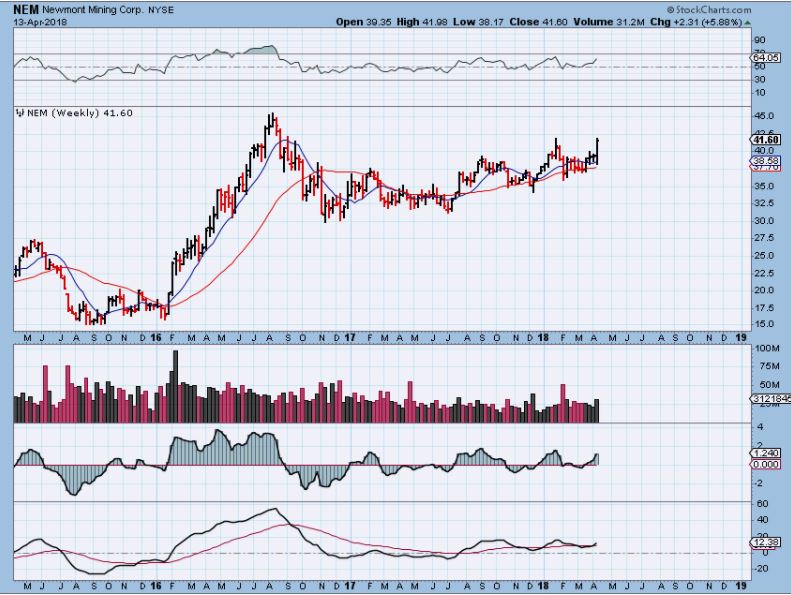
NEM WEEKLY – $41.60 and the ‘cup’ formation looks excellent. Downside risk looks small compared to the potential upside.
The THEME PICTURE indicates that I’ve been taking note of some CHANGES this week. In past Weekend reports I mentioned that I’d be looking for the possibility that THE GENERAL MARKETS may have started topping ( Or beginning to consolidate for a while), and if so, I am thinking that the Miners would start seeing money flow into them. I have been saying all along that I think 2018 will be a year of strong gains for the Miners. Let’s look for evidence of a change, and be ready to benefit from what we see.

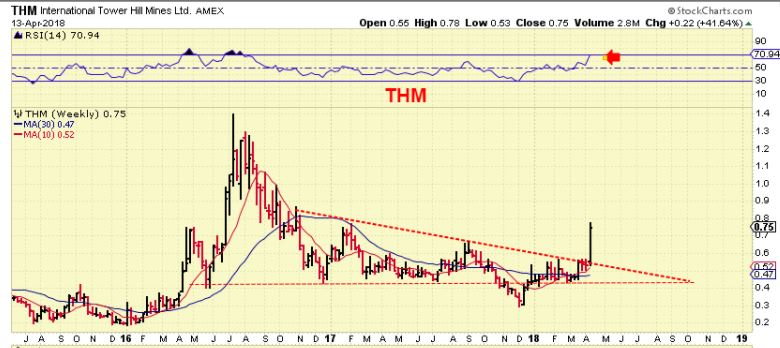
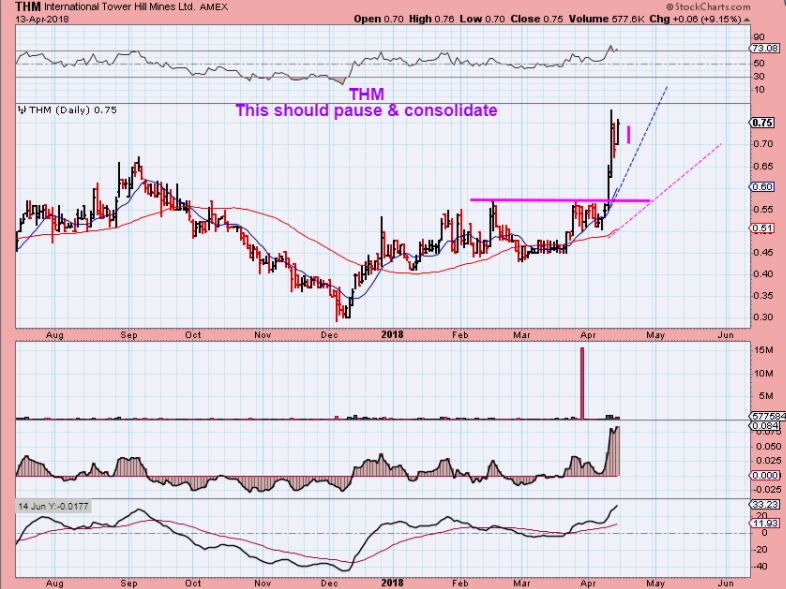
THM – Here’s a big change! We are looking at a weekly chart of THM, and a 42% pop this week alone. These bases are going to be explosive, and THM already did a shake out at the DEC ICL. This is obviously VERY ENCOURAGING for those that believe in the upside that I have been pointing out for Miners in 2018.
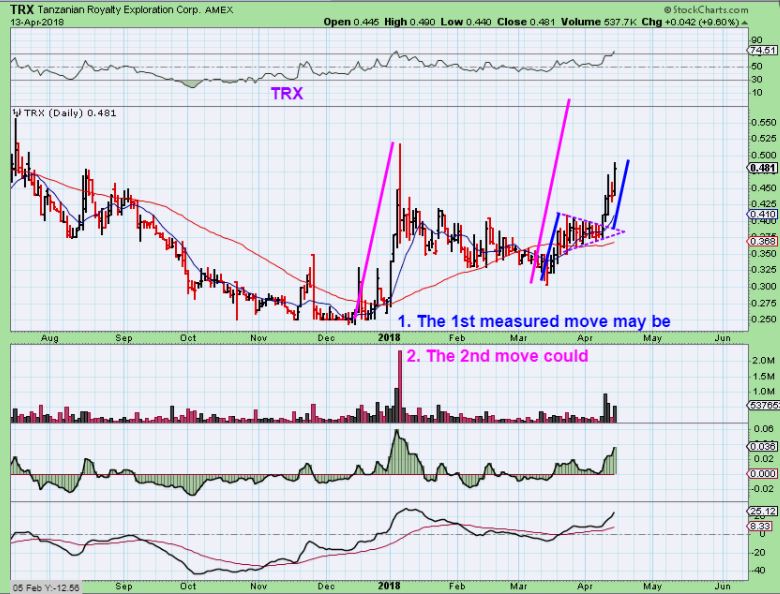
TRX – Here is another change. I own a good amount of TRX, and had a nice surprise gain of 26.5%. These bases are starting to burst higher. Look at the potential here too. Is it too late to buy? Not for the Long term, but…
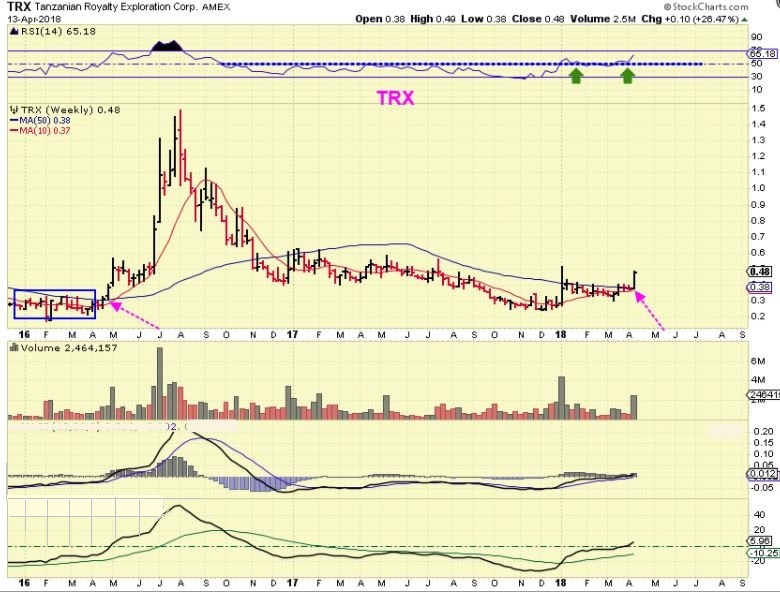
TRX DAILY – It is not considered a ‘safe’ or ‘low-risk entry’ when price gets extended above a base, because they can pull back sharply too. When the measured move is done, I always look for a ‘bull flag’ or other form of consolidation to the 10sma to add. TRX has 2 ‘measured moves’ and the blue one is complete. It could extend to the Magenta top.
THM– They DO pause along the way, and there will be pull backs. It becomes a ‘Buy the dip’ situation.
BACK TO A POSSIBLE CHANGE TAKING PLACE IN MINERS
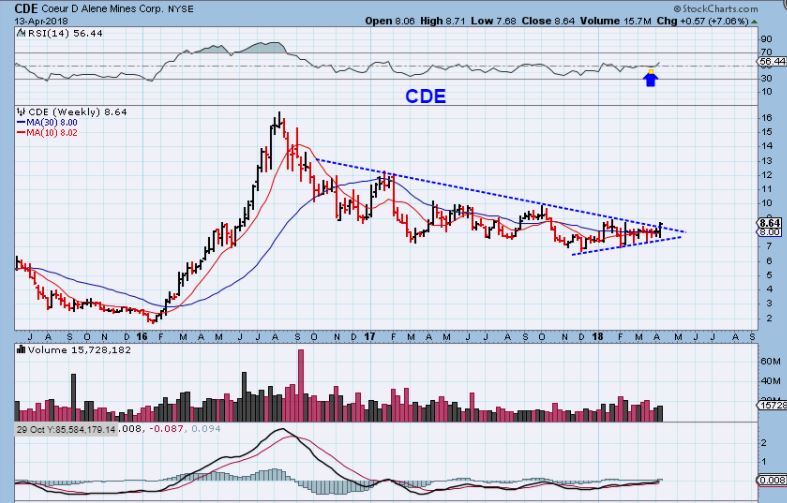
CDE WEEKLY– Is this a small sign of a coming change in CDE? Did it start to break out this week? It is close to a break out and it is rising from a thick congestion area. Those can build a lot of energy for the push higher. I wont sell this unless it breaks below the apex, and was mentioned as a low risk buy. It still is a low risk but if you use a stop.
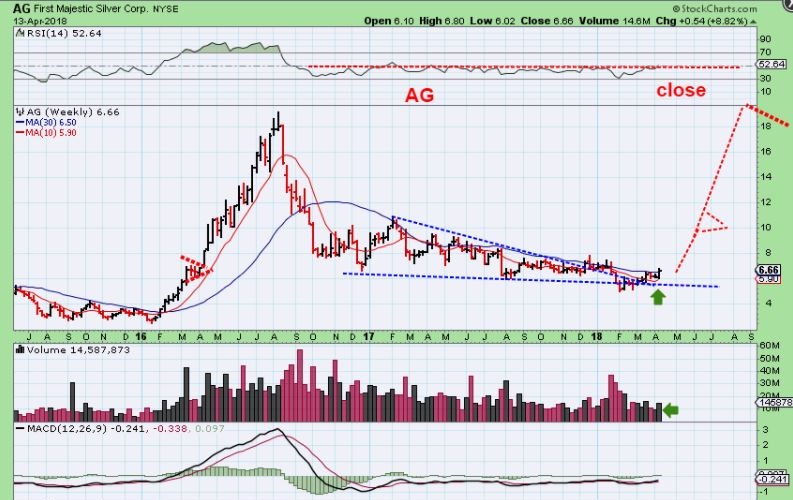
AG WEEKLY (Silver) – This is a very explosive set up after boring & frustrating people for over a year too. This also may be ready to break out, and that may have been the final ‘shake out lows’ on that Feb drop (an ICL for AG) that miners experienced.
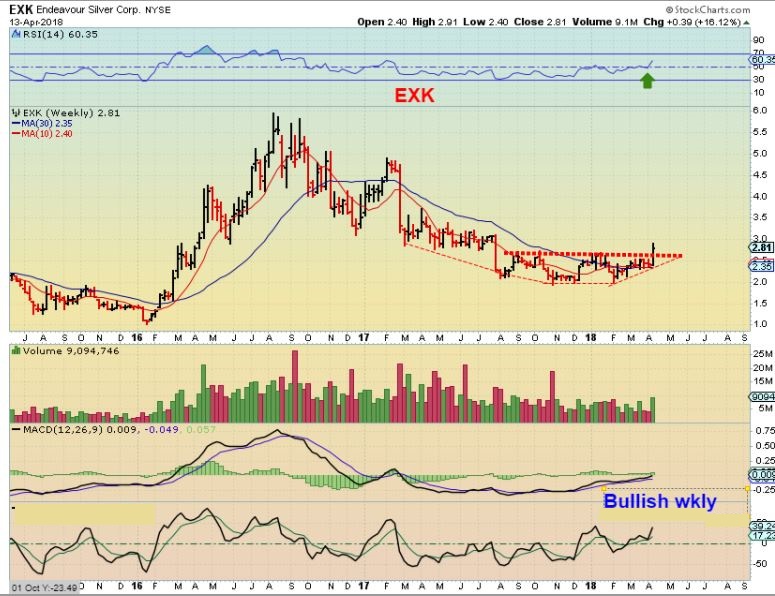
EXK WEEKLY – EXK was basically going sideways for the past 2 ICLs. CHANGE? It is now breaking out and is a Silver Miner that put in 16% gains this week. We ARE seeing a change taking place with some of these Miners. A Bullish break out of their bases could indicate that some Silver Miners are starting to lead the way for Silver.
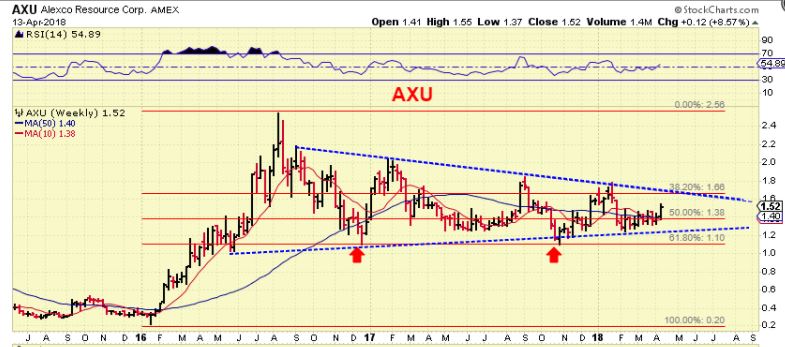
AXU – AXU was up almost 10% this week, as another Silver stock that has a solid consolidation. This ran well in 2016, from $0,20 to $2.50 an that is about 1200%! Sometimes the beaten down penny stock is the REAL Winner. I can tell you that NEM will not run 1200% 🙂 AXU has NOT dropped below $1.00 again.
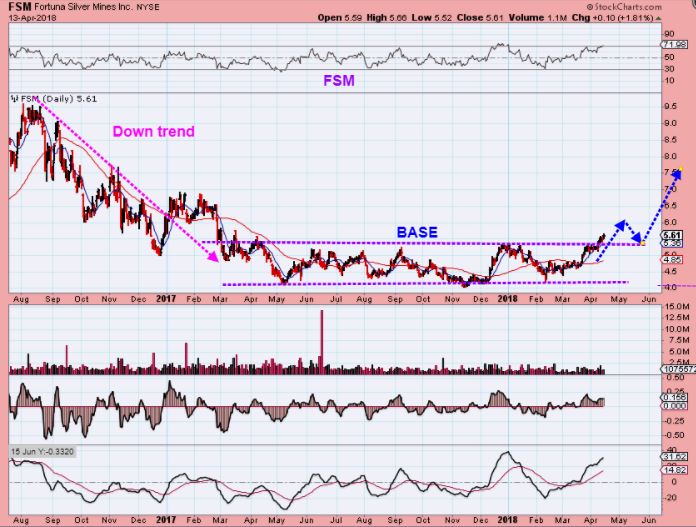
FSM DAILY – FSM is just starting to break out. This also looks like it may be ready to change from a BASE to an UPTREND. Will it back test the base break out? They don’t always, but this one may, because …
FSM DAILY – When I zoom in, it could be a Cup & Handle back test too. I own it and I will be adding if it does.
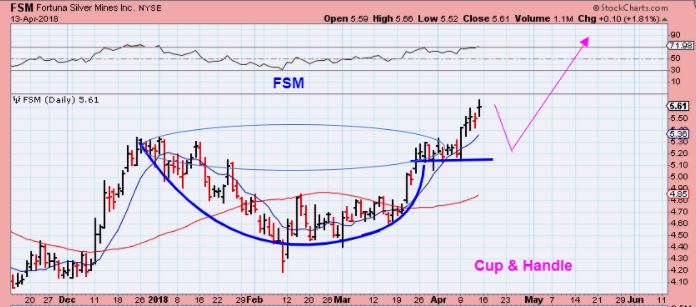
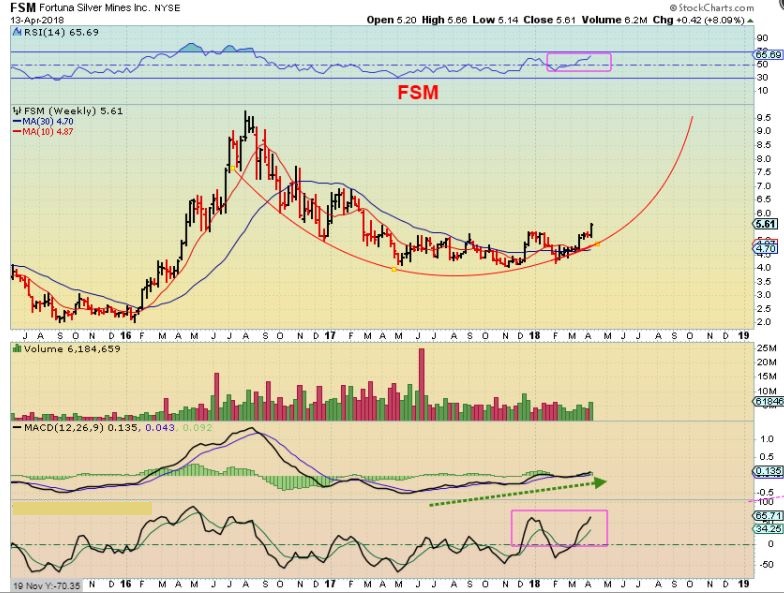
FSM WEEKLY– And the bigger weekly cup & handle potential is inviting too. You have not ‘missed the move’ in FSM either.
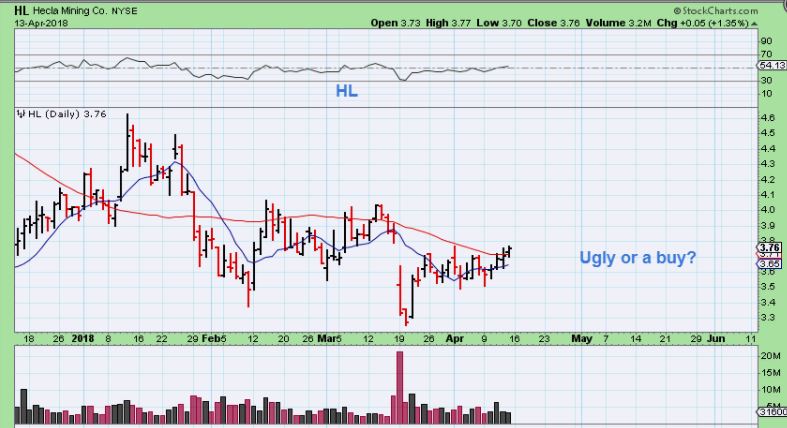
HL #1 – HL has not been doing very much, but was that a slam down final capitulation low? It is still lingering at the lows, so
1. Is it ugly? Or
2. Is it an opportunity that may also enjoy some bullish change soon?
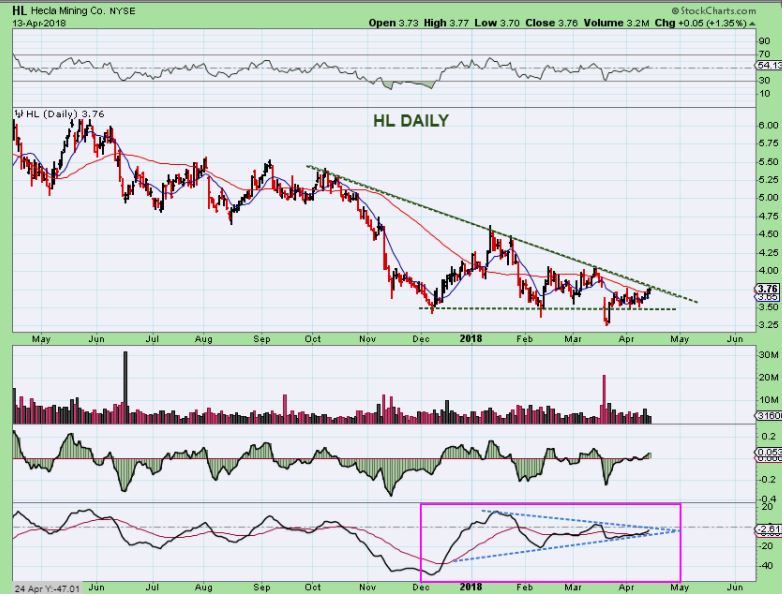
HL#2 – It might actually be ready to break out. A break out is a ‘BUY’ and it could happen any day. That DOES look like a ‘shake out’ low. My lower indicator is pointing out bullishness in this otherwise tired looking stock.
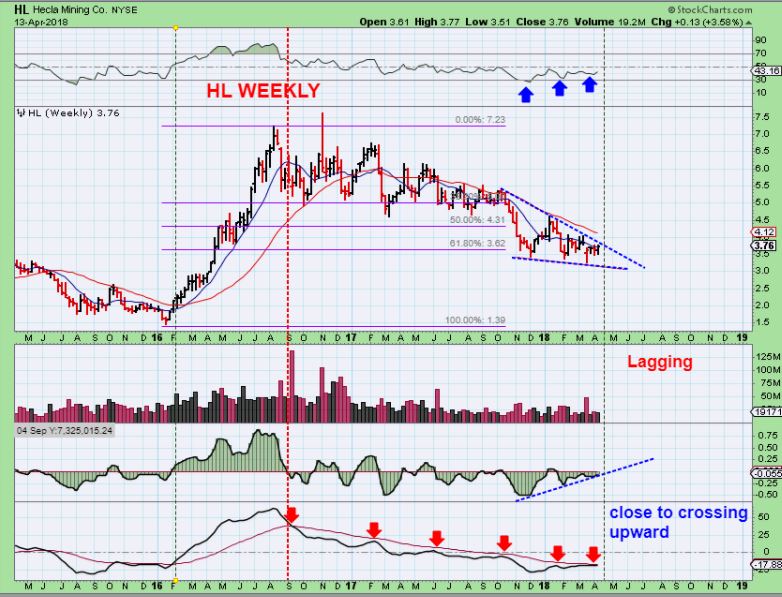
HL Weekly #3 – The BIG picture from 2016 is simply a 61.8 Fib retrace with a descending wedge likely finishing up the job. Again, a break out would be a good low risk buy.
I traded Miners exclusively as they were coming out of the lows of 2008, and also many of you were here as they rallied sharply out of the lows of 2016. Many of my ( our) trades were gaining 100% – 700%. The timing of catching stocks right before they move higher and riding them out is thrilling, rewarding, and I believe that it is coming to all of our trading accounts in the near future. This is my favorite sector to trade when it gets running!
LAST BUT NOT LEAST – MORE CHANGE
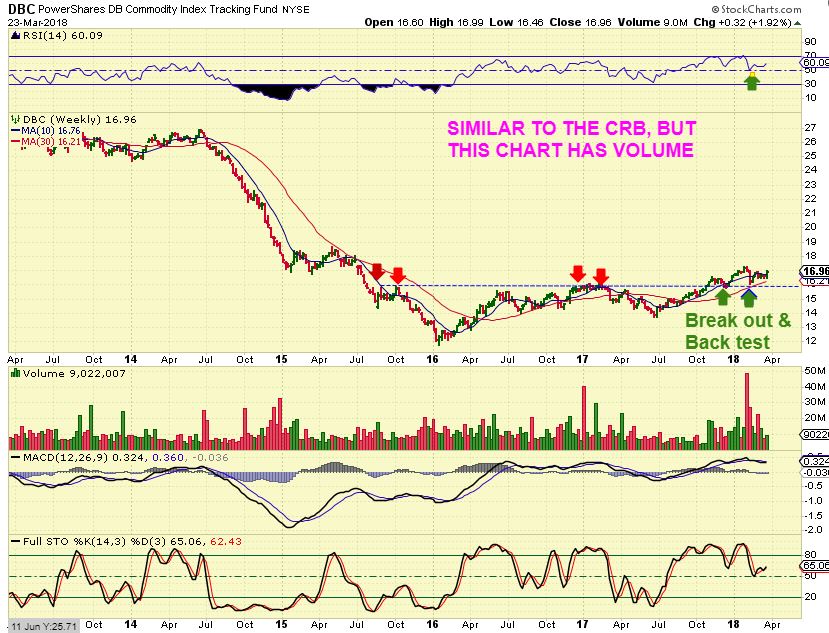
DBC COMMODITIES – On my March 23 chart 3 weeks ago, I said that I have been monitoring this as a possible Big Change too.
1. The Commodities sold off sharply in 2014 to 2016 and then rallied in 2016, similar to Gold, Silver, and the Miners.
2. DBC then began forming a big base, similar to what Gold has done.
3. So, the Precious Metals bottomed with the DBC in 2016 and formed their own base, but recently I saw DBC (Commodities) lead the way & break from that base & back test it this year.
4. My thinking is that Money is flowing into commodities and should now start flowing into Miners too. GOLD is ready to break out from a similar base. AND…
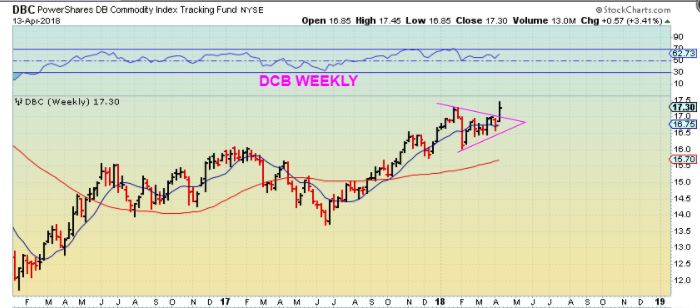
DBC WEEKLY – 3 weeks later we have a break out to new 3 year highs. At this time GOLD has also moved to the highs of its base too. This report shows that this week several Miners are starting to Pop higher with large %-Gains.
Are you now beginning to also see the changes that are coming, that most are still missing?
Some have openly stated that they feel Miners are in a long bear market after 2011, despite me repeatedly pointing out what a basing process looks like. Many in other blogs also feel that way. If what I am reporting continues to play out, eventually they will catch on too. Usually by then the Fuse will have been lit, and we will already be invested in this sector and holding large gains. The rest will pile in later & just continue to drive this sector higher.
So even though it may be a bit choppy at times, I think that owning a few Miners, especially some Silver Miners, may be a good idea. I will obviously be covering miners in future daily reports as things continue to play out.
ENJOY YOUR WEEKEND, and thanks for being a Chartfreak with me!
~ALEX
An important Big Picture Report was written 2 weekends ago. This picture is a link to that report, and if you have time, why not re-read it and see why my Big Picture discussion on the General Markets is important to me. I am not calling for a CRASH, but the Monthly & Quarterly Charts were a warning sign. I am monitoring things as we move forward. We could eventually be topping, or heading into a multi-month consolidation, as explained in this report. No matter what I do in the day to day daily cycles ( meaning that I am currently ‘long’ a few tech stocks), this report is in the back of my mind, and the changes that I see taking place are too. Soon I may personally be shifting my holdings to very heavily invested in the Miners ( Though other sectors like block-chain and medical marijuana are very interesting sectors with bases too).
Friday April 13th – It’s Just A Date 
 4-17-2018 Things Are Popping
Scroll to top
Thanks for the report…have a good weekend!
Another great Big Picture report!! Thanks!
Thanks, Alex. Really appreciate the in depth research.
Do you think it’s smart buying miners at day 17? The best case scenario would be a week or week and half of gains before the descent into a DCL, no? Or are you recommending to just buy some miners anyway regardless of cycle timing because of how bullish they look?
I bought Miners ( especially Silver stocks) and recommended it a while ago actually. – I said, something like “It would not hurt to own a couple of Silver Miners at this time” If you look at my Tuesday report, written Monday night, I showed ‘set ups’ that looked ready to go higher, and recommended them as a short term trade. IN last weekends report, I mentioned that if GDX got above the 200sma, it could be a change in the nature of things.
SOME READERS have told me that they DID buy when I recommended it, and they still own ( what to do now?)- so they are hearing in the Big Picture report my thoughts on these set ups- they remain healthy at this time. Now for the LONG version of your question.
IF, for Miners, FEB was an ICL, then this is the 2nd daily cycle for them, and day 17 could be 1/2 of the daily cycle.
It could peak on day 28, and bottom on day 32 , right? So to those holding, I say stay with it as long as it is healthy.
If there are bullish set ups, I would buy them as a trade, and see what happens. It may be a 10% gain in 3 days and thats it- it may be more or less. .
NOTE: In a bear market, you really dont want to own any miners as we approach the timing for an ICL.
In a Bull, I usually do hold some if I got in them early enough..
Gold has higher lows , I think it is back in a bull market – individual Miners can ignore Golds dip into a dcl completely, They usually get some reaction into an ICL. —-SO—
Will the next dip be an ICL or just a dcl? We don’t know, since a 6 month ICL to ICL would be Dec to June. A 5 month is DEC to May.
If an ICL comes in June, the next dip will be a dcl, then lets say that this daily cycle could actually peak on day 28 ( 2 weeks from now) , then dip to a dcl near FOMC and it may be a mild 4 day dip or something.. So last week I began showing some Miners bullishly set up & mentioned that I bought FSM, EXK, CDE, AXU and still owned TRX.
We dont know which scenario will play out, ( ICL MAY or ICL JUNE) but I always warn of the possibility of this FOMC being an ICL, because it fits the timing and I dont want people to be caught off guard. Especially because I feel like any time I say I own a MIner, 1 or 2 people go and buy JNUG. JNUG into an ICL can get cut in half. .
Last week, a few individual Miners were making double digit %-Gains and GDX broke the 200sma.
All of this known, I think that each individual needs to decide how they want to handle it this set up.
SHOULD THEY Wait for the ICL whether it is May or June & just load up then? That is low risk. Or Trade a miner that looks set up to run and hold until that changes? Slightly higher risk.
I did take the trade when they became Bullish, and I just keep in my mind where I am in the timing – possible ICL in MAy or June.
I still feel that no one is “missing the move” if they wait, the GDX chart shows we are still near lows- but the sector is starting to act bullishly.
REFRESH – as stated in this report, we could do this
https://uploads.disquscdn.com/images/751456f4a7d7fe6984c03d8de1351a05a4e36d66b8e2d80c542ab07615430ca1.jpg
Bonus, a report within a report!
LOL- I REALLY need to learn to simplify and not worry so much about leaving something out. haha
Wow, that REALLY clears it up for me. You hit the nail on the head by laying out opportunities vs. the time frame and the risk level for each. Just perfect. I have a habit recently of making you spend too much time on my questions, so I will shut up for a while 🙂
I hope you don’t really feel that way. I feel that if you asked , others may have had the same thought.
I literally have hundreds of readers, and about 20 that post here in the comments.
I would t spend that much time on it of it wasn’t important.
Word.
You always give us so much. Thanks, Alex.
Great answer . I have held onto Exk …. silver cot is just eye popping and all the commercials are long ……
https://uploads.disquscdn.com/images/c68f26558bf28e17afb3731750f2887ab79365350b023dc62739ff485d5efa41.png
#YDTM
LOL
#BCB
#evilempire
😉
#HB are you making a fist? Getting ready for a brawl?
I HATE TO SAY THIS, but even though I see that the FUTURES are up nicely, it still really needs continuation higher or we could be seeing a bearish rising wedge.
IF IT IS A WEDGE, it can just break down to form a rising channel as seen here ,
refresh for 2 chart
or…
https://uploads.disquscdn.com/images/a0927f2e61280b08ccb2f529630ca37f24913851cbe498a90f24b2686cf0717f.jpg
https://uploads.disquscdn.com/images/bd83bc5d587d809f9749333f59f3b8bee29782e63dc4e7e16afc25e086b5f344.jpg
Refresh, I image that WE could get an extended daily cycle too, putting the dcl ahead, maybe even being the ICL, but this is least likely, because it has closed above the 10sma for 4 days
We really need these markets to push higher & get some short covering
https://uploads.disquscdn.com/images/26ff7ad480e3189ca95ae1dc51a0d902d1a23974026a453b2bbfda5098623b24.jpg
Interesting TA, day 9 is early in the cycle for a major drop. How far do you have to go back to see evidence of that possibility? I could see the parallel channel play out as a bear flag further along in the cycle. Thanks for sharing CF.
I have seen the parallel channel often, but that wedge drop often scares people right out of position, so I’m hoping for just a stronger move higher short covering.
I dont know the history of a day 9 top in general markets ( ESPECIALLY this early- seems unlikely)
agree.. lot of bear wedges in tech AMZN GOOG etc..
Thanks for the heads up. That leaves the 50 sma as the battle ground. Hopefully not an early rejection and descent.
CANN CRON still running
FFMGF having a good open, newsletters Future Money Trends and Wealth Research Group both buying it hard, they say. Today´s open finally puts it up over the 50 MA, with only the 200 MA above now.
TRX – up 11%
SSC popped u off that 10sma – posted this chart last week
https://uploads.disquscdn.com/images/ac48bfe5c72f2cc66a3e52d8103a10f92390faef0bcea95104e4614fd8d7441d.jpg
Many MJ stocks look very good, I mentioned my favorites for now in the comments Friday like KSHB, CVSI, CCBX, AND A TON MORE Actually
LHSIF…has gone up, but 3 and 6 month charts look good to me, heavy trading today, I own it
CANN + another 10%
CANL – 80%!! Some of these are looking great chart-wise
CNAB & CNBX Charts look rather identical, but CNAB looks to be ahead of CNBX.
CNBX may follow that pattern, CNAB up almost 20%
NXTTF still hasn’t popped, looks like flag perhaps on 5 day chart..?
TWMJF flag intraday
KSHB also moving
MJ sector, does anyone have any favorites? Why?
I mentioned mine to you Friday when you asked, those are the ones I bought. Those are charts that show improvement before the news was released Before Trump claimed that he wouldn’t interfere with legalization in the US.
For example, Look at KSHB, it was already putting in higher lows and had a rounding base.
It may be best to watch which ones break above the 50sma, and buy the back test of the 50sma also.
This will take patience.
I own KSHB- it gapped up, it could not drop and fill that gap & back test the 50sma, and then I will add.
I like CBWTF is already a double bottom base if it holds.
CNBX could be good if they can get above & even the 50sma,. Good chart, looks like CNAB, but CNAB is acting much better
I read your response, thanks CF. You are looking at Technical Analysis, I was wondering if anyone had any fundamental analysis on the sector.
I checked the fundamentals before I bought too, it doesn’t tale long- but the chart usually shows that
kind of health 🙂
KSHB (has income that has increased, like the past performance)….CVSI (has income), NXTTF (has increased income but is lagging right now, waiting on it to pop, seems to have a lot going on), ACBFF (has income, Canadian so will benefit from their legalization soon, like the chart)….like others as well for various reasons…attbf (supposed to be pursuing a beer product, no income yet for this company), mpxef (has income) lhsif, cron….
Thanks Tammie, that’s what I was curious about. Are you still in POTN?
Yes…I have it in one account at a nice loss …so holding it hoping to regain that the way I did when I had a loss on CNBX…:) 🙂 They’ve had increasing income so hoping I’ll eventually recover that….also, GBLX is moving…I started to get it last week but held off….now it’s up up and away
I got GBLX last week too – after the Trump tweet.
IT was at the 50sma, and about to cross so I didnt get in until 55 cents
I held off last week so ended up not getting in…since it ran away today….:(
OH- I thought you said ” Started to get it last week” but held off on the whole purchase and then it ran off before you got as much as you wanted.
TRAN up big today. Could be a good omen for general markets.
Nice break above the 50sma, that is what we want to see
CANN +15%.. 6 possible
scalp TWMJF off flag.. needs thru 25.10
CBNX dropped down to $1.15, and then shot up back over the 50sma.
Volume Friday stood out from the last several weeks, I added
CNBX… do you have dyslexia like I do 🙂
Speed typing
VRTHF really moving….I don’t own…looks like heaviest trading day in a long long while….buying 50% of outstanding shares of company called 3 Carbon Extractions, Inc…..looks like that must be what caused the spike today….
What a nice 3 day move
scalp tight stop entry SQQQ .. looking for retest friday lows NQ
ABCCF looks like flagging, nice looking 3 month chart, I don’t own…thinking about getting some
ACBBF is a ticker, is that what you meant, or maybe ACBFF?
ABCCF…..ABcann Global….?
It’s easy to confuse with ACBFF….
I Like the chart of CBWTF as a double bottom base. I’m watching the 50sma
looks good
Yes, I’ll probably buy it when / if it closes above the 50sma
I just bought LMNOP ;P
Ha! I’m a little slow…ha….actually typed it in to see what it was before I realized what you were up to….lol 😛
potential rounded bottom break out .. back thru 8 ema .. 34d 1.42 would be nice break .. will watch thx
MNTR, MSRT, BLOZF, GBLX, CANL, CANN a few MJ Stocks breaking nicely higher. I usually start to track them and look for a possible pull back for a future trade
CANN has been on fire. Need to figure out who is next to go and get onboard! Whoo
Refresh for 2 charts
There it is from this weekend report – measured out & now probably consolidate
https://uploads.disquscdn.com/images/d68267fe6897a7991db8a6c3d3af4fb5851144f6454bd496aa510419f6fc577a.jpg
https://uploads.disquscdn.com/images/ace7d7166056e32bd9eec76a6978104d4c249309bbd906e5cabe93d2399e3618.jpg
I had to fix that above post – had the wrong chart – refresh
Nice score, I assume you keep it all and just look to add on pullbacks, or is that a big enough move for you to book profits, considering where miners might be in the cycle counts?
At this point, I’m just going to ride it, so I may give a little back, but I like the weekly chart that
I had in the weekend report. I post it here ( So I am holding on)
refresh
https://uploads.disquscdn.com/images/e8d5cf30d235fa2f36d33531ac7601408c22349d4c026672afee84c413de6e51.jpg
The uranium etf is back up over the 200 MA, looking good. Unfortunately I missed the group, only have a small position in DNN. http://schrts.co/ES52Gh
CANN +20% moves up higher vol than low vol pullbacks … still long from wednesday Boehner news..
I bought CBWTF – I wanted to wait for a close above the 50sma, but I will take my chances.
The sector is acting correctly and it is pushing on the 50sma with increasing volume
It may mean that I am early, but I’m going to take my chances because the other ones I bought are up very nicely
Refresh
https://uploads.disquscdn.com/images/ceec1809e74d3db01654d5169467c887e0cd371a46adf5625504d746a398195d.jpg
Hoping CVSI is making a nice flag here on 10 day chart….
CASA building some steam. Can we break $31.2 today??
oooh la la HMNY … 😉
oui ma belle
HMNY only the beginning???????? https://uploads.disquscdn.com/images/f481a11016d5b6f25c0db67cf5ed30000f4678cdbd0ad520fc9b2bbfeb672559.png
beginning of the end? … just kidding with you..
ah! did you see the news? Verizon new stake in the company. Not married to the stock but 1st target is the 50dma
VZ 9% passive stake from last week news
the guy at HMNY is very impressive.. one of the movers at NFLX along with the CEO …. worth watching.. good luck !
notice the on balance volume. going up as the price goes down.
😉
up 20%
can we get 30%?
…makn my knees a lil weak …
*the action not the French .. 😉
*ok …maybe the French
smirk
oh la la for both
bumped out at 3.97…lol
GoodEnuff4me & my bobbyMcGee
bravo. Bobby and I are riding the beast
GL … im at work or prob would as well…
i may hop back in on pblk
another one that can ignite… UAVS. watch it
33% 🙂
runnin straight to 5 isnt it….
No volume in GDX/J today
Yep, not sure what to make of it, except I´m not expecting a 2016 straight up run like back then. It seems things don´t repeat exactly in the markets, so if we are in a miner bull again, maybe it makes big gains but over a much longer time frame, like 2 years or so?
I didn´t do anything today other than add very light shares to my MUX position, since it was down a little and it´s one I feel I´m underweighted in. A decent down day in the group tomorrow will have me adding across the board, I really like how some of the miners are acting, like FFMGF I mentioned this morning, as well as the stocks CF bought recently. This feels like a two steps forward, one step back market for miners which is fine as long as it continues awhile. We haven´t been getting the obvious smashings to buy into like years past, so a down day, or two in a row is good enough for me.
Wonder why MUX has been such a downer with all of the miners setting up recently? She’s been a goat for a very long time now.
scalp RUSL 39.50 tight stop .. Washington Post Report Trump Has ‘Put The Brakes’ On New Russia Sanctions;
FYI … https://marketrealist.com/2018/04/cannabis-sector-closes-positively-in-the-week-ended-april-13
Not sure what just happened to LHSIF…?
UEC very nice CF… 😉
tx
CANN can … 😉
*not the song
Oh Yes – very nice And URG, DNN, & UUUU
I’m actually thinking of selling CASA / MAYBE SWM or something to get into these low priced fireworks stocks.
The %-Gains are excellent, even for a 2 or 3 day trade
Bought DNN
VSTM been no slouch either ….
I hate it when everything lines up & goes at once
Too Many Positions
WhenItRainsItPours 😉
#FastHands
Yes, its actually a traders paradise with all of these set ups. Uraniums, MJ stocks, Blockchains, Tech , Miners, etc , etc
You can cash in on 10%- 20% with 1 trade, jump into another , catch 10-20% in a couple of days, jump into another as it leaves a base, etc etc
I’m slowly back to juggling for a living ( Chart-clown)
uggh …Reason 999 why maria should retire early and trade
I wish we could all do that! I don’t seem to have the time. Oh, or the skill!! (but I’m gonna try none the less).
Same here. All I seem to be able to do is watch.
NAV nice move on volkswagen interest in TO ..
out RUSL.. still in channel and looks like 43 potential but don’t like holding 3X overnight … will keep on watch
CANN nice close.. target was 6…but thru 5.75 maybe into tomorrow..
NFLX boom
ROKU pop ESPN news
The market has overall moved higher but we haven’t been able to string 2-3 positive days together. That and the dropoff in implied volatility is killing options. Would love to have another positive day tomorrow! Heavy in TQQQ. I’m with Alex that we might have a topping formation here but I’d really like to test highs again first, that would be a solid gain off the lows.
If we can close higher and soundly above 50-day on Tues, I’ll start moving my stops up.
Tuesdays report has been released