
March 17th Weekend Report
This opening picture describes how the General Markets shot up, especially into the end of last year. With little else than a volatility pop here and there, they just kept climbing. Well, in the weekend report, I like to take a step back and look at that Bigger Picture. At times things stand out from a distance that I may not see when I am focused on taking the ride using daily charts. Let’s take a look…
Please read the following intro, don’t skim this report 🙂
I won’t have time to go into great detail of all of my thoughts in this weekend Big Picture review, but I just want to say that I do still see some cautionary signs. I will show you some of that. As Tops begin to form, they do not always show up as quickly on daily charts, because at tops everything still looks very bullish. At tops, the retail crowd is still buying and chasing , but certain things might begin to show up in the weekly charts. I will be pointing that out here.
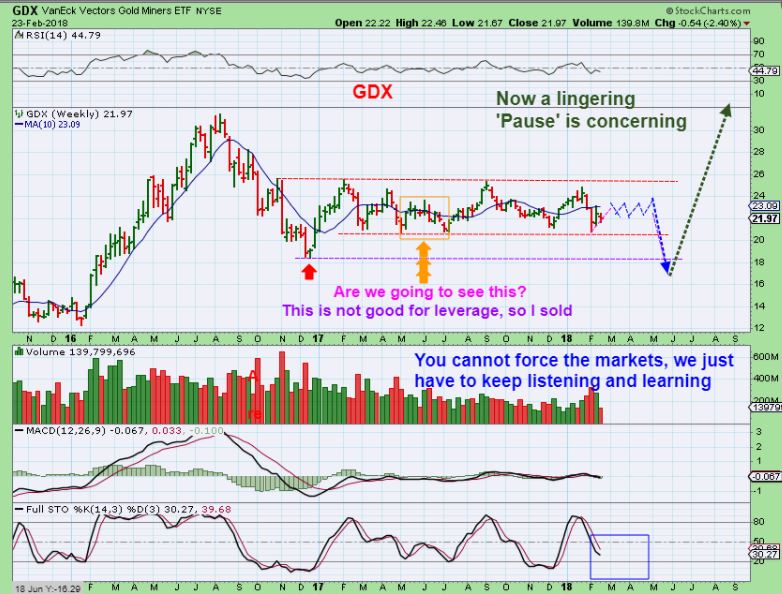
To be clear: I don’t necessarily mean ‘ The Top’, but maybe a temporary topping process or sideways pause. We should be rising from an ICL here, and tops don’t form from an ICLs first daily cycle, the second daily cycle will help us to see things more clearly. let’s just say that we ‘Might’ be slowly seeing a form of pause, stalling, sideways, or a topping process beginning here.
Over time, we will see the body of the animal form –
Is it a Bull  or Bear trying to catch us?
That said, I am still long some general Market stocks, and things do seem short term bullish on daily charts, but I’m a bit cautious with the Big Picture going forward too. This is the Big Picture View.
.
SPX – To be short & clear, at the Green arrows I see dips, yet just 2 weeks higher and the damage was repaired on the indicators.
– Green arrows 2 weeks higher and the MACD crossed higher and
– the lower indicator turned up SHARPLY at Green arrows.
– 5 weeks off the low and I do not see that now? Time will tell.
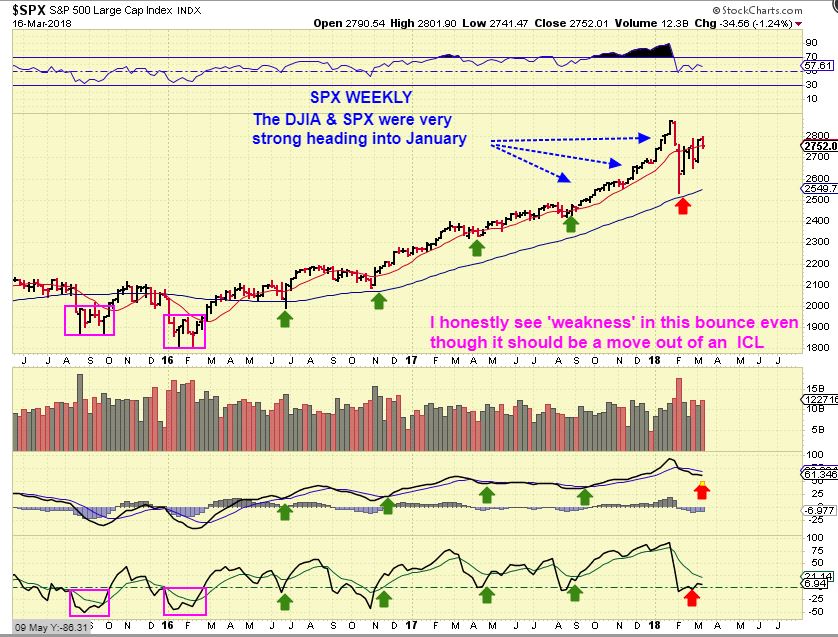
MAYBE it is because the dip was much more extreme this time? That might mean that we need more time to repair it. The current move higher does seem sharp though, but I am not seeing a sharp move higher in the indicators. That simply means that I am sharing with you what I am watching.
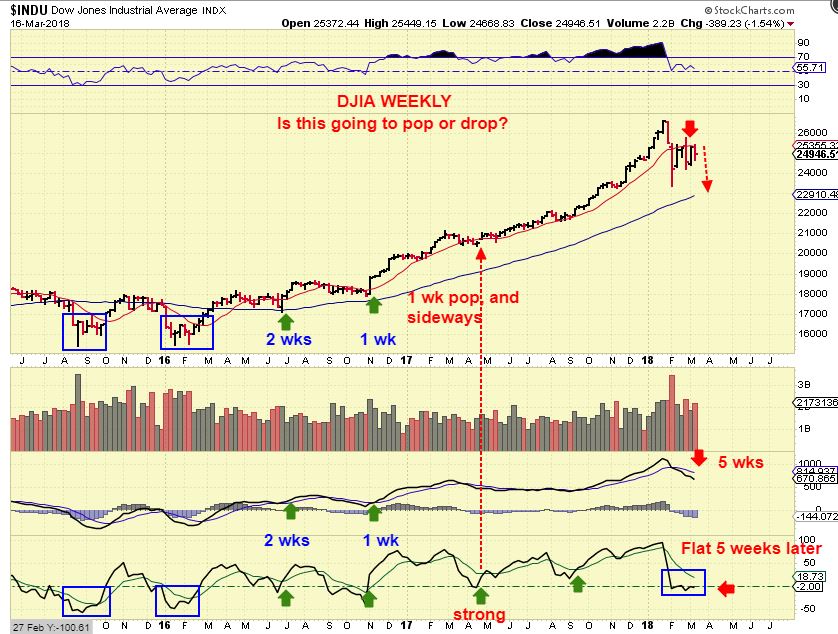
DJIA – The DJIA was racing higher for the final 8 months of 2017, now it cant do any better than a choppy sideways move for 5 weeks, right? So far this is 5 weeks sideways, and read the chart. 1 & 2 week Pops turned up the lower indicator. I am not seeing that now, it is flat (so far anyway). Here I drew a double top possibility?
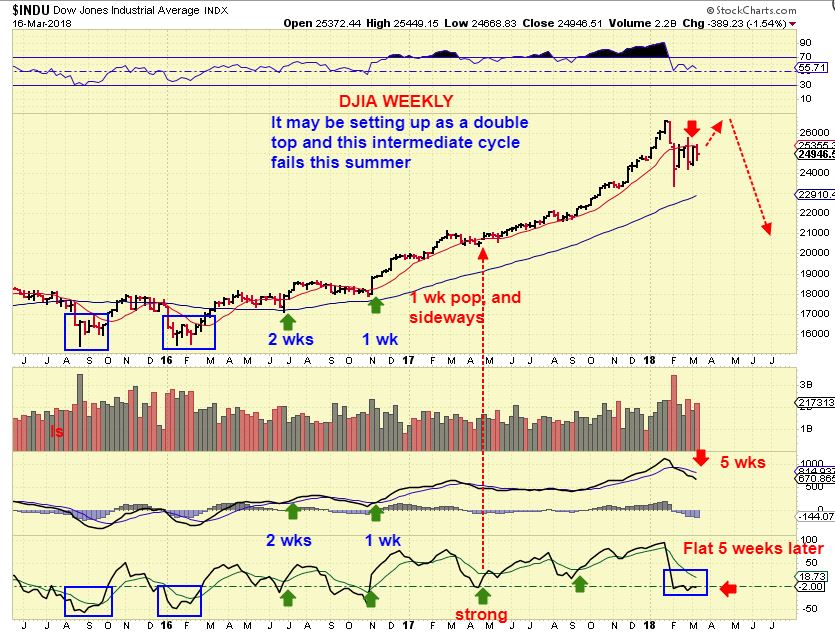
DJIA – Here I just drew in an eventual drop after sideways chop, a double bottom possibility that I have been mentioning if this remains weak.
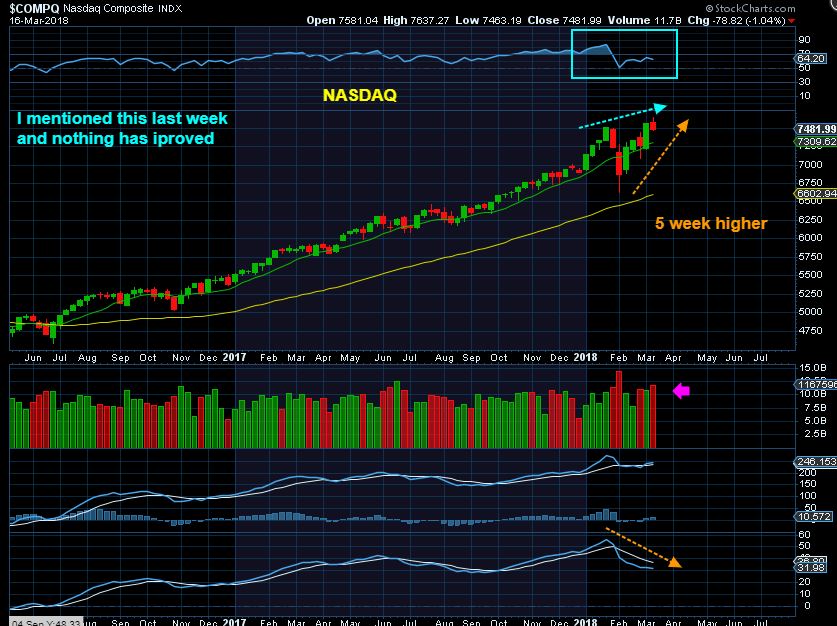
The SOX & The NASDAQ have been strong, racing to new highs however. Let’s take a look at the NASDAQ.
NASDAQ – So far this divergence could indicate a double top, and last week I pointed out that this is what concerned me- divergence at new highs. The RSI (relative strength) is weak. Look at the deep sell off in June 2016. That one did NOT affect those indicators like we see now.
Lets look at a few of our bullish stocks.
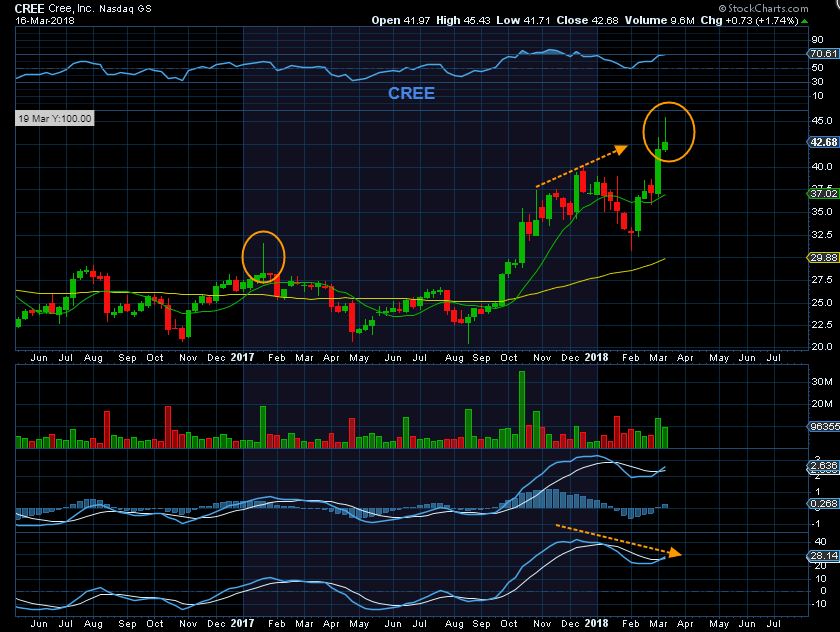
CREE WEEKLY – CREE raced higher Thursday and then sold off. On the daily chart, MU reversed on Friday and does look like it wants to go higher short term, but the weekly still looks like a topping candle. The weekly is cautionary.
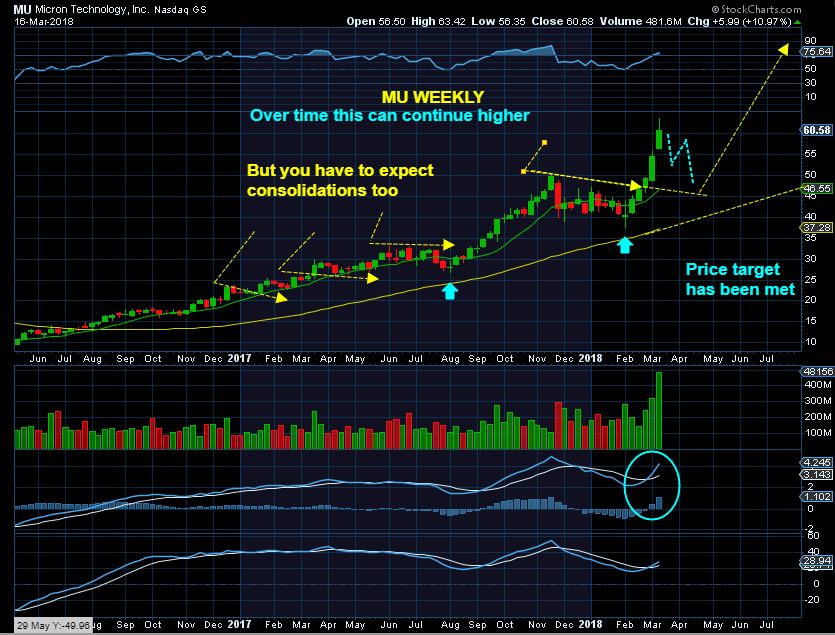
MU WEEKLY – I feel that this looks like an exhaustion gap higher, reversal weekly candle. My price target has already been met. Two thoughts come to my mind here that I want to share with you …
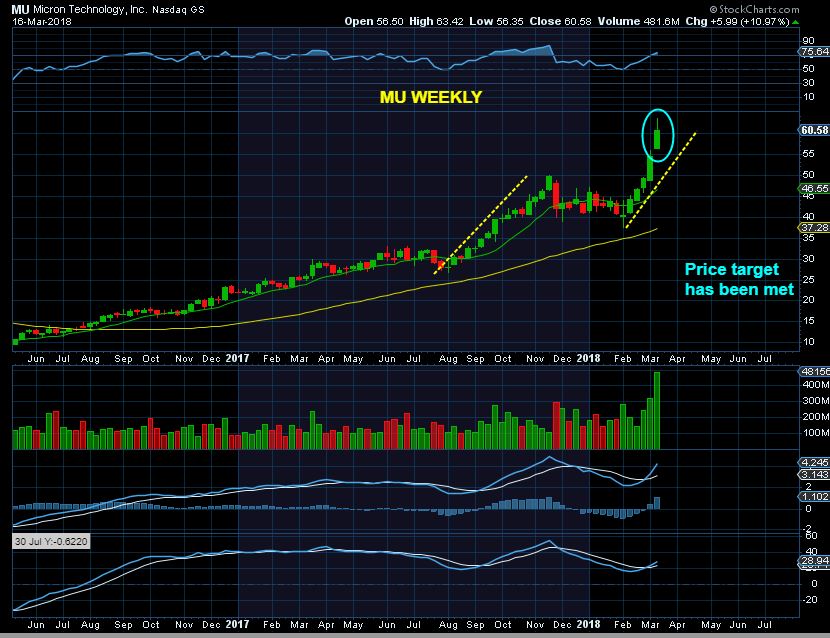
1 . Everyone is excited about the ‘upgrades’ & ‘price target of $100’ recently. Yes, it absolutely can go there over time, but in my personal experience, I have seen big market movers A) “Upgrade” a stock so that they can sell or unload it into the top. B) I have also seen them take a beaten down stock and right at the bottom they ‘Downgrade’ it, so that the last sellers will cough up their shares & they can finish loading up. IS THAT HAPPENING TO MU? We’ll see, but …
2 . Yes, I do agree that MU can get to $100 if the markets stay strong, but it also can drop first, eventually recharge, and run higher again as shown here.
CONCLUSION” I am still long some stocks. The General Markets have been bullish, but the Big Picture gives slightly mixed signals. If we just put in an ICL, I would expect this to linger near the highs or get very bullish again. MAYBE next week an FOMC MTG Push will help? Maybe we get some FOMC selling into the next dcl and THEN we get a stronger run to new highs in daily cycle 2? For now, do not short it, this is a bull market and you can stay long and strong until the short term daily charts change. It is Day 24 and on a possible 40+ daily cycle, it can still have some upside.
WTIC – The COT is still bearish & I did the same analysis on this chart. Last summer we saw 5 weeks basically sideways out of a sell off and ICL. That 5 week sideways move corrected the MACD & Lower indicator last summer. Right now, I see 5 weeks and weakness in those indicators. I do expect lower price in Oil , but I am now no longer short or long. The whip saw daily was distracting.
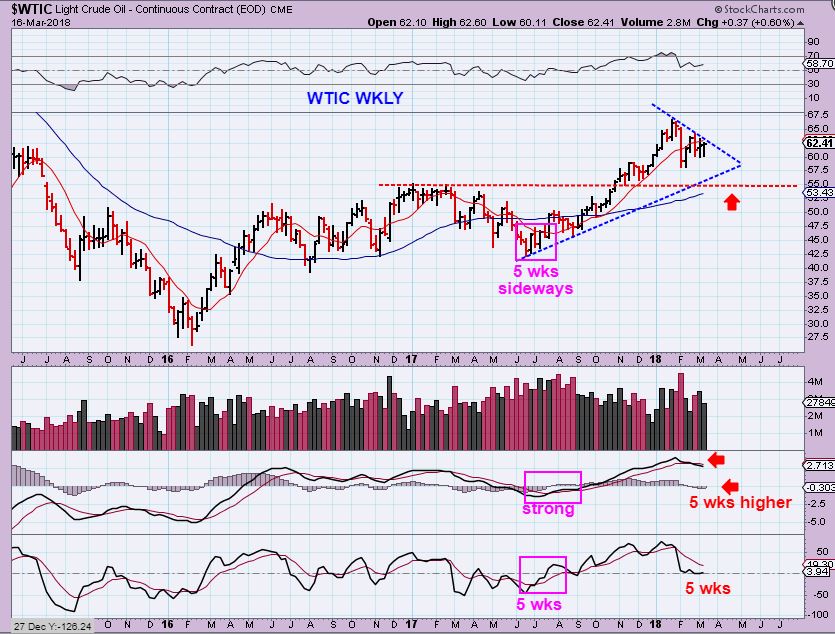
Conclusion: As I said, right now I see weakness and I do expect lower price, but I am now no longer short or long. The whip saw daily is distracting.
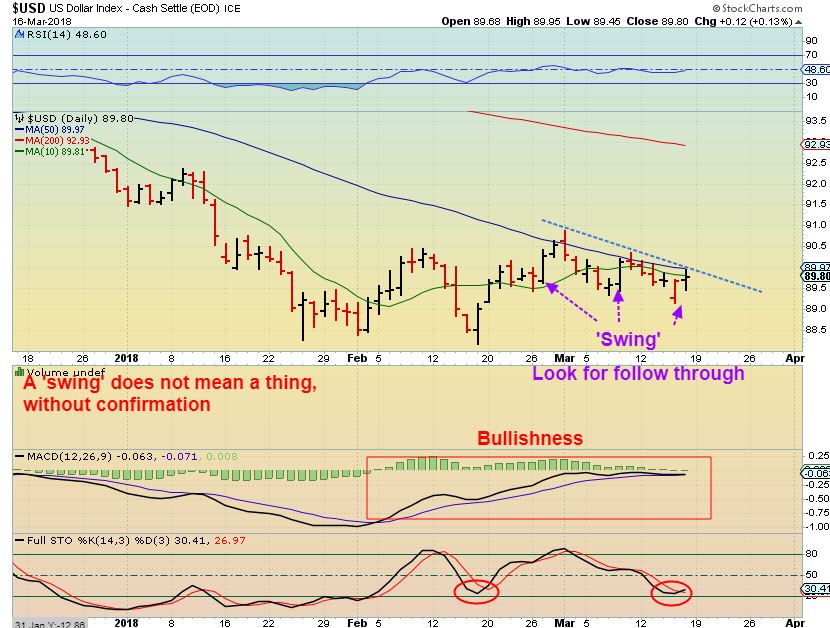
USD DAILY – Another unconfirmed swing low, but they keep failing at this resistance and the USD has been going sideways. I am almost certain that the USD will make a move by or on Wednesday with a yes or no Rate Hike FOMC Decision, and it is now oversold. Lets look at the weekly chart.
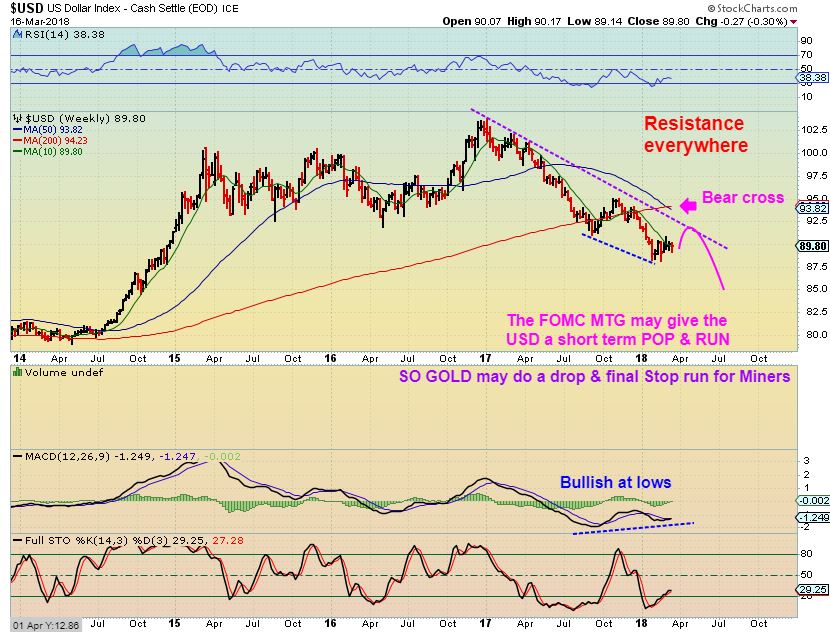
USD WEEKLY – That MACD has pretty good divergence, and this looks like the USD wants to go higher for a bit. That should drop Gold over time.
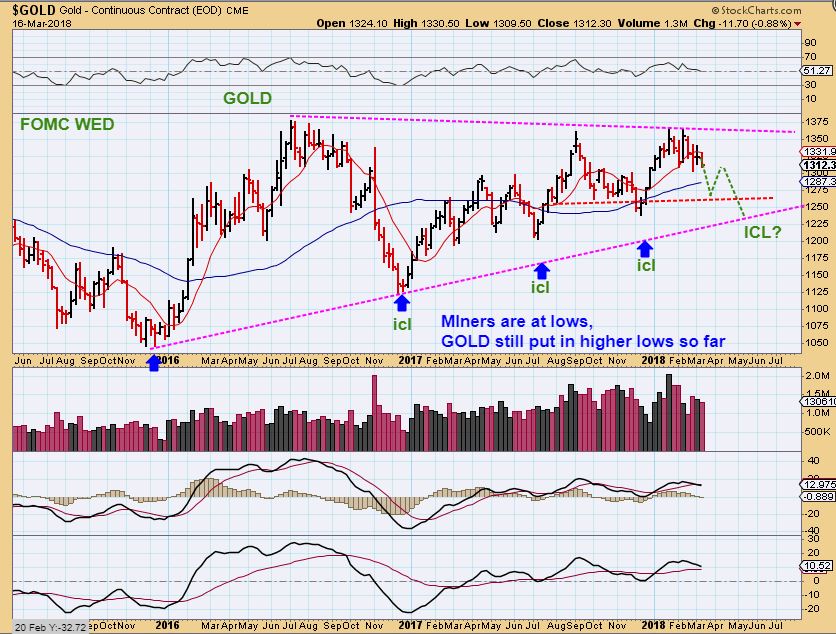
PRECIOUS METALS – I do expect a drop & that makes some traders happy ( waiting to buy lower) and other traders just want Gold to rally. I feel both ways too, but lets take a look.

GOLD ICLs – ICLs ( the deep MUST BUY lows) are know to come every 4-6 months, leaning more often to the 5-6 month range. Sticking with that understanding, we look for May or June to produce this low. GOLD has been rather strong, it has put in the last few ICLs without the catastrophic drop. That means that GOLD may go sideways and not sell off sharply yet.
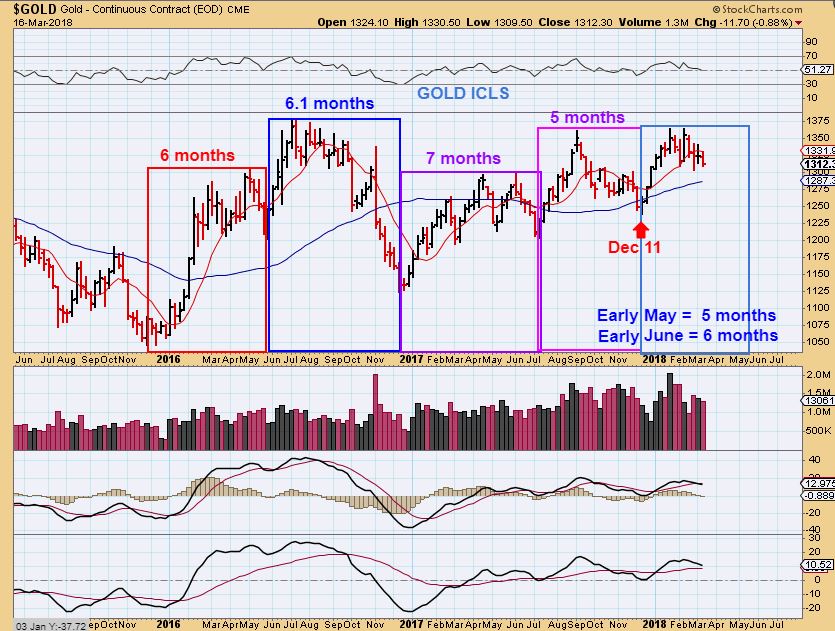
GOLD – So Gold could bounce around, sell off , and give us a stop run or another higher low, likely into an ICL around May or June. Thus a break out to higher highs is unlikely before then.
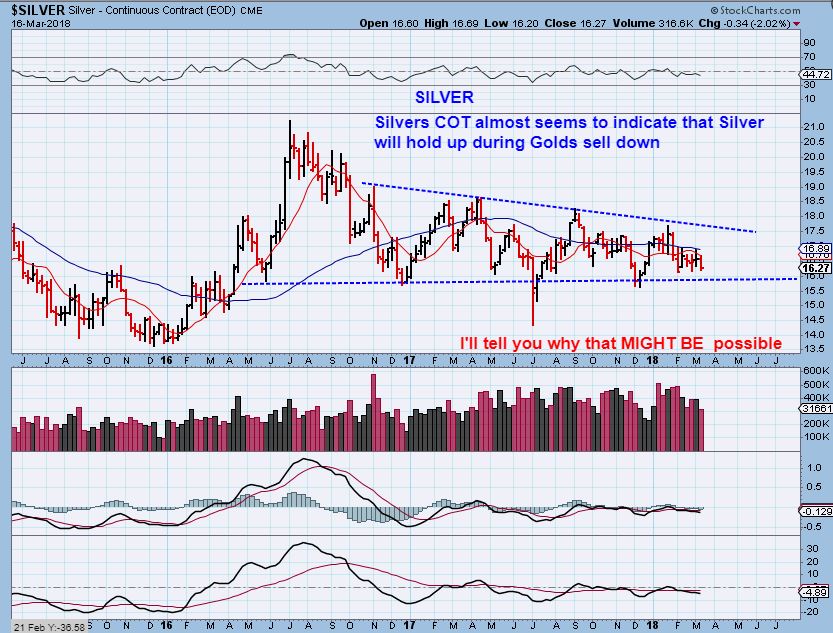
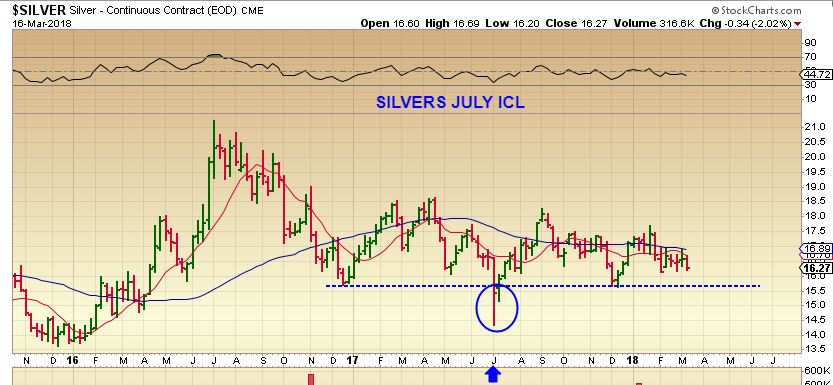
SIDEWAYS SILVER – Notice the DIP to the ICL in July 2017 was lower than the DEC 2016 ICL. Now we find ourselves back at the recent series of lows and the COT is rather bullish. This has been a bit uncommon and puzzling, and I have a few ideas of what may be taking place. I will explain at the end of the report. Some Silver stocks actually look good so far.
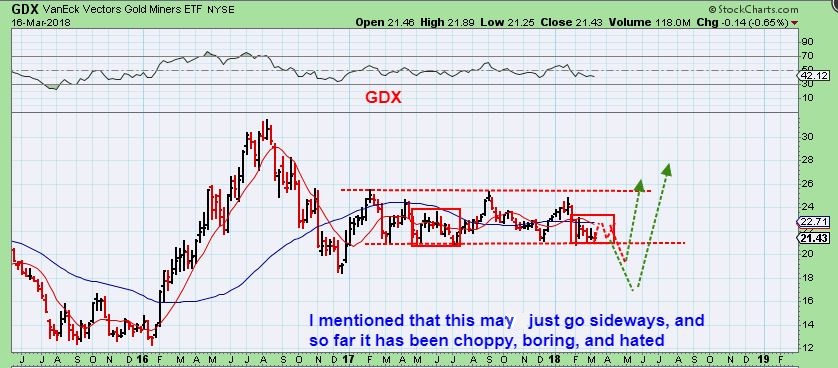
GDX #1 – The GDX is back at the lows too, and has gone sideways for months, even a year! People are SO SICK & TIRED of Miners, that NO ONE wants to buy them. That is becoming a perfect set up for most to miss the run, similar to 2016. Look at those 2016 lows = a sad Sideways chop, yet this one may be worse (longer). read the chart…
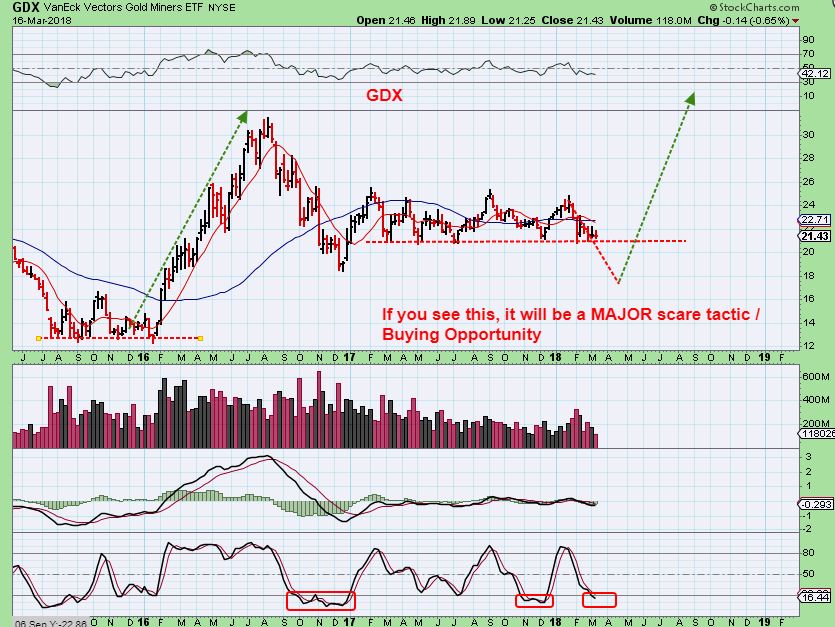
GDX #2 – At times I think that a stop run this deep is perfect for the Big Boys to run stops & Load up … but … at other times, I hear EVERYBODY saying that that is where they are waiting to buy. They are going to back up the truck & load up on Miners at that break down. Hmmm, USUALLY the crowd gets left behind.
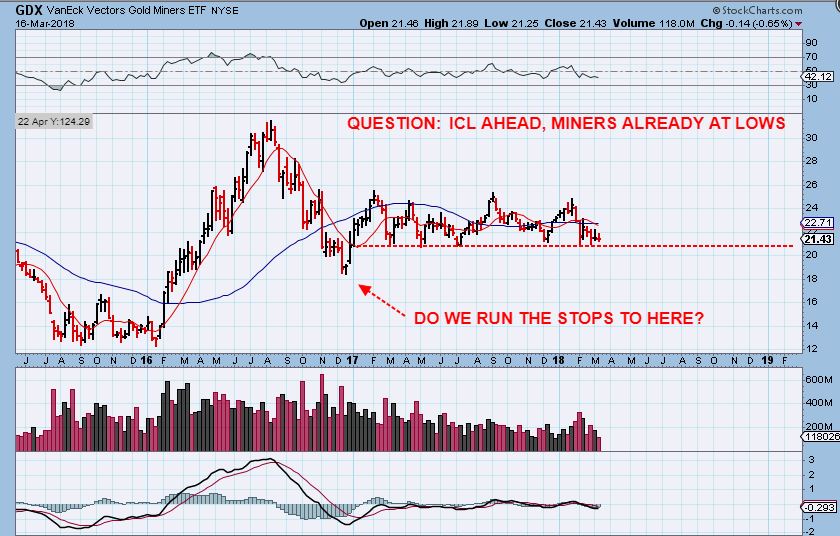
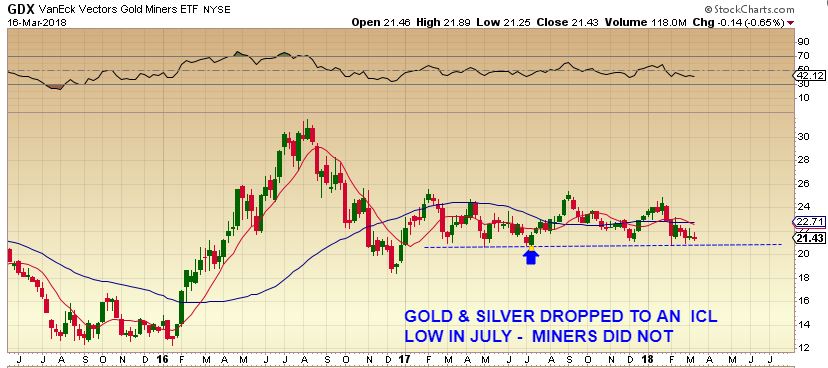
GDX REMINDER – Back in February I was discussing that we may just see boring sideways action in the Miners similar to last May, June, July. Did you remember that Gold had its ICL in JULY? Miners didn’t drop to new lows.
GDX #3 – So yes, we are still seeing that sideways choppiness and as a result, so I haven’t discussed trading this at this point. Sideways chop is frustrating to trade. If an ICL is in the future however, we should expect one of these types of stop runs.
If EVERYONE is expecting that stop run type move, is it possible that it just goes sideways and takes off higher ( to leave everyone chasing)? I do think that even that could be in the list of things to keep in the back of our minds. Why? It seems so unlikely that many would not believe it if they see it. People would think it is just 1 more ‘fake rally’ and wont dare to buy it, but we will not miss that type move either. There are ways to identify that action too. Read below and I will show you exactly why we could see that too.
Next week we have out first FOMC MTG / Rate hike decision with the new Fed Chairman. So far the General Markets have dropped every time he spoke to congress, we’ll see if the big picture is hinting at a drop sooner than later, or will the markets treat him a little better this time?
Enjoy the rest of your weekend, and thanks for being a Chartfreak with me!
~ALEX
FOOD FOR THOUGHT: LET ME POINT OUT SOMETHING THAT I FIND INTERESTING, and this is why I think many could be left behind waiting for that ‘Stop Run’.
We know that SILVER and Gold dropped down & put in an ICL in July 2017. Silver actually sold off very sharply that day. See the chart below.
GDX – GDX did NOT break the lows in July. COULD THAT happen again? maybe Miners bounce at the FOMC MTG, continue to chop sideways for a few more weeks, and then when Gold drops to an ICL, could Miners resist the selling like they did last summer?
I have this feeling that if that happened, NO ONE would buy the rally then, because they would think that it is just another one of those bounces, and they are waiting for that stop run. They would be forced to chase & buy in later, and they could be used to ‘add more buyers’ later, after the ‘shorts’ finish vovering.
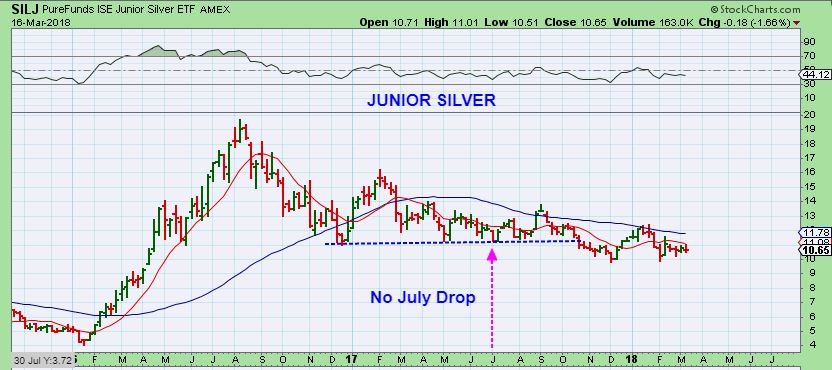
SILJ – And when SILVER slammed down in July ( maybe it was premaket, but even so) , Silver Junior Miners also did not panic out & run the stops. And notice that the Dec 2016 Lows (Stop run) has already happened in the Silver stocks ETF. If we see that sell off in May or June for Golds ICL, The Miners might already have their lows in place, but who will believe that!
One final thought: SILVER ALREADY BROKE THE DEC 2016 ICL, so those stops are gone. The COT is already very low for smart money shorts. This leads me to wonder, is the major part of selling already done for SILVER & the majority of MINERS? Gold keeps putting in higher ICLs, Silver ran stops, etc. It is an unusual set up – so I am keeping my eyes & mind on every possibility, and we will NOT miss the next run when it happens. I think that we are going to see a major bull run in 2018 in this sector, since all of this churning & Consolidation has bullish hallmarks to it. 🙂
Update:
Still watching the Medical Marijuana stocks , and some are still improving. TWMJF is one, and CBWTF ( I Still own this one form a few weeks ago) Is improving as well as others.


Alex mate, just when miners are boring me to death (and many others), you still work so hard to investigate what might be going on. You are a rare breed and I am so thankful for your research! Thank you!
I agree CF, many different scenarios could play out in miners, so I bought a little last week, will buy a little this week, and add some more the week after, hopefully adding at lower prices but if not then at least I am forced to buy into an up market, which is not my strength. I am far more likely to miss a bull move after it has started, than if I am in in early and have to wait, that´s just my personality.
As long as any of the above scenarios plays out in miners, I will get paid eventually. The only scenario we haven´t considered is if after we are loaded up, they just continue lower and lower to strong support around zero. i think this last outcome is unlikely, so will continue my plan plan to nibble on every down day from these levels.
Hey Ralph,
I mentioned that I bought Heckler and first Majestic a few weeks back and they still look pretty good right now. I sold them just to lighten up as we go later in the day Lee cycle, but maybe the miners will hold up as gold comes down. I think May or June we get a next big rally and I’d like to see it just break out of the top of this consolidation. I will be on board for that run for sure
NAZ futures are fugly overnight. If this holds up through the open, should hit my stop on TQQQ. 🙁
Me too. Feels just like March 2nd when my stops hit on the gap down, and then stocks rallied for a week, If I sell, that will happen. If I hold, markets will continue down hah.
Happens that way every time!!
Klondex mines bought out by HL this morning, 56% premium in premarket trading. Good to see some activity in the sector, and that HL is only down 5% on the news.
What’s the symbol?
KLDX
Thanks!
Wow, that certainly makes them a competitive Gold Producer as well as a silver miner – Klondex had good property.
Klondex had just fallen to a new low and I think HL bought all of their shares. That’ll look cheap some day
FB taking some heat, and maybe just some pre-FOMC jitters / profit taking has markets futures red, but more so nasdaq that the others..
The NASDAQ ( AND SOX) broke to new highs and the SPX & DJIA have been a slower climb.
Seems like NAZ futures are down more , maybe just because they ramped up quicker & have more profit for the profit takers to lock in before the FOMC MTG-
And plus, The divergence that I pointed out indicates a slow down, dip , pause to re-balance 🙂
Alex is that a breaKdown from a rising wedge on the NAZ?
I would say yes, so it may be dropping down to a dcl at this point
or it may drop, run up to ‘test’ the break down and THEN drop into the dc;l
Alex,
I think you should consider the fact that both silver and pm stocks could have a ICL type of event about 3-4 weeks before gold, as it has been in the past couple of years and then a retest of the lows without breaking them as gold has its ICL. It could be that we get a tradeable low in pm stocks in april and then a ICL in gold in may
I mentioned a few times the possibility of an ICL in Silver & Miners already in place, and it has not been violated
This is captured from the weekend report
refresh
Click to enlarge- and the final statement at the end of the report mentions something similar too
https://uploads.disquscdn.com/images/d4fdfd4205ab82798428f03ba51aff297ef6da05e03aaad6b659199873f89bdd.jpg
very real possibility Alex. I am almost feeling there is another DC to go and after that ICL will come around here and nobody will recognize it.
I really think that many are expecting that Dec 2016 ‘Stop Run’ – and I do here many saying that this is where they will ‘back up the truck’.
Often that means that it won’t be that easy. I am going to try to be as open-minded as possible, dont want to be caught flat footed. 🙂
Any comments on OPTT Alex?
Not really , A POP gap open like that is not something that I can recommend as low risk. But the gap open and you have high risk of a drop.
if you are in it congrats, but I cant recommend it unless it drops down to fill the gap
I like TWMJF & OGRMF and a few others today.
OGRMF has been holding the 10sma, and now is challenging the 50sma and I kike the volume.
TWMJF breaking above the 50sma, good chart set up too.
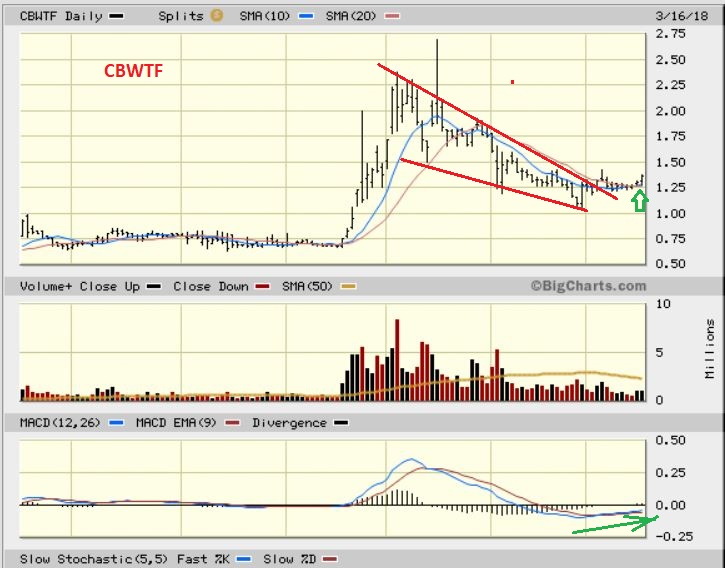
CBWTF held the 10sma well, moving higher
There are others too, but I have been watching these set ups ( I own CBWTF, OGRMF- but I’m not outwardly recommending them as “safe’, because the sector as a whole is firming up, but not entirely on board yet).
CRON = Big Volume
I’m thinking that these 3 charts look better on the Canadian side ie. OGI.V, WEED.TO, CBW.V
Maybe due to Canadians jumping back onboard:) Anyhow, I’m long all 3, plus TWMJF (WEED.TO)
So I bought this trying to jump the gun on a possible break out last week ( Others in the sector were moving higher).
This morning it is going against me, and I will cut it loose if it breaks down here.
Another trade that I entered …GALT is in a similar boat…struggling under the 50sma
refresh
https://uploads.disquscdn.com/images/f65d3e9e57dd373722d87d93608863b99b8c2c3d660f39ce6c4feb8eaf19dcba.jpg
Alex, Thanks for sharing.
Ur welcome- these were my trouble makers this morning 🙂
They seem to be holding up, not really getting caught up in any major selling chart-wise at this point.
I jumped ship on this one in the am :-))
“jumped ship’ – I see what you did there – lol
U2 ….
#sameBoat …
OGRMF really improving here, I give it a “So far – So Good”
refresh
this sector may be starting to show bullishness in these leaders, and the rest may follow later. Big %-Gains in these in the past.
https://uploads.disquscdn.com/images/0642d00d1be04034d7a47ca74d040bd7c8fa06bd2f290de2624b9a1ed985e052.jpg
CGIX… dang.. i wouldnt be mad if CNAB and CNAB do that…
Cnab & Cnab? 🙂
#ShePicksOnMe?
I’ll read her mind, she means CNAB & CNBX
LOL … tx
*she’s STILL having a re-entry problem….
Sill says Vacation Maria- must be a mind set
CBIS… as well pls&thankU
and CNBX!
CNAB & CNAB? Law Firm? #CP
lol…. dork
Just remember I didn’t pick on you! Just CF and Bill!
Hahahas…..
Ohhhh.. i luvIt
CanDishOut….. and TakeIt 😉
I think that CRON may run again- they got listed on Nasdaq and their buying volume has increased nicely.
It held the 50sma (So far after a small break through & Recovery), I’d like to see it get back above that 10sma
nice…
I bought this one earlier ( $8.50) , because the volume in the first 1/2 hr practically matched daily volume , but I cant recommend this one because- looking at the daily chart, this could easily drop from $8.60 to $7.60 (and a gap) in 1 or 2 days. I just want to own it if it breaks out & runs.
Smaller position
Was thinking of playing around with DRYS (playing with stocks is never a good idea)
Read the past month of news releases: credit facilities opened, credit facilities maxed, company busy repurchasing stock (after near infinite dilution last year), positive earnings based primarily on one time item, nav worth $7 plus….
Lots of levers…. maybe a case study for an MBA class someday when the smoke settles.
My head hurts….. Pass
CLF, X, STLD, NSU now dipping below 50sma
I still own NSU, and it dropped down to its trend line & recovered so far ( Almost sold i earlier at the trend line.
Not sure why this one recovered and others are not
Sold my CY for a small 100 loss, went short at 18.15 for a day trade to make it back and then some
Just covered half CY short 17.65
Nice gains in MJ. Added to TWMJF. Sorry guys I think that’s it for MJ, it’s about to crash. That’s usually what happens when I feel good and add.
I’m liking what I see in a quite a few, so they look to be turning the selling into a cup, with higher lows and higher highs and a macd cross and then a macd tag & up turn….yep….
I’m sorry to say it, but you’re probably going to make a little money with that trade 🙂
refresh
https://uploads.disquscdn.com/images/636253a2491607df7a1a69cbae2b76e97c23cc8567f6422c18ce4d5278a0f040.jpg
CBWTF just popped again, but it still has the 50sma overhead. It held the 10sma rather nicely for 2 weeks
Stuck in ACBFF…I chose Unwisely. :-((
I actually chose that one too. It struggled at the 50sma and lost the 10sma, but it doesnt look downright ugly or bad , it just didnt get the follow through yet.
I bought as it started to try to break above the 10sma, and said to myself that I would sell if if lost it again, but it isnt that bad looking.
If the sector moves higher, I’ll be back in that one again
I know this is a personal choice but would you hold on here given the other movers or let it go? As you said it was looking the strongest of the bunch so it’s one I “think” I want to own. Thx in advance for response.
Its really hard to know.
I sold MYMMF when it broke the 10sma, and look at it now- back up at the 10sma, so these are tricky and there is no way of ‘knowing’ if the selling is real or brief.
Based on others, I think that the sector is starting to set up, starting to make higher lows, but they do move a lot %-wise, so a small dip could be a bigger dip that one wants to endure.
I cannot tell you, but I did sell mine when it broke the 10sma
Thx. Split the difference and trimmed positions.
Thats probably a good idea, lighten up and play it going forward 🙂
How can you be relatively confident its not a bear flag? https://uploads.disquscdn.com/images/213880182535a754aaeee158d2f505aa2e5777eabb0c7db20ce117ea72ed47a3.jpg
I use more than just price
Im sure you do, that’s why I ask these questions. I have the 90 sma in my chart, if I put in the 50sma price is below it, volume is dropping off. I am not trying to be contrary here, just want to learn so I can have more positive returns.
My chart shows the MACD, price broke the 10sma, setting up higher lows and now higher highs over the past 2 months, breaking above the 50 sma, volume increasing on buying, drying up on selling. RSI above the 50% again
Not really bear flag stuff, but if my recent low is taken out- then I re-asses
https://uploads.disquscdn.com/images/636253a2491607df7a1a69cbae2b76e97c23cc8567f6422c18ce4d5278a0f040.jpg
Thanks, #Rustysticks
Big sell off ( NAZ now down almost 200 points) and yet PXLW goes green looking like a higher low double bottom.
Thats interesting ( Like to see it gain the 10sma)
Added IAG.
Not sure if you mean ”short term trade/ scalp’ or buy to hold, but I would hold it with a stop because it is a FOMC whipsaw possibility in these volatile looking markets
Oh this is a day trade with a tight stop. Like mY CY short after i went long and got stopped out lol
I was thinking something similar,
because it is early in the daily cycle & it could go back up & tag the 50sma by Fed Wed
Hi Alex… or who else. Who know what’s going on with NG? (NovaGold)
It’s over 10 % up already.
Thanks for your response!!!
It has been acting well, and I mentioned it ( I think Last week, maybe 2 days ago when it broke higher off of the 50sma and Gold was selling off then). I cant find news on it, but it
landed on that 50sma and held up well
I dont know what is going on with it
NG and ASM interesting pop (
Not to mention KLDX 🙂
Hecla. Da Pain! Da Pain! At least I sold half sometime ago and now 60% cash. I believe HL will be a winner down the road.
With that purchase, I do too
NOG ….
That is actually a ‘buy’, based on the chart.
Another sector-
FLSR, JKS, SPWR, CSIQ, VSLR – Solars starting to look healthy again
TQQQ broke below the 50sma, I just knew that divergence at new highs was trouble and it would need a rest, but this is quite a drop
DJIA now down for the year
Refresh
I also mentioned last week that inability to make a higher high was trouble. The dow went from SO strong , to “can’t make a new high”
https://uploads.disquscdn.com/images/be0aec8cbb3b66f186fba7693bd7a1b3182081e65ca402729d5cff0cc2986d79.jpg
In Weinstein/ Oniel speak, this appears we are firmly in Stage 3 ……..no??
Alex what’s your spider senses tell you will happen tomorrow after a rip lower today and 1 day before the fomc. I still have a bit of $ at risk in 3 stocks and wondering if I should take 1/2 off and take yet another hit or take a risk? Was this the day the market fully priced in an interest rate hike or do we have more to go?
I’m playing my stocks separately.
I own AQ & CAMT and even NSU isnt selling off with steel stocks, so if they haven’t violated any of my boundaries, so I allow them to stay on board. AG is a tough one though, I dont want to give any more back and it is on the 10sma, but it broke an uptrend line & I’m not sure if that matters or not. I dont like it though
Based on today, Tomorrow can do anything. The Weekly Bog Picture showed internal weakness, so we have a 1 day dip now. Will it be 2 days? 3 days and then after FOMC a rally?
I cant tell yet
My thoughts too – I set a yellow alert half way to my hard stop and all three are riding it – so not a violation of my rules, but now I’m relying on hope that we bounce tomorrow. Fortunately if they all hit the hard stop it’s still a small % of portfolio risk. But I don’t like to think like that if the trend is against me.
Yeah, I’m seeing MU, AQ, SQ, TWTR, etc holding up ok ( Above the 10sma) , but if it was TQQQ – that is almost 1/2 way down the candle of the Feb lows already, well below the 10sma, even below the 50sma, so that could be tough. It may be a shake out at the 50sma by QQQ ( NASDAQ), but how low could it go by the FED MTG if it drops further from here. So my AQ and CAMT are holding up fine, I’ll hold, sold 1/2 of my AQ earlier, but want to hold some.
ENJOY THE SNOW!
I missed AQ but maybe I’ll pick it up on capitulation.
I’m travelling today on snowpacked roads so going to close up and go on hope for the morning.
I guess what really happened today is FB took the Nas down. BID is in nice shape and that’s always a positive if people are still willing to throw money at useless art.
Check out CAMT – use the 50sma
I like it alot – no volume lol but i dig that chart
This is one RED day! https://uploads.disquscdn.com/images/92c981744f64170da3f79367e9592a83110bec0741bf1ff2e20c6ec31a1a05df.jpg
That it is
added a little to SVBL, FFMGF, MUX, AUG, and SILJ, but still only 33% invested overall so hoping for a break below 2016´s lows in HUI, which I am aware might not happen bc would be too easy. I have to buy them sometime, and I have to be in BEFORE the big up days, so that´s why I am starting early. The HUI is only 5% away from that low now, so I am paying more attention as we get closer.
I have to admit I am hating miners at worst, feeling apathetic at best, and about the only thing they have going for them is I felt the same way in late 2015.
$BB bounced off TL during market hours and then came the news…missed my buying opportunity to add. 🙁
The Tuesday report is out