
March 3rd – Where Are All The Bulls?
Almost all of the Markets have become choppy over the past few weeks, so what happened to all of the Bulls? We have found a few Bulls that seem to be moving forward, and I will discuss those in the report. The others may need to be coaxed out of the fields of consolidation, before they can enjoy a nice solid run again. Let’s take a look at what happened last week?…
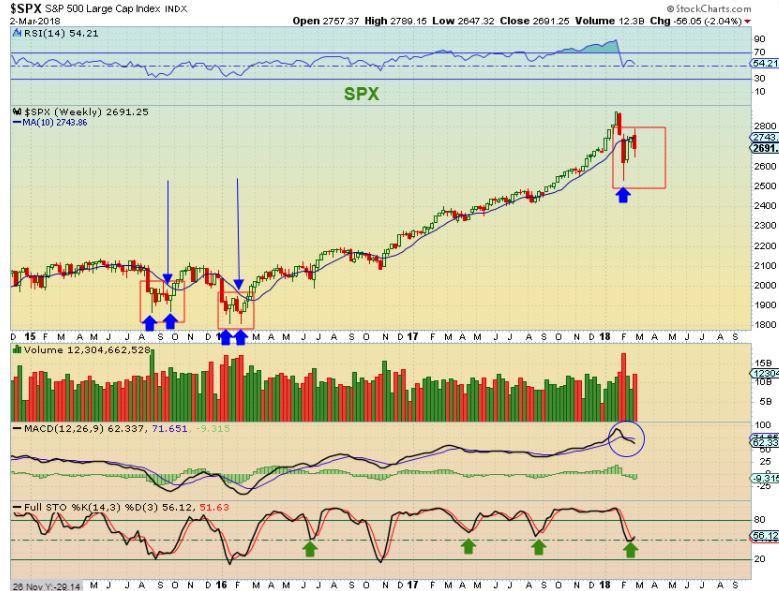
SPX WEEKLY – Here we see that the bounce of the past 2 weeks has curled up the stochastics, so maybe the selling is done, but I have been expecting a test of the lows. Compare last weeks drop to what we saw out of the lows in 2015, the bounce also looks very similar, so …
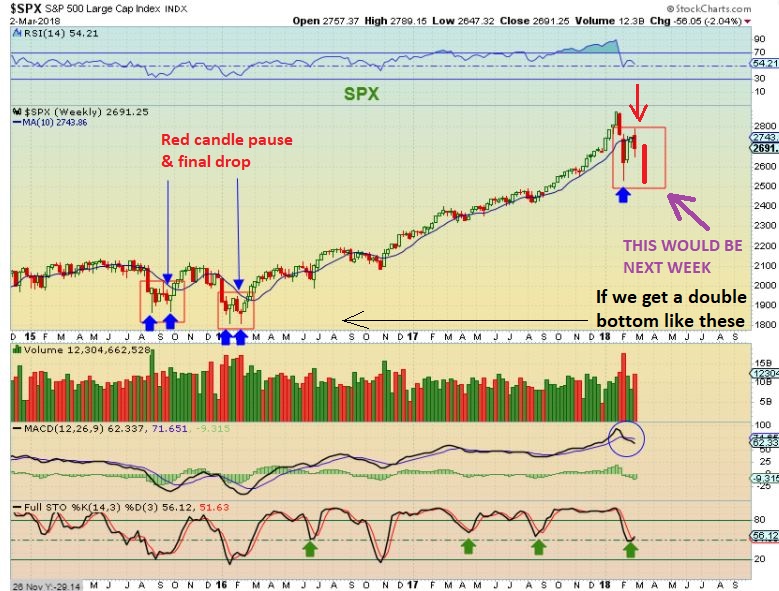
SPX – If we are due for a double bottom low, next week could be another down week, as shown here where I drew in an extra candle. This would match the 2015 double bottom lows. Read the chart.
Lets take a look at the flip side.
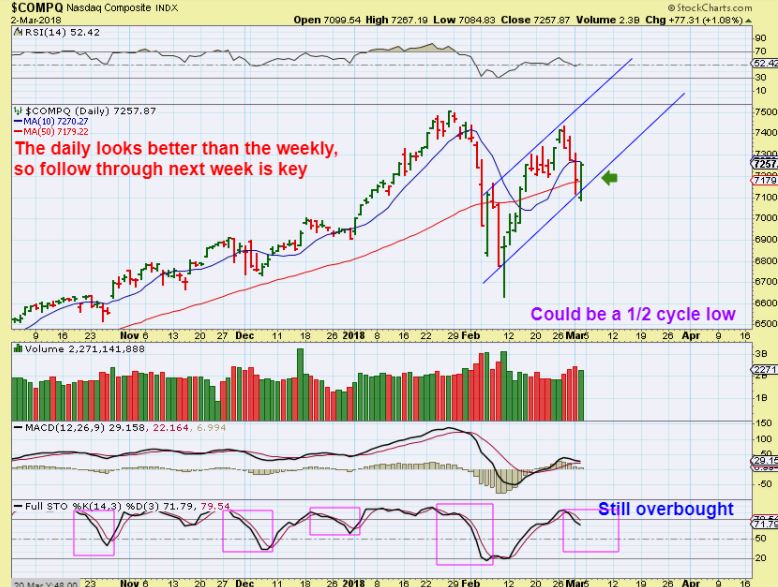
NASDAQ – The NASDAQ daily chart actually has a bullish look to it. This could represent a 1/2 cycle low and FOLLOW THROUGH HIGHER next week is important. This would be bullish if NASDAQ could resist the selling.
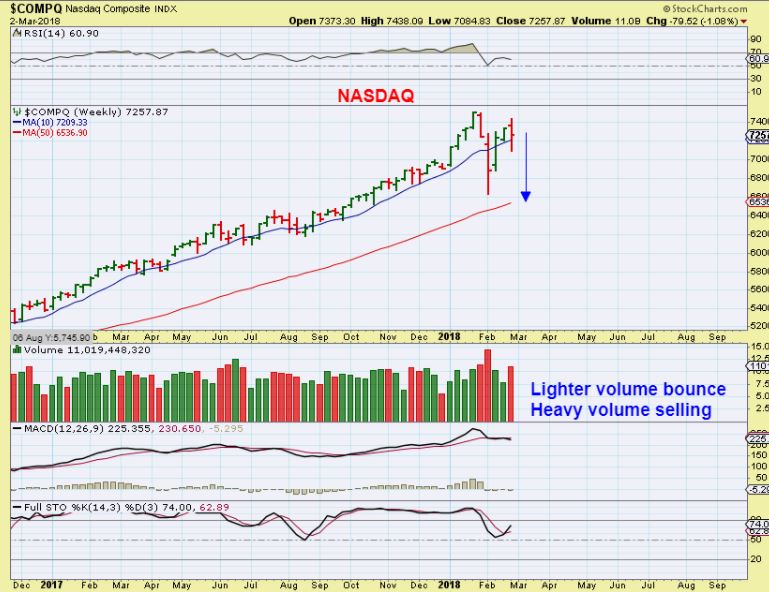
NASDAQ WEEKLY – We are on day 14, so this could still drop to the 50 weekly MA and put in a double bottom low too ( testing the ICL or putting in a lower low , the true ICL. Let me explain something else…
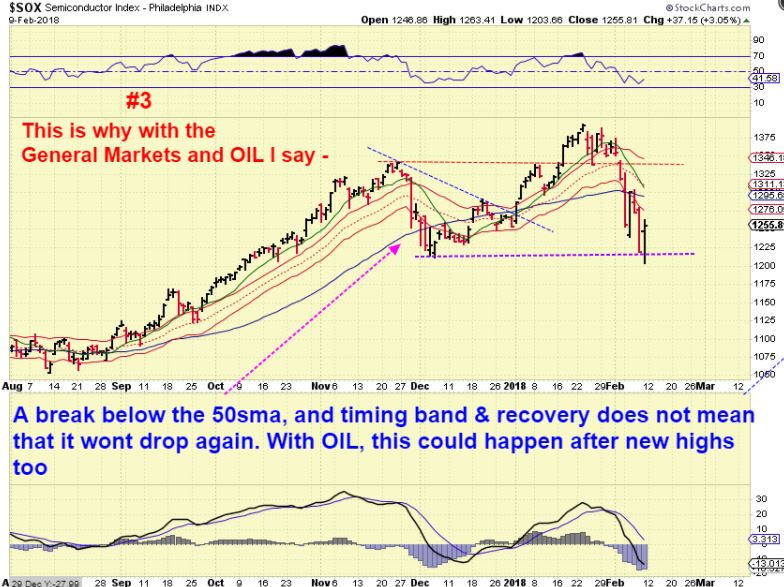
SOX FEB 9th – I posted this in early Feb when too many people seemed to be buying that dip & discussing ‘the Bulls return’ and a strong run higher coming. CNBC was very happy with the bullish v-bottom. I pointed out that the SOX also 1. Broke above the 10sma & 50sma, and also a down trend line, but that didn’t mean it wouldn’t roll over again. I saw weakness in the MACD & other indicators as the General Markets climbed higher, so NAZ, DJIA, and SPX could roll over too. Now they have started to do just that. Remain cautious and …
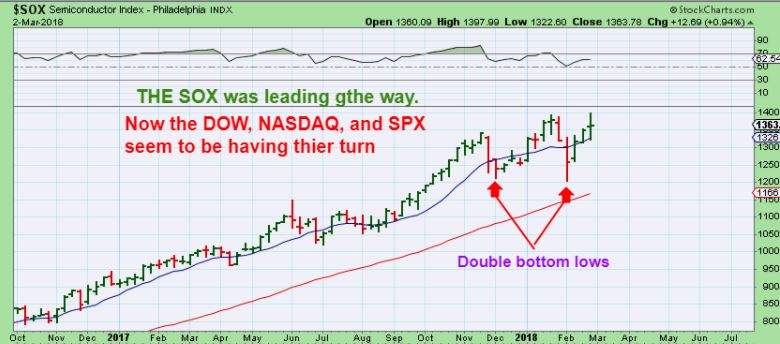
SOX – During this General Market sell down, I have recommended MU, CY and other Semiconductors, because that sector already seems to have had their period of selling. MU & CY now still sit at their highs, even as of Friday. Read the chart if you are long SPX, DJIA, NASDAQ.
WTIC #1 – Oil dropped this week after the inventory report. I have been expecting this drop with the COT reading and cycle counts. This weeks COT level was still quite bearish for Oil.
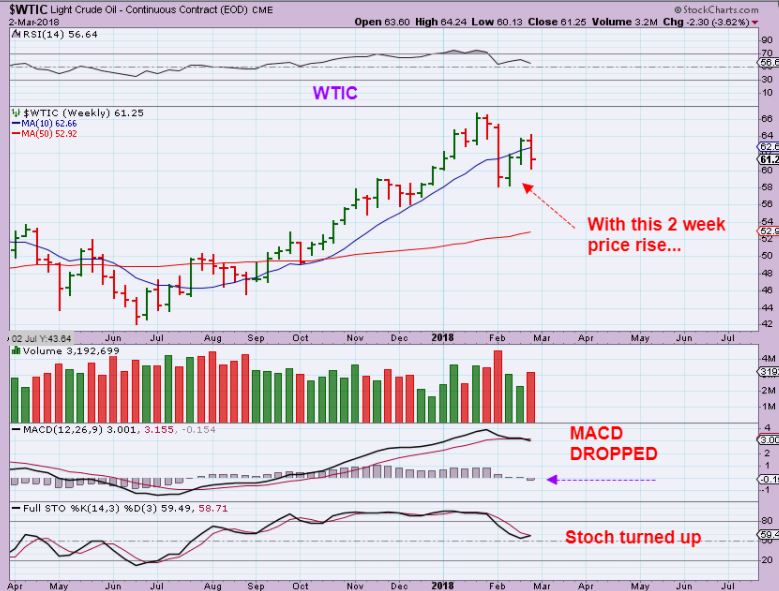
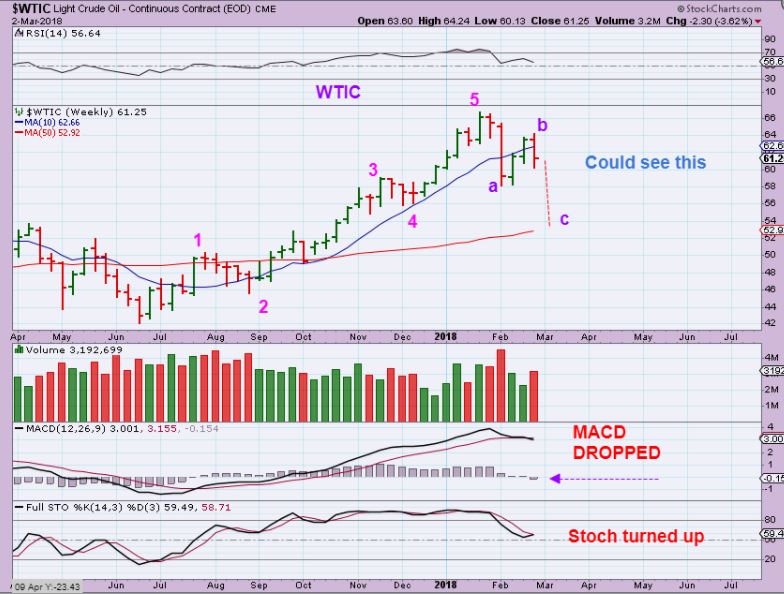
WTIC #2 – An a-b-c drop here would fit an E.W. count rather clearly. Oil $54ish? The MACD did not respond to a 2 week bounce.
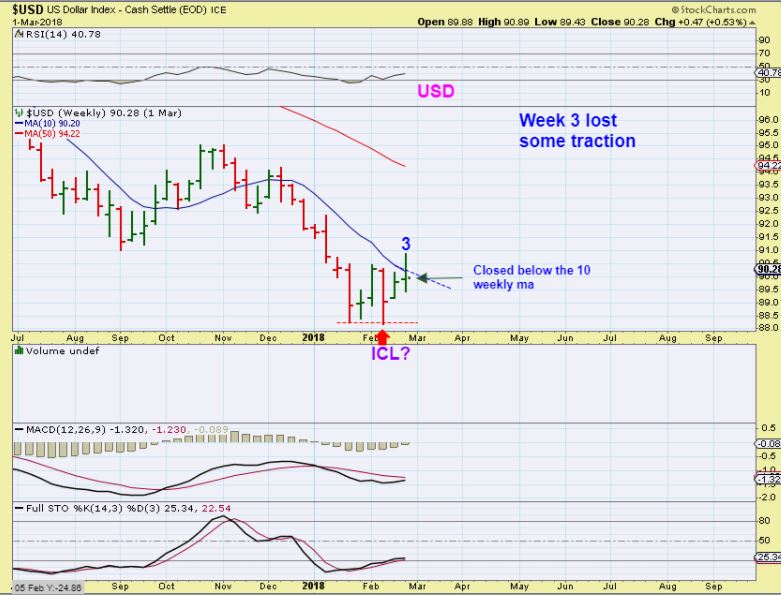
USD WEEKLY – The weekly closed below the 10 week MA, but the daily indicates to me that the USD can continue higher.
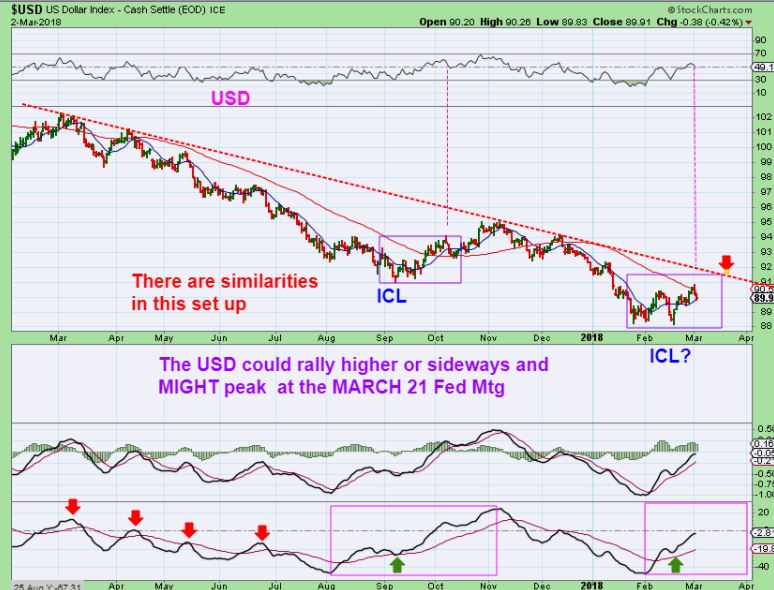
USD DAILY– This chart seems to indicate that the USD can make another move higher to 92ish? This implies that Golds failed daily cycle will lead to lower prices too. MAYBE INTO THE MARCH 21 FED MTG?
Precious Metals: This is not your normal, predictable behavior during this choppy, sideways consolidation. I want to look at a couple of ideas here, because obviously more than one possibility presents itself with this type of choppiness.
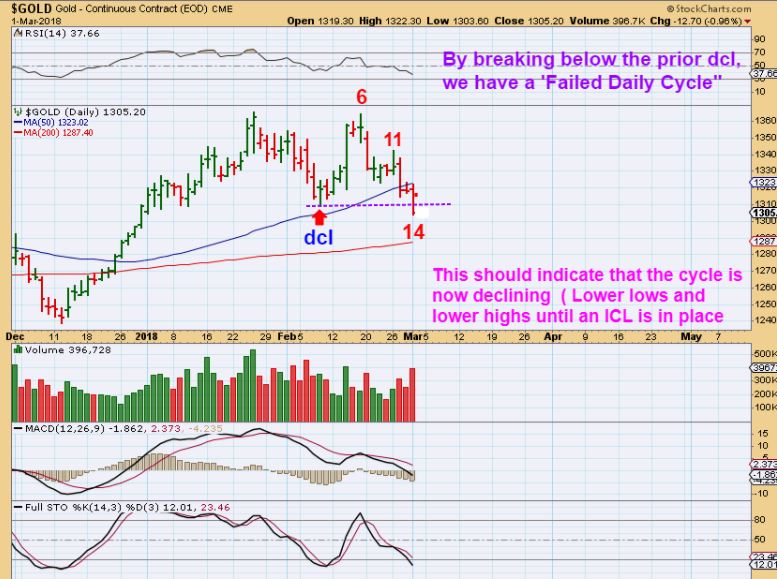
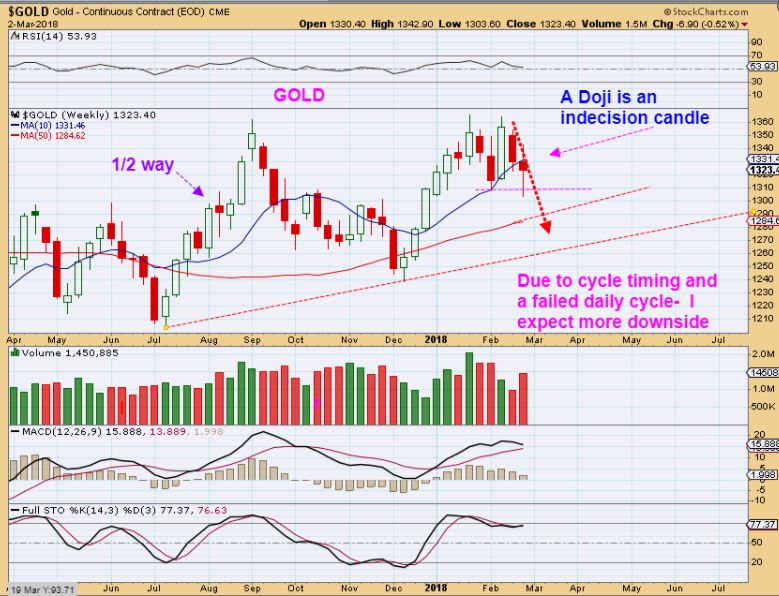
GOLD DAILY FROM MARCH 1 – Gold had a failed daily cycle indicating more downside eventually, until an ICL is reached. Read the chart.
GOLD WEEKLY #1 – A doji is indecision. It has reversed the downward direction with some buying into a close, but a Doji on this weekly chart can be a 1/2 way point on the way down too.
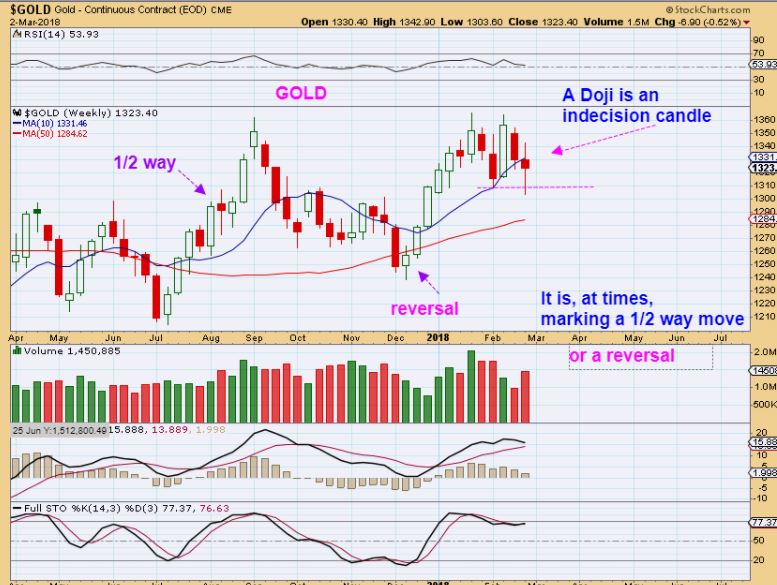
GOLD #2 – So I have to expect at this point that Gold will drop further, maybe even into the March 21st FOMC MTG.
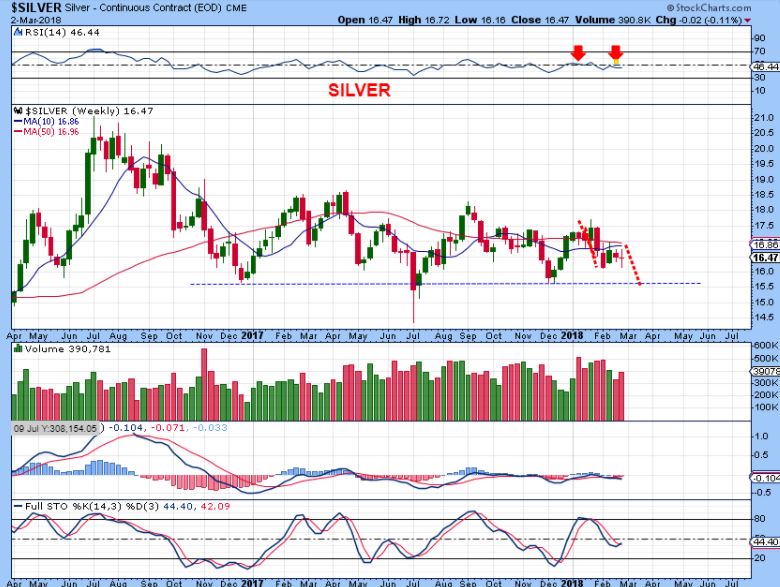
SILVER – Silver has been going sideways again week after week. The Silver COT improved again! It is at ICL levels. Very interesting.
MINERS NEED TO BE DISCUSSED SEPARATELY
Miners acted separately from Gold, right?
1. In early February , Gold held up near the highs, Miners dove down and broke December lows.
On the surface, this is what it “Looks” like –
2. It would seem that GOLD will now gradually drop to the next ICL over the coming weeks, and it would seem that since Miners are already at their lows, they will just crash down through all prior lows and run stops.
THIS SCENARIO SEEMS LOGICAL AND YES IT MIGHT HAPPEN, but let me also discuss an outside scenario that no one else is probably even considering possible. The good thing is that we will know very soon if this scenario that I’m about to mention is wrong.
Let me tell it in the form of a step by step story…
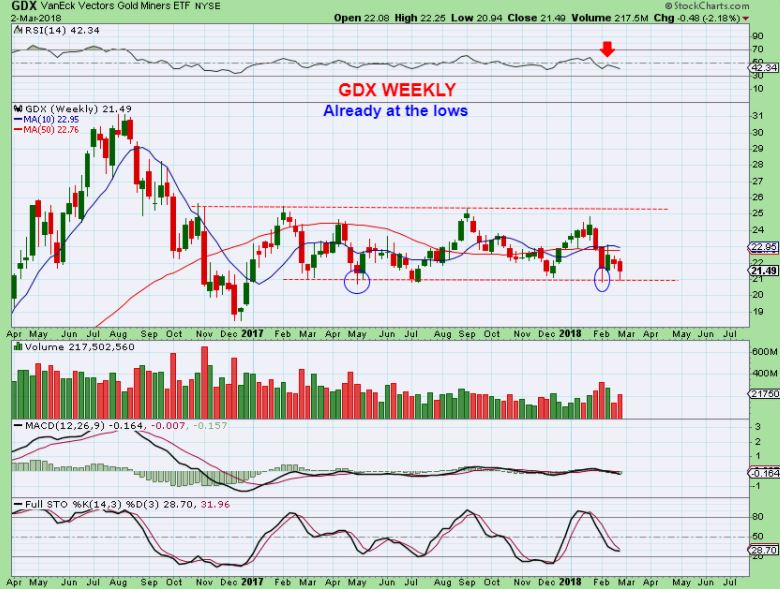
#1 GDX WEEKLY – Miners are right back at the lows, Gold is not. It would seem that if Golds failed daily cycle sells down in the future to an ICL, Miners will have to drop lower much further and break Dec 2016 lows for a stop run. THAT IS POSSIBLE, HOWEVER…
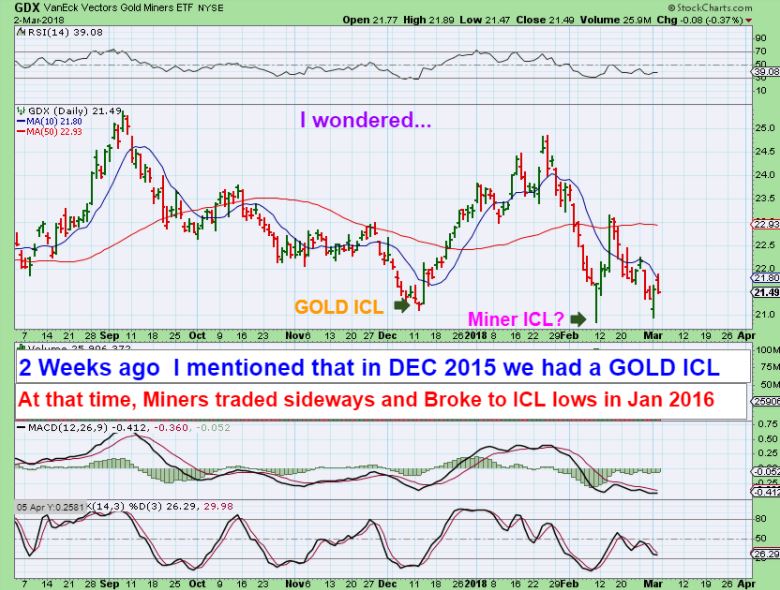
#2 GDX – Do you recall when I said that Early Feb looked like a possible ICL? I then referred back to2015? GOLDs ICL was in DEC 2015, and Miners ICL was actually put in 1 month later at JAN 2016. IF THESE FEB LOWS IN GDX ARE TAKEN OUT, THE IDEA of an ICL GOES AWAY, See the chart, HOWEVER 🙂
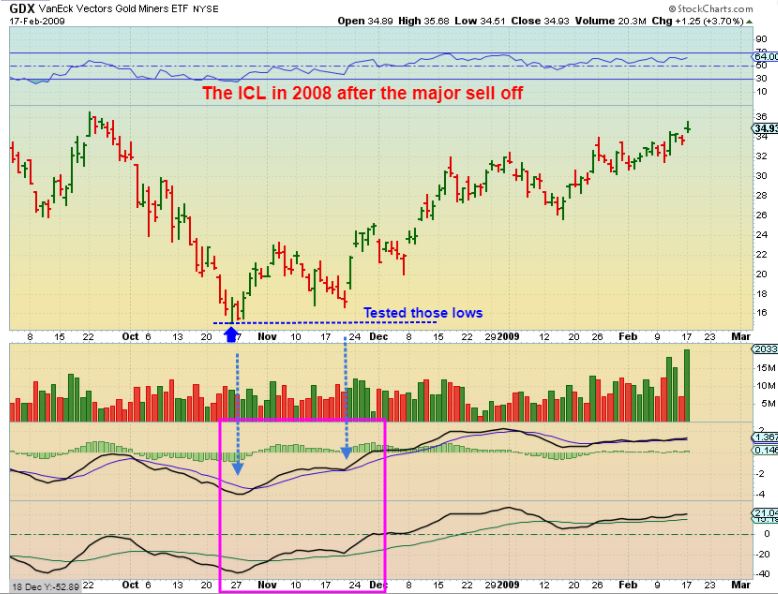
#3 GDX ICL OCT 2008 – The ICL in 2008 ran higher and dropped almost all the way back to the ICL LOWS, but never broke them. That is what we just saw in GDX now too. This just shows us that IT CAN HAPPEN, So until the recent lows are taken out, that ICL in Miners idea is still a possibility. AND…
#4 GDX – I Feel like I am hearing EVERYONE say that they are “Waiting for the ‘Stop run of Dec 2016’, and I’m going to buy the daylights out of it!” When everyone is waiting for the easy buy, it almost never happens, so what if Gold drops and Miners didn’t, similar to when Miners just dropped and Gold didn’t?
1. If that was an ICL in Feb, and Gold drops but Miners do not, I am thinking that No one will buy it, as this sideways chop continues.
2. But many ask: ‘Doesn’t the long consolidation shown below have to run those stops?’ It would certainly be EASY to run those stops, however…
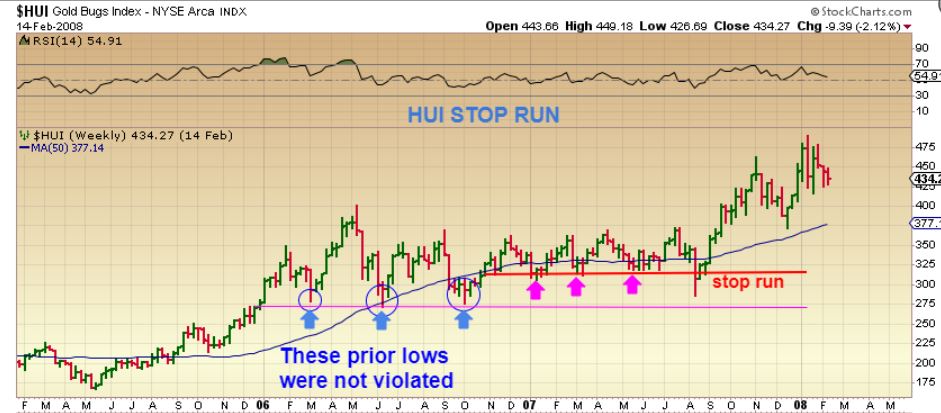
Look what I have found! In the HUI 2007 Consolidation, Not ALL of the prior lows were run in PAST consolidation periods. This may have left people behind too, waiting for that final plunge. The 2 Purple Arrows were never taken out…
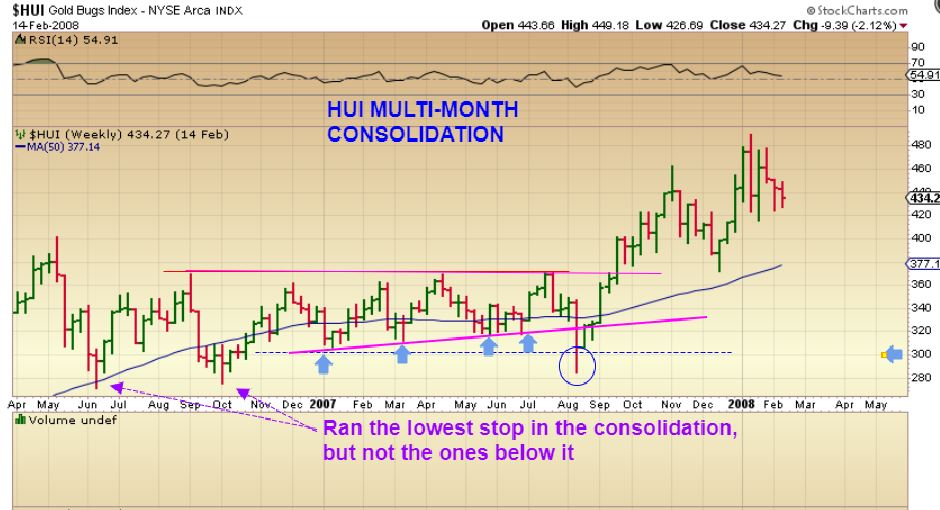
Again 2006 & 2007 – Notice this is a similar set up to our current sideways set up in Miners.
3 Lower lows at the blue arrows did NOT have their ‘stops’ run. We MIGHT see something like this and many will not buy Miners, waiting for that drop.
The above several charts of a possible ‘shake out ICL’ taking place in early Feb are just a thought to keep in mind for now. If GDX Feb lows are broken, we can immediately dismiss that idea, realizing that the ICL would lie ahead, and probably will be that stop run. If Gold drops further toward its Dec lows and Miners do not sell off ( say they bounce around & go sideways) , then the GDX:GLD will rise and Miners will be leading in strength.
IF Gold sells off and Miners follow…
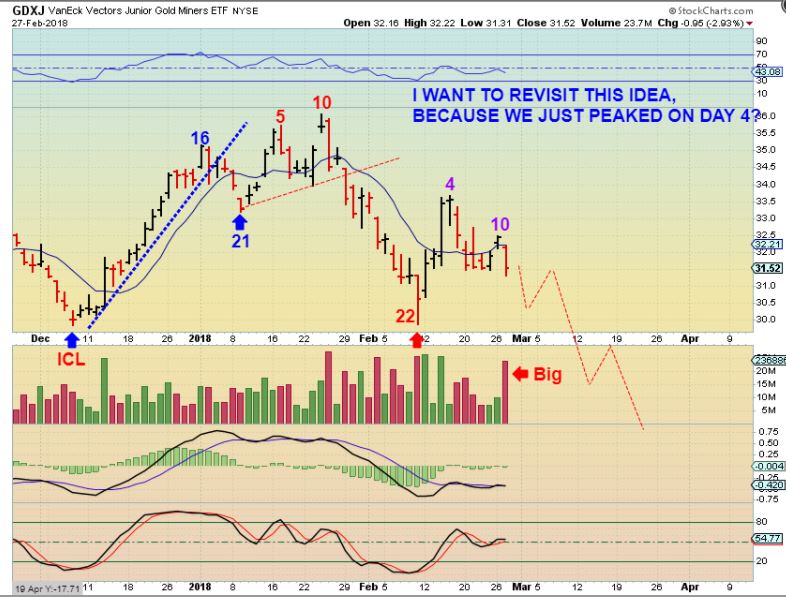
GDXJ DRAWN FEB 27 – This could be the 3rd daily cycle, dropping into the next ICL.
I hope that that was clear enough to follow, but don’t worry, I will be covering the Precious metals in daily reports going forward. With that, ‘Time & Price’ will reveal the current situations real intentions, and we will be able to benefit from the next run higher when the time is right. That 2007’s sideways chop was just like this, but it did eventually come to an end.
.
So here is what my Big Picture thinking is for the Precious Metals. We saw Miners put in that SOLID SPIKE HIGHER in early Feb when? When the CPI numbers showed Inflation was a bit hotter than expected. SO? If THAT spike isn’t the ICL, I think that it was at least a preview of whats to come as the Catalyst for the Precious Metals to finally get moving higher. Inflation in Steel, Copper, Aluminum, and other items will creep higher and the next surprise in CPI or FED MEETING reporting could be the catalyst for the break and run we need to get out above this consolidation. It is still a matter of time, but that SPIKE in Feb at the CPI numbers seems to indicate future intentions in this sector.
The General Markets are pretty much acting the way that I thought they might, and they could be following what the SOX already did- a double bottom low.
OIL is also finally dropping down to seek out its ICL. I am thinking that an a-b-c drop is in the cards. Some short term trades have resisted the intensity of the selling ( MU, CY, GGB, and ENPH actually remain at their highs, some Metals stocks perked up like CLF, AKS, X, etc etc) , so as things play out, we still may be able to trade successfully, but the key is NOT to swing for the fences hoping for a home run in these choppy markets. We can score some runs taking smaller gains too. Keep position sizes small and manageable, and cut them loose if they go against you. That is a wrap!
Enjoy the rest of your weekend!
~ALEX
I mentioned that I bought CLF, and posted charts of other Metals stocks.
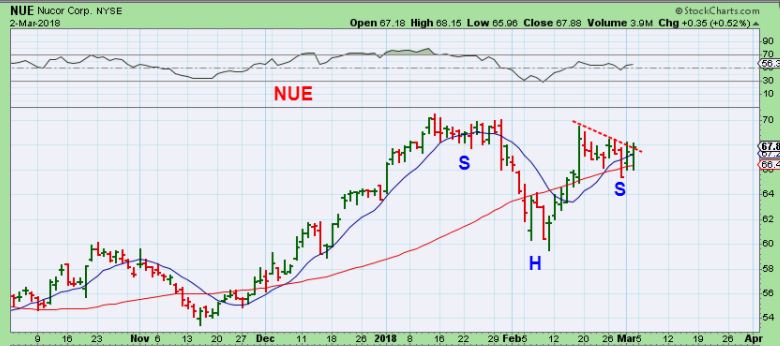
NUE – NUE, CLF, STLD, X and others still looks great despite Market selling.
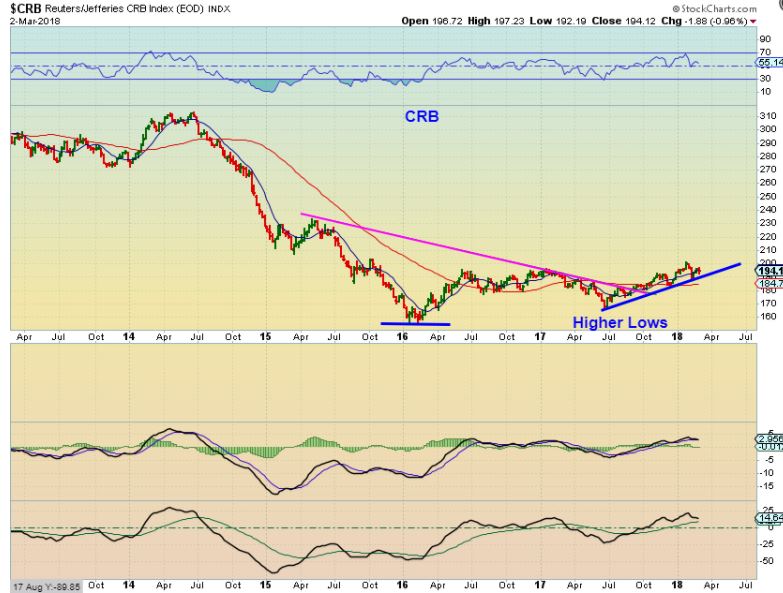
CRB – The CRB bottomed and put in a higher low and is climbing higher in stair step fashion for 8 months. Prices may be rising too, and inflation could be in the future.
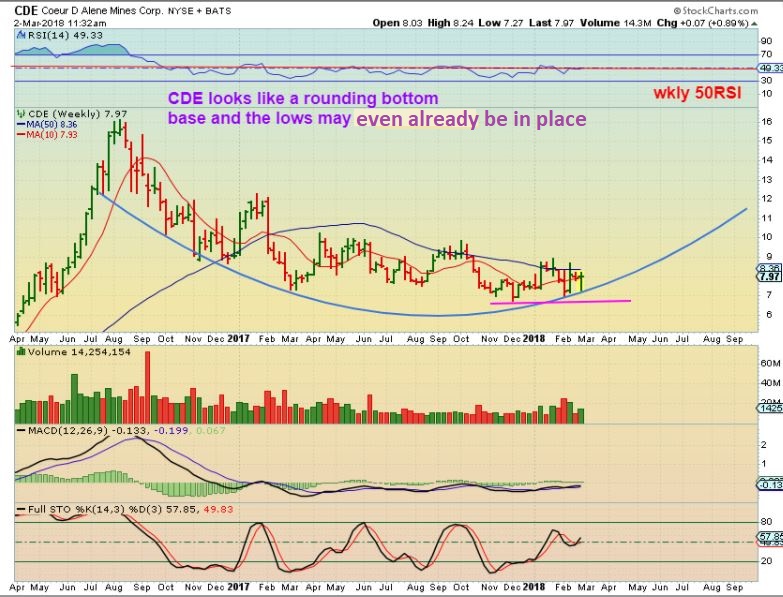
CDE – When I look at some of these miners, they may already have their lows in place. CDE looks to be forming a round bottom
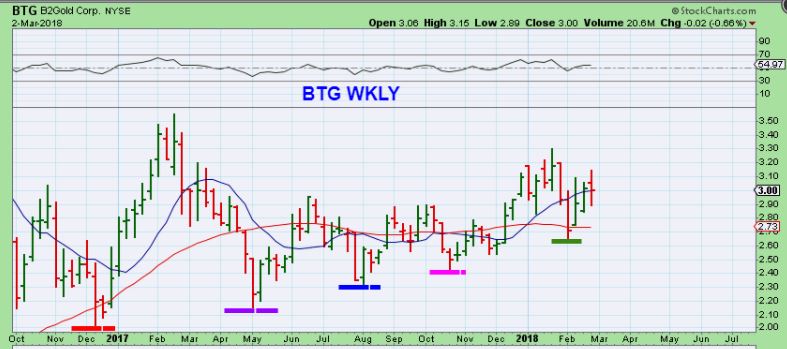
BTG WEEKLY– I have already mentioned a few Miners that do not look threatened by any future sell off. BTG looks to already have its lows in place back at DEC 2016. Each sell off to a higher low was a buying opportunity that has not been violated.
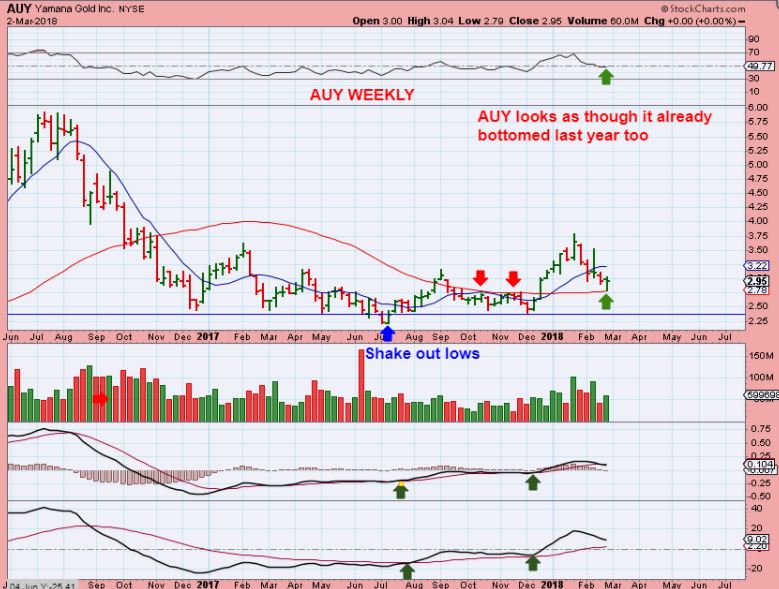
AUY WEEKLY – As mentioned in the past, THE LOWS may be in for AUY too.


Great Job done ALEX, Excellent explained!!!
Thanks a lot, and hope your hand will soon recover nicely!
Hey Geurt!
How are you? I hope all is well up there in the Great White North! ( and thank you) 🙂
Great summary…tx LaFreak
Say.. u posted a similar pic of u & some bulls a few yrs back.shirt&tielike… 😉
Ha – Quite Observant, very good.
The same farm & probably the same black cows ? ( the brown one is new though).
That pic was actually taken earlier today.
Apparently we stop at the same farm on the way to Weddings heading North in N.H. ?
If you want to meet these cows, you’ll need to travel Rt 16 North in N.H. , up near the Lakes of Wolfboro 🙂
😀
ha.. i remember that one… mightve been one of the first CF posts i read
https://uploads.disquscdn.com/images/9dff10ff09a622217353e027e264f10ff7e77480a5a6a9e88770ddb481d325ed.jpg
ahahahahah…. thats awesome!!
can you find the blueManGroup one? i gave up looking for that too ….
whats the blueManGroup pic like ? .. is it from the same CF era?
I have it
…………………………………………………………
Haha…I do not know that bull, sir 🙂
#DifferentFarm
giggle….
Hi Alex,
You mentioned you bought a couple of positions in AG last week…..where is your stop considering gold is in a declining phase? thx
I did, and 2 reasons I bought AG were
1. They kind of “Missed ‘ on earnings and that day was a drop & then a strong reversal to green (it was also a sell off day in Gold). Earnings behind them and ended up green day anyway
2. Silver just seems closer to its final low, especially with the COT
My stop will be under the recent lows below $5, and If it gets hit, I’ll need to make sure that my other positions like ENPH, CLF, etc remain gainers to offset the losses – lol
interesting 5yr daily chart for a ppo indicator of Bullish Miners Index relative to price of gold $BPGDM:$GOLD.
GDX is shown above.
a big coil which presumably will be broken to the upside when miners finally let rip.
question is whether we get a trip down to the rising lowest green line first?
https://uploads.disquscdn.com/images/1caeb0f2cfabd0cdbf0e4a857a292c18175d95a1867ef3c55000fd9feeabe5d0.jpg
It’s always something, right? A drop to the lower green line would probably be a stop run in Miners but it seems that it would have to be quite a drop for MIners PPO to drop that far on a BPGDM:GOLD, right?
not sure of the exact miners price scenarios which would take the ppo down to the green line.
all you can say with certainty (i think!) is that miners sentiment would just have to get relatively more bearish faster than gold price falls
edit f5
CF, nice chart and pick up on CDE- this silver stock has been marching to it’s own tune lately and had my eye.
I dont want to jynx them into an acquisition/financing like I did AG, so I’ll zip it.
LOL- I know, I feel that I point out a great looking buy and they suddenly dip down from a financing or something 🙂
I will say that I am way more than curious about the SILVER COT vs the GOLD COT.
Golds doesn’t stand out as anything, except that maybe it is in need for a pull back.
Silvers COT is really quite bullish. The retail or dumb money as they call it (Speculators) are actually net short now.
I can’t remember when I have seen that last.
So I have been looking at AG, CDE, PAAS, SSRM, EXK, AXU, etc long term weekly charts for clues of a Low in place?
I think Silver stocks, when they finally finish selling down & Silver rallies, are going to be very fast %-Gainers
And check out this chart ( refresh) For example. The daily ‘wiggles’ are there, but this is rock solid so far
.
https://uploads.disquscdn.com/images/287df75628a14e568a07523c9a4ef4b4247c42bded4e14d662631524d655998d.jpg
,
IF it sells down, it’ll be a shake out most likley
Call me dumb money but I’m still holding 20k worth of AGQ.
Alex, if the running theory is that gold is moving into an ICL, can silver operate on its own between now and the gold ICL?
Time will tell.
I have never seen such a difference between the 2 C.O.T readings.
Normally doesnt silver lead down & Gold lead up…??Goin from memory & recliner…not chart.. 😀
….. Would be pretty cool if there’s a disturbance in the force …..
Alex, what are your thoughts on LVS? Cup and Handle?
Dec 2016 to Sept 2017 daily or especially weekly chart.
I dont know what time frame you mean now, but I dont see a new cup & handle
Sorry, weekly chart
https://www.tradingview.com/x/cGCv2Gpp/
Well, it’s just forming a cup at this point. No handle, could be a double top, could just break to new highs and run.
Oddly, Stockcharts shows that chart very differently. Stockcharts is wrong again though
if you enter _LVS you will see the chart is the same. A _ in front of any chart eliminates the dividend adjustment
Is that split adjusted
i believe so; it’s just the dividend that is taken off.
Added to my TRXC position.
Kind of risky as a biotech, but avg cost is lower near 50sma
I’ve been watching this one for a while ( Actually been watching VUZI & VIPS, but chose to buy VUZI friday as it bounced off of the 50sma). Thinking of adding this morning, with a stop under that 50sma
https://uploads.disquscdn.com/images/aafd93aff5bc02b3cd65ab3f84925ad58c04cc75b9d2ba05865cf6a898d3e11c.jpg
MU – hellllo
Sold mine at $47, too early! 🙁
IMLFF, CBWTF, MYMMF, and some other MJ stocks looking good.
I would be impressed if IMLFF gets above the 50sma
TWMJF is challenging its 50sma too
Check out BLCM… Im diggin it
IMLFF got conditional approval last week to trade on Toronoto stock exchange…..have to meet certain filing requirements by May 29 to be permanent…..CNTTF has approval and started trading on Toronto exchanage today…..
IMLFF not only above the 10sma, but today it broke pretty strongly above the 50sma.
This is what I was hoping to see in this sector. If others follow, it could be indicating renewed interest in the sector after that period of sideways consolidation..
TWMJF and MJ are both up also…I kind of watch them also to help me see how the sector is doing….when they’re down most others are usually down too
Sorry I did not wait to buy POTN.
Yeah, I don’t know what’s up with it…they’ve reported greatly increased revenues and yet it continues to fall….:( 🙁 Not making sense to me..
Yeah…more good news today….and it goes down?!
Yeah…I’m thinking in the back of my mind….does someone know something that I don’t know??
Well, of course a bunch of folks know something I don’t…….hahaha….
Kicking myself for not getting MYMMF like I started to last week…..argh
FWIW … I still see bearish signals on my charts to TQQQ and I am watching closely as I think there’s a good chance it could drop hard today and tomorrow. Just passing my thoughts along, as always check your own charts, make your own trades and follow Alex’s guidance.
To be clear, I have NOT sold any of the TQQQ I bot last Friday and I’m pretty much back to “all in” … but I have a relatively tight stop on a portion of my TQQQ in case it drops today and/or tomorrow. And, of course, I hope I’m wrong about the drop and the stops never hit.
So far, TQQQ has bounced off its 50 day MA today, hopefully that’s as low as it gets. https://uploads.disquscdn.com/images/69b24c7b188844f73a29a8c88d858e086e097dda13b8ea8e02c82f4356196f40.gif
So far, so good with TQQQ and SOX rallying. But I’m leery of early morning rallies, they can roll over by 12:00 Noon ET and head down so I’m still watching carefully.
https://uploads.disquscdn.com/images/b6e7b0d926bb619c0cd4f0fca50a1eeecfb5d4273885b0e834e0cf6b8b5705eb.gif
NASDAQ could have put in a 1/2 cycle low at that 50sma reversal.
First NASDAQ chart in the report shows a possible channel forming.
Follow through higher this week is key
yep, the follow through part is making me nervous, but looking good so far today. https://uploads.disquscdn.com/images/4f86f3e46a2c190e34e05c9c56c5bd34b80b969b4bab435b8b5fa534d7e232ed.gif
Pretty strong support at 159 level on TQQQ. I have my stop a bit below that.
As most here know, I’m very bullish on TQQQ and the general markets but I’m also keeping an eye open to the possibility of a deeper drop due to some bearish signals on my charts. A strong rally today lessens the chances of another dip.TQQQ is now above the 10 day SMA. If this holds into the close it will be a major relief.
https://uploads.disquscdn.com/images/51641a057a042b4af707e4a5143d087a652d35dcc923ccb2b96d44babbf62dfa.gif
Im glad I didnt sell out of mine… But im waiting to follow u out.. lol… Im up 10 pts on the trade so far on a starter so Im happy – for now
Don’t follow ME! LOL
I’m the idiot who sold last week the day AFTER TQQQ peaked then had to buy back it all back on Friday before price got back above where I sold out. I’m now back to my “Plan A” which is to basically hold onto TQQQ for a few months into an expected IC top sometime in May or June. Today’s close was great, better than I hoped for. The bearish signals on my daily chart of TQQQ have now flipped bullish and I can finally relax for awhile. https://uploads.disquscdn.com/images/715a433d5491779d2e53137ddde3f3cad65b031cb4e2f602af1a86ef79a8da10.gif
Well, Im out, I just locked in my 150 shares in AH… just shy 10 pts… Cant be mad… I need 120-140s for entry to go as heavy as u and be comfy
Nothing wrong with booking profits, and as your name says you are “day trader” by nature. I’m trying to take the LONG view. Every year I like at the 1 year performance of TQQQ and say “If I just put all my money into TQQQ and ignored that market for a year I’d double my money.” Of course, that’s always much easier said than done, but I’m trying to get closer to that idea this year than I have in the past.
Thanks Steve,
XBI about the break it’s downtrend line that dates back to late Jan.
https://www.tradingview.com/x/lvZsoKnU/
XBI looks very bullish on my charts. I’d like to see my TQQQ get back above its 10 day SMA.
SOX looks good to me too
https://www.tradingview.com/x/pH3slEhY/
Yes, SOX looks good too, just need my TQQQ to get over that 10 day SMA so I can breathe easier.
Downtrend broken. I’m going to buy half now and half on a back test.
I went in last week Wed-Thurs. Scary at first but great now!
I was definitely nervous at the open. Clearly, I’m glad that I stayed the course today.
Case – I’m still getting acclimated with options… what’s your take on March 18s for CY?
I dunno, don’t really see risk/reward here. 35% implied volatility is high for regular non-small cap stock. Needs to get to $18.25-30 next Fri just to break even. If you thought it would move big could give with a straddle, bc you habe max defined risk. But I’d keep it small.
If I was long and holding I’d sell $18 covered calls at $.30 against the position in case we correct and pocket the premium.
Refresh: SWN did exactly what I mentioned it might do when I bought it.
I mentioned that I would sell at the 50sma, and it tagged it today.
Now I will watch to see if I want back in later.
https://uploads.disquscdn.com/images/791ba1674e48829c242e0cbd6521dd39a3f1f84032f379283e28f6d8d97c6204.jpg
LHSIF trying to recover the 10 day, heavy volume day
CRON started trading on Nasdaq on 2/27….
IPI double bottom off of the 200sma, on earnings release Feb 27th.
Looks very goo today with string volume
ooo… hmmm.. nice.. maybe ill buy that imminent spike down … now that u posted it…
lol
haha- you mean I jinxed it and you’ll buy that dip? 🙂
Funny.
I was watching DDD and VJET, and DDD has acted very well lately too.
EDIT: And XONE = same sector
SO MANY chart set ups after a sell off.
ENPH.. oooo
yeah, I’m still in that and I dont think the gap wants to fill (yet anyway)
SRPT… tx for that on.e .. nice…
dang… IPWR
LGCY still hanging tuff…. 😛
LGCY was awesome, but I did miss that whole move this time
exaclty….
*or the Shark in the room…
MOS & MON ( ag stocks) also look rather bullish
I sold my SQ, but it is breaking out nicely today – similar pattern to MU consolidation
I still have MU, TWTR, AQ, CASA, ICHR, MULE. Made only small profit on SQ as I’ve never been able to play that one properly for some weird reason. Pot stks running sweetly too:)
Nice plays Kathleen!! Very nice entries as well, been watching your posts!
Thank you kindly; just trying to point out what I see and what I’m doing:)
I own AQ also, sold my MU & SQ & flipped to AQ because it looked ready to break from that consolidation the same way as MU did when I pointed that consolation break out . I still really like TWTR, MU, CY, SQ, long term.
I’m not sure I like the ICHR chart .
Bought IPI today , added to VUZI, TRXC, MYMMF and CBTWF
Now I have too many positions again, still own AG, NSU, ENPH, CLF,
Chartwise, which one looks better – AQ or CASA?
nb: CASA earnings a/h tomorrow.
They are both beautiful charts and could extend upward, but I will just add a thought…
CASA earnings could really get this running, or you get that earnings drop? So a bit more risk.
AQ seems to just be getting moving, could have further to go, and I think earnings was 3 weeks ago, so a tad safer.
I dont want to sway you to sell CASA and then have it rocket higher, but the earnings is always a factor
KPTI also nice. I added 16 area today to my swing position.
PAGS – the Brazilian SQ working nicely (stopped out of this and never re-entered lol!), but it is a good one IMO:)
KPTI has had a nice run after breaking out, as long as it doesn’t back test ( 2 yr weekly).
Could keep running.
I know , I sold out of SQ last week and never got back in, but I love that set up as much as MU
🙂
OIL ( or USO) actually now has a bullish set up ( short term anyway).
CF. The 2 charts give a little different view.. but even more interesting is that OIL has followed the Stock Market exactly since the January 25th high, to the February 9th low, to the February 26th high, to the March 2nd low.. Will OIL break out to new highs when the Stock Market does in a couple days ? or does it finally diverge and finish its ICL ? Inventory has been building so I wonder if its going to take 1 more bad Inventory Report for it to finally give way.
The chart looks rather good right now, tough call. If I didnt see the COT, I wouldnt think it was in danger of dropping at all.
Refresh for 2 charts
When I recommended MU weeks ago, I used this chart to show the breaking upward from a consolidation.
AQ has a similar consolidation and a move up & out of that sideways move. So I compare the AQ set up to the MU set up weeks ago, with a stop under the triangle
https://uploads.disquscdn.com/images/4c1683d1c495c2eba6a9b3633271d32105ca472708f08c2c679f1d0c0eaf127f.jpg https://uploads.disquscdn.com/images/892f6c89b496933f7cbd0b89cdd0b7966c8da22e18f7097f176aea5926c4cc62.jpg
I have a possible minimum $20 price target for AQ
MU does NOT look like it wants to add a handle on this chart 🙂
https://uploads.disquscdn.com/images/8707d2d7b8d6269f8f788f68c35fc3214428cb90790d6a2beb80da38920c6072.jpg
AB=CD would have it going to $60.
dont u mean .. 160? ;o)
on the weekly…. ha ha
no #vacationtrader! $60
hahah .. well… if i look at it sideways.. it does look like
1985-2000 is a “1”
and
2000-20008 is a “2”
thennnnn slap a fib on that puppy … 1.618 is …. 160
😛
**ish
Anyone else still in ENPH – ENPH really stretching out, up 9 % now. That Gap doesn’t look like it will fill. Like a power gap, we saw that in TWTR a couple of times too
Still holding. Looking for mid-$4s on this run
I waited b/c earnings were due out so I missed it. Should have had a starter, but earnings spooked me. 🙁
… it’s makn me sweat … a little… teehee
Thank you for the comments and the charts, CF. No wonder AQ chart seemed so familiar lol! Yes, it was niggling at the back of my mind:)
You are the one that reminded me of SQ a week or so ago , so thanks back at ya..
Also CASA , but I havent done anything with that one yet 🙂
TRXC looking good, but I’m going to need some buying help with that VUZI trade 🙂
i like it…soon at it finishes chewin up that 34 … maybe then it will ignite.. ;o)
woop
34 sma?
sorry yes
*the one it just ate thru… giggle shh
GOLD DOWN, HUI up 🙂
I remember that song….
GOLD DOWN, HUI up 🙂
Now’s the time to back up the truck!
🙂
I wish GDX & GDXJ were up, but wow, that is some pretty light volume in both of those
GDX went green as I wrote that
TWMJF is pushing on that 50sma, and the volume is pretty decent. I like it as a leader.
If we can get THAT sector going again, those were doubles & triples = )
CHANGED MY MIND- EVEN BETTER – look on a 8 month with just a 34 sma.
Nice
8 month chart, what time frame daily?
Daily
Oooh la la, I see:)
IMLFF also performing well breaking above the 50sma as mentioned below earlier today
liking some moves here but no volume???
These have a tendency to start slow out of lows and volume swells as it draws attention
refresh
https://uploads.disquscdn.com/images/52de36ed6c15904c20835b34e3eeea1cb0a6b45f1dd849540bedf23f042d14e0.jpg
interesting
I don’t know how to post a chart, but I’m looking at a TWMJF daily and I see the breakout of the triangle. TWMJF is leader for sure, but ACBFF aint shabby either:)
I know that the COT on Oil is bearish, but the chart is turning bullish, and GUSH chart looks pretty good with that rising MACD also
XLE OIH etc seem ok too.
Tuesdays report has been posted