
Feb 28th – Reminders
Market chop, Pop & Drop. Let’s review the markets with an occasional reminder thrown in there too…
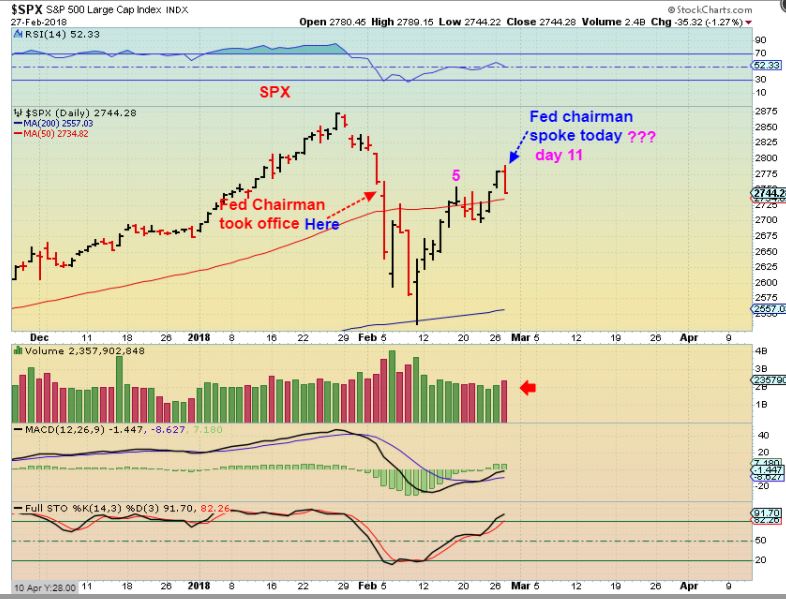
SPX – These markets may eventually “get over it” , but so far they seem to have something against the New Fed Chairman. It could be his discussing 3-4 interest rate hike plan for 2018. Read the chart. So far this is a day 11 gap fill above the 50sma, let’s look at the NASDAQ…
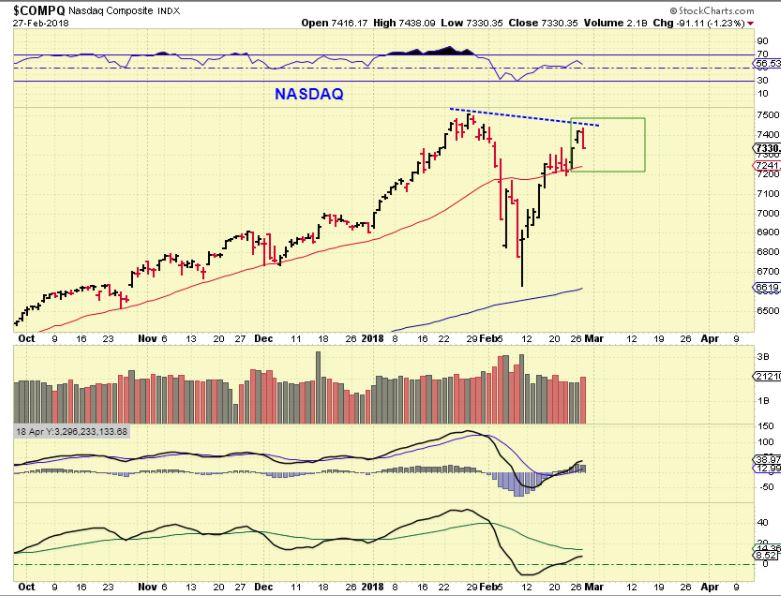
NASDAQ – Gap fill, Tag of the 50sma? Not necessary , but possible. The markets are choppy at times, and the lower indicator is not as strong as the move higher was. That may resolve itself with choppy consolidation.
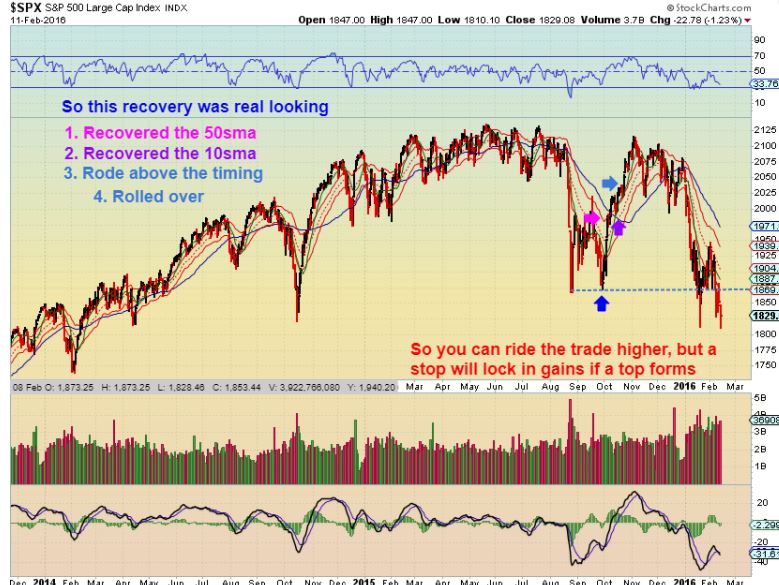
I’m not ‘sounding the alarm’ here, just a reminder: At the end of the weekend report I had a lot of charts of past sell off/ recoveries that rolled over again even after a rip roaring run higher. See below. I think it is too early in this daily cycle out of the lows for that, but it is just a good Reminder going forward that it can and has happened. Look at these strong rallies out of the lows- they rolled over.
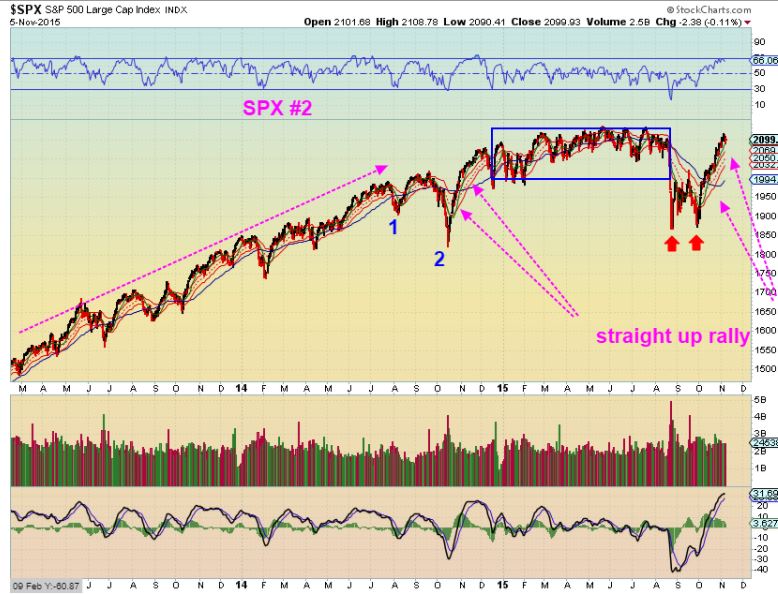
So for the General Markets, their daily cycle could be over 40 days long, so I do not think that they are rolling over here on just day 11. I just wanted to remind readers that we want to watch ‘how’ they move higher as this rally continues on.
WTIC – Day 11 and Oil dropped. This may also be early for a swing high peak, since Oil cycles can run 30-40 days long. I did notice this however…
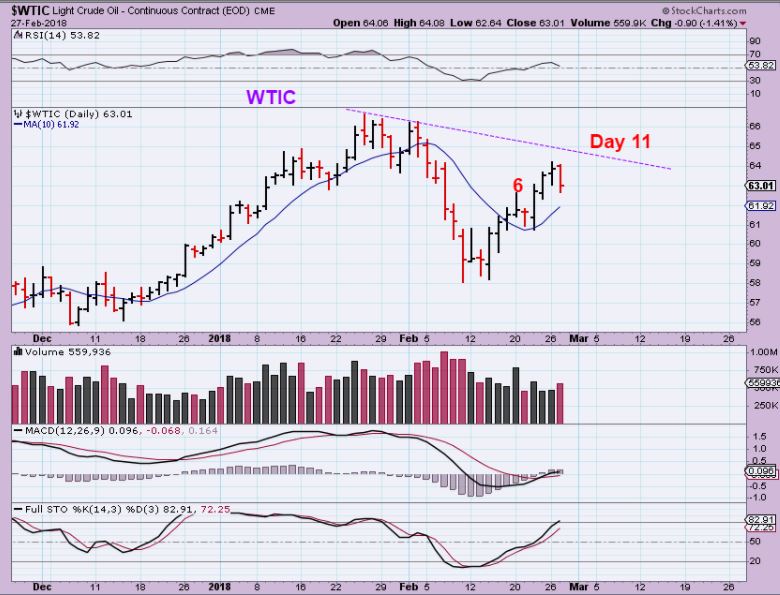
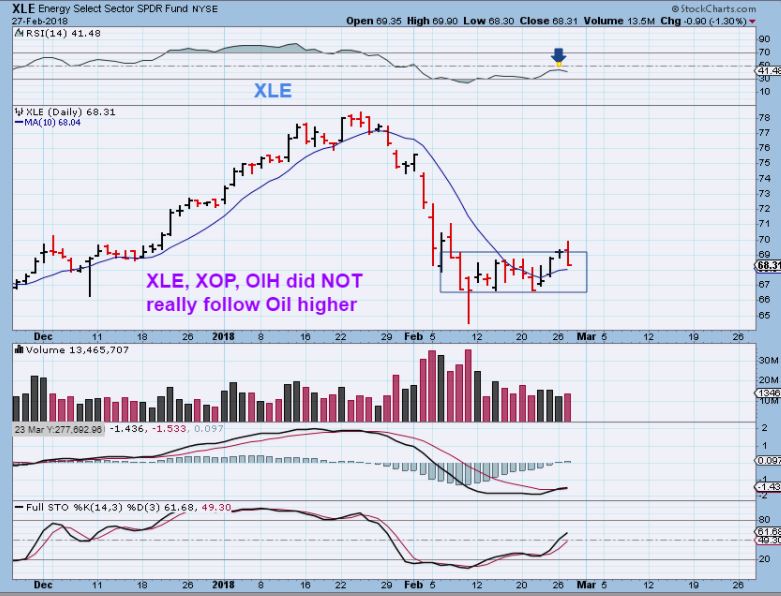
XLE ( XOP & OIH too) – Oil ran straight back up toward the highs, the Energy sector etfs have not.
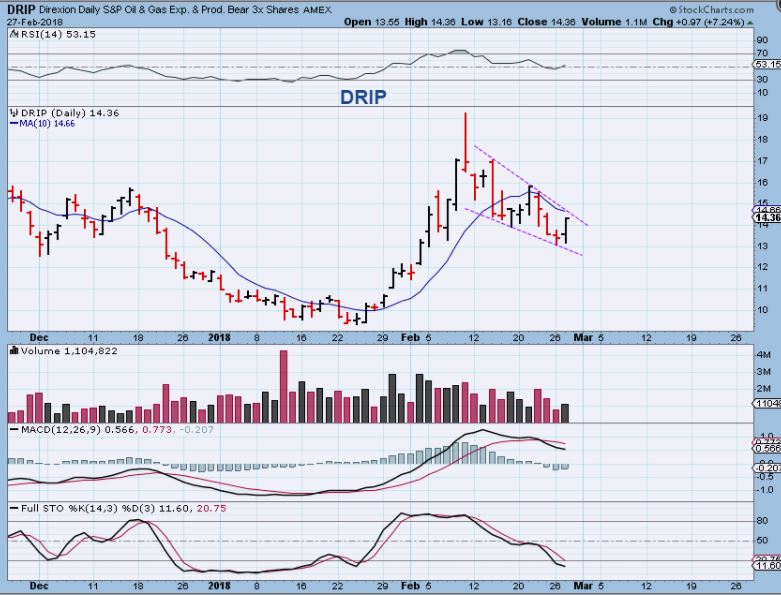
DRIP – This is not a ‘buy’ yet, but if it breaks out higher it could be ( maybe for experienced traders). It is choppy, but this looks like it could run into the mid $20’s if it breaks and runs.
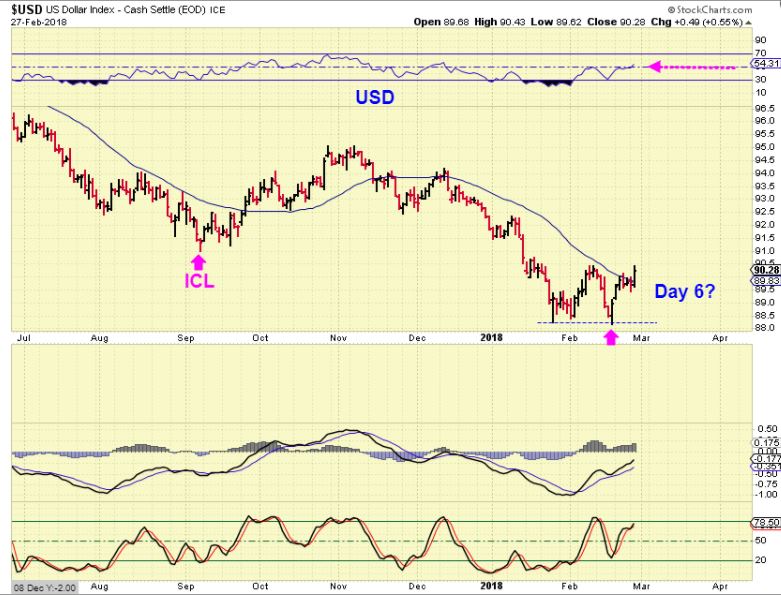
USD – The USD popped on Day 6. The RSI is running higher &the MACD has been bullish. If this is an ICL like September, it will have a few weeks of upward bias, though it may be choppy & sideways at times too. See Sept/October.
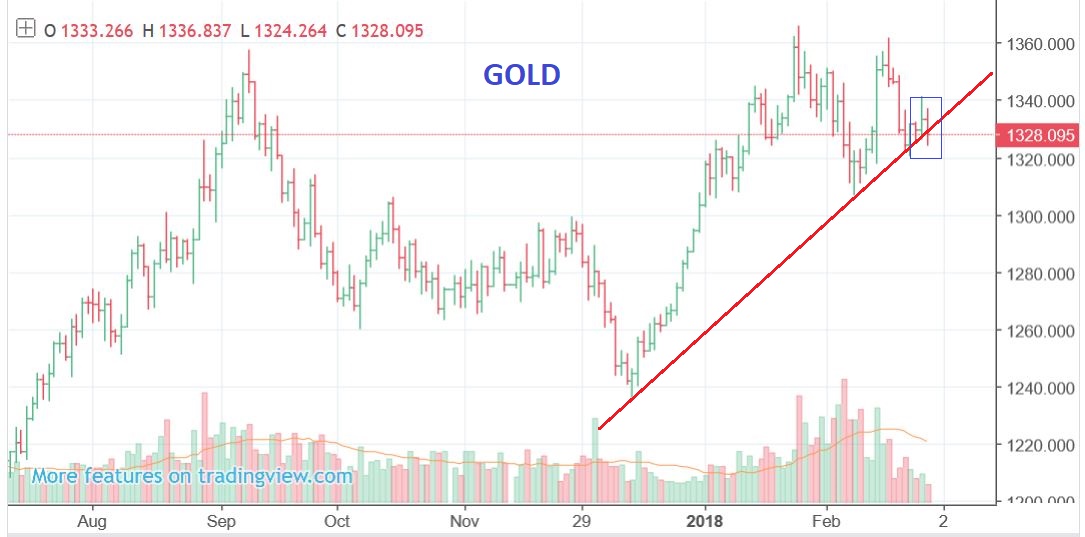
If the USD Popped, Did GOLD drop?
GOLD – IN THE MORNING, I posted this at the opening bell. Pre-Market Gold broke below the uptrend line and that is usually a sign that the intermediate cycle is starting a deeper decline. This is bearish longer term.
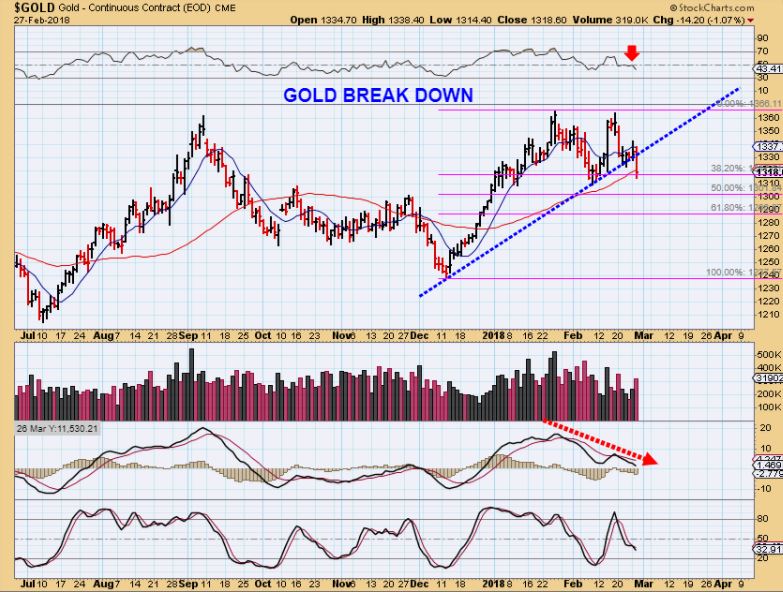
GOLD – Gold closed slightly below the 50sma. It may be a short term shake out & recover temporarily, but again, that trend line broke and signals an intermediate cycle is starting to decline. Look at Golds MACD with a double top. RSI dropped below the 50% area too.
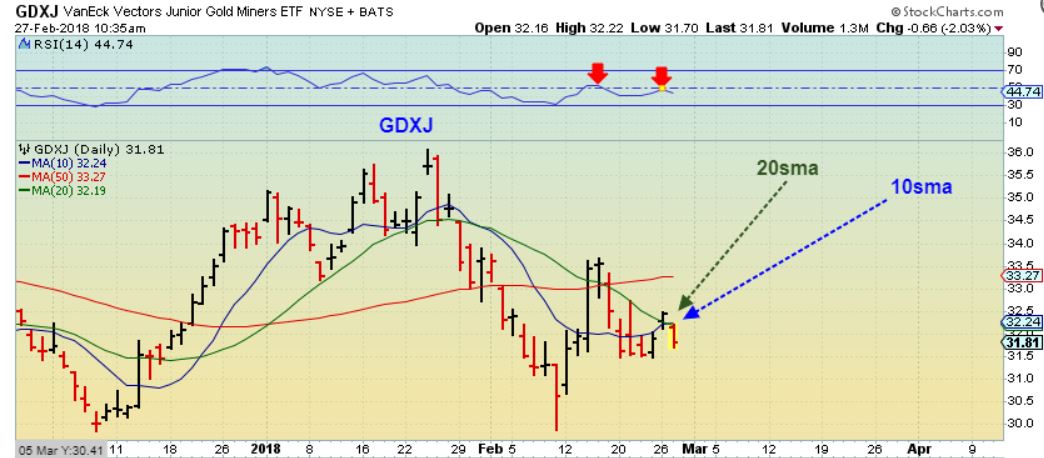
GDXJ 1 hr into trading – Monday GDXJ closed above the 10sma, but in pre-market it dropped below when Gold broke down below that trend line, so I posted this 1 hr into trading to show that GDXJ ( And GDX) were now rejected at the 10 & 20 sma. GDXJ was down 2% at this point.
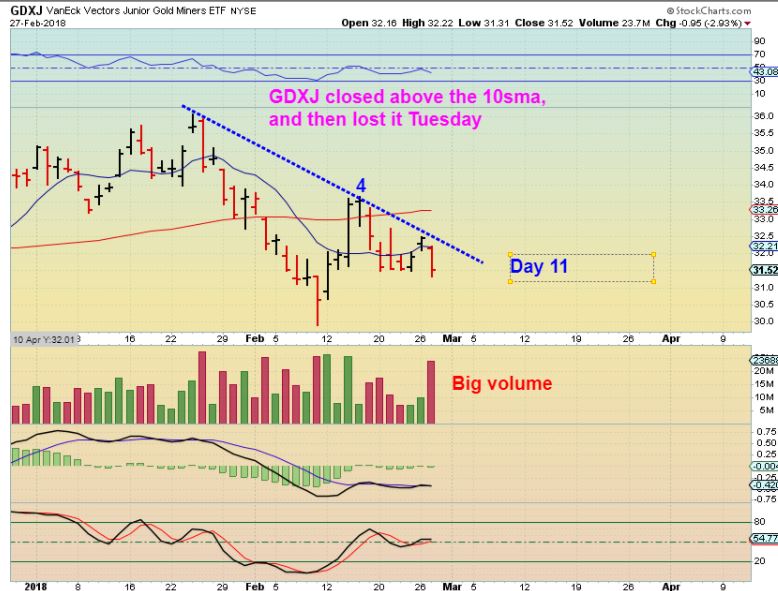
GDXJ – GDXJ closed down almost $1. I do not think that Miners will break higher above that trend line now.
GDXJ – So I go back and look at this. This idea was touched on by me back in January too, but I didn’t think that it was correct…
1. A 21 day daily cycle with a trend line break & close below the 10sma The peak on day 16 is R.T., so we would expect a new high on the next daily cycle.
2. A second daily cycle peak on day 10 at new highs & a low on day 22 ( L.T.)
3. Now we would be on a weaker 3rd daily cycle that may have peaked and could drop as the USD bounces higher. That CPI Number burst higherinto day 4, but it did not have the follow through that I thought it should.
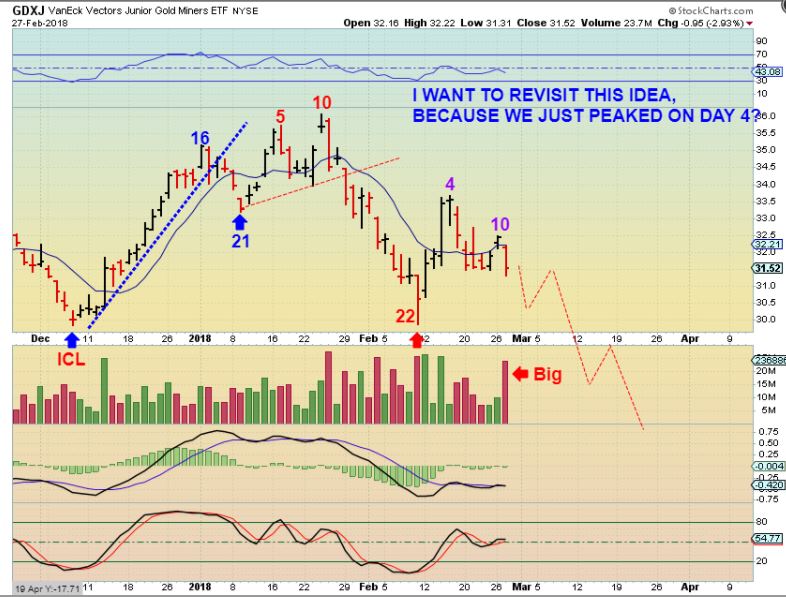
Honestly there is no sense in looking back in hindsight for an alternate count, other than to try to learn from that. If this above count was correct, the next drop could easily take out the Dec 2016 lows. Let’s look at that…
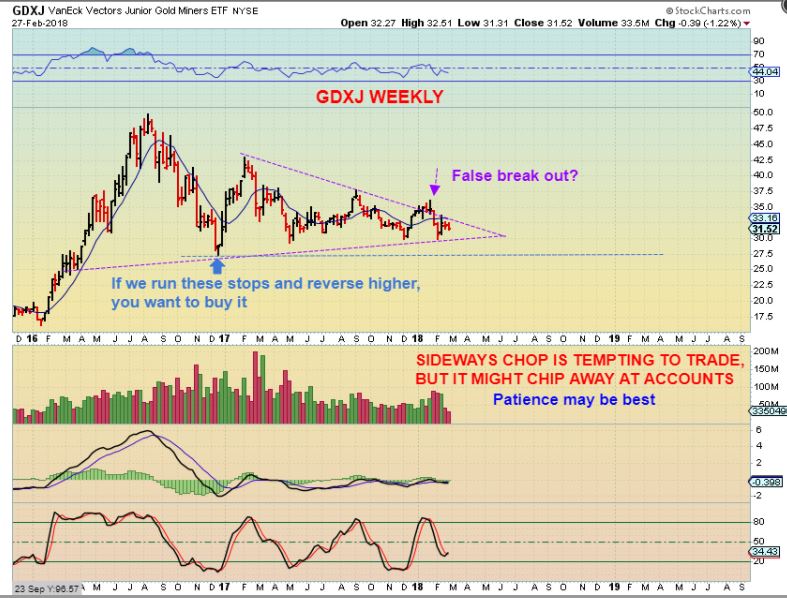
GDXJ WEEKLY – The Dec 2016 lows are not too far from here at all, if Miners got into an accelerated drop after chopping around sideways some more. NOTE: CHOPPING AROUND UP & DOWN is basically what we are getting with Miners. IT IS VERY HARD TO MAKE MONEY IN THESE CHOPPY MINERS MARKETS LATELY , unless you enter and exit in a 1 or 2 day time period. Please read this chart.
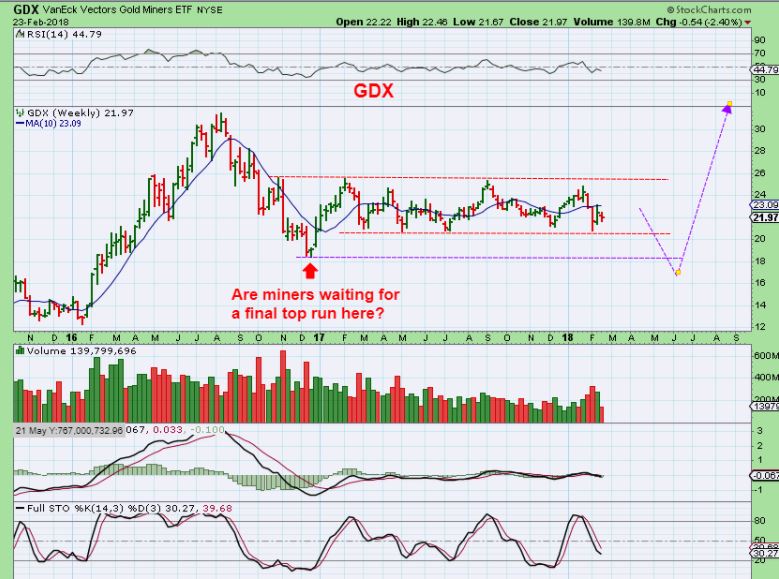
GDX – This chart was in the weekend report, with a space in there for more chop. I did think that Miners would run up to the top Red dotted line before dropping, but that run is getting less and less likely.
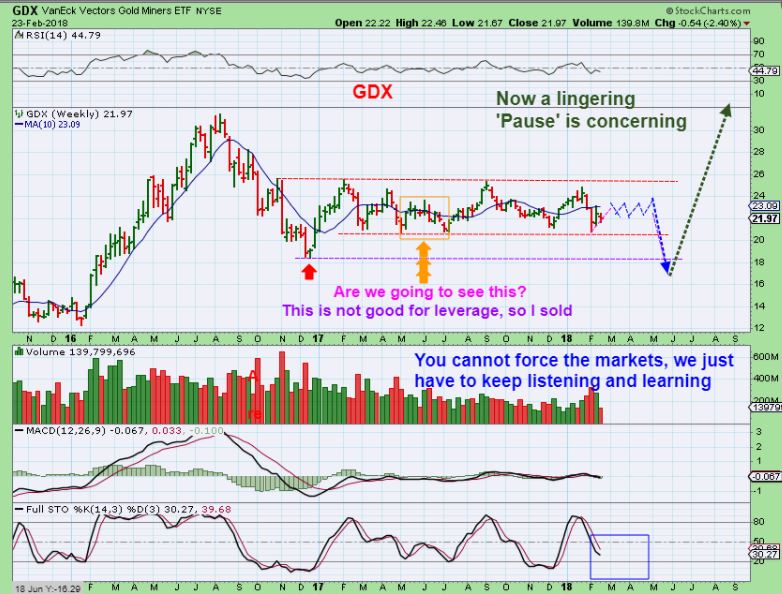
GDX – Also in the weekend report, I said that I NOW expect a sideways chop similar to the May – July period of time in the box. So far, that is all we are getting. This is not good for leverage. The sidelines may be best at this point.
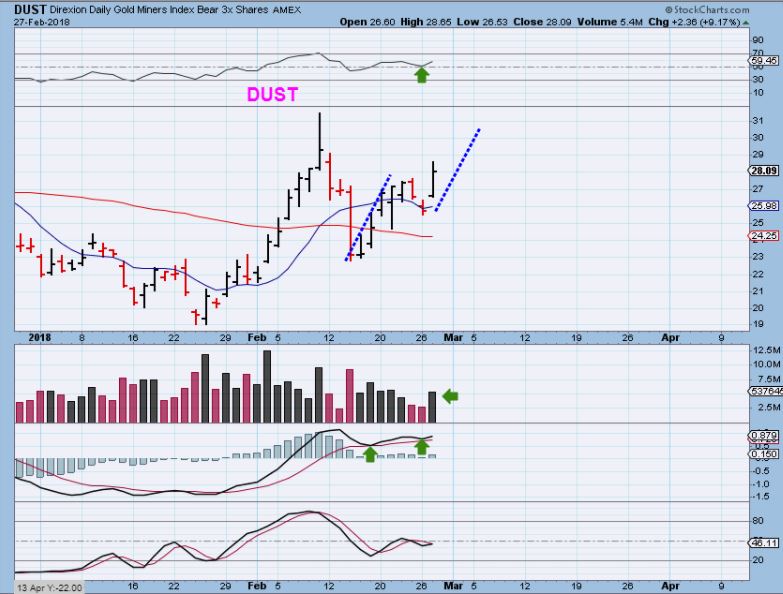
DUST – When the CPI numbers came out & miners took off upside, DUST dropped from $31 to $23 in 4 days (Not an easy ride if you were in it, right?). Now with Miners dropping, it seems to be starting another leg higher. Or…
DUST – The bigger picture for Dust shows a run in late January and then that pull back. Another leg higher would look like this if the 2016 lows in December are taken out …
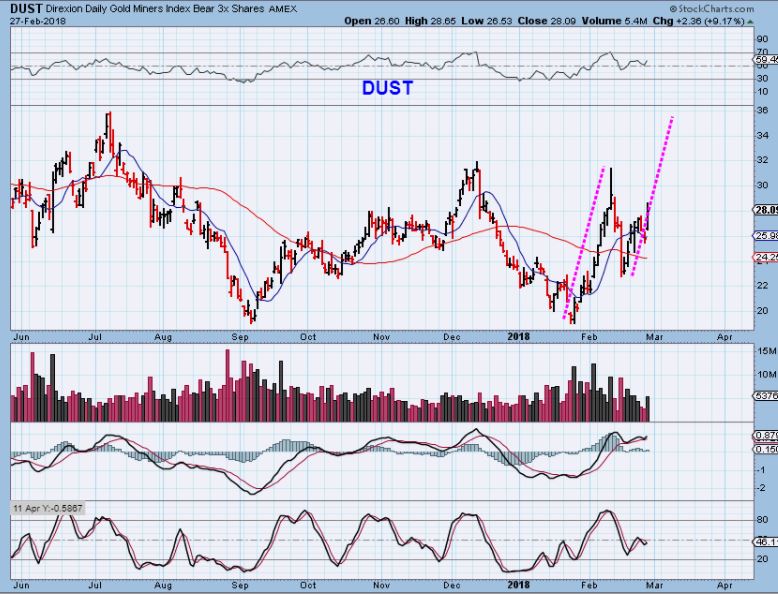
I am not really recommending DUST, because these markets are so choppy, but what I wanted to show was how fickle and choppy this sector has been. Dust ran from $19 to $32 , and back to $23. It does look bullish again, Miners do look set to drop, but these Miners are so choppy that it might just be best to sit on the sidelines and wait for a final low. This sideways consolidation is about as tough as it gets, but it will end, and the rally will be Very Strong coming out of this base.
For now I am simply trading, and I have pointed out a few trades here too. I am basically 70% cash, and I have recently been trading ENPH, MU, GGB, I bought TRXC yesterday, etc etc. There are trades out there, and I had some in yesterdays report too. You also can take position in TQQQ, UPRO, UDOW, etc i, if you feel that the drop yesterday was temporary. I think as long as they remain above the 50sma, we have more upside, and I will be watching things along the way.
Enjoy your Wednesday trading, or take to the sidelines with a good chunk of cash and be ready for any real bullish move that may come about down the road. I might even short Oil if it rolls over for a 2nd leg down, as the COT seems to indicate. I have a few of our current trades in a discussion below.
~ALEX
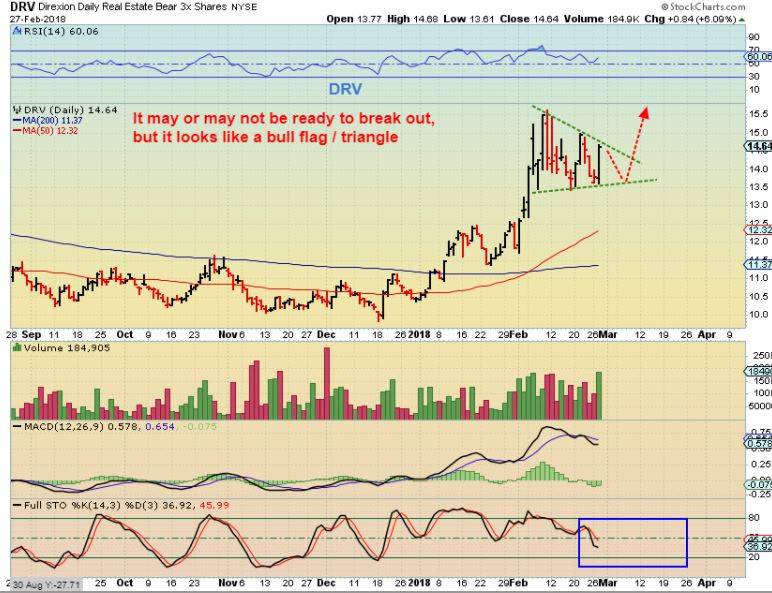
DRV – With interest rate hikes in the pipeline, housing may already be suffering. Look at DRV. It may work its way to the red line 50sma, and then break out higher. It is on my watch list.
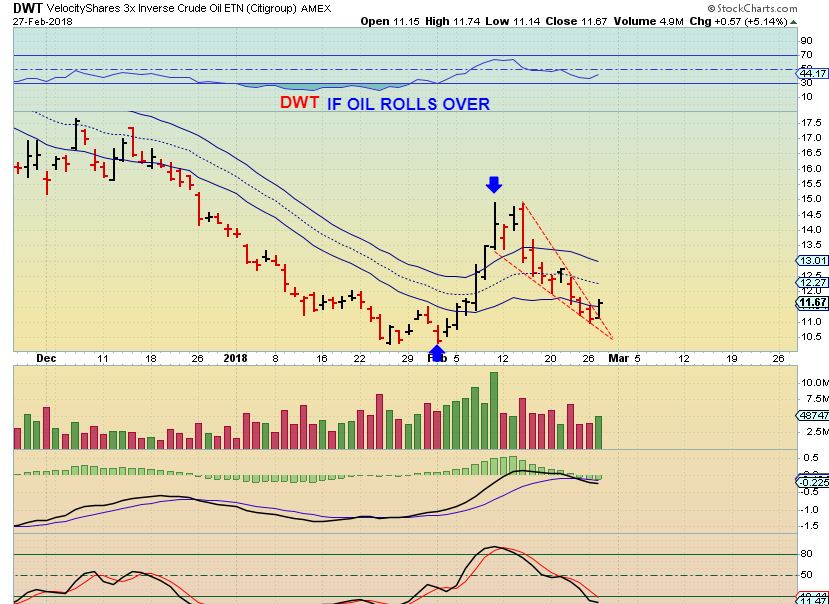
DWT – When Oil drops, DWT is leveraged and pops. It looks bullish, but I am trying to be patient since Oil has been pretty strong. On the Watch List.
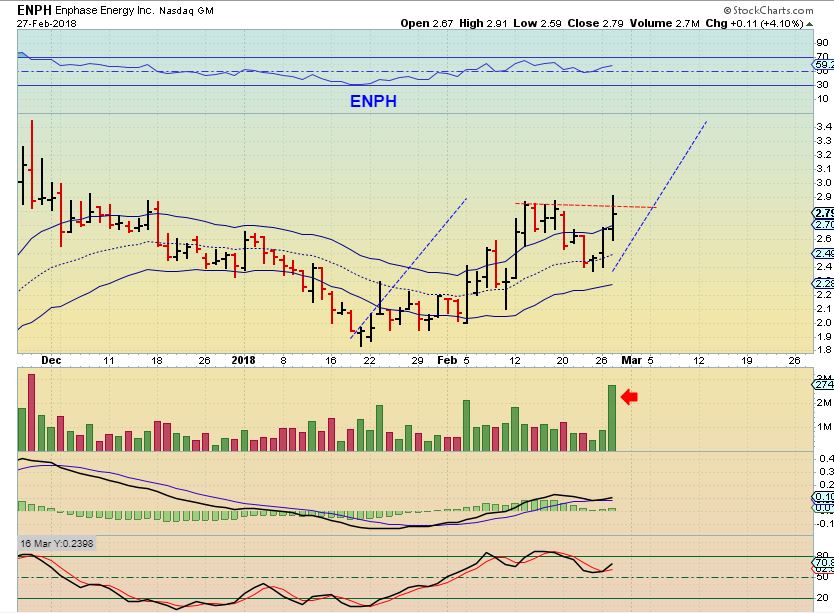
ENPH _ We Bought weeks ago & added at the 50sma, it is up 12% in premarket…
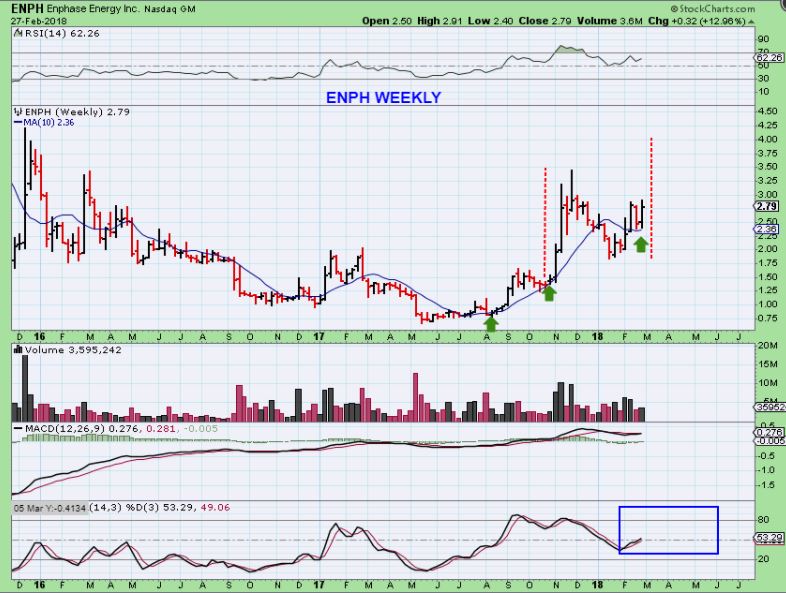
ENPH WEEKLY – Looks ready to continue higher, after earnings release last night.
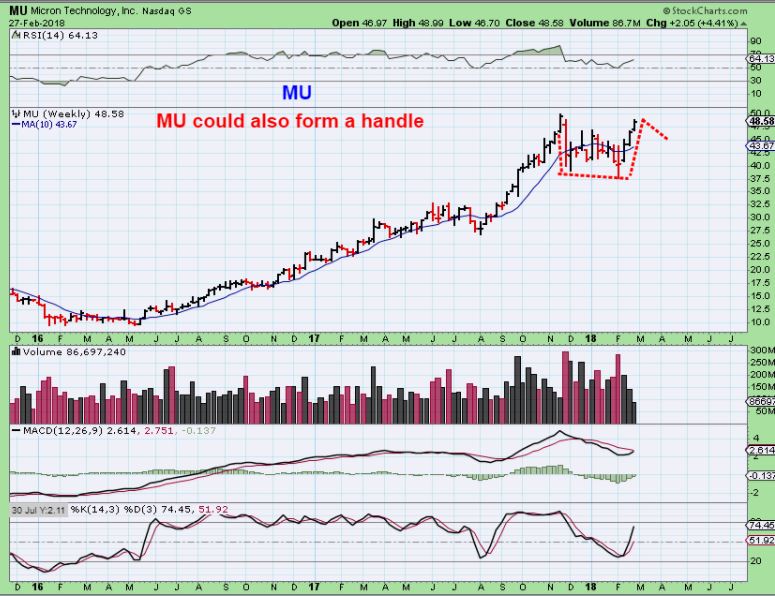
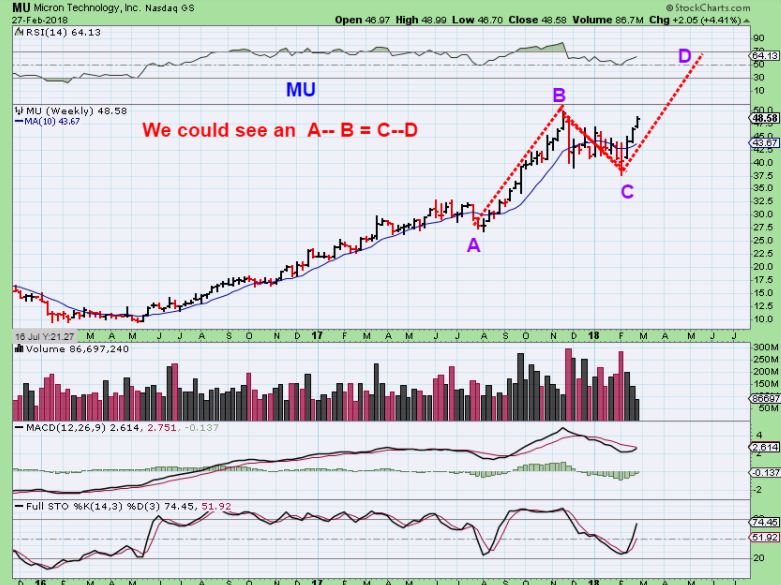
BIG PICTURE FOR MU- MU pulled back at the end of the day, but still closed up higher by another 80 cents. Can it pull back? OF COURSE, it has been up 9 days out of 11.
MU WEEKLY – Can MU pull back? yes, and form a handle. I expected it to tag close to $50 first . So this is a cup & handle possibility , however…
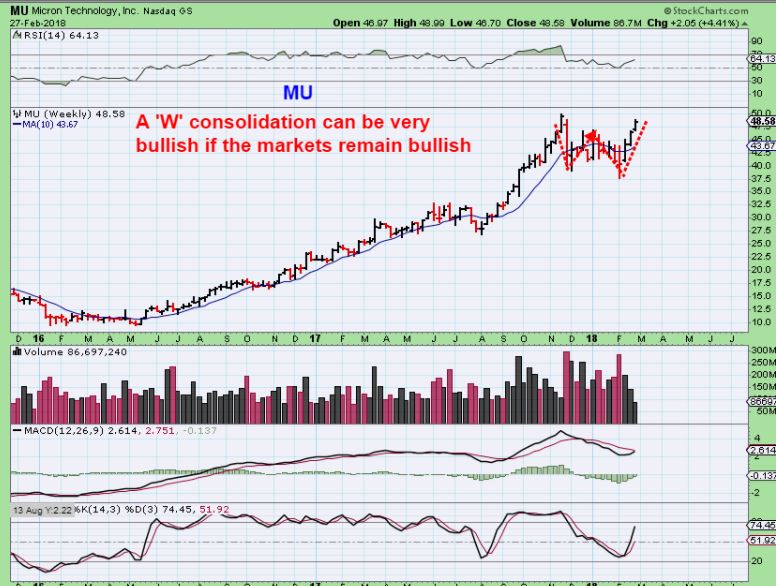
MU WEEKLY – A ‘W’ pattern can be very bullish and just continue higher. Also …
MU WEEKLY – An A to B = C to D pattern would be a run to about $60. If the Markets remain bullish, MU should also , barring any surprises.
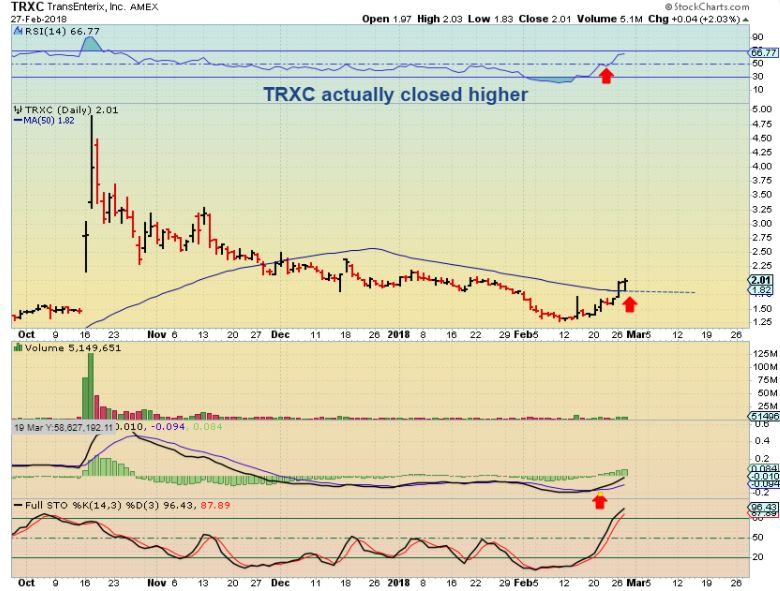
TRXC – At 11:17 a.m. eastern I posted this tag of the 50sma and bought it, hoping that it would hold and the 10sma would rise up to it later… –
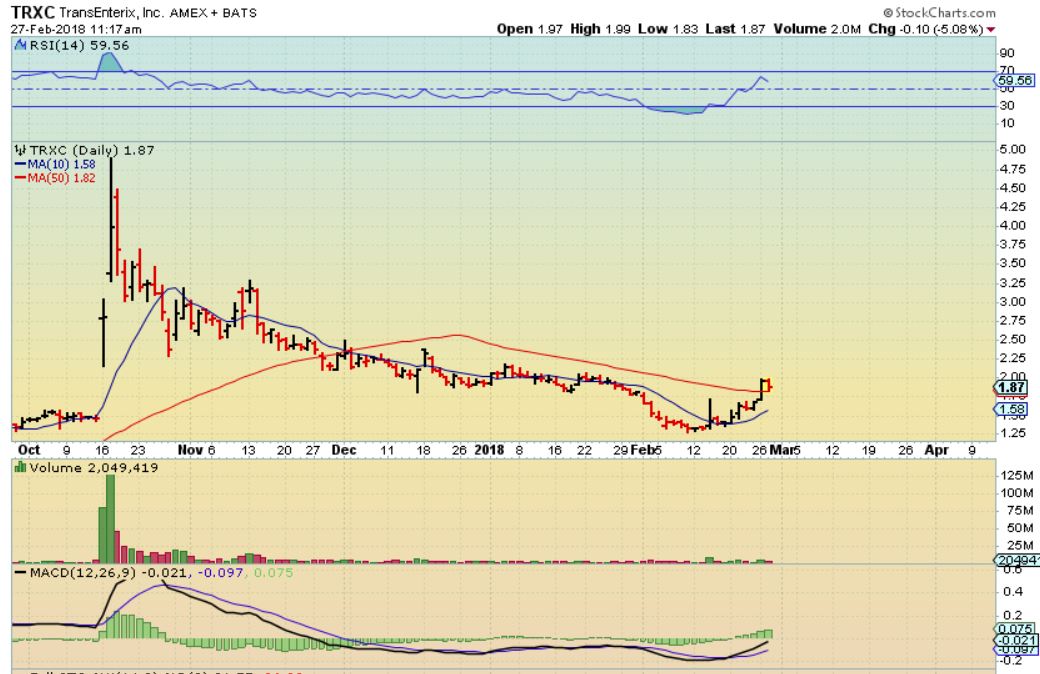
TRXC – Maybe we should prepare for the idea that this could do this a few more times too? Often price will ‘ride along’ the 50sma. I will add if it does, I have a small position.


Clear report Alex, thanks
Thx Bill –
Its a bit choppy out there, not all that easy to find a trade and sit comfortably.
I’m keeping my trading positions relatively small, but kind of wish I did go heavier in ENPH & MU
Kinda wishing I had not sold my MU yesterday. Yet another lesson for me to stick with a trade like this one.
Well, the markets turned down and it may have looked like a pull back was coming, so as a trade- it wasn’t necessarily a bad thing.
I had a decent size position in ENPH, but they had earnings after the bell, so I sold 1/2 on the ramp up yesterday. Now its up 14% premarket – not feeling too good about that one either 🙂 but I have held on through earnings and woke up to down 20% in the past, so you just do what seems best at the time.
The expectations for miners to break the 2016 lows has now become a popular viewpoint. Logically, this would imply that those holding miners have already sold in anticipation of buying cheaper. However, since markets move on what traders/investors “do” and not what they “say”, it will be interesting to see how this develops.
I keep having that feeling too.
Way too many are just waiting to buy at that break point. I wish no one believed it could go there, then I’d feel better about it
There is really no real way of knowing what players are actually doing. That’s too bad since it would go a long way in getting a better picture. The “hardcore” bulls are not selling yet most of these guys/gals are in the bullion and not the miners. Maybe if you can take a “secret vote” among all the subs who play the miners and reveal what they are actually doing, it could be a good representation of what is happening behind the scenes
Guess I got caught up in all the Doom and Gloom today and sold many miners. I am now 45% invested. Not fun.
About a year ago my wife told me to buy ETSY, she thought that they had a good set up.
It slammed down to $10 ish right around that time and I passed on it. Just looked at the chart, because I saw it up $3 in premarket.
Hmmm, Guess she was right – its going to open at $24 🙂
Good report .. went long DUST yesterday with tight stop as GDX potentially could go much lower… ABX terrible chart ..
Yeah, ABX is already below the Dec 2016 lows.
Is EDXC going to retest the break out? https://uploads.disquscdn.com/images/287d1b1d7868b2d6228bb757856b594a3e1b9d5ac922e5e099512eda6ca334dc.jpg
Sold Half my MU at 49
SQ interesting. Started some 46.5 avg, stop lod. ATRA also started this morning (brought down on offering). MULE watching to add more.
I added small (100) yesterday in after hours at 45.50 – got lucky… i thought the ER was amazing, but I could have been wrong.. Nice little pop but not a huge payout on 100 shares, so waiting to see how market acts going fwd and will AVG up if it starts to rally break to the upside
I really like the chart of SQ – Earnings are out, volume is coming in. I bought it too
I like company:)
I’m watching MULE too. Are you waiting for a BO from the base?
No, I just buy on dip. MULE looking like could take out highs.
TWTR sweet. Ditto CASA ipo, mentioned it a while back. Also holding AQ based on NVDA partnership re: driverless cars.
LABU moved nicely off lows, bio could be the sector to be in IMO.
Watching DRIP again ( or DWT) – Oil inventory is starting to bring Oil down.
Trying to be patient – dont want to buy a knee jerk reaction & chop around for a while
Alex, Is it time for Natural Gas yet? Tough to buy into a downtrend………..But!
https://www.tradingview.com/x/CgQGMIVe/
I’m not following NATGAS
Alex, remember our discussion on PAYC and how it dips right before/at earnings? Well I lost track of it and now look………. https://uploads.disquscdn.com/images/e97d286eaab1c34ed54eb516bde786265c00aa7a951a1f13ec1a4557e2191378.jpg
I somewhat don’t really remember, but I do see what you mean. Need to buy that dip 🙂
CF. sold all my Oil longs @ the open. Starting to wonder myself if this is a B wave top for a move to $56 initially and the bottom of the channel its been forming since June and August of 2017. A look back has Oil forming IC tops or bottoms in the February and June time frames. I am starting to build a USO put position here
I bought DWT (For a trade)
The TSI on DWT is looking good. I barely drop when price came back down. I bought some as well.
And the volume really started to pour in after that Inventory report.
At 1/2 way through the day it may have the same amt as all day yesterday.
The pull back also brought it back top oversold stochastics – so I’m hoping for some follow through here
I would love to have a replay of the Feb. 2017 to June 2017 ICL. The top came the last week into February and then a move down to the end of March. Rally then repeat. The dollar should rally here until around the FOMC meeting at the end of March maybe Oil reacts to it. Crazy if this plays out like early 2017. Although in real time I don’t know if I would have got that final leg down from May to June.
Great report, CF, even when miners suggesting to do nothing. Sometimes not losing much is the only trade.
TGB gets whooped day after day lately. http://schrts.co/3PYcHM
I used to love that stock last year, held it for quite a long time, but this is just another reason that I dont marry them.
Once they start to act in a way that doesn’t match the reason you entered the trade, it is best to exit
Anyone think Mairjuana is ready to run again?
Yep…. in FIRE and EMC both on the TSX.
yes
I think that they do look ready, but I am waiting for some ( Some have) to move above the 9 sma
I know most here don’t care about the general markets, but as I predicted yesterday TQQQ dropped down and bounced off its 5 day EMA today which is normal and expected. UPRO and UDOW also dipped down and bounced off their 5 day EMA’s. During the strong bull run in stocks, a dip to the 5 day EMA is about as low of of a daily dip as you are going to get. Now let’s see what happens the rest of the day. Good trading to all!
Hey Steve
just to put your mind at ease or whatever- I noticed that you almost always write,
‘I know most here don’t care about the general markets’
I have hundreds of readers and only about 20 post in the comments. My readers do watch the general markets or I wouldn’t cover them in the reports. Feel free to just post your thoughts – you arent bothering anyone – the ones that dont care will skip it. 🙂
OK .. thanks. Sometimes I feel like the shy kid standing alone in the corner at a party because all the “cool kids” are talking about different stocks and I’m just in boring old stock index ETF’s. LOL
Hi Steve, keep posting you are read & appreciated.
Nope – Many of my readers follow the General Markets, they just dont post in this section
Aumn another dumpster dive.. finally out of miners. They just always dissapoint and every expectation that’s not met seems to be in this sector. Will let someone else deal with them and focus on stuff that consistently works.
SNAP intraday flag…in small 17.6 avg
this action has put everyone to sleep
Anyone started any new pot stocks yet or do they need more time to prove themselves??
Bought some FRLF near its 50ma, and MEDFF for not making lower lows (among other reasons).
Oh, and CRON. Nice move today.
Cron looks like it is acting very well
I entered a while ago & was too early- I’m just wanting to see a close above the 9 or 10 sma .
I will cover it in the report tonight though- I thought that they do look good ( improving ) lately
Hi Alex, do you have reasons that you could share for DWT vs DRIP for a trade.
No, I like both.
One would basically be how you feel about OIL ( DWT), and DRIP is more the energy sector.
Thank you.
I have done the same, using SCO and DWT for oil. Just have gotten leary of ETN’s lately.
Rightly so
Man the stock market really does NOT like the new Fed chairman. I stopped out of the TQQQ I added last Friday at a tiny profit. I coulda sold yesterday at $176 like Bay Trader, but I’m trying not trade the wiggles. Need a couple more days to assess the longer term charts.
Just to be honest, I’m seeing bearish signals on my daily chart for TQQQ so I sold some in the AH today to lock in profits. I’m still bullish stocks but the reaction to the new Fed chairman seems to be spooking the markets, so I’m taking some money off the table. Please don’t follow me, I’m just posting to let people know I’m still pretty heavy in TQQQ but no longer “all in.”
I had to leave at noon today, and leaving again. Have a good evening all
Well I went to scalp MMM. 300 shares at 238. Sold (what I thought was all) at 239.80
Turns out I didnt sell all and stuck holding 200 shares still down to 235… not a great day… and realized after market closed..
I’ve done that on buys. Thought my order was filled only to realize later it was partial fill.
I changed my share count when selling a portion of another ticker and forgot to change it back to 300 I guess. Being down 600 without even knowing sucks
The MARCH 1st report has been released