Since the weekend report, we are seeing what was expected out of the General Markets & Oil, so I am going to get right to a few other areas first, and then I will have a couple of Stock Picks to consider.
USD – Reminder: Way back in January I was saying that I did Not think that the USD put in an ICL in Lte January, though others were saying that it did. I expected a weak bounce from a dcl and then it should roll over to lower price.
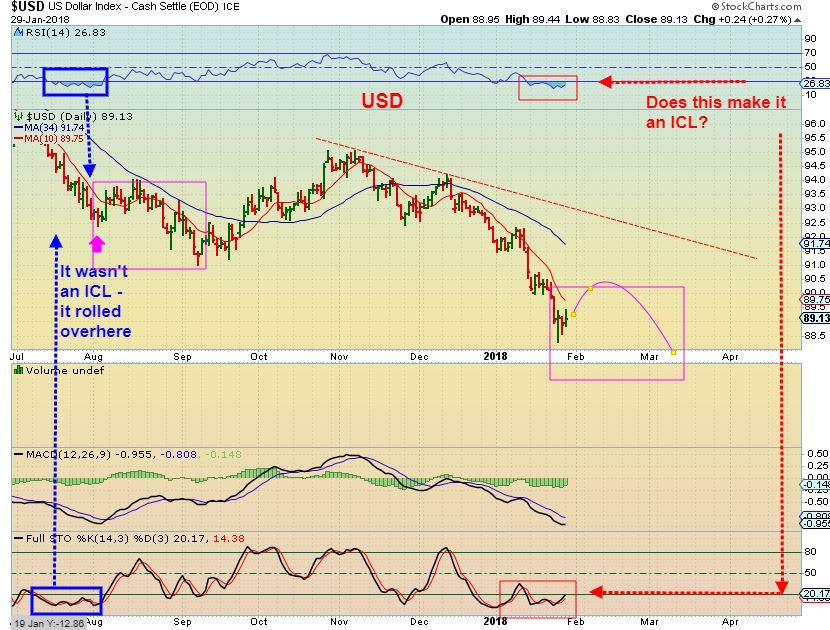
USD – Now looking at the USD, we see that it did rolled over and made a new low on day 16, but honestly it didn’t make a ‘much deeper low’ like I expected. Since that new low, it has bounced again. Was THAT day 16 new low an ICL or maybe just another dcl? The MACD is bullish, so it will take time to know for sure.
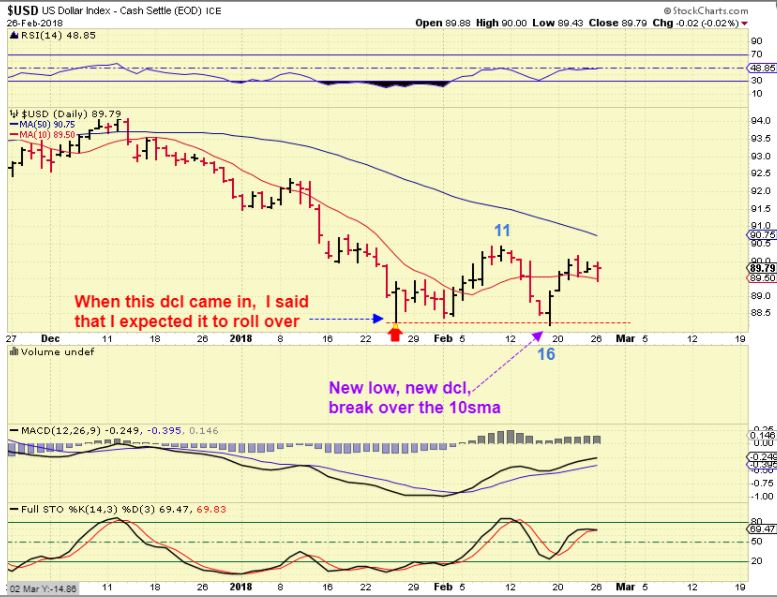
USD ABOVE PART 2- If that was just a dcl, it would be expected to form as L.T. and drop again, and if That happened, I would think that Gold & miners could pop a bit higher. It is starting to get late in the daily cycle for Gold & Miners however. If it is a USD ICL, we would have weeks of sideways bounces & a little movement higher, and Precious Metals may stagnate and eventually run the lows.
Sideways chop in both of these sectors makes it tricky to get a good read on them 🙁
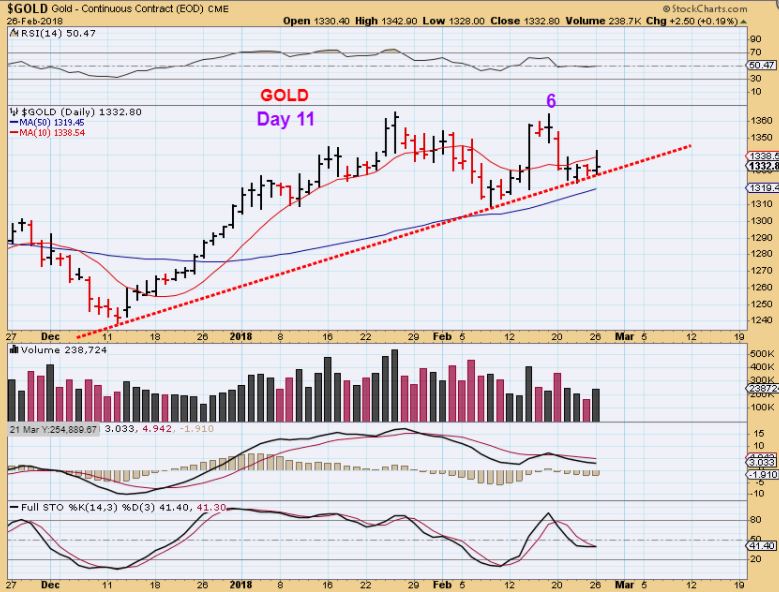
GOLD – Day 11 is not too late for a run higher, but so far it looks weak. Gold popped higher, but it could not hold the gains again. I do not see the lower trend line as broken, so Gold has still held up better than Silver & Miners.
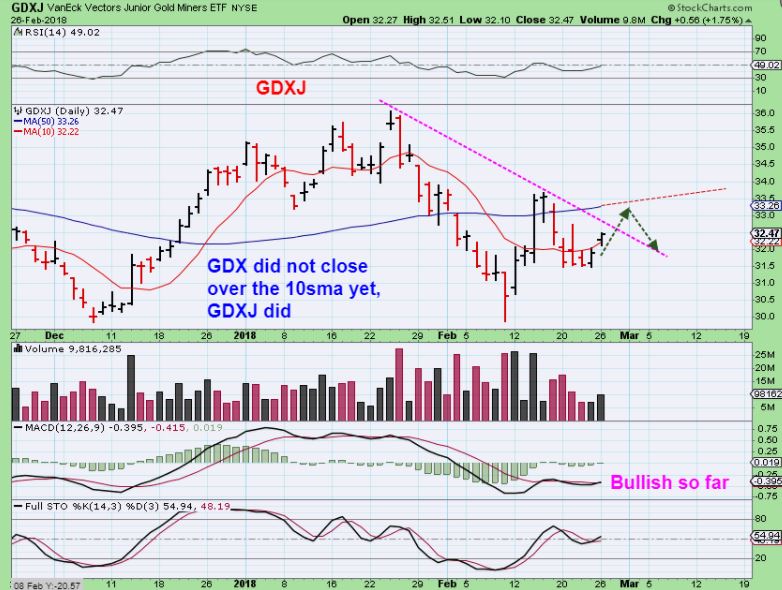
GDXJ at 3:30 – GDXJ was rising into the close, but there are still a couple of overhead resistances. I took a small position as it gapped above the 10sma & then back tested it. I dont know if I will hold it for a day? 2 days? It depends on how GDXJ acts at resistance levels.
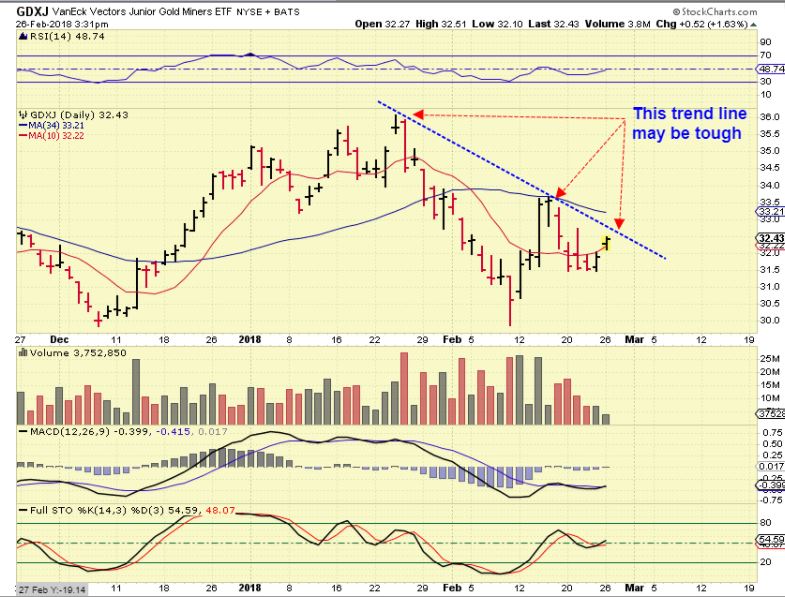
GDXJ – So GDXJ closed above the 10sma and volume increased slightly, but GDX did not close above its’ 10sma. Again, we have an overhead trend line & 50sma to watch as resistance if miners can get that far.
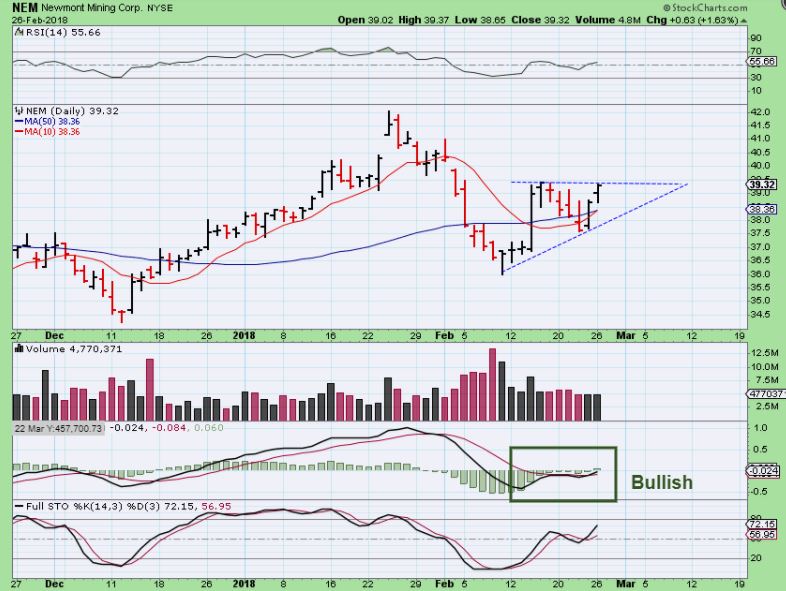
NEM – NEM looked bullish yesterday, that would help GDX, however…
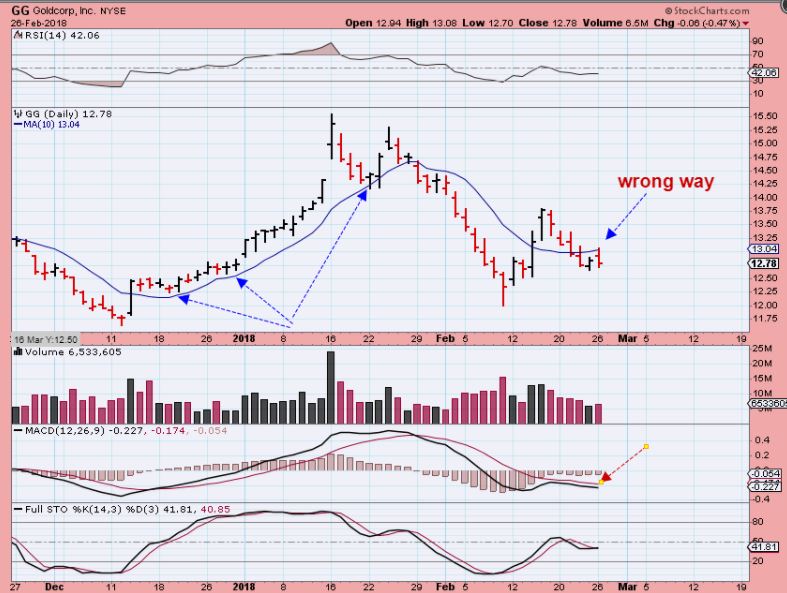
GG – GG was rejected at the 10sma, ABX is at new lows.
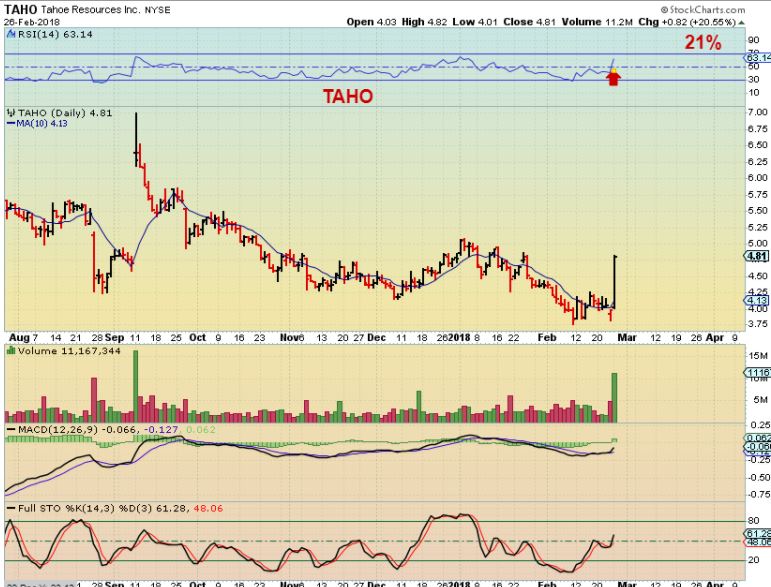
TAHO – Taho was up 21% on some good news, but AEM & ABX look weak.
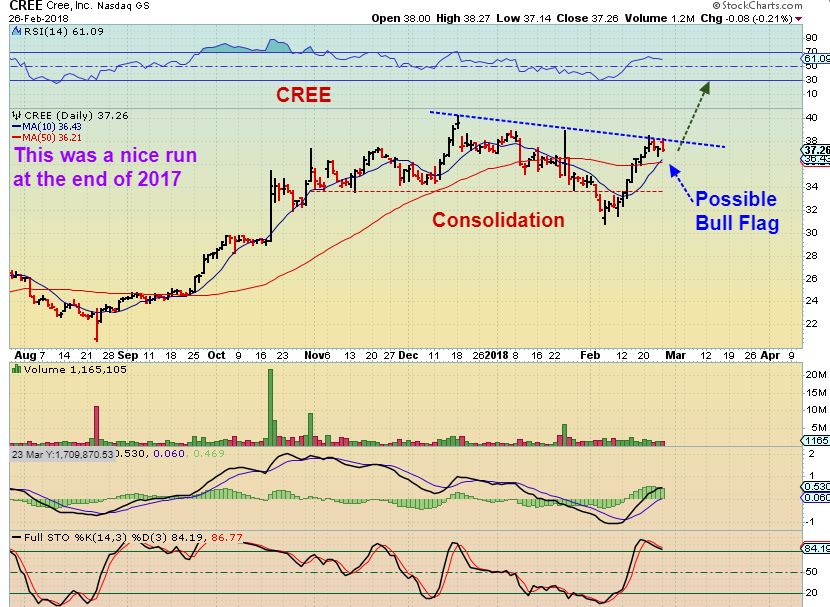
So with Miners we are again seeing a mixture of good and bad, with some healthy looking Miners and others looking weak. For now, the General Markets continued higher and the Semicinductor stocks like CY, CREE, MU, etc also added to gains.
I looked for some good set ups, but finding low risk set ups was just a bit difficult, and I will explain that below with CREE.
CREE #1 – I would say that CREE is a buy, it broke out above the 50sma and could break out above the blue line & run from here. It is low risk due to the 10& 50sma right below, you can put a stop under there. THAT SAID…
CREE #2 – After the 2 week run higher, you also might buy and get stuck in a sideways consolidation similar to what we saw in October.
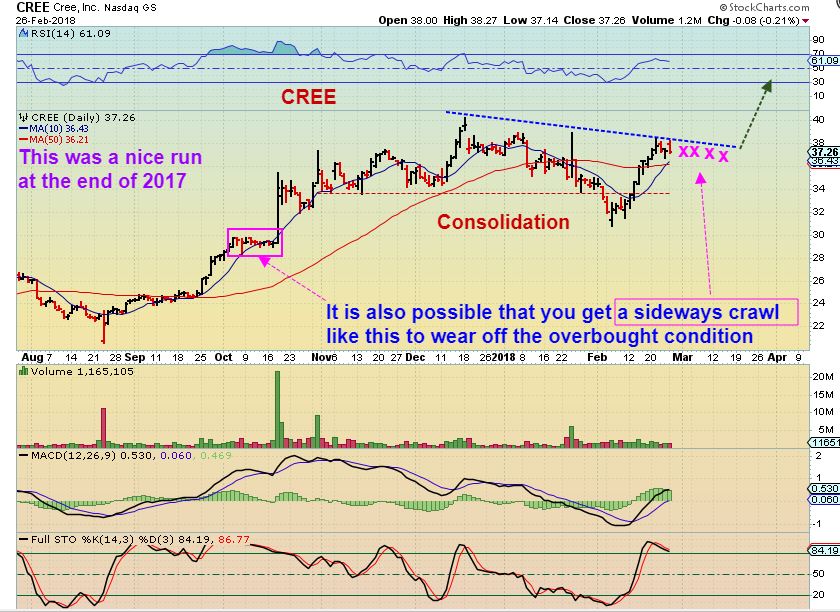
So there are ‘risks’ at this point, but using a stop at the 50sma should prevent any bigger losses. I Bought MU and added to it Monday, I will show it and a couple of other ideas below. Enjoy your Tuesday trading.
~ALEX
ENPH – This is a low risk buy too, since it reversed up off of a back test of the 50sma, and closed up over 8.5%. I already owned this and added at the 50sma. A stop can be placed below the 50sma, and the MACD & RSI look to be turning higher.
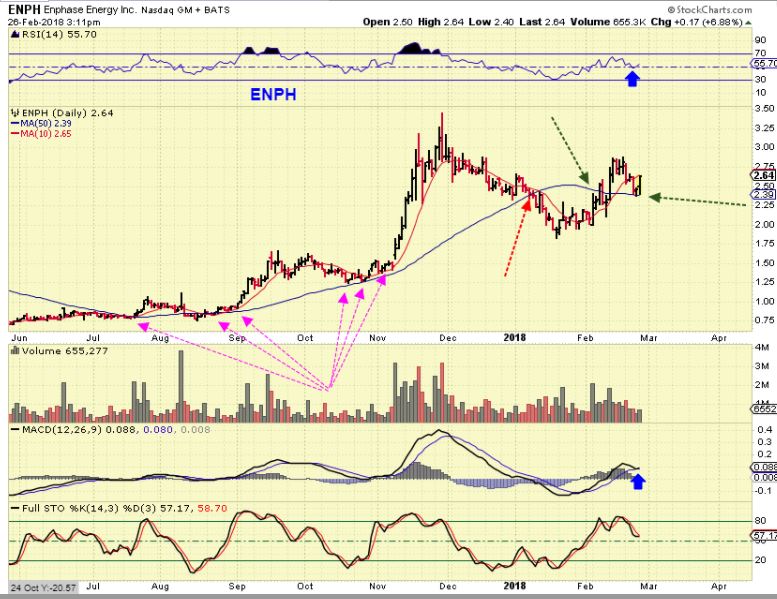
EDIT: I just looked it up and found earnings are today for ENPH after the bell. That does make it a bit higher risk, risk of a gap down. One could put this on a watch-list & wait until Wednesday to be safe.
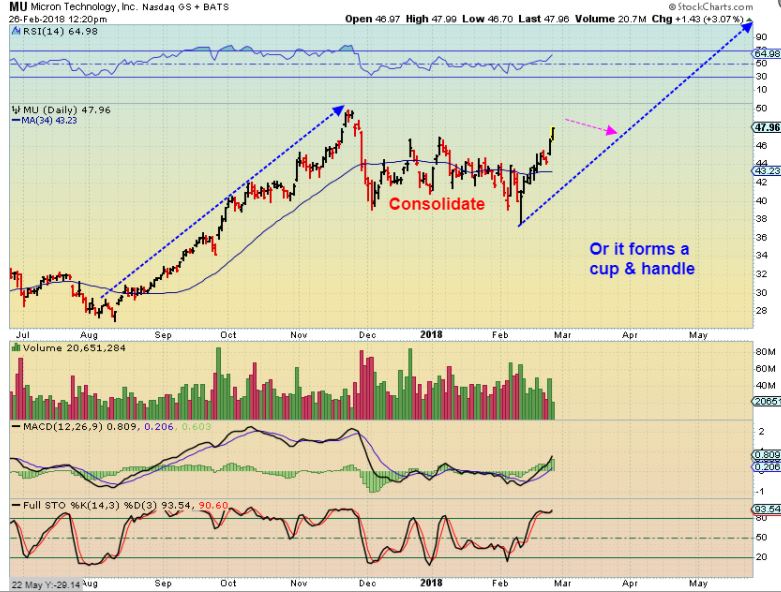
MU – I bought this last week and added on Monday. This looks similar to Cree with a strong run last year, a consolidation, and now a 2nd move higher ( Hopefully).
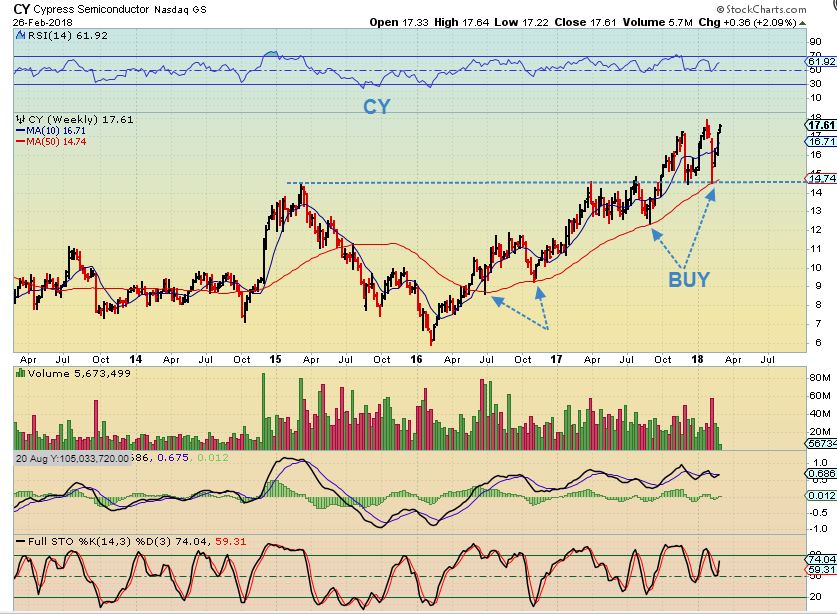
CY #1– I had mentioned CY as a buy a few times in the past, and you can see a recent back test of the break out too.
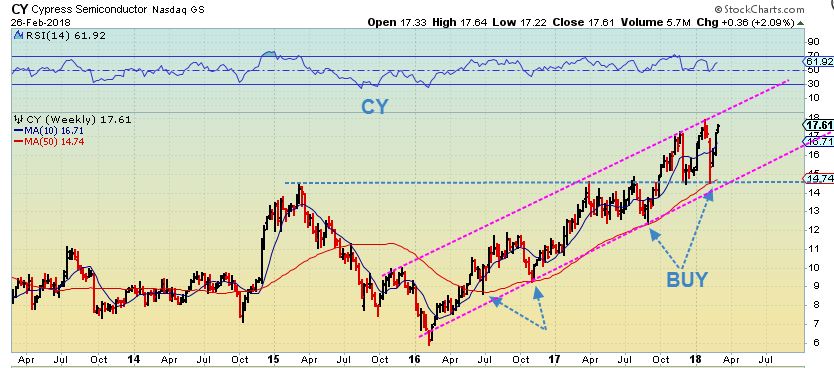
CY #2– Using a channel, it indicates that CY may climb up to where the $20 mark is and I would watch it up in that area. It tends to go sideways for weeks at times.
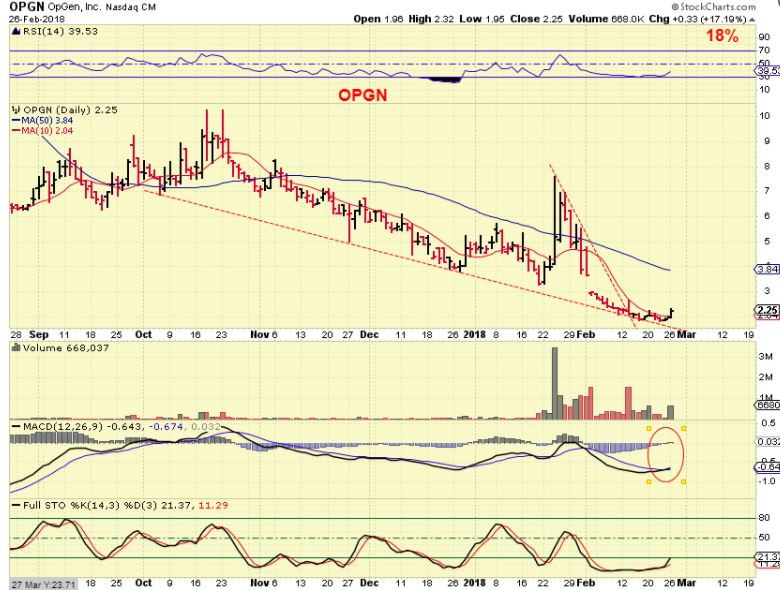
OPGN – This company did a big reverse split to regain Nasdaq compliance of trading above $1. It may be considered High Risk, maybe for the fast short term traders only, since it crashed down recently. What I like is that the small blip higher yesterday was almost a 20% bounce. If this ‘Bounces’ to the 50sma, gains would be big- so this is for High Risk traders anticipating a possible bounce.
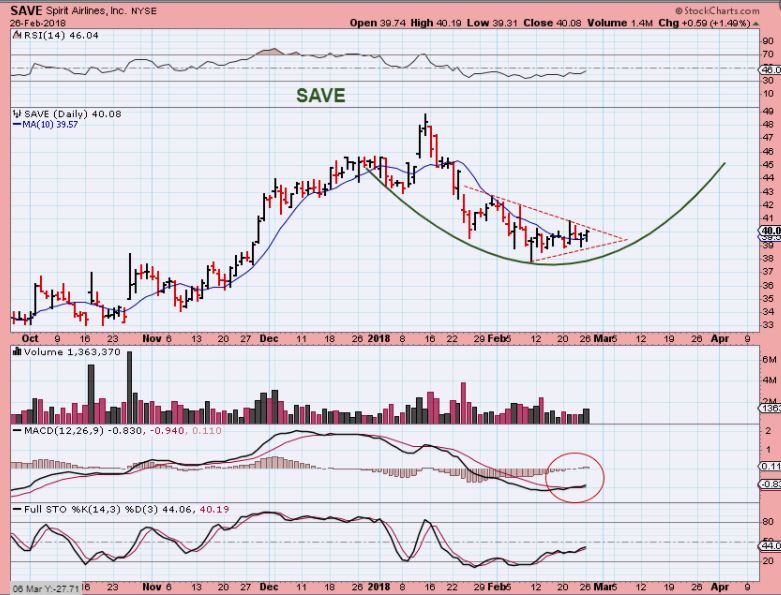
SAVE – BayTrader mentioned this yesterday and I liked the chart. This is ‘Spirit Airlines’ and it may be forming a cup after the recent sell off with the markets. It broke the down trend (not shown). I did draw in a small wedge that could break out today (MACD is bullish, Volume increased). Low risk, because the stop is under recent lows. Earnings were released Feb 6.
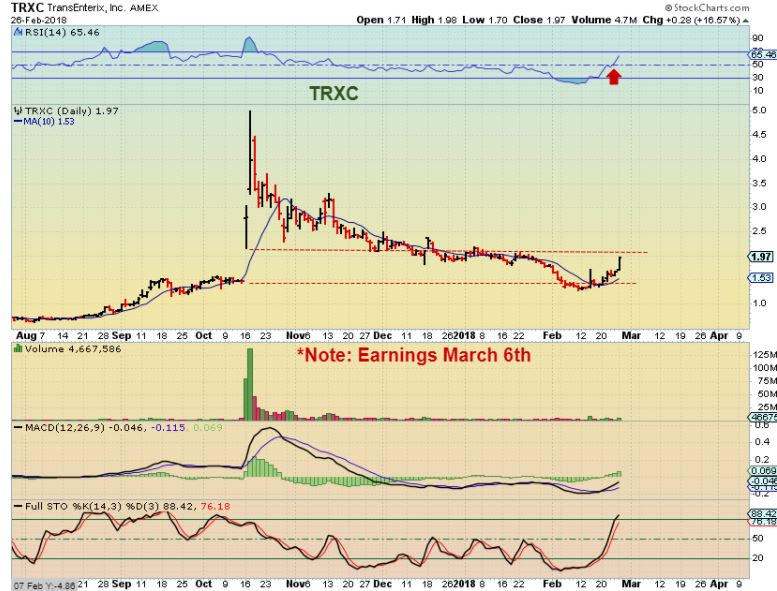
TRXC – This is a “Medical Robotics’ stock and it had a massive break & run last October when it got FDA approval for its medical Robot that assists in surgery. It is said that this puts them in competition with Intuitive Surgical. 2 Large Gaps higher occurred and now they have filled. * MARCH 6 EARNINGS
EDIT: TRXC broke above the 50sma, it may be best to wait for a back test, and that may occur on Earnings.
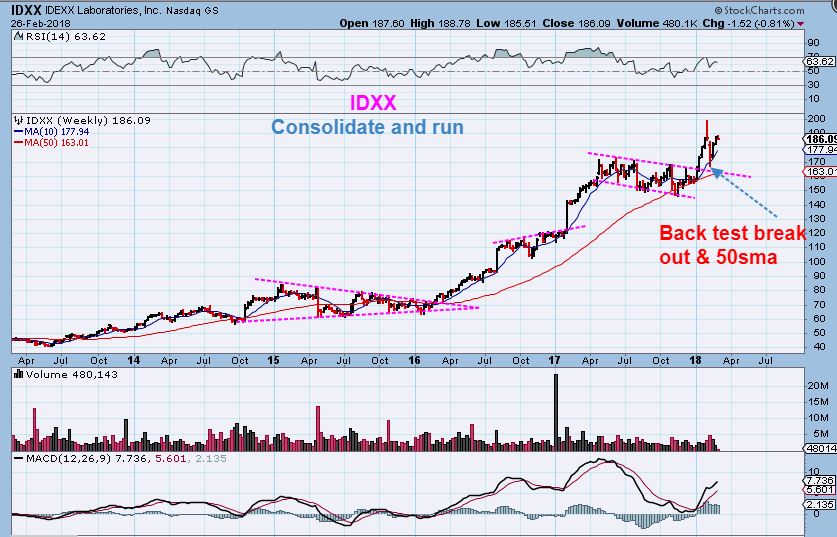
IDXX – For the longer term BUY & HOLD investor, this company engages in the development, manufacture, and distribution of products and services for the animal veterinary, livestock and poultry, dairy and water testing markets. You could do some ‘due diligence’ – their earnings came out Feb 1st and looked good at a glance, and they increased guidance again.
Feb 24th Weekend Report 
 Feb 28th – Reminders
Scroll to top

Alex, is this chart Bullish or Bearish? https://uploads.disquscdn.com/images/85f78cf51c865cf9b3344b8caa2264924c3b9d1fe61d02b87da1edf0f8259b91.jpg
Wouldn’t one need more information that just price movement to accurately access a chart?
Aside from that- you have posted a chart of Gold. It is longer term bullish, short term it has room to wiggle around , even within your purple lines.
It’s still a long term gold chart like yesterday. And still bearish as you have drawn. And yes, clearly recognized that as gold from yesterday’s post.
TRXC in the report broke above the 50sma, it may be best to wait for a back test
I added an EDIT in the report next to TRXC, just a thought about Earnings and a back test
I was just running through some charts for the long term, and this one always comes up into my mind.
CRAZY how it just keeps drifting within these parameters, huh?
When we get a sustained move in Silver this will be a great one to own, in my opinion. If this downward drift keeps up, however, we’ll be buying it near $4?? https://uploads.disquscdn.com/images/76575f97ade603814b141196e98e7711dba7bb6e39ecd623200e2e54f3d0f4b7.jpg
I agree. I haven´t owned this one in awhile other than as part of an etf, but opne day AG will run 400% in a year or less.
For now I am stepping away from the computer most days, while waiting for a catalyst or some more substantial movement before getting heavily involved again. I have about 30% invested and am comfortable with that, considering moves aren´t following through, either higher or lower.
I bought VBIO last week. I like the look of daily, weekly, and monthly charts. Still basing but weekly BB’s are tightening.
That does look good in a few ways Chap.
Really interesting 6 month daily chart too – I like the tight price action on the daily as it approaches that wedge or triangle apex.
It looks like GOLD broke that bottom trend line on that sell down this a.m. ( refresh)
It cam bounce and go sideways, but usually that indicates that the price action will be to the down side over time.
https://uploads.disquscdn.com/images/a92db7922fb6bcc4e279973b5ab3ff9f079e6e38e50e98a6bb8edc6ec25a0b90.jpg
miners gap filled. now we need to some upside movement.
Miners are hangin tough despite gold selling down… not sure if that’s good or if they are just lagging…
When I saw the Golds morning drop break that trend line in the chart above, and Pre-Market I saw that GDXJ was heading back below the 10sma, I looked at GDX & GDXJ with a 10 & 20sma and saw this rejection.
It is sideways chop lately, but losing that 10sma was not a good thing to see, especially with day 11.
https://uploads.disquscdn.com/images/f34c553d2f9e0bacfd157226daef9078dda156dfb098aaec0ffdaa6147b8ac99.jpg
I jumped on that JNUG buy from yesterday in the premarket and sold for a tiny loss.
Thanks for the update, when I saw that spike lower, I knew it was going to be bad. Maybe time for DUST
I flipped when I saw the GOLD trend line break on day 11 & GDXJ back below the 10 & 20sma.
I’ve been trading fast for the first hour of trading.
There has been a lot of sideways chop, but at this point, I think that GDX not getting above the 10sma, and GDXJ giving it up could indicate further weakness
I see no option but to go ahead and realize losses on miners at this point. Rate hike assumption from Powell killed it this morning. Same thing we same in 2017 – Feb selloff into assumed rate hike, where it could finally bounce.
I would advocate that we can move from “sell on strength” (which had been my current position) to “short into strength” at this point. Clearly just no reason to be long for anything more than a 1-2 day trade at this point.
Added to my CY at the open 16.75 avg now.
Is there news anyone can find? CY seems to be the only semi running this AM.. didnt expect this pop… I was hoping it would continue to move sideways lol but Ill take this move up
I take that back
MU is up, but if you pull up a bollinger band, MU has been riding along the upper band. Cy has not reached it eyt ( getting there today)
Usually MU can ride the upper band, but also pulls back to the 10sma after that
Markets pulling now…
AMD actually doesnt look too bad here 🙂
Go figure on NSRPF?
When you said this, I pictured new lows.
Go figure 🙂
AAPL new ATHs
https://uploads.disquscdn.com/images/d0c8d78ad4d37581f618c8807ff4986739a4ed522b592c8c7037bf912796f657.gif
NFLX too
Is it just me, or does anyone else think that this was a dumb idea—— remember PCLN, ( Priceline)?
It is known as a high flying stock, always making new highs, Bullish Bullish Bullish. This week they did something that I would think is stupid- they changed their very well known name & ticker.
Steve – I commented on your post yesterday, but was probably too late for you to see it. Most of my activity is in the general markets in high price names, but I do try to apply cycle analysis and find it really helpful. Question for you – what do you do when the market hits a peak? Do you generally go on the sidelines or do you like to play the short side?
Ron, I’m not comfortable being a bear, so I plan to go mainly to cash when the market is in a downturn. However, if it looks like a strong long-term down trend I may buy a little SQQQ but I hate shorting a bull market because it can turn fast on you. Look what has happened to the stock market bears this month, they have been getting clobbered since Feb 9. Most of my trading is in retirement accounts and I have a 2 day hold rule for settled cash. It’s easier to go short in a margin I account (I have a small one) where you can jump in and out fast. In my retirement accounts I have to move much slower to avoid whipsaws where I could get trapped on the wrong side of a trade. I TRY not to sweat the wiggles, but sometimes that is easier said than done. For example, I will not be surprised if TQQQ fills the gap and dips down to its 5 day EMA around $168-169 sometime over the next few days. I expect dips along the way, but my current hope/expectation is that TQQQ will rally strong into May/June before a significant rollover and drop into an “ICL” as Alex calls it. I will then probably scale back into a high cash position and wait for a good buying opp. But as Alex always says, I take it day-by-day even when I’m not planning to sell anything because the market can change and my outlook can change with it. Hope that makes some sense. As I always say, don’t follow me, check your own charts and make your own trades, and please follow Alex’s guidance because he is a much better trader than me.
Sold 250 shares of TQQQ at 176 from 162. Big gain for me on small amount of shares… Thanks steve lol… Holding the remaining 250 to see how things go from here
BT, I know you are primarily a day trader, so that makes sense. Never hurts to book profits! Congrats.
I also considered taking profits today on the TQQQ I added last Friday @ $165.50 but I decided to stick with my plan and “let it ride” longer term with a stop loss slightly above break-even on those shares. I expect/hope to make much bigger gains over the next month or two.
Looks like TQQQ filled the gap today as I expected. I was hoping the gap fill would happen today to “get it over with.” Now I hope TQQQ gets back to grinding up.
EOD update: I’m still playing TQQQ for the long haul and as I said riding out the daily wiggles is easier said than done in real time Even though I expected TQQQ to fill the gap from yesterday it was still not a lot of fun riding it back to down and giving up yesterday’s gains. Another “Fed Day” reaction similar to last Wednesday. Looks like a short-term top so selling this morning was a good idea for day traders, there may be another down day tomorrow to touch the 5 day EMA. TQQQ still looks bullish on my daily and weekly charts, so I’m sticking with the long term plan to hold until May … unless something happens to change my longer term outlook for stocks. Good trading to all!
Now we´re talking, if my numbers are correct, HUI only has about 10% more downside to get to the 2016 low that many are looking for.
If we get down that low and break those lows and see a strong reversal, that is a Major Buy- It’d probably sling shot out of those lows and act like the run out of the 2016 lows .
However, what you said, is true and it bothers me. You said, ” …get to the 2016 low that many are looking for.”
SO MANY are just waiting for that break. I have even heard some say that they wont buy Miners until those 2016 lows are broken. I always feel like when I hear that, they could be left behind.
We’ll see, but so many are looking to buy that 2016 lows break & reversal.
Yep, as we break the recent lows I intend to start buying again. I won´t try to catch that 2016 low for the very reason you mention, too many looking for it. I want to be close enough, and can hold through a drawdown if we are anywhere close to the bottom down there near 161 on the HUI.
I also have to take into account that I am not good at paying up on any given day, even though I have seen you do it many times as you wait for confirmation but still have tons of upside. I prefer to buy into down days, despite trying to work on that over the years. Seems when I buy into strength I have a hard time buying big size, sometimes those would be monster trades, and they are certainly safer waiting for miners to turn up before loading up.
I agree, I will do some buying before we get there (Not leverage unless I get a clear reversal, but some Miners are better than leverage as it is ) 🙂
And we´re betting the other outcome is very unlikely to occur, that HUI breaks right through those lows and keeps on going! lol
Did a lot of trading in the 1st hr, and I did give this a try, with an easy stop under the 50sma.
https://uploads.disquscdn.com/images/510d1b81bfdd80ce7df51471ec12583cb2c2fcd2331d62722907ffd3afc07eea.jpg
if this is just a b-wave correction.. i can see it topping out at about 2.40, so there’s about +25% overhead
*edit +25%
I glanced quickly and thought this was Tammie – LOL
Thanks SOG
LOL hahaha, yes, we appear to both be YELLOW now 🙂
better watch out… there’s a new kid in town
actually i should say , that’s a falling target.
2.40 if it went vertical today, but less tomorrow.
this is how i read it …2d net chart… 2.10-ish perhaps a more conservative limit to the rally
https://uploads.disquscdn.com/images/c070b59c28041610a428095722d984e0dcc0a08359623ea655533d1b25e75b66.jpg
Update: Tagged the 50 & turned Green. Interesting
EDXC – (Refresh ) After breaking out above the 200sma, and the 50sma, and breaking out above a consolidation (And thus breaking out on that long weekly chart), it sold off every day and each “back test’ Failed. Ugly sell off and I see no real reason for it news-wise.
I still own this from 3 cents and will continue to hold, but that was a whole lot of give & take 🙁
https://uploads.disquscdn.com/images/55e682c0c2cb093f9f27cf7eb65f660871e62f757455b42a95c604aed72a5a99.jpg
You can play that trading range for a good risk reward.
You mean if it stops at the green line and runs to the red?
You could ( If it stops). That has been some pretty relentless selling.
I am almost tempted to add to my long term holding somewhere down here and just forget it all again,
I just wasn’t sure if this wanted to test that 200sma too. .
Ive played it before. Buy at 0.0605 and sell at 0.078, Viloa 30% set a stop 2.5% lower than the buy. , https://uploads.disquscdn.com/images/ae7cc7e675e0889d68e7bb4f08882543209f83126c86ffd70c45f7bff632e9d2.jpg
Yes, thtas what I said, from green line to red line on my chart …. IF IT STOPS there. It could go to the 200sma 🙂
My broker wouldn’t allow a trailing stop or stop bc it’s ORC. I got screwed and now have to hold for the next pop. Smh
EDXC just like a champ, hits the low and buyers jump in.
EDXC topped then this article
https://finance.yahoo.com/news/endexx-engages-operations-vp-top-130000044.html?.tsrc=rss
notice that SN got a real pummeling back down today..
could be a bargain buy at the bottom of this apparent c-wave, in the near future
I see a few energy dropping, and BAS looks like SN. CRK getting slammed too – , TPLM, , etc
DRIP Not looking too bad though. Im just not convinced that the time is right for that yet
what time is the FED chair talking? could it be a market mover?
He already spoke…..sent bonds down/rates up…hinted at possibly 4 rate hikes this year instead of 3….so it spooked things a bit….
NAZ, SPX, DOW, QQQ down, Sox up a bit, MU still running like a champ.
I was going to sell 1/2 as it approaches $50 though, maybe sell all depending on how the markets act going forward
Im in MU, let me know your thinking and timing please
Me too. Semi’s are on day 11, still good volume on MU, up 9 out of 11 days, what are your spidy senses telling you CF?
now to confuse things just a little bit more
UUP rises up toward that 50sma on light volume, especially compared to the run up in early Feb
GLD breaks down through the 50sma on lightish volume & tries to recover
Simply chop chop chop lately
I was chopped up today like parsley on a cutting board. Out out of miners and leverage. Please let me know when you see signs of life because my head isn’t where it needs to be to determine a good entry.
Ya, I’ve been chopped up so badly since mid January actually……can’t seem to get it right…trying to shed things and get on the sidelines for a while
That’s where it turned for me too.
If I’d sold everything then and stayed out, I’d be ok….but I had to jump in and out for the past month…..argh…..disgusted with myself
I cant tell what specifically is being discussed here, but if you mean MJ stocks, most have been running along under the 10sma, and are not worth holding until they finish consolidating and move & stay over the 10sma.
chop chop is not good action either bullish or bearish. You mentioned gold is in its 11th day of a new cycle, I think today’s action is quite bearish, but since we are still about $80 above the December bottom, nothing seem lost. SILVER is the one baffling thing as the COT number is at prior ICL levels. I am surprised about its inability to run higher here. There may be something more than cycles here.
CF, I think more than a few of us here would like to hear your take on MU’s action today:) TIA:)
I dont understand what you mean? It is acting correctly
Oh, that’s a relief then. I thought you might’ve thought that the eod swoon would be worrisome. I kept mine as I thought it was acting rather strong relative to the market all session long. I figured the eod swoon could’ve been daytraders taking profit off the table:)
Oh- I actually hadn’t seen that…I only looked at the daily chart.
I was away this afternoon. The markets had a bit of a sell down today, and MU would likely follow the markets if they crack.
Wednesdays report has been released