FEB 18 – WEEKEND DIGGING
I have done a little more digging, looking for the best way to answer your questions. I think that you’ll be happy with much of what I have found…
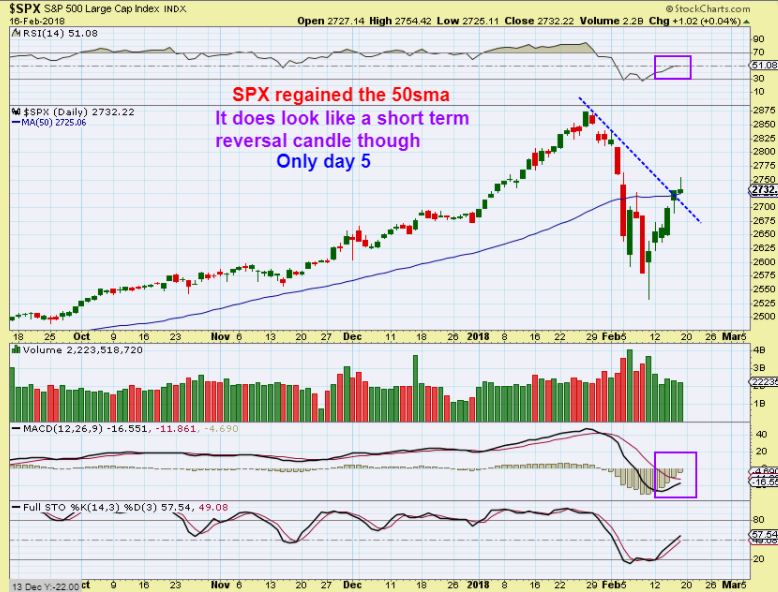
SPX – At day 5 of a new daily cycle, price has gone straight up and it has been safe to be long with a stop. The question is, was it an ICL or just a dcl that eventually drops again? Time will tell, so let me explain further…
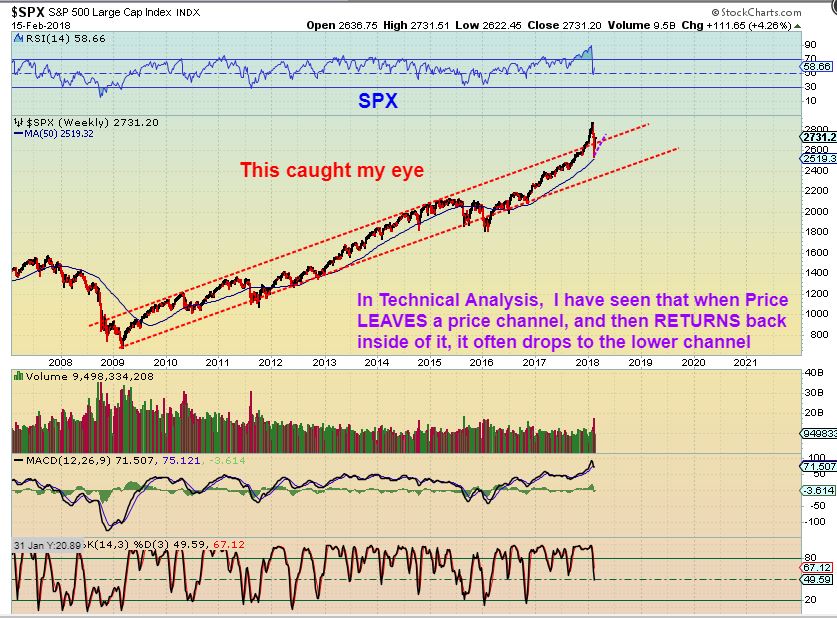
SPX WEEKLY- This caught my eye, please read the chart. An A-B-C drop would take this to the lower channel.
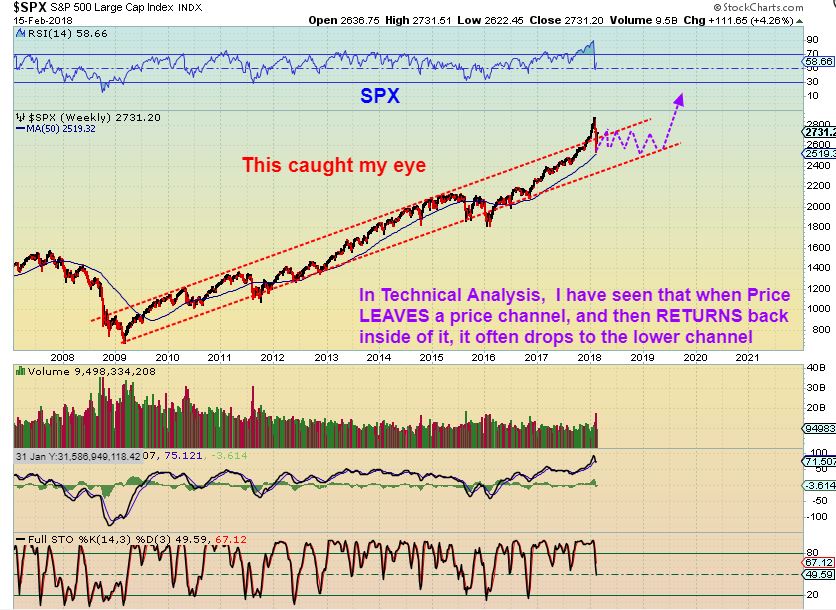
SPX WEEKLY – A bullish sideways crawl would too, but this would be a multi-month sideways move like 2015. We could go sideways & Chop for the next 2 weeks too. *You will see this chart again later in the report
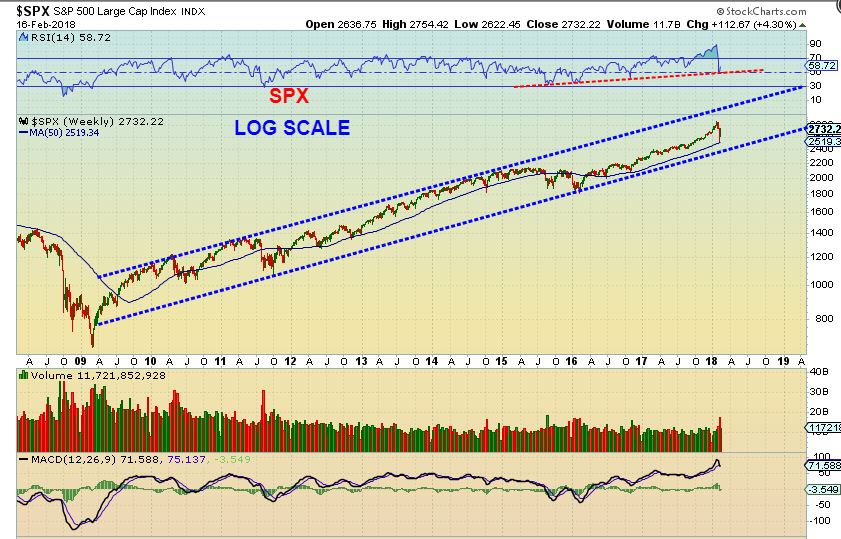
SPX WEEKLY– Using a LOG SCALE , we simply have a back test of the 50 week MA, inside of a channel. You could still get that a-b-c down to the lower level though, or a burst higher to the top in this Big Picture view. We use trailing stops when price continues higher.
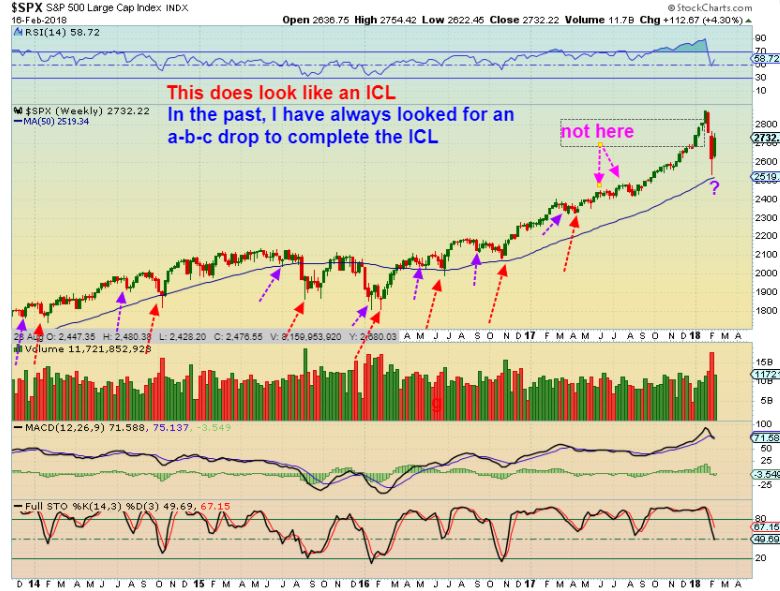
SPX WEEKLY – Just a visual – Past ICLs were almost always 2 dips of varying length ( Like a-b-c). Even just sideways moves happened with a slight break of the lows, so I can’t ignore that. We simply watch to see if the markets run to new highs or go sideways over the next 2 weeks.
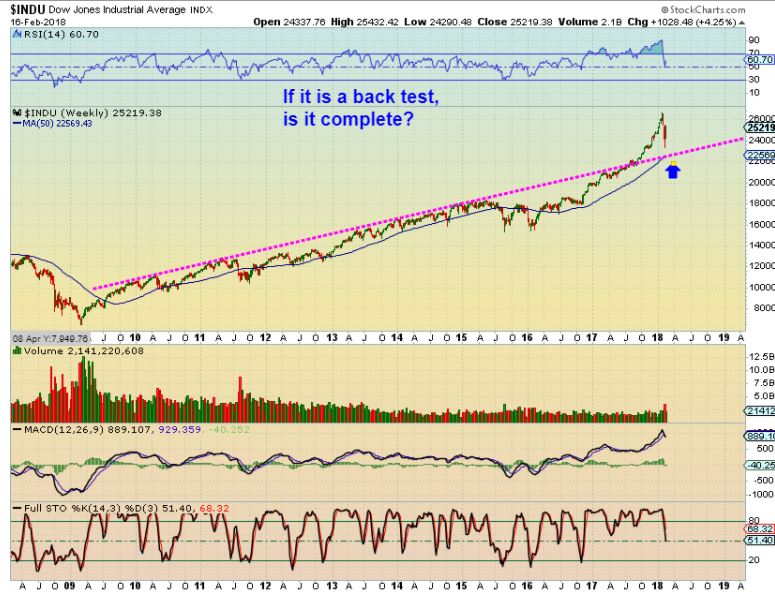
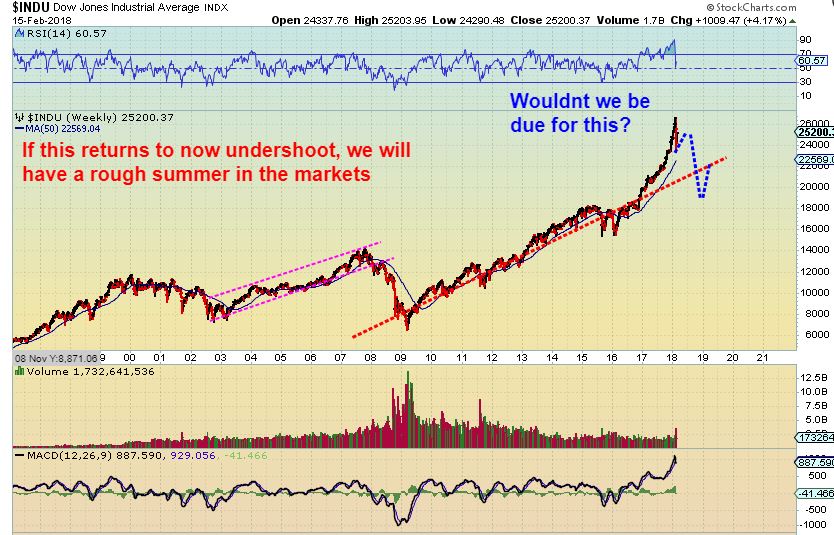
DJIA – Same idea here, so I am short term bullish with a bit of caution in the big picture. The run did look a bit parabolic as mentioned in past reports, but this CAN still go higher too, so we shall see. Rate hikes also could begin to stifle things.
DJIA – It looked parabolic, but that doesn’t mean that it DID top. It could go further, we will know in a few weeks.
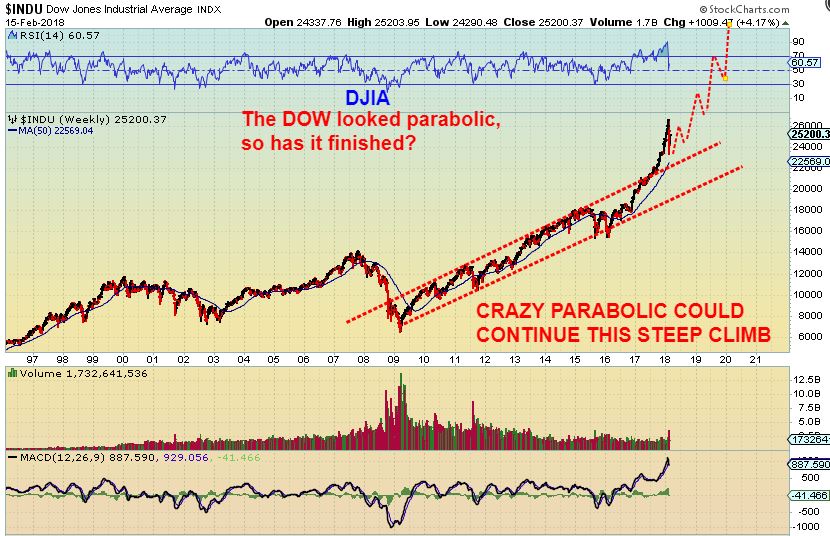
DJIA – I don’t expect a drop like 2008, but it basically took 1 year to clear the extreme sentiment & Flush excess from the markets. Will a rate hike environment stifle growth or will the New Tax Environment help Growth?
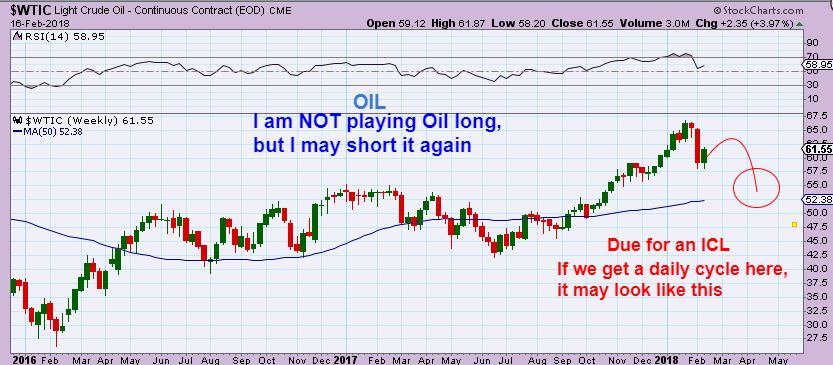
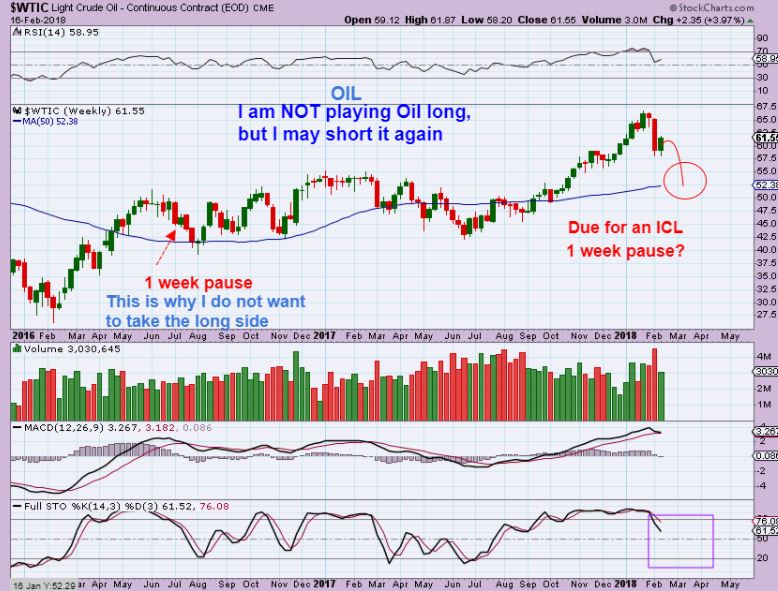
WTIC WEEKLY – I have been saying that I expect a daily cycle in Oil to form as Left Translated, and roll over. The COT agrees. I may eventually short the bounce.
WTIC WEEKLY – Notice the 1 week pause in the past 2016 drop. THAT was a weak bounce, so I want to watch Oil and see if the bounce weakens sooner than later too.
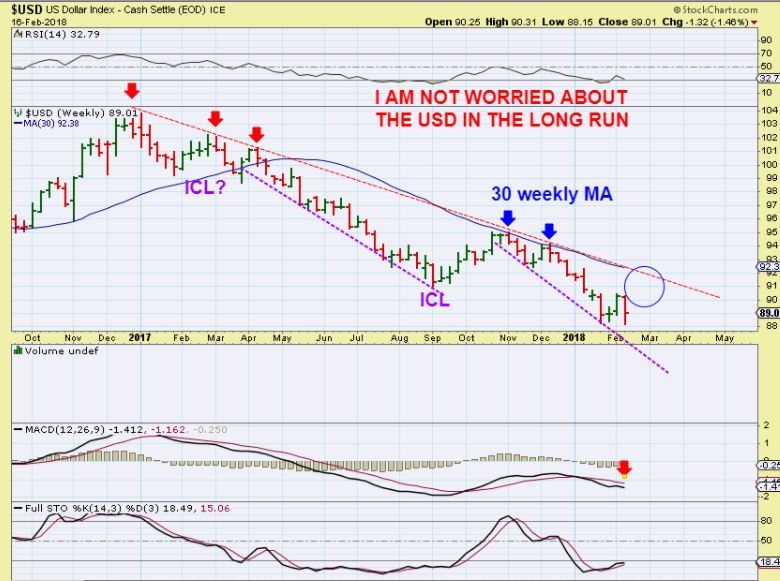
UUP AS THE USD – SO FAR, the recent bounce started with light volume compared to the first one. It CAN pick up, but so far, I’m thinking we bounce to the 10sma and could continue down.
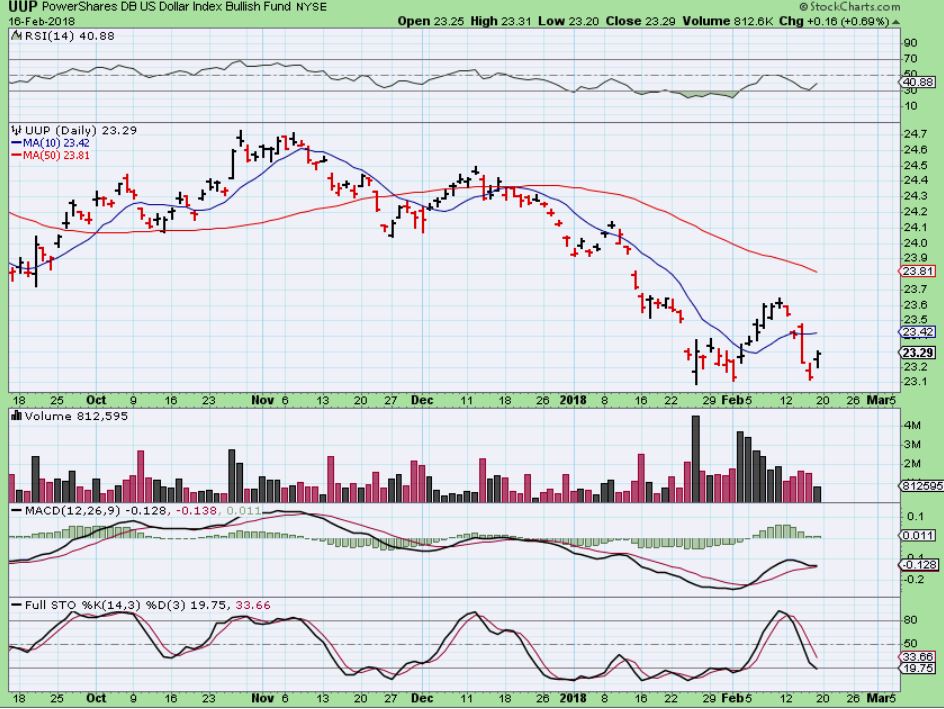
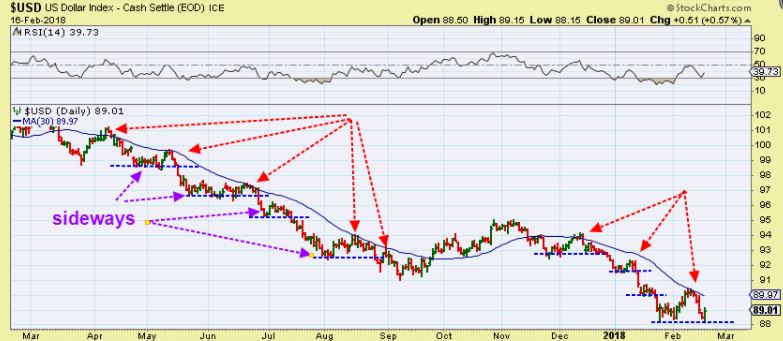
USD Daily – In the drop of March to September, the USD was trapped under the 10sma and dropped, went sideways, dropped, went sideways. This Could do that too, it looks weak to me so far.
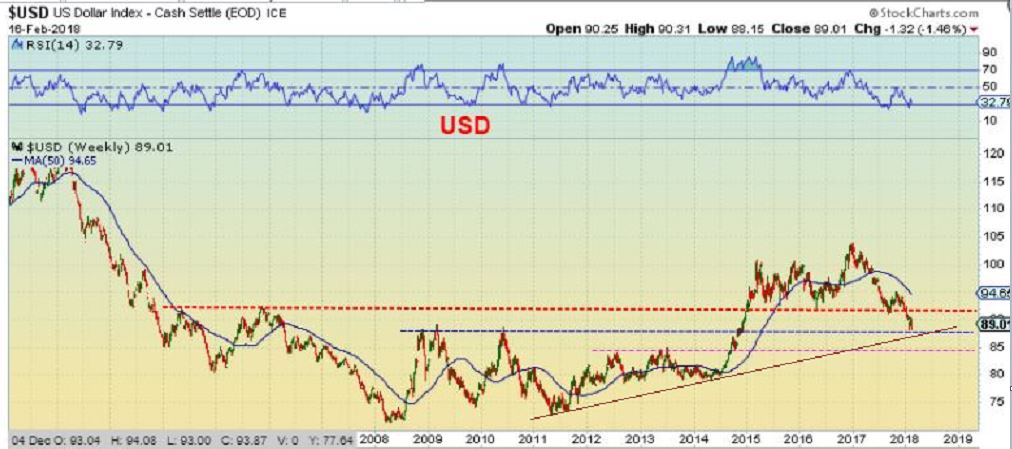
USD WEEKLY – The drop has stalled at support, so we could see that bounce.
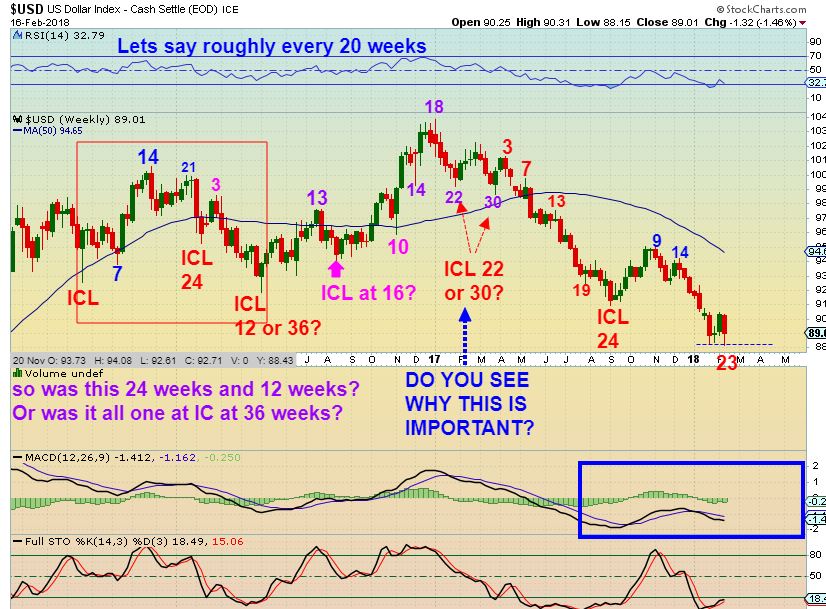
CAN YOU FOLLOW THIS? I KEEP HEARING THAT AN ICL IS DUE. IS IT?
USD – SO YES, ICLs are due roughly at 20 weeks, but do they always come then? Look at that RED BOX. That is either a 24 weeks ICL to ICL and then followed by only a 12 week topping on week 3? Or it is all one 36 week ICL to ICL! And then do you see what follows? A 16 week CYCLE in Magenta? So …
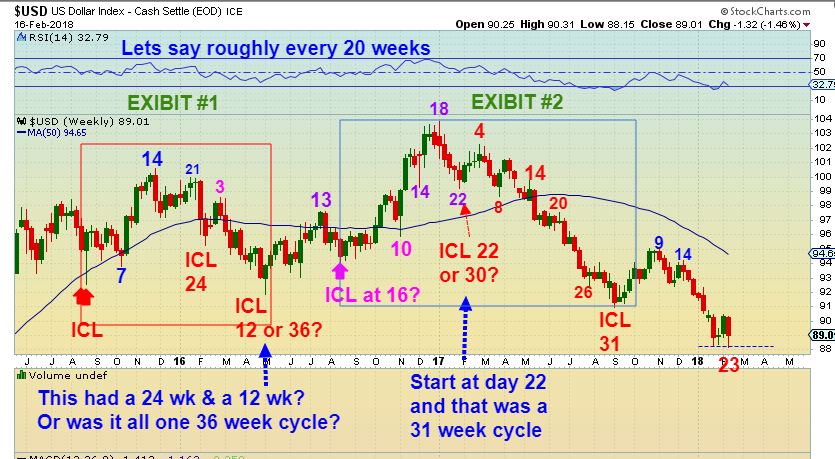
USD – RED BOX 12 weeks or 36 weeks? BLUE BOX, if that 1st Cycle is a 22 week ICL to ICL, then the next one was 31 weeks. Or is that first one to the number ‘8’, making it a 30 week? SO, our current count of week 23 COULD be an ICL, but now you have seen them 30 & 31 weeks long & even 36 weeks long. So this may or may not be due for an ICL, it may be a bounce.
USD WEEKLY – What if it IS an ICL? I would say that even a weak bounce would be the Most that it can muster up in the big picture. I measured the last drop ( Purple line) ICL TO ICL, so again, this could drop further.
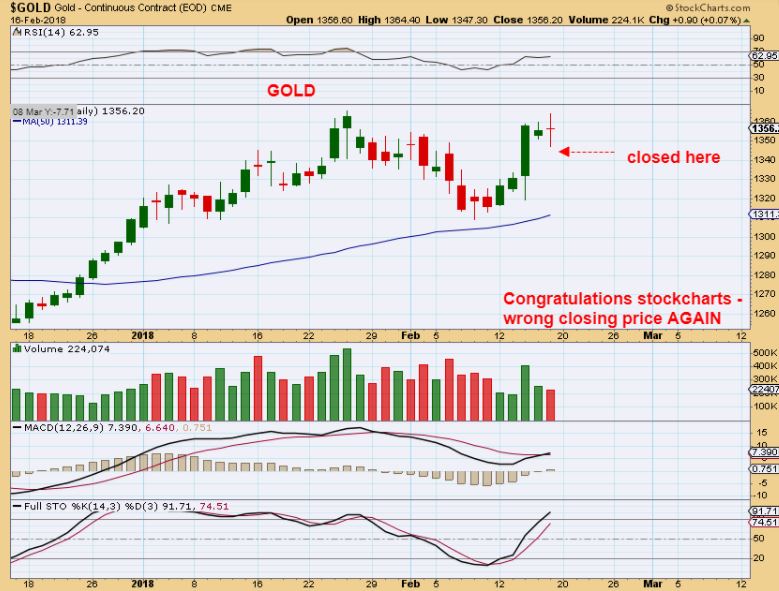
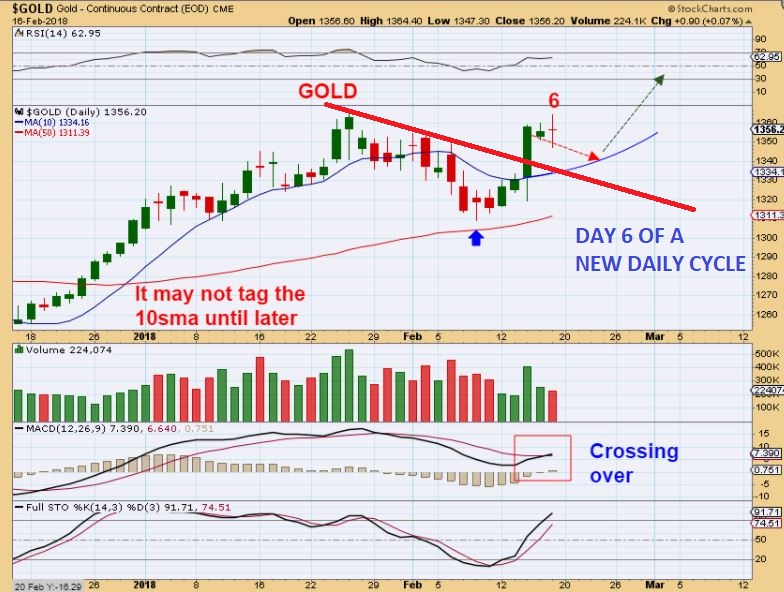
GOLD – FridayGOLD CLOSED AT $1346.50
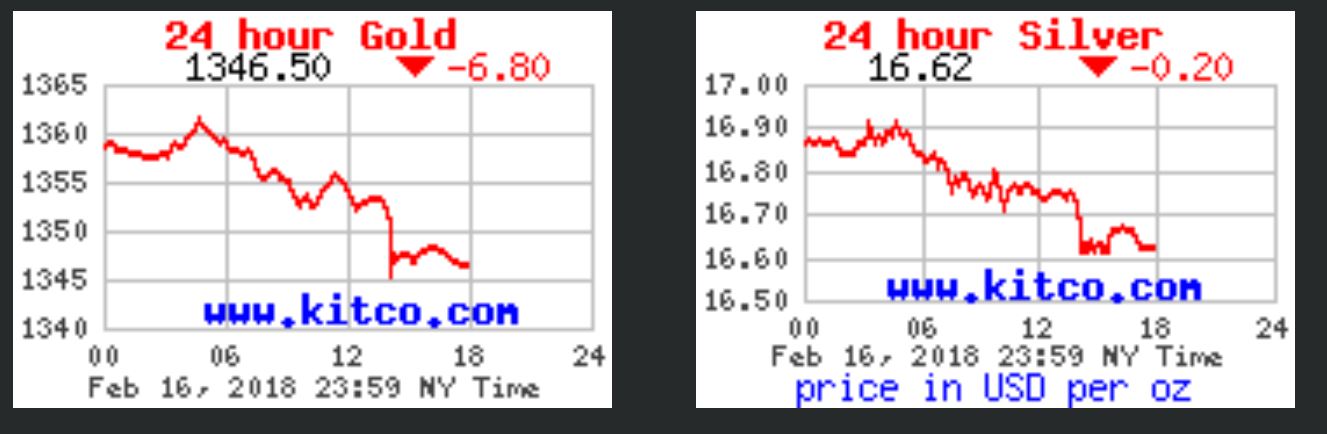
GOLD – Just a note: STOCK CHARTS FAILS AGAIN. They have $1356.20 close, $10 higher. Based on the chart above & other areas, Gold hasn’t seen 1356 since 11 a.m. Friday, so…
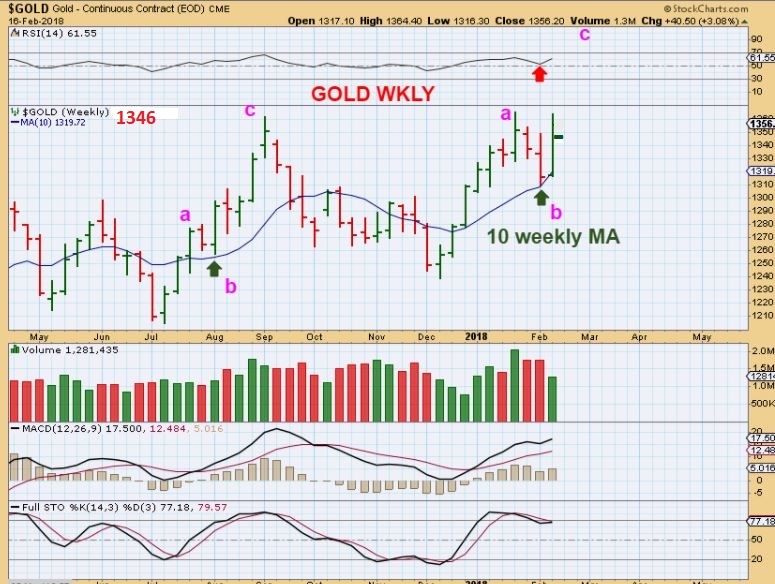
GOLD – SO I took my weekly chart and drew in the closing price. Gold bounced off of the 10 weekly MA, and does look like it wants to break out. I drew a-b-c type moves higher simply to show an expectation. This is not E.W. THE RSI turned up off of the 50% line at ‘b’.
GOLD DAILY – We are only on day 6 of a new daily cycle.
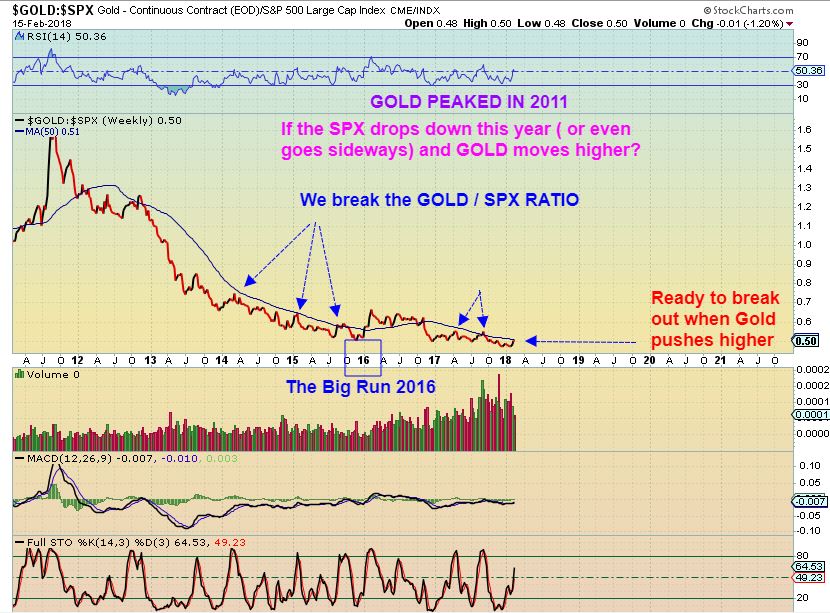
GOLD : $SPX – If this breaks out, it is bullish Gold. This would be from a Gold move higher, or SPX sideways or dips over time.
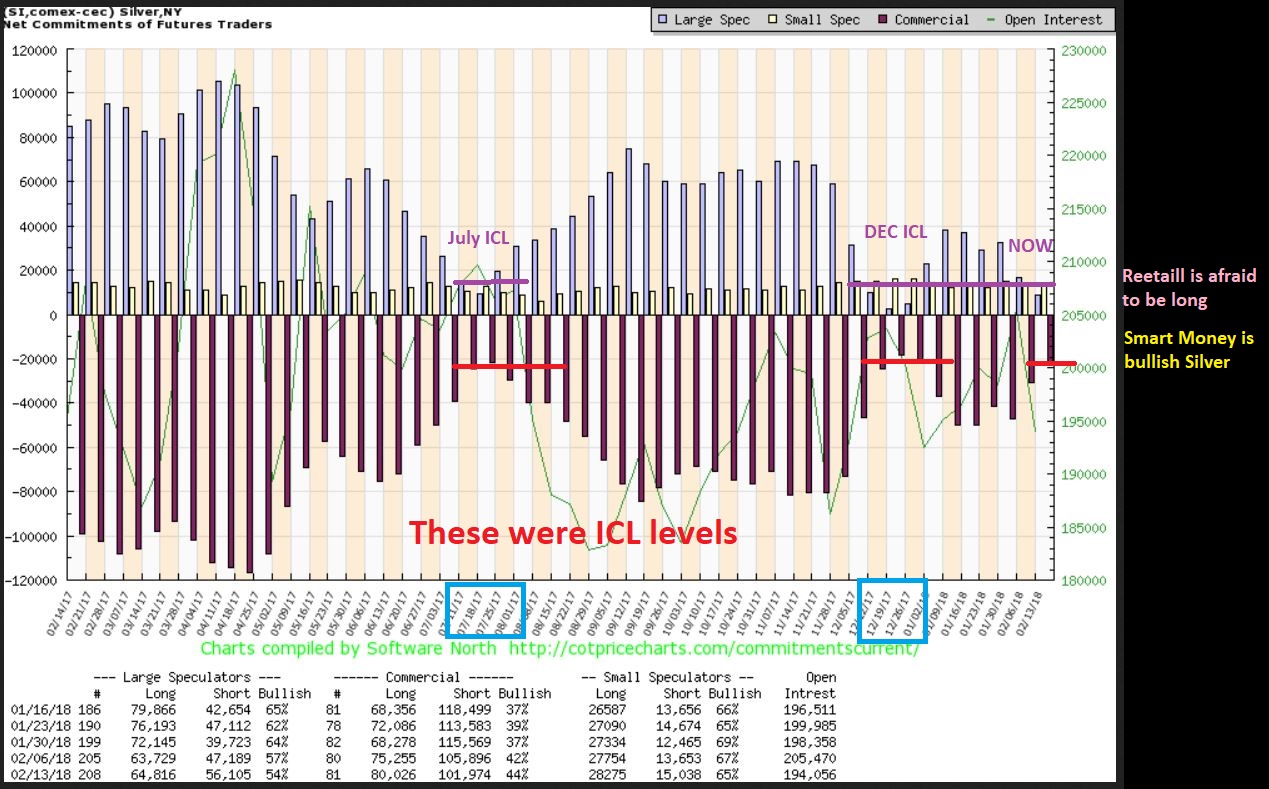
SILVER COT – The SILVER COT is back at ICL levels, as expected & mentioned in last weeks report. This is quite Bullish.
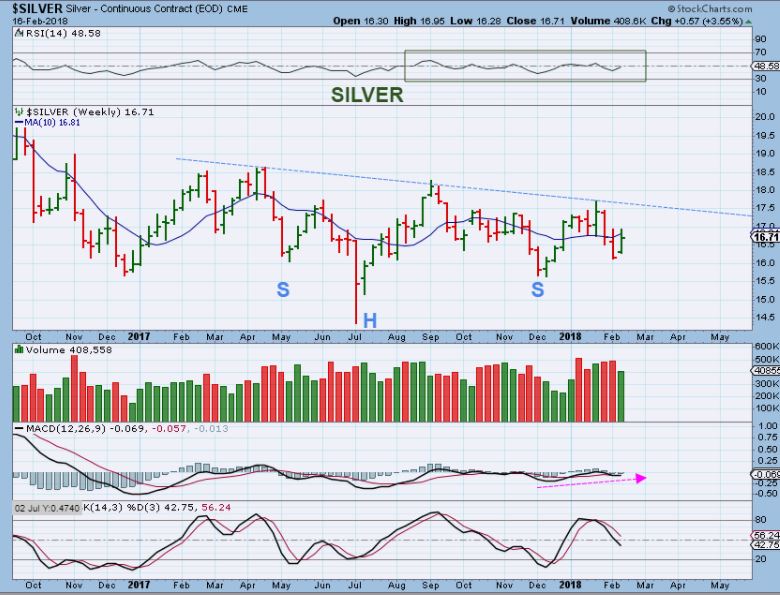
SILVER – We have a reversal on what appears to be week 1.
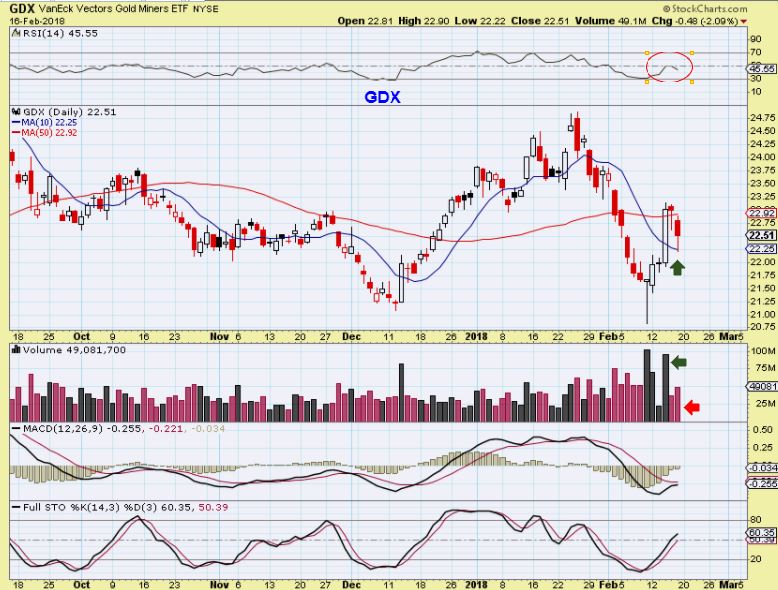
GDX DAILY – The daily chart shows that GDX fell to the 10sma on day 5, and bounced off of it. So far, nothing has been broken. Reminder: I did say to look at Dec. lows, and “if this pauses above the 10sma, it remains normal’. That drop had 1/2 the volume as it did on the way higher.
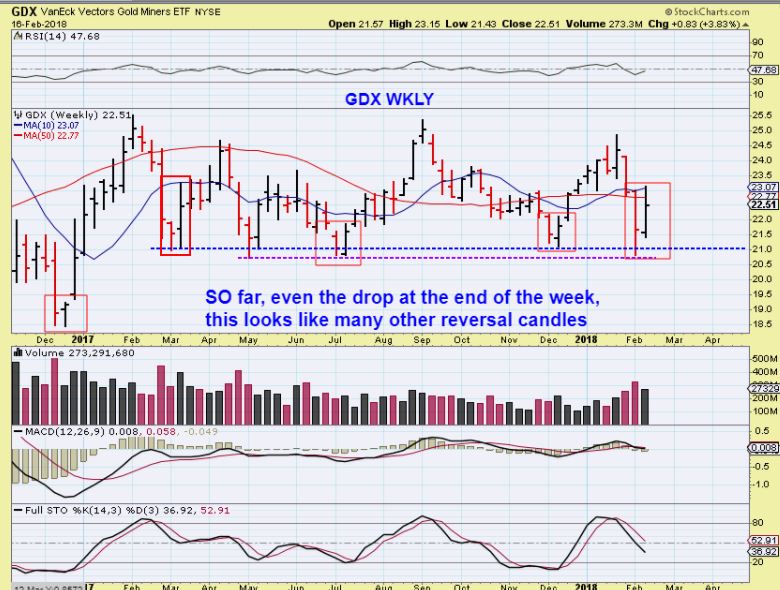
GDX WEEKLY – Last weeks reversal had follow through.
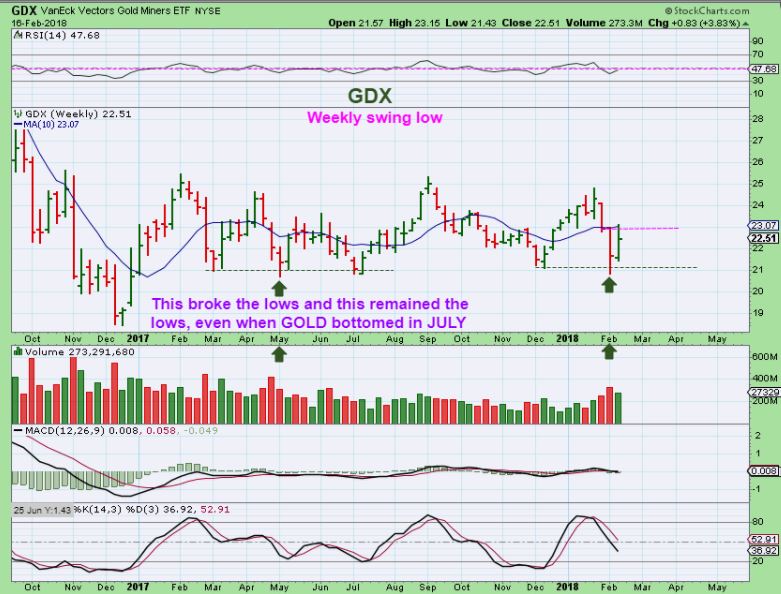
GDX WEEKLY – A weekly swing formed.
GDX : SPX – Looking at the 50 ( or 30) weekly MA, Miners look set up possible break out from this ratio. It would take acceleration in Miners (and markets can still climb), or especially Miners UP, SPX sideways or down. NOTE: It broke above the 50wma in Jan 2016. THAT was a BULL RUN in Miners.
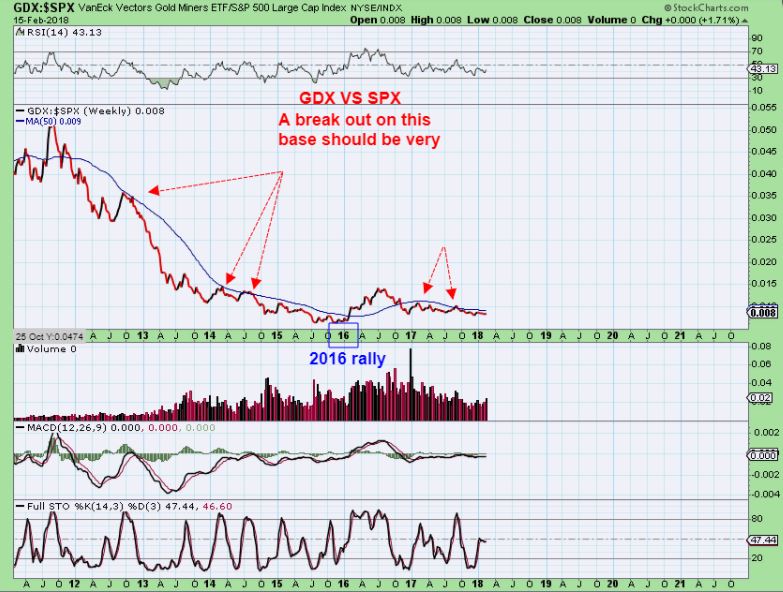
GDX : SPX – The last time the GDX:SPX broke out from a wedge/ triangle like this was also … the 2016 run. That was QUITE profitable, and the SPX ran higher too.
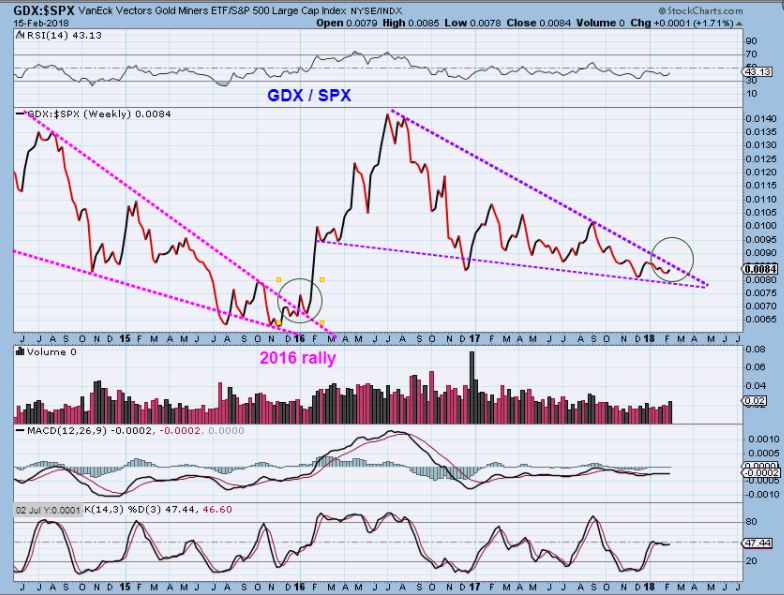
SPX WEEKLY – Remember this chart? A bullish sideways crawl would still be a multi-month sideways move like 2015. THIS would cause the above GDX:SPX break out too, if Miners rise. in 2016 Miners run, notice that SPX ran higher too, so we do not need the SPX to drop, we really just need Miners to run higher.
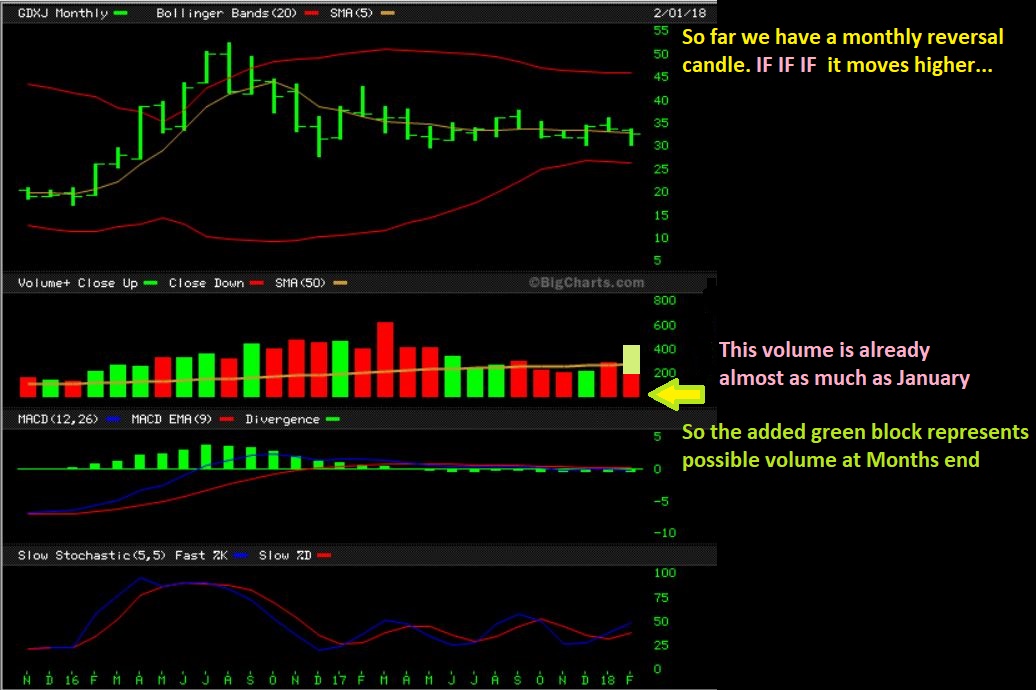
LET’S JUMP TO GDXJ MONTHLY- BULLISH OR BEARISH?
GDXJ MONTHLY #1 – Currently I see Volume almost as high as Jan, and Feb is only 1/2 over. I see tightening B.B., I see a reversal candle, so far so good. This is a Bullish Monthly chart long term.
GDXJ MONTHLY #2 – IF Feb miners price moves higher, you’ll get higher volume & a strong reversal like I have drawn here. We see that Bollinger bands are Tight and the MACD is rising above zero on a Monthly chart, it is a matter of time. If Miners move higher in Feb, and the chart ends like this, and you are still on the sidelines, I will be SCREAMING Jump in! 🙂
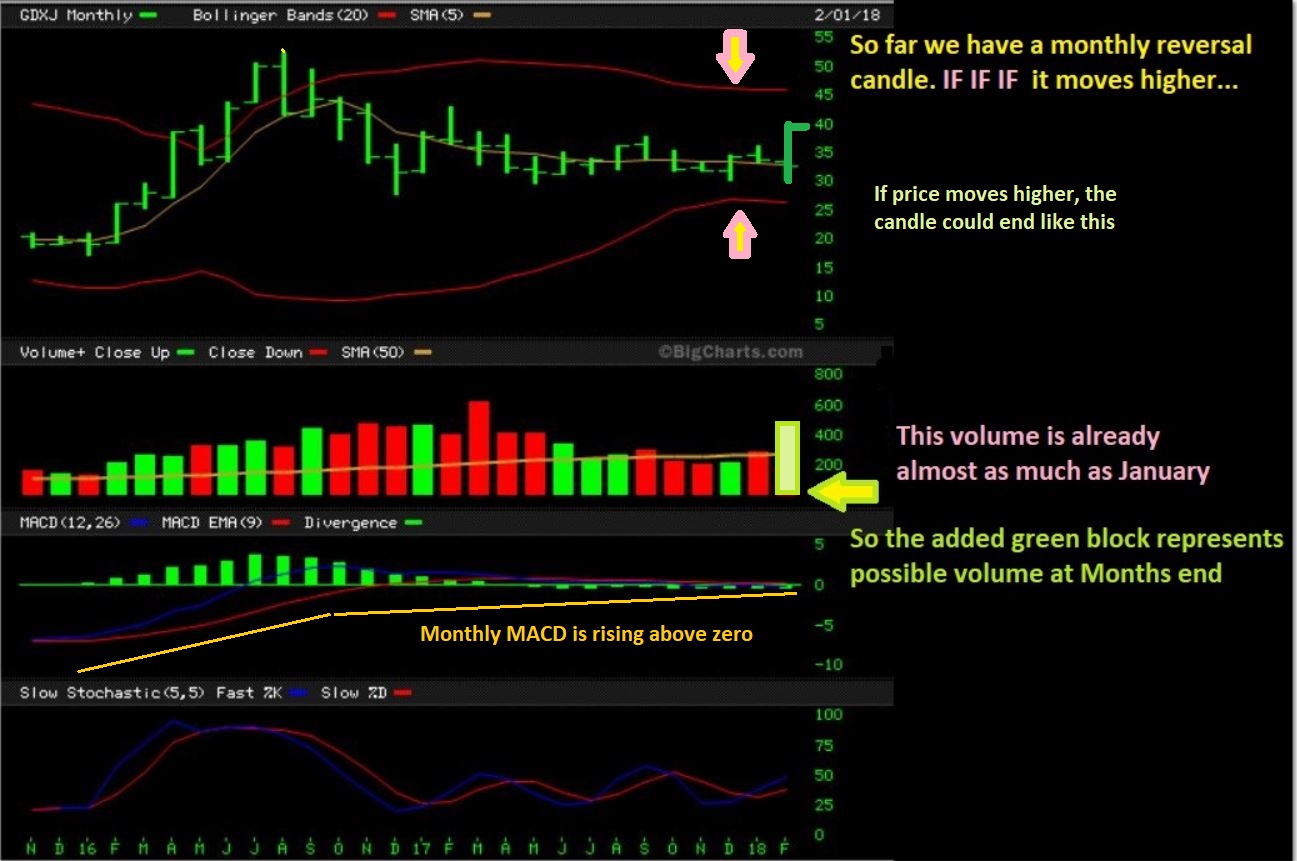
” If Miners move higher in Feb, and the chart ends like this, and you are still on the sidelines, I will be SCREAMING Jump in! 🙂 ” Until then, we take it 1 step at a time and look at probabilities.
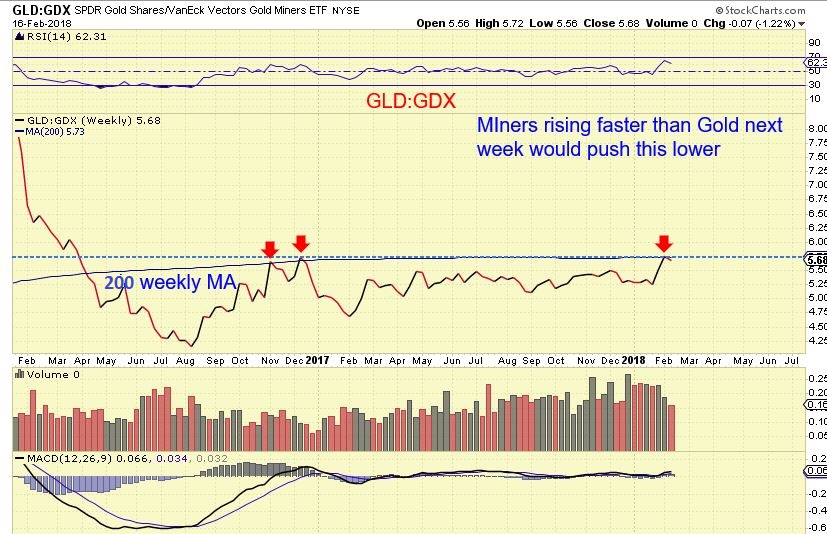
GLD:GDX – After the Big drop in Miners over a week ago while Gold was holding up, I’m surprised that this isn’t worse. After tagging the 200ma, it turned down last week. A move higher by Miners next week will likely push this down. A drop in Miners with Gold steady could lead to a break out.
.
That was your WEEKLY REVIEW, the Digging Deeper part will follow.The General Markets are early in a new daily cycle, so what do we look for over time? It will either become a confirmed ICL and rip to new highs, or we could have a possible lower low ICL later with an a-b-c type drop as seen in the past. Thus, using a stop ( Trailing as price rises) is appropriate until time reveals the facts.
OIL – I have been clear on. I do not think that the recent drop was an ICL. The COT is still very bearish, so I look for a bounce ( I will not play it long) and then an additional drop ( That I may personally short. I used DWT on he last drop , and SCO is available to short Oil).
As you can see, last Fridays sell down in Gold & Miners did NOT do any damage to the charts, so the Bullish expectations going forward remain in tact. Obviously nothing is guaranteed, but the analysis stands in tact after the strong reversal a week ago. At week 23, The USD is ‘within the timing for an ICL’, but we looked at a chart showing us that they have arrived at week 22 and 24, and also week 16, 30, even 36 host ICLs, right? So the USD is at the low, but it has been weak, and it could still break down further or put in a weak bounce. Stay tuned.
Please allow me to exaggerate here for a moment: I received almost ‘a million’ emails declaring that people feel that the Chinese New Year holiday starting next week (& it runs for 1 weak) – will kill Buying in Gold. I am told that GOLD & Miners will drop due to this Chinese New Year. Have you been hearing that too? I will dig a little deeper…
For now I wish you a great weekend and in the US, Markets are closed Monday too, so we’ll see you Tuesday in the Comments section.
And thanks for being here !
~Alex
.
“CHINESE NEW YEAR KILLS GOLD & MINERS”
.
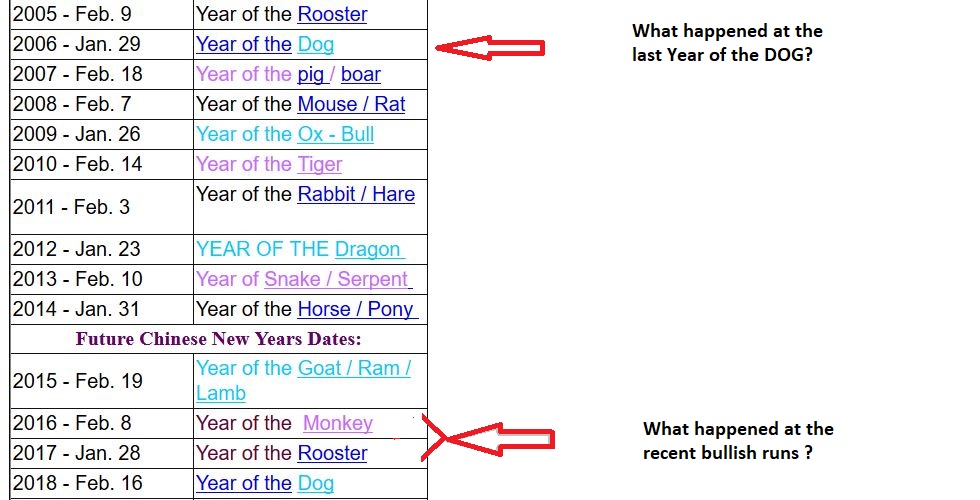
Below is a Chinese New Year Calendar – The holiday runs for a week, and the starting date is given. You can see that it starts on Feb 16, 2018 (Now). I keep hearing from many that on the week of the Chinese new Year, the big Gold buyers are gone & Gold & Miners will drop.
See the Schedule below , We are in the ‘Year of the Dog’ at 2018- so I want to know …
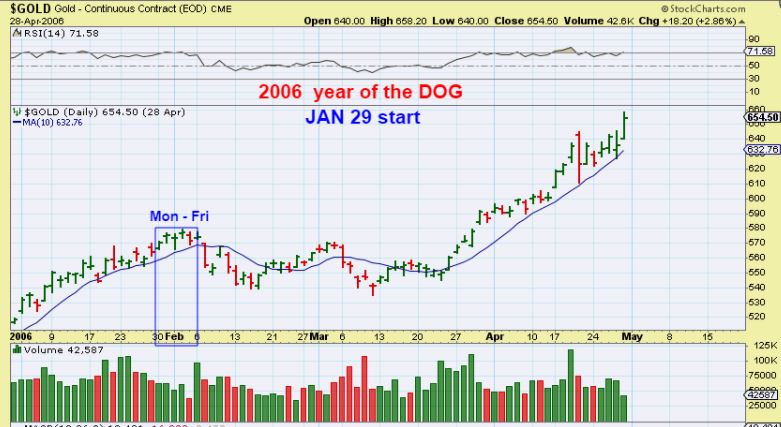
#1 – What happened to Gold during the week of the last ‘Year of the Dog” in 2006
#2 – What happened on Chinese New Years for the last 2 yrs, when we were coming out of ICLs in Dec? THIS IS HOW WE DIG DEEPER
ABOVE the last ‘Year of the DOG’ was JAN 29 , 2006. Basically it was the First week of Feb 2006. Gold was Green 4 of 5 days, Then it was due for a dcl and dropped later in early Feb.
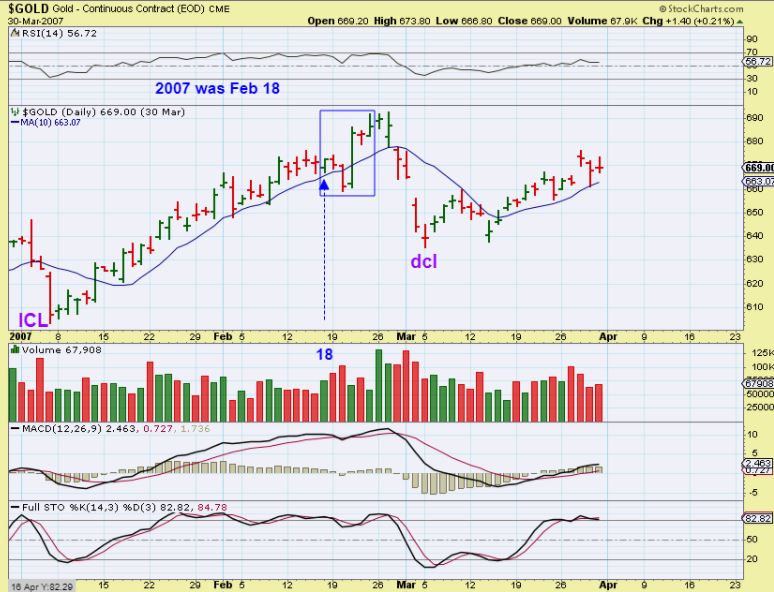
Just for the record, according to the above Chinese New year Chart, the following year (2007) was on Feb 18th. That Chinese New Year week Gold moved higher too. Then a dcl was due in March.
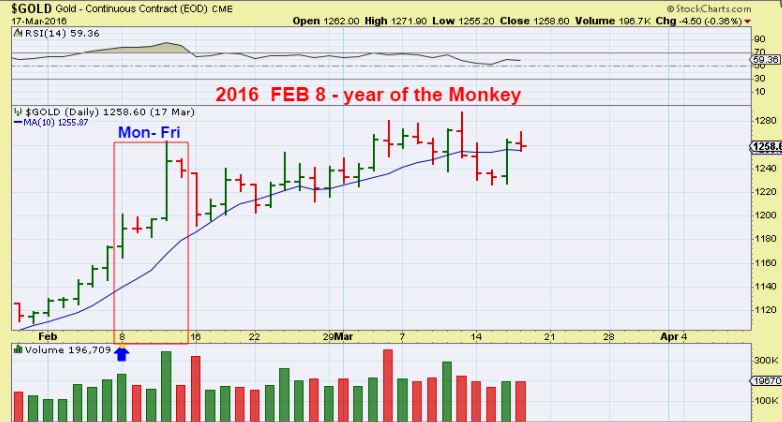
THE PAST 2 YEARS had Chinese New Years running into Feb also. They use a Lunar Calendar, so it is on a different date year after year, but you can see from that chart that Jan or Feb is the week that it falls on.
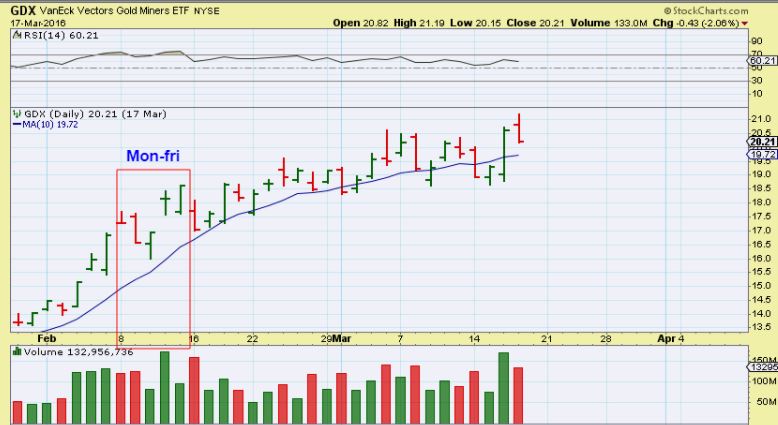
The chart tells us that the week following Feb 8, 2016 was the year of the monkey
GOLD FEB 8 – Gold ran higher
GDX FEB 8 – Choppy, but higher
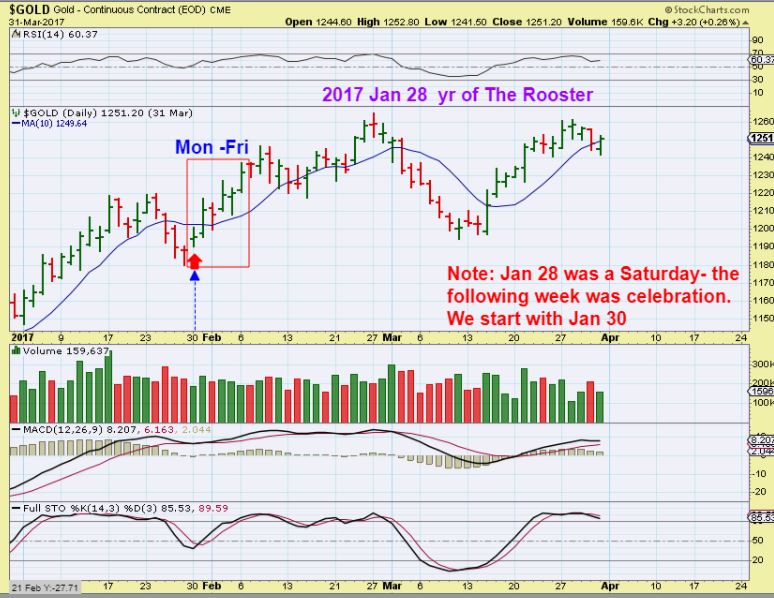
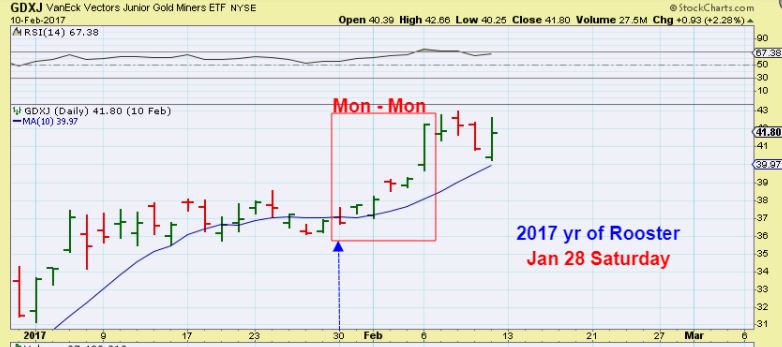
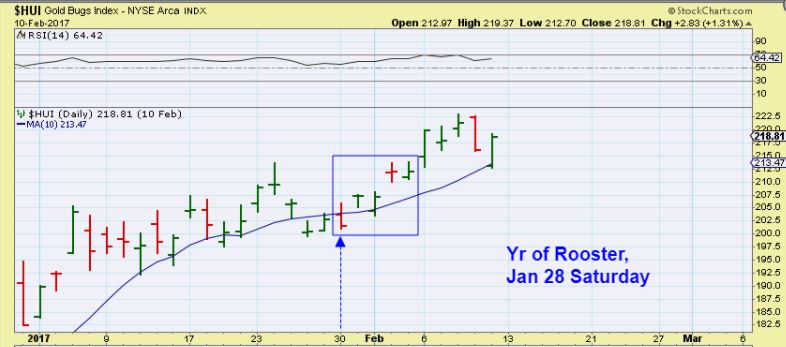
IN 2017 – JAN 28 was the start of the Chinese New Year
GOLD JAN 28 – Please read the chart, Gold ran Higher
GDXJ JAN 28 – Juniors ran Higher from $37 to $42 , I’d love that right now 🙂
HUI Jan 28 – Miners ran Higher
I never just believe whatever I hear someone else say, I dig Deeper.


Nicely done thanks CF. I will be watching closely if we break out for a tradeable interim peak in GDXJ
Me too, but I’m already pretty heavy. Kind of hope if Gold s going to pull back a bit more, it happens on Sunday to Tuesday morning and then rips higher 🙂
Tuesdayyy…. grrrr … who’s brilliant idea was it to close the market tomoro…. lol
kiddding ….
#obsessed
I think this is the year of “The CHARTFREAK” Great report Alex. Thank you, especially for analyzing the charts on other Chinese New Years.
Thx Kenny – I just had to see if there was any truth to it. There was the occasional big down day or two, but each 5 day period was higher at the end of that week, and 1 was a really nice week (2017 in fact)
Great report Alex!! What are your thoughts on the probability of general market re-test which may effect miners temporarily given they respond to equity and gold prices? Noticed that recent jump last week saw both $gold and $spx up and super-charged miners–more days like that needed!
I’m hoping for a change to GDX:SPX – not sure how or when it’d come about.
re-test? Maybe, not necessary, like I wrote, it could be an a-b-c drop too.
Thanks Alex. Even in an in between week, you still pushed the envelope and peeled back the onion. Lots of data points. How to put them all together?
My takeaways:
1. Likely not an ICL in the dollar considering the cycle count of gold and miners, plus the potential for a longer IC in the dollar. Probably a bounce that tags the 10 sma in the dollar.
2. Which means a bit more potential downside in gold this week, but as along as miners hold the 10 sma, we still look good in the current IC and DC.
3. Long term perspective still strong in gold and miners with potential big league breakouts on the horizon.
4. General markets: generally long and strong, but basically stay frosty and don’t get complacent with positions, especially leverage.
Please let me know if I’m off base, and thanks again for all your hard work.
Also, thinking of potential future catalysts for the dollar in the near term. We have the FOMC meeting on 3/20-21 and the yuan becoming traceable with crude futures (and convertible to gold) on 3/26. That timeframe would line up with a DCL or ICL in gold and could be a launch point.
That sounds like a spot on summary Peter- nice job! =)
The USD really could go either way ‘timing wise’ it has placed an ICL in this time, but the way you said considering the Gold & Miners count, likely just a bounce. That is what I am thinking – gold looks ready to go higher & its only day 5.
Alex, you featured the COT report for silver…what does the COT for gold look like now?
I would say ‘ as expected ‘. Shorts usually do climb as gold moves higher out of an ICL, and it has done that. It can just be producers hedging price, andI have seen that in the past.
I consider it basically neutral
Stockcharts uses the COMEX close of the nearest futures price which is around 1:30 eastern I believe.
I don’t have it trading at that price after noon
it could be 1:15, I am not sure. If you look at the price chart on the investing.com link it is close to the stockcharts quote.
https://www.investing.com/commodities/gold
I can’t see it on my phone very well, but I’ll check it out whenI get home, thx.
Their Natgas charts have been WAY off
Natgas is hard bc of the contract roll. The roll from Feb futures down to March lost a ton (like 40 cents but going off memory). Stockcharts shows that as ugly red and updates the charts to follow new contract but doesn’t correlate well with UNG. You really have to follow the futures at times for nat gas. Cause when stockcharts is off for gas it’s off bad!
Wow .. always impressed to the extent you gather charts, interpret, and organize and present information so clearly. What others would do in a week, you manage in a day….. hope you get some deserved rest tomorrow!
Thanks Crystal,
I do have plans to meet up with old friends for breakfast at 10 and just relax.
I hope you get to rest up too! Is school out? 🙂
Yes it is, just for Monday. Enjoy your breakfast!
… girl..really?
Lol lol lol
enjoy ur week off thelma….
Week off? Not hardly. Just thought I would say thanks … even if I am a dork 😉
My favourite part of this report was the bit about screaming at us. https://uploads.disquscdn.com/images/270cd1cfc26e4d24ae9afc66164920e2c4fc62e00b794ea3e9edb650d3f6763d.png
Not only was the SCREAMING part in capitals, but you wrote the sentence twice! Did you want that bit to sink in Alex??
I look forward to it, let’s hope you are indeed screaming at us on the 1st March 🙂 $$$
😀
Great report Alex…March Fed meeting will be key also…..gold holding up well but miners not as much…..
Yes, I just don’t know what will top then &what will bottom, if it ends up thst way.
Menso-re/Konnichiwa from Okinawa! Headed to bed before the market opens as it’s late here on Tues already! Looks like I’ll probably stop out of TQQQ at the open – kept it tight in case we have a larger A-B-C inside of the ABC retrace we already had.
Fully invested in miners. Early in the DC, need gold to get out of the crapper here. I do at least see BTG up pre- market interestingly enough. Let’s go!!
I used investing.com because of the issues stockcharts has had recently. I show both the USD and gold tagging the 10 sma this morning. Alex, should we bail on miners if we get more downside today and this dip doesn’t recover? Or is there another level on gold that would trigger a sell signal? Or just stick to the plan of holding as long as GDX/J holds the 10 sma?
You have probably noticed that I use different charts in the report, and that is one of them.
I will answer your question above, since others may be wondering
Thanks Alex, I have the same question…
Hey Evan,
I don’t know if that long post was clear, but basically I know that everyone chooses when they feel it is safe to enter. The lows are in place until they are broken, but stops should be set based on ones entry point and what they consider a loss that is too big to handle.
So far, GDX, GDXJ are bouncing around the 10sma, may even break it and recover. Most Miners seem to be down 1% maybe 2% and a couple are more than that.
Some traders may place a stop a little below the GDX GDXJ 10sma, I just think it depends on where they entered their trade. If this drops to the lows, they lock in what they have and can watch things play out.
Right now things remain choppy & a bit volatile.
If this takes off upside later this week or next week, there will be a buy point higher, but it should still be a good gainer, especially if we start an up trend and break out from the trading range. For now I am hoping that we at least get to the trading range highs in this Intermediate cycle
sold 1/2 my JNUG pre market…don’t like the look of that gap down if we open here and I am still long a ton
DWP looking good
NVAX too….maybe a buyout coming? It sure looks like hedge funds are piling in!
yes… DPW nice
DPW , MARA, GROW – all have signs of recovering, but the sector is a very tricky one for sure
Bullish engulfing on 30-min Gold pre-market. Maybe that weekend slam then higher Alex suggested as possible? The lows for today coincide exactly with the 0910 COMEX pit trade open for metals.
Back up I see. I already sold 2/3 rds of my JNUG, but will add back if this works out.
looks like trying to close gap at open but I will stay defensive unless I see it above $33
I am looking to add to miners as long as GDX stays above that recent $20.80 or so false breakdown level. Can´t lsay if I will add today or not, but for me nothing has changed with miners, in fact it´s getting better because I can replace some of those I jettisoned a couple weeks ago, at better prices than last week.
Wow, silver really holding up well.
So I am seeing GDX at the same price as the lows were for GDX Friday. Gold is bouncing SO FAR. I am being asked about JNUG ,
“Should I sell?”
“Where is your stop?”
etc
JNUG can rise and fall 50 cents in a heart beat, and 2 or 3 days in a row of 80 cents orr more can blow your confidence
I need to stress this again, as I have before…. Your trade ( ESPECIALLY THOSE TRADING JNUG- WHICH REALLY IS ONLY FOR EXPERIENCED TRADERS THAT UNDERSTAND HOW THEY MOVE, LOSSES MOUNT UP QUICKLY) and your stop is based on your entry, what you consider a loss limit, and you can always get back in the trade if it reverses and runs higher. Why do I say this?
REMEMBER THAT MY FIRST TRADE FAILED: I bought JNUG at $13 & posted it here a week or so ago for a day or 2. It bounced to maybe $14? Then dropped below my buy point and kept selling off. I said that my JNUG trade was based on a small base that formed at $12.90, my stop was $12.75ish. I was stopped out. I felt the LOWS were very close anyway, but didnt want to ride it down to an unknown area.
REFRESH : SECOND TRADE: I saw a reversal at $11 area, saw a double bottom with divergence & entered. Added on the rise in the $12’s. MY STOP would be that area or 11’s, but some wanted to wait and see if it looked good, and that was best for them. IF THEY BOUGHT on day 4 however, they may have entered JNUG at $15 or $16. They need to know when entering that trade, ‘ where will I consider it a point that losses are enough & I can always get back in?’
If JNUG goes from here to $30, $11 to $30 is awesome, but even entering at $18 – $30 will still be great. However, if it goes from here to $8 & someone holds from $16? Not so great, and a 3x can amplify gains and losses like that. Trading 3X ETFs is not for everyone.
The final point, THE LOWS of a daily cycle are ‘the lows’ until the low is broken. I tried to point that out last week when I pointed out the 2008 Oct -Dec lows. I dont have that chart on this computer, I can post it again later, but the 2008 lows went almost all the way back to the lows, and then ran higher. It can and has happened.
So I hope that helps. if ANYONE is buying a 3x etf, know when you make that entry, ‘ My stop is $ XXXX.’ I always say KNOW & HONER YOUR STOPS, but many still may not know them & thus cannot honor them. You can always get back in if things hold up, you cannot get the money back if it cuts you in 1/2 and you sell low
I DO NOT TREAT JNUG as BUY & HOLD unless I Caught the lows, because a trip back to the lows is big & THEN if it breaks your losses are too big. JNUG is for the experienced trader with discipline
https://uploads.disquscdn.com/images/831fa55478e1a7a1e0629eda29640f3c4c82544d5715bb360a05d62e2a16a3e3.png
agree with all ….. traders take note!
refresh – GOLD POP, DOLLAR DROP?
https://uploads.disquscdn.com/images/cf38147338ca95f7a5440a594da8335f7536eaf68ac976e4f3db2a5b876cc22c.png
Gold dropping to 1335 area here, is the 10sma on the daily chart. So so far, we have gold dropping to the 10sma and reversing (So far)
About $22 on GDX is a 50% pullback from the recent run (low to high) that started at that $20.83 level and false breakdown.
One more thing about this JNUG chart.
If I posted this
chart of JNUG here- HID THE NAME – and said , ” Is this Bullish?”
Most would say “Yes, it looks like a V-Bottom or inverse H&S and is dropping to that support area on the left” ,
but because it is moving 3x as fast as normal
trading speed, the drops look & especially feel Really bad.
https://uploads.disquscdn.com/images/831fa55478e1a7a1e0629eda29640f3c4c82544d5715bb360a05d62e2a16a3e3.png
folks shld recognize you are on a 15 min chart—not daily—-timeframe is essential to be in control of risk, imo
I know exactly what I posted…
I am saying that this chart has a bullish look, and I said ( If it wasnt JNUG – under a different ticker, people would say it looks bullish) most would agree, and yet-
Most are bearish right now
ouch lol just trying to be helpful. back to my cave
Not sure what ‘ouch’ indicates, but dont misunderstand my tone.
I am not at my computer and I am just quickly trying to reply and also juggling a few other things while away from my desk.
My tone was normal, but txts & emails can always be misread- especially when written quickly
all good thx
I posted these 2 charts last week for you to watch
Chart #1. This was HUI in 2008 at the lows ( TWICE). Those lows were never broken, but it was very close, this is why I say that THE LOWS are ‘the lows’ unless broken. I have heard others say “If the 10sma is broken, the daily cycle is in decline”. Not true, it can simply serve as a warning that the dip is lower than hoped for.
Chart #2. This was last week, HUI 50% drop would be at $180, the 10sma was $182. We are still there now ( So far)
https://uploads.disquscdn.com/images/7f516258a37acf4aee08db4368059c11c5faf37cbab6bed2f893f0e4b493e733.jpg
https://uploads.disquscdn.com/images/edda5b28d51d8402aa7c620b5d499c221fa58e3c8be15205e321f42374fe073e.jpg
Dow down over -100, NAZ up +28
WMT is down 10% , pressuring Dow
Refresh – EDXC finally making what looks to be a solid break out. Feels like I have owned this one forever now
https://uploads.disquscdn.com/images/f5dd23c24555d7c49f673407b4f50a7d44054b00b07e702b2e8604d63a816744.jpg
The real beauty of that chart
https://uploads.disquscdn.com/images/f97a0a04c6e90069815feea4dd60124e09718903327ff9dc2100eb76f606f8b4.jpg
Yeah ..me too. Do you have a target in mind?
Longer term I just think it could really gain traction and start trending once it leaves that base. (Chart below) .
They do have good reports on sales growth & it is for animal treatment so I dont see ‘legalization’ as any hindering to its progress.
Short term it may pause at 10 cents and back test this break out , but that back test is not a certainty
REFRESH: If you are watching GDXJ and wonder how far it could drop ( It can drop wherever it wants) , but this is what I would expect to hold as a support area. It is roughly the $31.50 to $32 area.
You could use this area as a guide. Did you buy low in the jnug $12 area? Maybe you would sell 1/2 and watch this area for a reversal higher or break down? Maybe your stop is in this area? SO far, the Miners do not look all that bad – GDXJ may be testing this mornings lows .
My list of miners has many only down 1% – 2% or 3 , even 4%, but the majority do not look like a sell off type day at this point. GG, ABX, CDE, SA, AG, TAHO, NG, MUX, PAAS, EXK, AUY, GFI & More down under 2 % as I write.
If a sharp sell off starts, that could be a problem, but the above Miners down under 2% is ok.
GG, EXK, NEM, CDE, et still above the 10sma. I would love to see this weakness shake out weaker hands & reverse higher. Those that are shaken out will re-enter higher and push price higher then too. For now we wait & see.
https://uploads.disquscdn.com/images/12e086d054bf3256d23be40b4725be0def38f3f0cb5a0c4dde86d51aaf99d025.jpg
And just as I post this, GDXJ breaks into the support area.
I swear I have smart money in here just trying to be disruptive – lol
GLD on the 10sma, MIners GDX / GDXJ breaking below thier 10sma.
I do hate it when Miners arent leading the way higher 🙁
I think the miners are holding up ok, considering how badly gold is getting hammered. I´m not buying much today, but if we close at lows today and open lower tomorrow, I will be happy to buy some big positions with stops below the recent low corresponding to to GDX $20.83
CY is the one saving my ass.. whoda thought
And MU should be next
I sold most of my MU on Friday, im holding what equates to a starter size now.. Sorta sad I sold lol. still have a 42.5 avg tho… but so small its gas money for the jeeps
I think that BITCOIN just broke the downtrend
refresh
https://uploads.disquscdn.com/images/e356e431ed3f167fd7a1d6ab2169b370c9735291d60ca956fd73075316fbcd51.jpg
Abd GROW, DPW, and a few others have MACD cross. Interesting.
For those in crypto, my favorite is Vechain. Check out the chart of VEN/BTC:
https://www.tradingview.com/x/4YCYISUU/
And their partnerships/fundamentals are extremely good. This will be a top crypto in due time.
For those watching the pot patch, EDXC breaking out.
Not atallwhat I was expecting today
TWMJF looks pretty good with that reversal, and OGRMF, SPRWF, and CBWTF also seem to be trying to break above their 10sma, and gain some buying interest
Yup, I was going to mention the pot stks seem to have found a bid. Fingers & toes crossed lol!
Keeping things in perspective –
I’m not being a smart-alec here, but it is all about a learning process,
If todays drop is extremely painful, and you are in JNUG or NUGT – you might want to lighten up and learn from that, that
3x ETFs are NOT Just easy money. They do down as fast as they go up, and being too heavy for ones personal comfort can be mentally challenging.
So far GDX & GDXJ have done a 50% retrace, and these are normal.
https://uploads.disquscdn.com/images/af94d18bd5d50761ef8f8c64dc7d5d3efceef298889e0ad91bc618a14b0afcb6.jpg
My disqus in not working correctly – I refresh and a few comments pop up that were not shwoing up.
Odd
FWIW – They are probably not “IN THE CLEAR” yet, So I decided to buy SPRWF – I like TWMJF and OGRMF, SPRWF, and CBWTF also seem to be trying to come off of recent lows, dropped to a higher low, and moving above 10sma ( SPRWF has not moved above the 10sma yet, but I like the MACD on these and will take a chance).
GOLD at $1330 , just below the 10sma& line it was 1333 when I drew that
refresh
https://uploads.disquscdn.com/images/18f5e72d9218ce303757aa779a9361fb7055bd95cff49e6a9136f79be9dd2614.jpg
Great job keeping people posted on your observations today, I imagine there would be a lot of hand-holding today. For whatever reason, I´m not freaked out at all today. Probably because my position sizing is correct for my risk tolerance, whereas I was almost fully invested in the last pullback.
Yeah, and I hate pull backs as much as anyone else. I just want to be positioned and ride it higher, but so far the selling is 50% drop, and that does happen .
I just hope that things pick up from here into the close to give breathing room to the trades
It’s only 1/2 day of trading and I feel like it has been 2 days
Hang in there CF…. I think you provide a great service…… dollar will bounce around and will paek in may/june…..then should be in for a quite a fall. I see Miners/Gold ICL in May/june and this one should provide a much greater punch than 2016….. just my two cents though…….
Being in miners can make the days very long when they don’t do what they are “supposed” too
So true
giggle ….
Get back to the Pool please
i AM at the pool …silly…;)
DayYumm ….. DQ
whoa…LGCY …
Yeah, whats up ith those energy? Those are nice ( LGCY & DQ)
b ??
https://www.youtube.com/watch?v=mVkp5PnICwY
LOL LOL LOL
CF. In regards to Oil. I noticed that if I look at WTI Crude chart the high today and yesterday touched the underneath of the rising trendline from the August lows through the December lows. However if I look at USO, price has broken above the rising trendline from the August / December lows. The first chart is a prime spot to start a short position but the USO chart is a great place to start a long position lol. I know to trade off of the underlining asset and not the Index but USO tracks Oil very well. Any thoughts ? thanks
The funny thing is, I was just looking at USO, and I was thinking that it has higher volume on the move up than I expected too ( for 1/2 day today). I would have expected it to be light, lighter, even lighter as it climbs, so while I was thinking of shorting Oil, it might need time.
Oils daily cycles can be 30 – 40 days long, so it could climb & bounce around for 2 weeks , even 3 weeks ( 15 trading days) and still roll over. SO I am going to watch for more signs.
As you are pointing out, it is a small bit of mixed signals right now
Exactly, while looking at the WTI chart I was like it might be time to possibly start a short position so I am going to do it via USO puts. That’s what got me to look at USO’s chart and then I just got confused lol. Thanks again, I’ll keep an eye on it as well.
And even if it did start breaking down this early & you missed the start of it, there would be plenty of downside to catch, the daily cycles are pretty long. I just want to wait until I see signs of the turn so I am not sitting in a dead trade for a while .
Agreed. I guess there is no reason that Oil can’t test or make a marginally new high here and then roll over and still be LT. and move into its ICL. Maybe that makes more sense. One more daily cycle here that is LT and then the ICL. That probably is the best scenario for a really nice short position.
I thought the same, because the last one was R.T.
Now a break to slightly new highs after a R.T. could draw in Bulls for a final roll over & drop.
It may or may not happen, but I dont want to be short now if that happens, simply because it could take 2 weeks of trading to full fill.
I’ll just look for some more signs 🙂
I agree, I’ve been watching oil to turn but the obvious back test just seems to obvious. I think they either run it up a bit as you stated or possibly even a false break then run it up to squeeze the shorts and then roll it over. Don’t think they’re gonna make it that easy.
Does the FOMC release the minutes from last months meeting tomorrow?
You could google it, I’m not sure
Yes.2pm.
Thank you Murphydoc. Hard to get a straight answer even from Google search. That’s another great feature we all get from this thread. Reliability and accuracy. 🙂
Yes, I find that you need to be specific in your search. Fed Minute release will give you a calendar, etc
“Jan 2018 fed minutes release time”- should take you right there.
I was just busy charting & watching other things , and didn’t know off hand.
Glad you mentioned it anyway
CALL ME CRAZY, ND YET I AM NOT TRYING TO BE A BIASED BULL, but I am looking for how GDX or GDXJ can turn up today after dropping to the area of the 50% retrace & 10sma.
Refresh
It can drop further, but I’m looking for a break higher by the end of the day. https://uploads.disquscdn.com/images/5659a2598625ef57438c27f2d7177e07391b0ef3b55519e30536e0c9715f1320.jpg
It’s kind of tough to tell on stockcharts, but I also see today as a tag of the daily uptrend line. Do you see the same? In gold that is.
I do not, but I dont know what your low points are.
I wa actually thinking that this pull back would set the lower trend line from the lows last week.
I think it just broke the downside & reversed back up.
This is like watching paint dry
ZN ….
NSPRF just took off.
I was JUST going to say, “Let’s find a green Miners”.
I like that chart, I really would love to see it above the 50sma, but this isnt selling down anymore with gold.
looks like lows could be in ( He said cautiously)
Possible inverse H&S on 3 month chart
DO NOT FOLLOW ME- I added a bit more to JNUG @ $13.45 , based on charts below of GDXJ wedge and so on.
That said, My stop for these is todays lows, may or may not be a short trade, and that stop may get taken out.
I do like what I see at this point for a POSSIBLE rally into the cllose
Is that a stop level on your whole JNUG position, or just the new addition? I added a bit to USLV here as well, and even MUX is holding up nicely considering the day.
*follows CF blindly lol – jk…
THAT didnt workj 🙂
https://uploads.disquscdn.com/images/5515f9cf4ca0e26db16744af60b18d46f6918308da6f974a07f8f1fa2585d632.jpg
GDX & GDXJ heading for the 61.8% retrace, broke the 50sma
stopped out of JNUG @ 13.30.. oh well and wave 2 can retrace 99% of wave 1
This is starting to remind me of GDX & GDXJ May 2017.
Pretty low volume today in miners, wonder if that means we have lots more to see on downside capitulation, or it´s not confirming the move lower? I will stick with everything, hope to see some more downside in the morning to add.
Yeah, I was just looking at several miners and the volume is 1/2 what it was on the way up ( Same with GDX & GDXJ
But I also know that they add 10 million at the end of the day and distort that view.
I got stopped out of my new purchase of JNUG and 1/2 of what I bought in the $12 areas. Gave a lot back again.
Still in AUMN, HMY, THM, and SVBL
Refresh- This selling just doesn’t look as bad as GDX & GDXJ make it look
https://uploads.disquscdn.com/images/c2b9d6eaff1ff2227fdff1f2650680d7c1a5c6810f900b0ee30712d17cd7a49d.jpg
well if they decide to continue lower like some are predicting down to the Jan 2016 lows, we will certainly have a trade setup that only comes along a few times each century, and cheap prices to load up. ON the HUI that is about 9% lower, on the GDX I think it´s closer to 14% but haven´t confirmed.
the JAN 2016 lows are much lower than that
Ralph, be careful what you wish for.
Yes, and buy on a reversal only, in case these lower prices lead to….even lower prices
It’s odd, TRX, MUX, GORO, Refresh, look normal, just lightly pulling back to 50sma.
GDX & GDXJ look like they are selling down a bit ore to that 61.8% retrace.
UUP looks lightly bullish, though it pulled all the way back to its lows twice.
https://uploads.disquscdn.com/images/b62d43a10a5da77f24e767b1fca9aea658c6b7a0bfe9c079be3cbfca43108898.jpg
is APHB trying to start another bio-giraffe?
Buy volume came in on GDX & GDXJ 5-min charts at end of day.
Nibbled some 200 shares of JNUG @ 13.22. Still holding everything else, pretty red.
That EDXC volume came in nicely for a break out
I’ve been holding APHB for a while, it popped a little (9%) today.
Well, THAT didn’t go well. Thought we’d retrace SOME after the big Wed pop last week but not 100%. Thought a dip from there was another entry point, and it wasn’t. So lesson is that I should have sold 100% on that pop and waited for the coming slaughter to add again. Inadvertently now left as heavier than really intended.
But I still have hope! And CF to guide us. But definitely not what we anticipated. I have my answer on if we sell when we get back to the recent highs vs hold for breakout. Do you?
I did stop out of TQQQ (trailing) by about 6 pennies. Gracefully exited SVXY (just after open) for now to see what shapes up in the market. Made the easy money alrrady, better to book profits here since I didn’t do that with JNUG.
I think Gold has more downside from here,, next drop of $10-$12 Im guessing ,1318 maybe. I thought it may bounce to back test 1336 but right now it seems the dollar is headed to 90. Ill look to grab JNUG then for a bounce under $13,, maybe $12.25-$12.50, with really tight stops, depending on how gold is acting, it may want to test the 1305 lows if dollar breaks above 90. After that , have to reevaluate then.
Bought CBWTF, SPLIF and DJACF, SCO today,, missed my entry in SGMD,, maybe tomorrow.. Tight stops on all.
Yeah, but that doesn’t jive with cycle theory. If we retrace 100% on both of the first 2 daily cycles then I’ll have no recourse but to sit on the sidelines until the next buy point this summer.
I dont know enough about cycle theory to respond to that but I know the dollar broke the 10d ma and is back at daily declining trendline. It may turn back down here but chart price action doesn’t seem like it wants to.
We may very well just have to wait. Last summer we only had nine weeks up and we’re at week eleven now.
The Wednesday report was released, don’t let the Theme Pic scare you 🙂