I imagined that the Friday report would consist of me saying something like,
” Not much changed today, so for the last day of the week I have a few stock picks to present.” Instead, we got rocked with a sudden blast of turbulence in our midday flight to our next destination. Have you have ever been on a flight that suddenly experiences a rough patch? It can be alarming, but in almost all cases, the final destination is still reached despite that choppiness.
That is how I view what we experienced on Thursday, so let me just share this view by running over a few reminders.
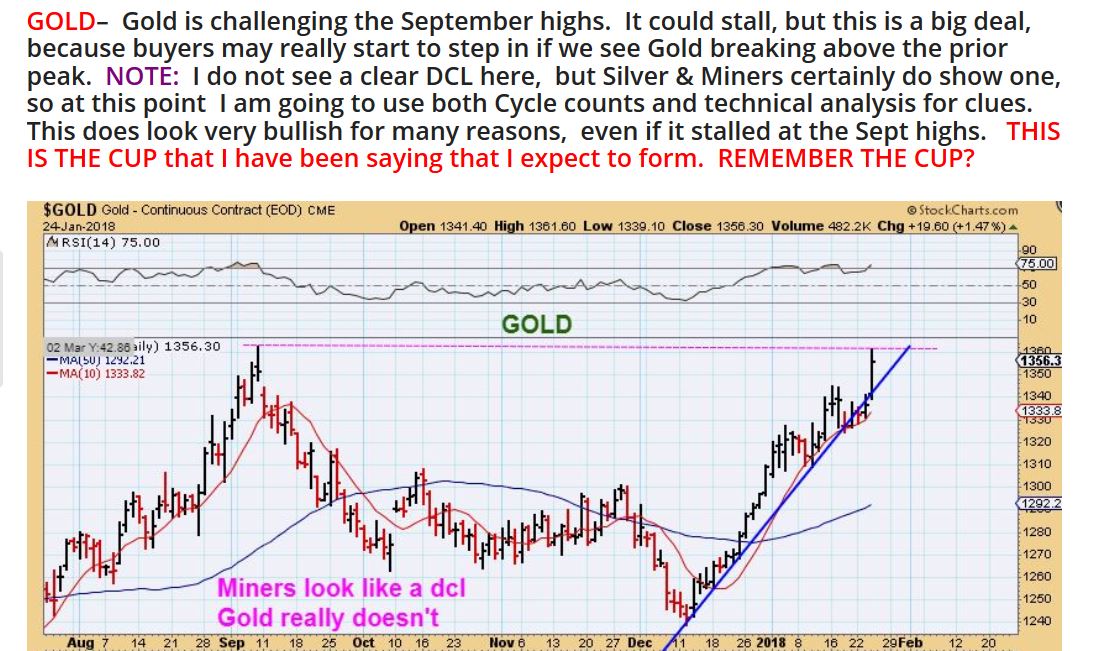
AS A REVIEW: The USD has been dropping, and Precious metals have been running higher since Mid Dec. We had a pretty clear dip in Silver and the Miners recently that looked like a DCL. Gold had smaller dips along the way, but I did mention that it just didnt have a CLEAR DCL. I accepted that maybe it had a milder dcl, since the Silver & Miners look to have. As for Gold- it was on a mission and kept moving higher towards the September highs, forming a cup that I did expect it to form.
As these CUPS form, they often pause at the top, possibly forming a ‘Cup & Handle’. That is where we are today with gold, let’s review some charts.
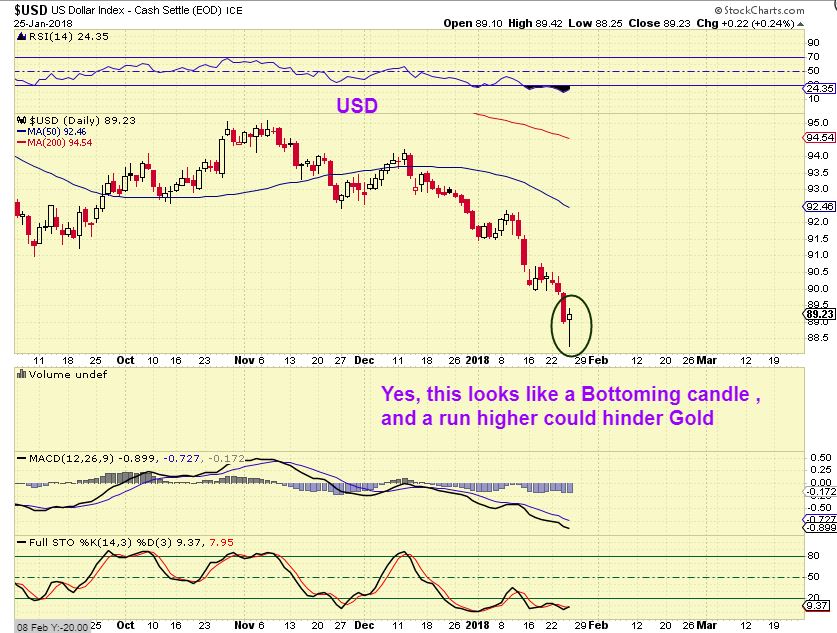
USD #1 – The USD does look like it put in a strong reversal candle. Is this a DCL? It could be…
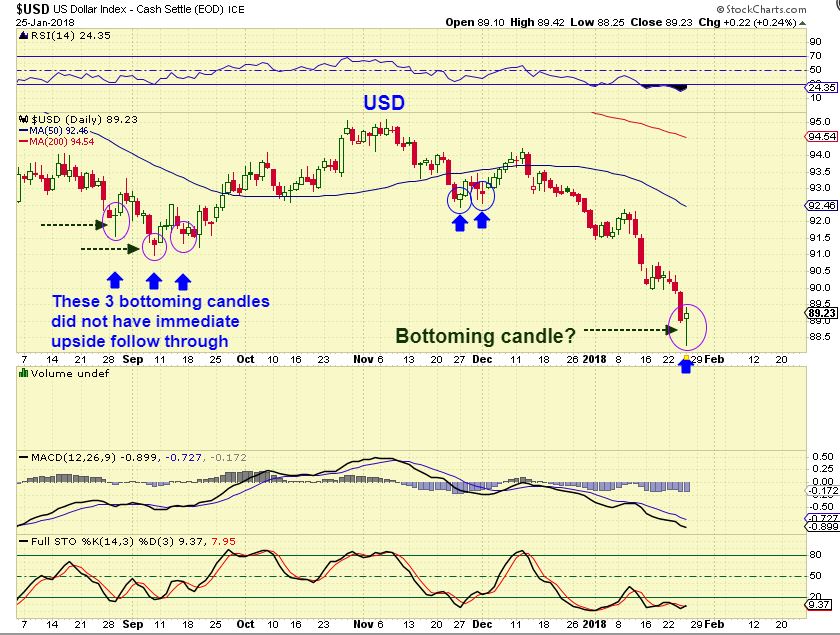
USD #2 – Look back at the September ICL. We saw the USD put in a solid reversal candle on August 29, but then it continue a ‘bottoming process’, even dropping a bit lower into Sept 11. We saw a reversal candle in November too, but it didn’t just take off then either, so this may not just become the USD blasting off higher. We’ll see.
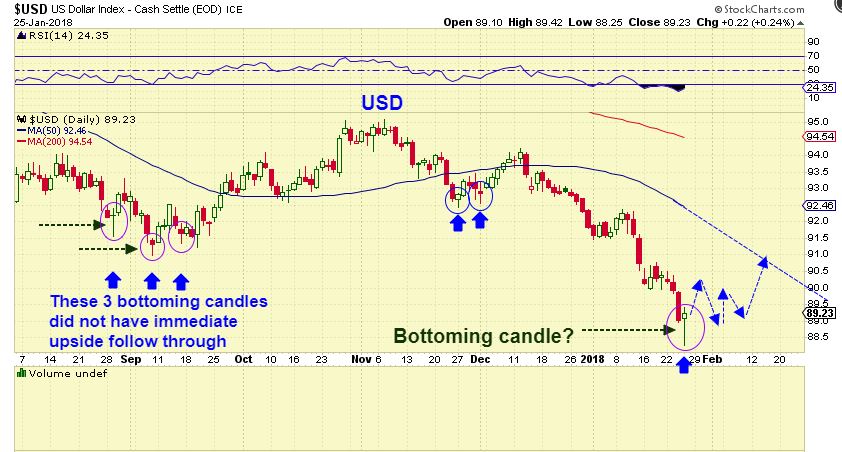
USD #3 – Now look at the dcl in November / December, it was followed by a somewhat weak rally just above the 50sma. The peak of that weak rally is when Gold bottomed in December. If this is a dcl in the USD and a bounce follows, Gold could put in a handle & even drop to a clearer dcl, but I would expect this bounce in the USD to be even weaker than the last one (unless this was an ICL). I will discuss a USD ‘ICL’ possibility later.
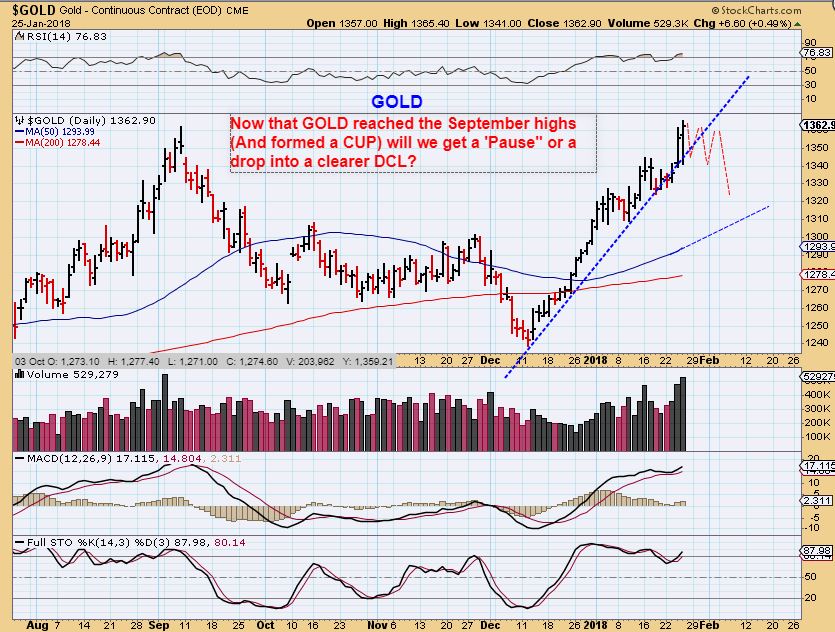
GOLD – I wrote this in the report yesterday ( this is a copy / past). It highlights that : 1. Gold is at the highs of September. 2. It finished the CUP as I expected. 3. They often pause or pull back at former highs as a cup & handle. 4. The DCL was not clear, but Silver & Miners really look to have a dcl in place. 5. Even if it stalls at these highs, it remains bullish. You can read all of that that I wrote in yesterdays report below , and we will discuss further.
GOLD – GOLD dropped after 2 p.m. eastern rather sharply. Miners filled their gaps, but this may not be a 1 day sell off, based on what we see with the USD. These cups are known to grow a handle, right? A ‘Cup & Handle’ is possible…
AUY AS GOLD – Often when the ‘Cup’ is finished forming, you get a ‘pause ‘ or ‘pull back. Even a ‘Handle’ is very common, that is why we call it a ‘Cup & Handle’. I posted this Jan 16th chart of AUY as an example in prior reports of what Gold or Miners may do.
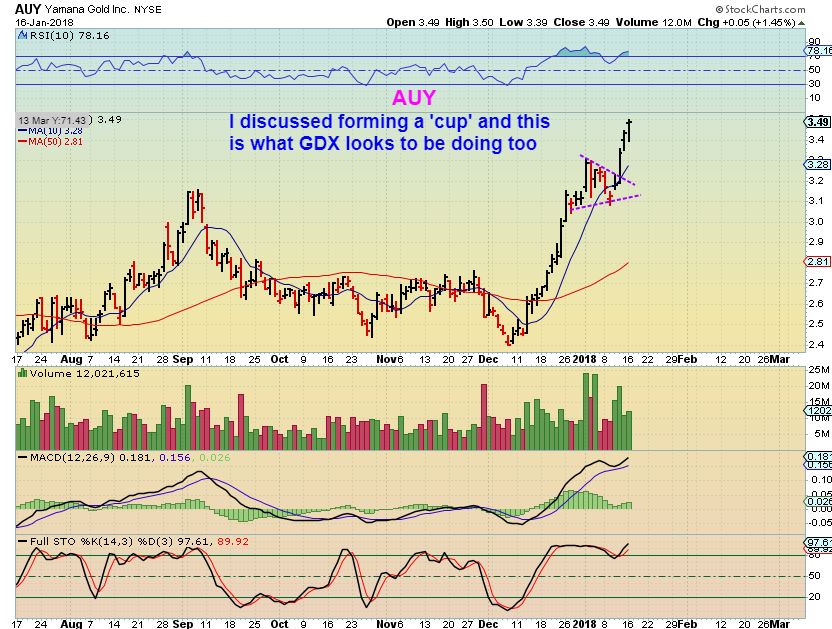
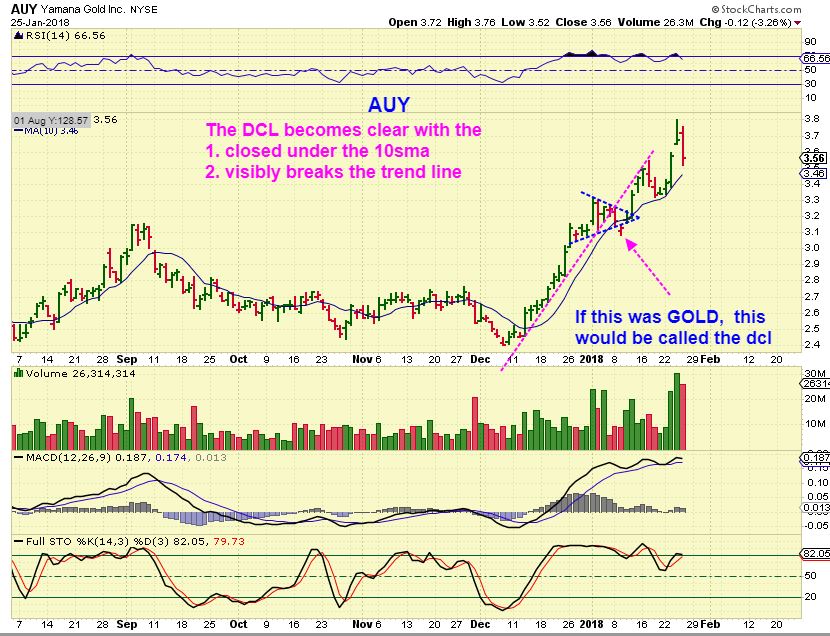
AUY AS GOLD – I am simply using this up to date chart to show how AUY acted the way we want Gold to act. It acted bullishly after the cup finished. You can clearly see the Trend line break & 10sma violated & recovered in the cups handle. MAYBE we get this in Gold now, if the USD simply puts in a weak dcl bounce?
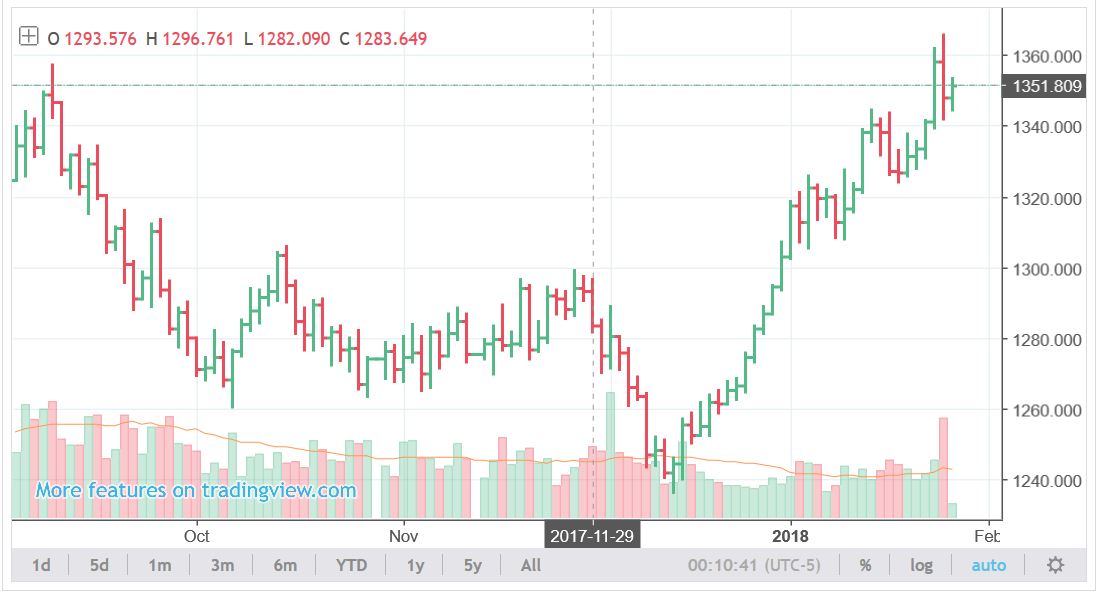
GOLD 11 P.M.- As I write at 11 p.m. eastern Thursday Night, this is Gold. Does it look ‘Broken’? No, but it did experience some turbulence at the top of the cup, and if a handle is to form, it will not be a 1 day dip. If this just takes off higher, it is fighting against the resistance & selling.
GDX – Later in the afternoon, the markets sold off sharply and the gaps filled completely. Is that it? Well, it doesn’t have to be. See the chart for possible handle formation. It may depend on the USD & GOLD at this point, but Miners also do NOT have to sell off very much, they can just experience more choppiness.
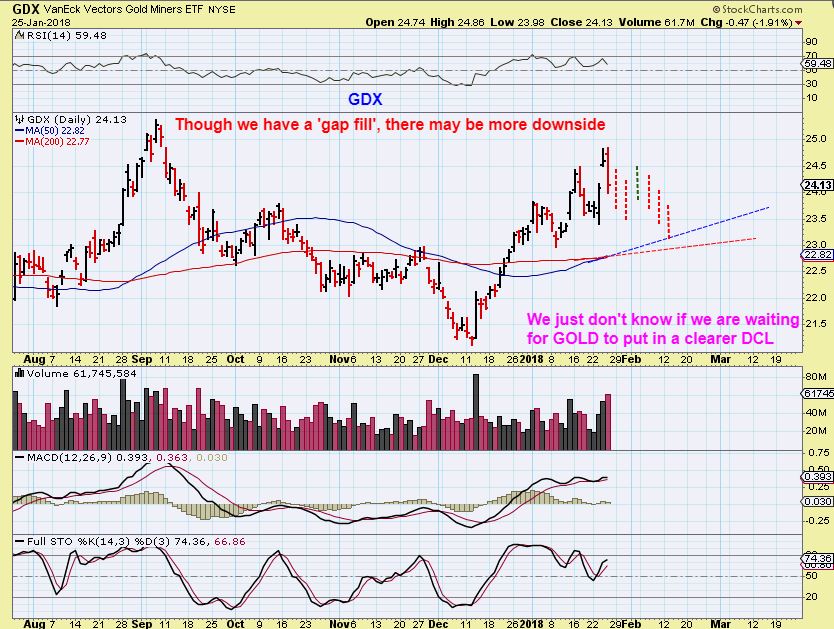
Was possible ‘choppiness’ expected, or is this a complete surprise? It is a disappointment, but it was a possibility…
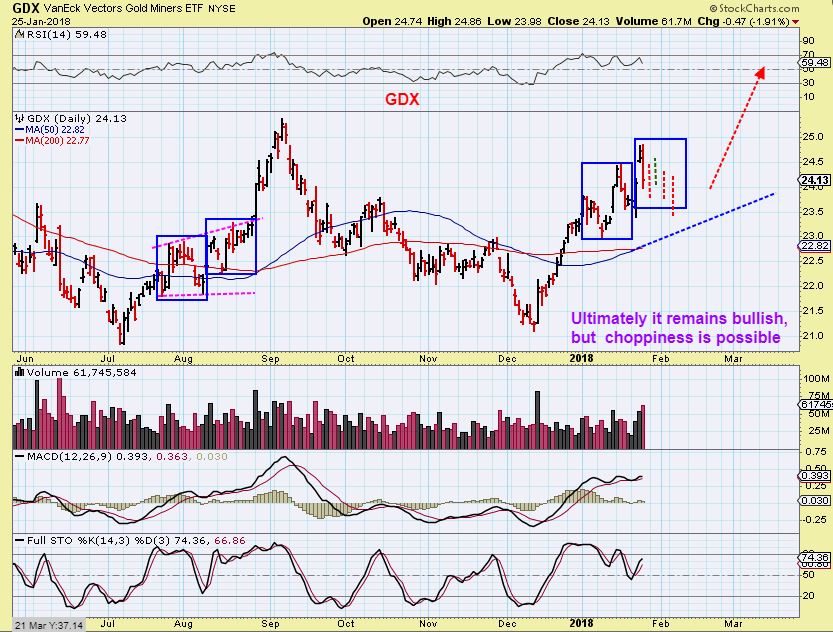
GDX – Interestingly, even though the dcl was in place in the July to August first daily cycle – the move higher from there started out very choppy, and I have been referring to this. Notice that despite that choppiness, those Aug lows were not taken out. Maybe Miners will just remain choppy until GOLD puts in a clearer DCL – or maybe they both just get a little sideways choppy before moving higher?
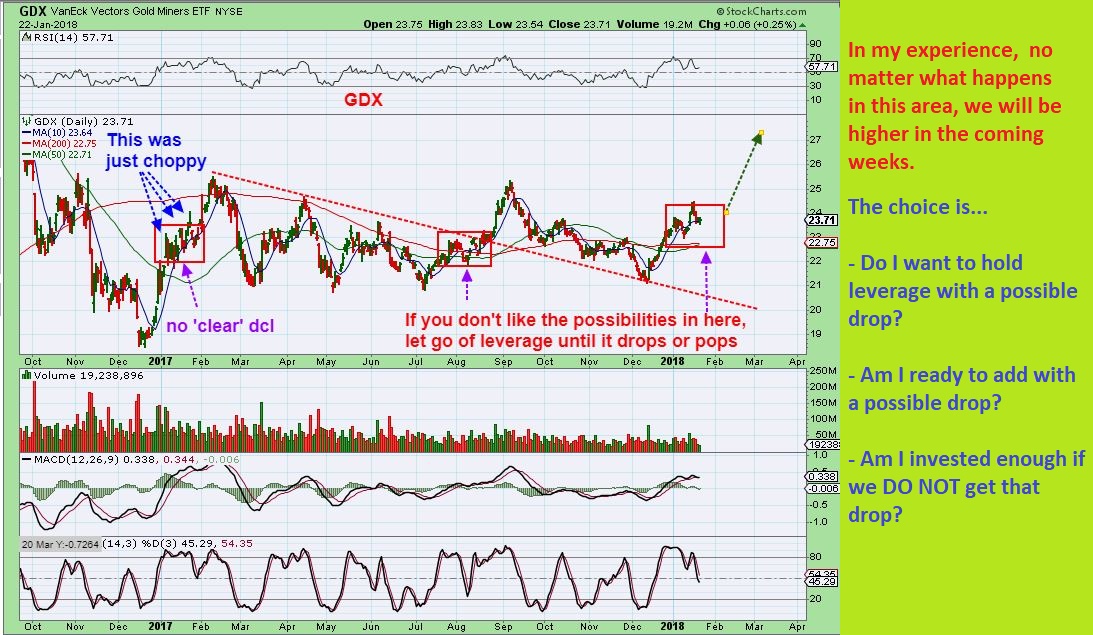
Honestly – For weeks I have repeatedly been pointing out this type of choppiness in the middle of several of these runs in charts like the one below. This is the important part that I always mention: I mention that it always seems to look easy riding a BULL MARKET in hindsight, but RIDING IT REAL TIME is a whole different feeling than seeing it on a chart. Emotions get involved. Notice the choppiness in this chart below that I posted earlier this week. I warned about leverage during choppy times, but I still own it.
How many times have we said that we just wish we could get a nice long EASY bull run higher like the 2016 run out of the JAN lows? Have you ever said that?
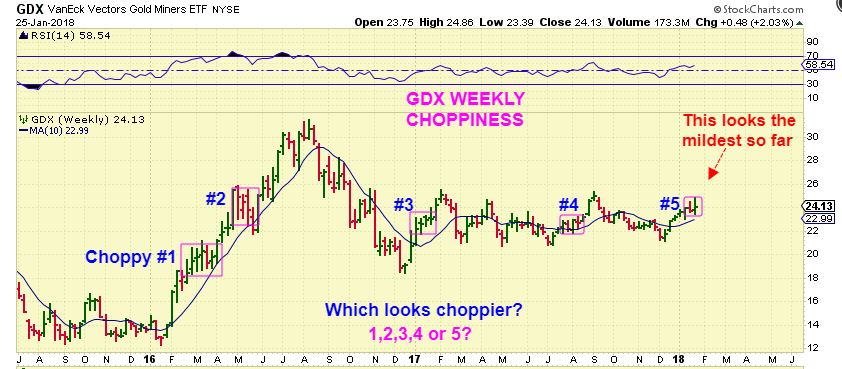
GDX – That said, welcome to the Bull Market. The Bull kicks and bucks and does not make it ’emotionally’ easy to ride. Which marked area of choppiness looks worse? #1? #2? #3? #4? or #5? Probably #1 or #2 found within the 2016 run higher, right? It runs higher – gets choppy – then runs again.
Back to the Big Picture USD to address a question that came up-
Maybe others are having the same question?
In the following chart on Jan 12th, I pointed out that the September ICL had been broken, and that is a FAIL. I said that I now expect the dollar to drop much more over time. I also have said in many of my past reports, “If the USD could climb as sharply as it did in 2014, then it can fall just as sharply.” 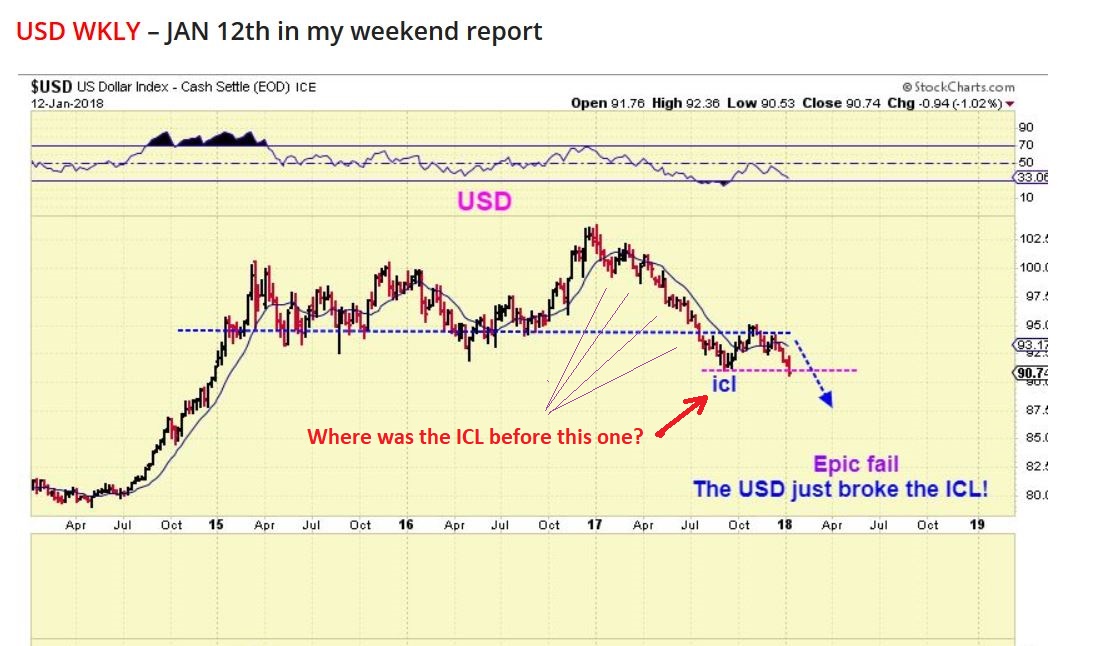
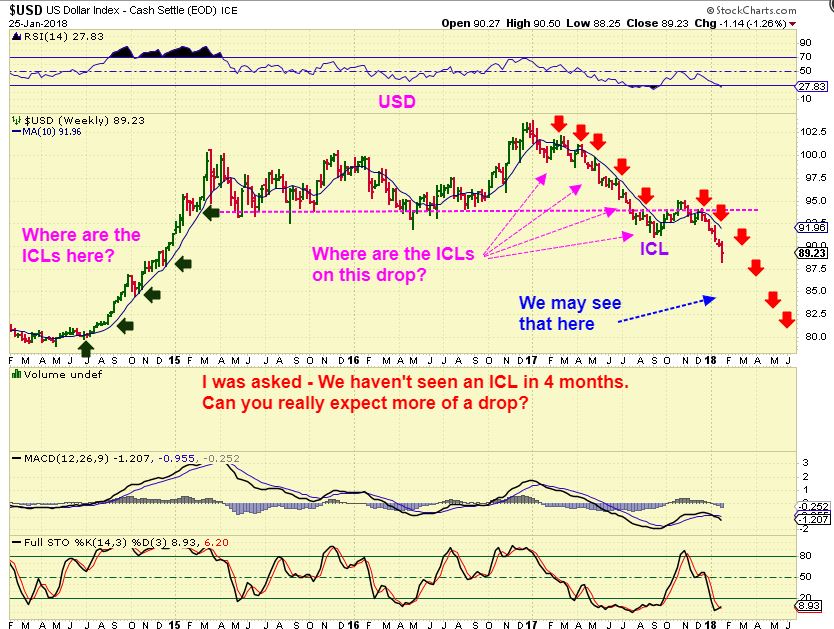
Someone basically asked , ‘How can the USD drop when we haven’t had an ICL since Sept and one is due’. My answer is almost always, ” Let’s look at the charts.”
USD ICLs – Do you see clear ICLs & solid rallies higher every 4 months? Look at that big drop that we just saw from January 2017 to that September 2017 ICL, because that is 9 months. I see no big bounces over the 10ma that lasted during that 9 month period. Yes, the USD will bounce, but I’m not looking for strong rallies in the big picture, and I don’t see Strong rallies in that drop from Jan to Sept 2017. That tells me that that can repeat ( Red Arrows). Please examine this chart.
CONCLUSION: We had some turbulence on Thursday, and that can play out further. My Big Picture views can always be found in the last weekend report ( or the 1 before that). Until anything changes in a major way with the big picture, the set up remains bullish, but the wiggles, choppiness, and the day to day turbulence will not make this as easy of a ride as it may look in hindsight.
FASTEN YOUR SEATBELTS , YOU ARE HERE- Again, take a look at that 2016 run, and this choppiness is not as bad. I have a feeling that someday this is going to look like an easy ride too. 🙂
And again- If The USD BOTTOMS like this as a DCL is put in place similar to December…
Then GOLD could put in a handle something like this. ( Please- I have said this before, This is NOT an exact path. A couple of my readers will say, “You said it was going to put on a handle and it would drop, then go higher, then drop, then go higher, why did we drop 3 days in a row?” No, I have mentioned that I do not draw these knowing the exact path day after day – these are visual aides or guides to get you through the choppy times. It prepares your mind for possibilities, but NO ONE KNOWS AN EXACT PATH DAY BY DAY.
So fasten your seat belts, we may continue to have some choppiness ahead, but at this point in our flight, the destination remains the same. Enjoy your Friday trading.
~ALEX
A LESSON ABOUT GAPS
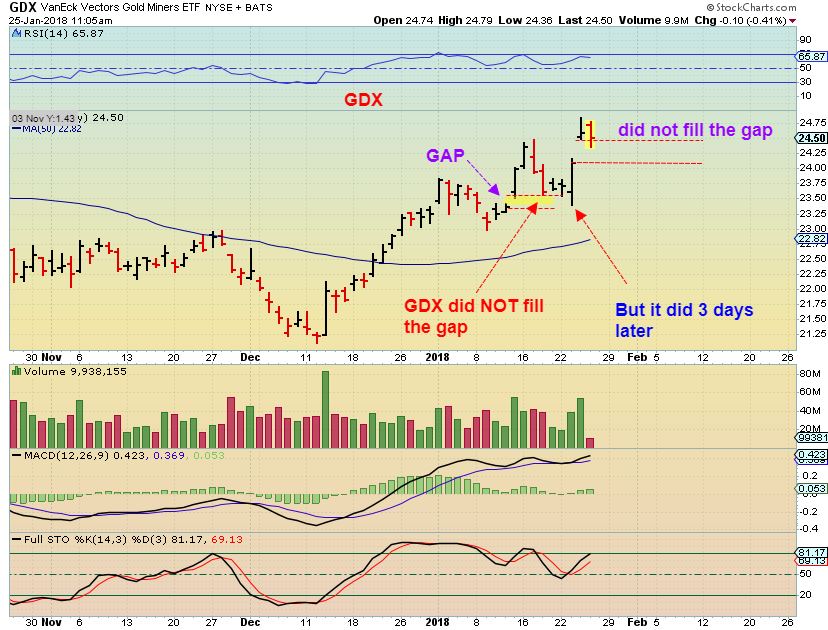
GDX – I actually drew this up at 11 a.m. as a “Lesson” about Gaps. The reason was that I was being asked about Gap Fills. “Do they have to fill?” “What if it is just a partial fill?” , etc. So I drew this to point out that they don’t always fill the very next day, but they still can fill later. Our GDX gap did not fill at this time, and began moving higher, so I wanted to let readers know that just because it didn’t fill Thursday morning, that does not mean that it won’t fill later.
So in this chart of our current run, GDX & GDXJ were reversing higher even before GDX closed the gap Thursday. I wanted to point out the gap from JAN 15 and how it did NOT fill over the next 6 days, but it did fill later. Then our current gap filled by the end of the day, so this is just a lesson for another day. 🙂
Thursday Jan 25 
 January 28th – The Weekend Report
Scroll to top

Riding a bull ain´t easy, but you make it easier, CF. I´m fine, not going to try and sidestep a pullback. I think it might look real scary for a day or two more like yesterday did, but in hindsight it will just be ¨going mostly sideways¨ action as the commodities bull builds more steam. I´m in in for the longer haul (few years) anyway, so will use the possible pullback to add more shares.
It is very difficult to ride a Bull, especially coming out of lows and then consolidating. The SPX bull run now is easy, because pull backs are rare, but it wasn’t always that way, that’s for sure. And I remember pointing out some of the massive drops on AAPL or NFLX – but most people look back on a 10 year chart and think that it was an easy bull run to ride. And many think that the 2016 run was easy too, but it was choppy too..
I find that when I am looking at the chart, like in the report today, it is not alarming, but when looking at account balances, emotions come into play. No one likes making money & giving it back, even if they know that the trend is still higher.
A strong drop can cause fear & doubt, so todays report is to try to restore longer term bullish views.
Whew- not easy 🙂
I released this report before 7 a.m., but I haven’t received my ’email alert yet’ ( by 7:21),
so I am going to change the Title & try to trigger it again. If you recieve 2 separate alerts, this is the reason.
There is only 1 report. Thx
FWIW didn’t get either email alert today. But still a great report:-)…seriously…you CAN’T prognosticate daily price movements …I’m out of here! Clearly not as advertised. lol! 😉
Nor me.
There must be something wrong with the email alert system- I still didnt get one
Myself either.
Maybe everyone should complain to admin@bigleaguefinance.com at once : )
That is my ‘tech support’ person
Sent complaint. 🙁
I did too, but I’m not sure if there is anything he can do.
We’ll see – thx
I messaged those guys many moons ago about alerts and they said it was your problem
That doesn’t make any sense.
They are Technical support, meaning that they run everything technical on the website
I am content provider- which means that I provide content only, and they certainly know that.
They or you must have misunderstood something many moons ago – I have no control over
it, it is set up technically to auto send when I hit Publish Report 🙂
https://uploads.disquscdn.com/images/d066e2243b7f6aebd792791a23bd0c4a1d344197725b7a424cf98cf5dae35f6c.gif
Let me know if you see one of those today, will ya?
How is vacation?
Fab ….
will do.. 😉
Toooooodles ….
Interpretation for those wondering …
– ‘Fab’ – is how vacation is going
– ‘Will do ‘ – she’ll let me know if she sees any Giraffes
– ‘tooooodles’ – means there is a guy in the buffet breakfast line across the pool yard, and even though she already ate- she is heading over for seconds 🙂
ha ha ha ……………………….
Still none here either. Just logged in when I thought it was about time. 🙂
Alex, great job preparing everyone for the possible drops in miners. Too many PM traders adopt s a “permabull” mentality that can hurt you if you are not prepared (as I learned the hard way). As someone who was extremely heavy in JNUG this week, I was originally planning to “buy the dip” to the 10 day SMA, but instead I sold a bunch of my JNUG yesterday for a small loss. That’s the opposite of what traders are supposed to do (buy the dips, sell the rips) but I felt I was way too overleveraged and needed to reduce risk. Protecting capital to me is more important than missing out on some gains. I still have a lot of JNUG in my accounts, but keeping a close eye on it. I made great gains from the bottom in December and don’t want to give more of it back. Good trading to all. Manage your losses so you have capital to cash in on the rallies to come.
To my surprise, every email yesterday was calm and just a bit on the curious side. Maybe some concern, but no panic. I feel that the readers here have adapted well to the bullish big picture along with the short term volatility.
Often a drop like that will really shake people up (And I understand that, it was a high volume sharp drop to come home to for those working all day). I used to get emails that were very ‘heightened’, but this drop didn’t seem to shake people up as much.
Now I just hope to get that Handle or a pause and then the burst higher.
I may regret selling as much as I did, but I still have a lot of JNUG to catch the next wave up. Just felt I was getting too carried away and needed to dial it back until this choppy “handle” period is over. I’m posting this because some readers may have seen how heavy I was in JNUG and wondered if I was just going to “let it ride.” I don’t like big draw downs in my accounts and while I know that “buy and hold” tends to produce better returns than trading around dips, it makes me sleep better at night to “draw a line in the sand” and not let my accounts drop below my avg cost basis in a position.
CF what people want is tomorrow prices today
Tomorrow Saturday-
I can EASILY tell you tomorrows price later after the close today 🙂
how about mondays closing prices,get your crystal ball out
$1348 at the close
But I will gladly take anything higher and accept that I am off the mark
#crystalball
And ..
#CoolHead
EGO and GSS both got upgrades from Credit Suisse. Underperform up to Neutral.
PIRS might go
JT, as to your Q about CME gold and silver option ex. calendar, here a link.
http://www.cmegroup.com/trading/metals/precious/gold_product_calendar_options.html?optionProductId=192#optionProductId=192
Generally it almost always expire on the 4th last working day of the month, as is the case this month too.
Actually there is a daily opex on silver and gold currency options (above is futures) at 10am EST each day. Therefore gold is often somewhat subdued till 10am and then sometimes takes off..
This feels a bit better than the close yesterday, some Miners up 4&5 % right out of the gate.
I’m hoping we head into the weekend in the green 🙂
ENPH looks rather interesting here too, it keeps popping above the 10sma, but this one may be accompanied m=by a MACD cross.
I’ve found that when you get a gap up in NUGT it sells back down after an hour. It may finish higher for the day, but you can usually buy it cheaper after 10:30
Yeah, I’ve noticed that when we are in an uptrend- GDX & GDXJ often gaps open and slowly closes that gap at lunch time, and then gradually closes at the highs
Great report Alex. I think your cool head helps many here.
Thx Jeff
I have been through this so many times, and I remember times like 2004 in Miners & how it felt the first several times when gains would come & then a slam down to losses. I would sell and then suddenly price would go higher, so I’d jump back in & then price would drop me to a loss again. I would sell – Miners would be green for 2 days , so I would re-enter, and then they’d sell off all day. Hmmm, there is an emotional pattern there.
SO I looked up “Chasing my tail’ and my picture showed up, so I figured that I better study this stuff and figure out what is happening before I went broke 🙂
bot CANN $5.98 hit my trendline, I think this is as far as she goes – double position!
Yes, some of the herbals moving higher today.
Funny, or not so funny, I just got stopped out. Good luck
I looked back, where did you draw a trendline? Can you post? I don’t see it
trendline 5.86….draw from lows nov 22 nov 30 dec 20……I see this as an ABC correction completed….of course can go lower BUT in my opinion MJs are in an ongoing bull, the bull is not over, therefore it is OK to add at these points. I give this a lot of leash, at least 10 pct
what COULD happen any day is Trudeau announces a firm legalization date or something similar happens…..then next leg could start with a bang…..my next target if this is the low area is $15-20
Still don’t see it anywhere near that line? Is it a different stock?
https://www.tradingview.com/x/18uEAZMA/
you are using a log chart, i don’t……but if you want to be conservative I guess the 50dma is where you load up….I don’t think it gets there, if it does I am buying more….right now I am at 10% concentration, that kid of drop is not prohibitive
sorry i had that backwards- I am using the log scale chart on stockcharts….
I added TWMJF end of day yesterday, looking good this morning.
Best of luck to both of us knife catchers!
just wanna show $silver is bullish in its current position… back-testing & now sat on top of this daily ma net.
net breakouts are bullish.. if it needs spelling out :).
a drop back inside could mean support at 17.14, or possibly trading sideways in a range down to 16.60s
a drop out the bottom of the net is bearish (on a daily basis at least), i would suggest
https://uploads.disquscdn.com/images/24596cc33c8e65d1b5fdfe8fe3dc6648e57a7b1aa8f28b34821b31efc22cf843.jpg
*edited 16.60s
Is that a daily? I know you often use 2 or 4 hrs or something too. Thx
daily ,,, yup!
Thanks SOG…I like these charts.
i forgot… Hokusai waves 🙂
An interesting way to visualize movement.
added GSV this morn. Havent traded this one since early 2017
luv that weekly… damn
yeeeeaup… Trading on vacation is hard… Its also pitch black here in Kauai but Ill take the ocean sounds and roosters and GSV at 1.88
… nice…. luv luv luv ocean …
#BornInTheSignOfWater
#thereThatIfeelMyBest
#JerryRaferty? Guessing
Cool Change…..Little River Band
Trading floor until Wednesday. https://uploads.disquscdn.com/images/2bd2b73bbb3db9c22a6e3043670eefb53890905df2c3aebeedceca16cf12af90.jpg
I love the surrounding mountains/ Palms, Water- very nice.
It’s either really early when you took that or You have the entire place to yourself
I took my gains from JNUG and well….
just kidding… yea its early.
….bought the place & kicked everyone out? lol
Giggle….
Ughhh… heaven…
Where is that exactly….I need that…;)
Where is that?
Kauai – the green island.
Ive been doing a ton of island traveling these past 4 years – I strrrronngly rec. that if you dont already have one (And I can send you a referral link) but get the chase Sapphire card. This card from chase is simply amazing. Point structure is beyond great, and the travel points add up so quickly that my wife an often often end up paying only the tax on these trips we take (out of pocket)
Very pretty…and I see a cruise ship in port.
Nice! I loved Hawaii when I went a few years back. I was with my parents and they booked some VIP cruise ship cabins for a week.
I was too scared to try their weed. If I went back now, I would get in SO much trouble.
Go CRK!
CRK, WTI, and a couple of others have been very nice on the move higher
Does CRK look toppy yet?
Not really, it just moves higher, goes sideways toward that 10sma ( or 13sma) and then higher , sideways repeat. And if you look on a 1 yr chart, it kind of looks like it wants to return to those highs
Thanks Alex.
TWTR added again. nice looking reversal here
I bought this 2 days ago, and added at $2.90.
As small of a move that this looks like it did today, that was a 25 cent move, so it does move rather big in both directions
https://uploads.disquscdn.com/images/a3d3d9fac3af9a363484b411425b8ceb4b6c6e2e125767690f427f9eef18ddc5.jpg
I followed you! High hopes! New slogan for MJ stocks
yuk yuk
I am still holding, looks promising
I like MYMMF, and similar set ups in 2 others that I own SPRWF, and OGRMF. It at least looks steady and more sideways- and less likely to sell off, but you never know for sure in this sector. These are all Canadian Companies and I feel that they may be a bit less jumpy. I also still own CNBX, a US company
On the MJ front, a couple of issues may be suggesting higher prices as they challenge highs on good volume. https://uploads.disquscdn.com/images/b4b0cc6dfc58e6e3ec8364ed7ae2ef706f971c67af24a450e5f71a062efe8d05.png https://uploads.disquscdn.com/images/abcc00fd6c973ad6cdb017617f64db5c029dc5f4de17b92113cdec32301434e5.png : OGRMF and VFFIF.
VFFIF is a nice chart, not hard to ride that, thanks
= )
It doesn’t LOOK too hard to ride at a glance, but notice that 2 weeks ago it dropped from $8 to $5.50 in 3 days!
I found VFFIF after the drop you described and posted the chart here. When the sell off to $5.50 reversed, I nibbled. Going forward, who knows. I purchased the Canadian shares…better volume.
It actually is a great uptrend, and buying where you bought gives you plenty of wiggle room without worrying at all. I do think that is a good chart – basically it is obeying the 20sma , as you have drawn on there.
Todays volume on that one as it pushes highs is a good thing too. I was just mentioning the drop when he said it wasn’t hard to ride. Some of these you almost have to buy it and forget it, when they trend higher like that.
I mean $1.50 to $8? Who can knock that! 😉
Compare that drop to CANL
seeking alpha just issued a report “Gold and gold miners – their runs are over”
I always lean the opposite way from them ….interesting timing
i have $gold/$silver acting bullish on a 15min…but could just be a countertrend bounce.
$gold needs above $1358
$silver needs above $17.56
$xau flat to slightly up (for now) so hoping that’s a good sign with metals down. Maybe a few more sideways days yet and we’ll see… Crossing my fingers the plane in the pic above doesn’t get hit by that lightning bolt and blows up all together :-))
Zzzzzzzzzzzzzzzzz
Ok thats it. 1st glassof Barolo incoming have great weekends! 🙂
just been away for over an hour, got back & yours is the only comment above mine….
https://uploads.disquscdn.com/images/cd7c4285f7ac62bd70e2bc0cb68914b013135b307fc4215744ef3c40a1ba4ee4.gif
hahaha yep
I was doing a jigsaw puzzle and yawning…time for either a nap or a butterscotch appletini!
AGTK will be on Fox Biz Sunday 1:30 on “new to the street” segment.
AGI upgraded to outperform by credit suisse
For anyone in crypto… Jim Rickards is currently shilling Stellar. My favorites are Vechain (VEN), Stellar (XLM), and Waltonchain (WTC) which has a ridiculous chart right now.
Thanks JT. I am a long term holder of several coins but if I were to highlight one it would be NEO. the ethereum of china has a lot of projects being built using it’s platform.
I have NEO too. It could be getting ready to break higher vs ETH. I think it’s technologically better than ETH in the long run, more than just an “ethereum of china”. It will be the choice platform for regulated businesses. Along with EOS, which is a very bullish chart right now too. (Hard to pick one!)
I do all crypto charting against ETH.
Sounds like something better comes out every month, how do you guys keep up? What happens to Ethereum then, NEO is even better?
It definitely is overwhelming to new investors. Reddit’s cryptomarkets sub is a good source of tips. Then just research research research.
NEO is better (my opinion) but it will be more popular in China where compliance is important. The NEO/ETH chart is an uptrend, which is enough for a trader/investor. For anyone curious, here is a good recent talk by the founder: https://www.youtube.com/watch?v=4XJIdcvjNFE&t=2s
I’ll tell you from experience, Jim Richards is a crook and a con artist. And EXPENSIVE too. I’ve made peanuts with him, but lost thousands. That’s the truth.
I could tell right away from the way he was advertising.
XLM looks like an excellent set up to run higher, but what price is that??? 🙂
That´s strange because I just got done watching video where he was on a panel with Rick Rule, and it seemed like he thought bitcoin was a joke. Bitcoin isn´t other cryptos, but it´s as if they didn´t want to discuss it, after it was joked about a few times.
Bitcoin will indeed become obsolete. Ethereum and possibly Stellar will rise to the top next. Others that have massive business application (Vechain) will do very well, too.
wondering how you trade it. I put xlm in tdameritrade and it says no such symbol
$audusd is very strong seems to break out from 2017 high
One of our Readers that posts by the name MATT C is from Australia, and I believe that it was him that pointed out to me in the past through an email that it tends to run with Miners, because Australia is a commodity type country or a Mining Country – and also it does the opposite of the USD ( He said it better than that). Chime in MATT C if you read this .
So I had been watching that too, since the DEC lows. NICE run up along the 13sma, bottomed right when the USD topped , so if the USD is set to drop big time, then I am thinking that AUDUSD is going to run ( with Gold)
$audusd bottom late 2015 early 2016 and that corresponding with many metals. I am also using this as my indicator for metal and mining.
ipi uan lower channel https://uploads.disquscdn.com/images/0a3bd37dfbfb637cad556888c90d4c92dbe0ef26a5709428ecaa9c86bda6eea7.png
Man, I look at UAN and it looks like an easy long entry, and then a short entry along its channel.
Trump wants to increase defense budget by 13%. Would not be surprised if dollar accelerates downward.
BA & RTN ( Boeing & Raytheon ) is a nice chart that benefits from military work.
And check out RTN after that 2 month consolidation.
Bought IMLFF at $1.05 and MSRT at .40 today for swing trades , close stops on both but seems like a good bounce point. $1.17-$1.30 target for IMLFF , if MSRT can break the 200D ill look for .55
Added TWTR PRTA and CY today all from the beach. Scalped HL. IPI needs to move. NVDA (soxl wow) made a nice move today as well. Looks like Steve’s old friend the Qs making all time highs again.
I really like PRTA here, bought a starter at 44.25. If this breaks to the upside, I’ll be stoked. Thin trader tho.
I like that PRTA chart, . I took a day trade in SIGO today, took a nice profit but wish I had bought a chunk the other day when I was charting it out. That thing blew up today.
I also think IPI should start moving up from here. I’ve been accumulating it since mid last year using 30 w ma for long term hold. Ill add again of it can break $4 but doubt it will.
Still like IPI? I’ve been kicking around the idea if grabbing that one but haven’t pulled trigger yet. Haven’t missed anything there so far!
I’m not sure if the email alert system was fixed or not- the weekend report has been released
Haven’t received email notification so far as of 7:58AM west coast time.
I just sent a request to ‘support’ for them to push out an alert ( It will be different from the normal one)
and he is on the road, so That alert should go out in an hour or 2.
Then we have to fix that alert set up for good. Sorry about that, modern technology has a way of helping and disrupting
Very true, and thanks for help…I got report the way you told us a long time ago…just push the side of last report…going to read it now. Have a great day Alex.