
Dec 21st – Charts, Charts, And More Charts
I’m going to start by mentioning that Oil rose slightly on the inventory report, and now the XOP looks ready to break higher. Now take a look at the XLE.
.
XLE – This is unexpected, because even though I thought that OIL could tag the $60, the COT remained strongly bearish, and most Energy stocks began selling off 2 weeks ago.
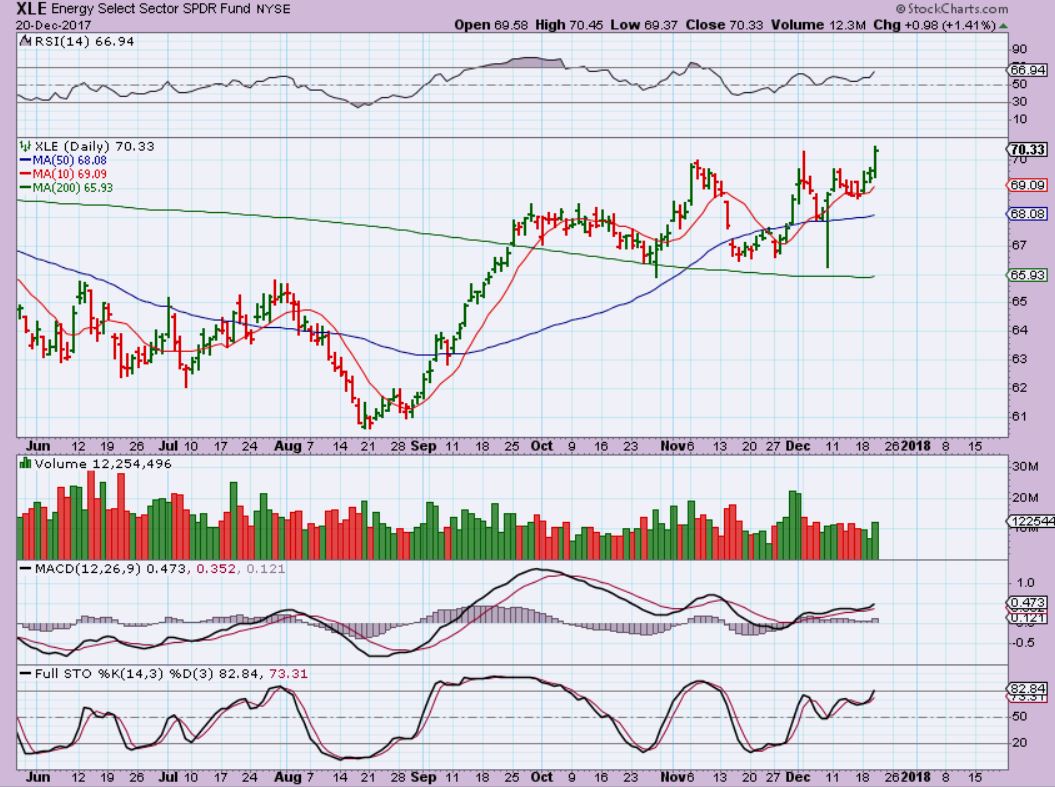
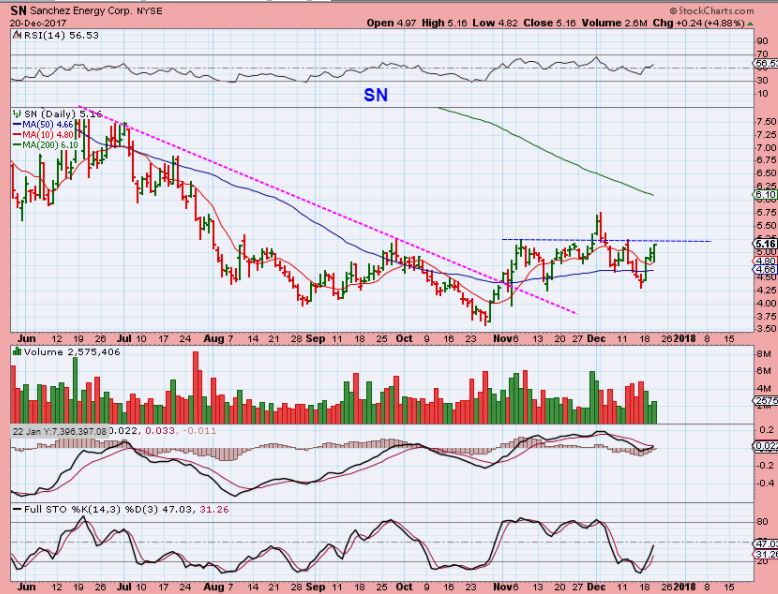
I am holding off on Energy for now, watching Miners more closely, but looking at SN, WTI, AREX, AXAS, DNR, etc and these energy stocks do actually look a bit more bullish. The sector is a bit confusing right now, so I am not long or short Oil / Energy.
In yesterdays report, I showed the Numbers that I was watching for GOLD to break out. Those were not taken out, however the way that Miners acted was very encouraging.
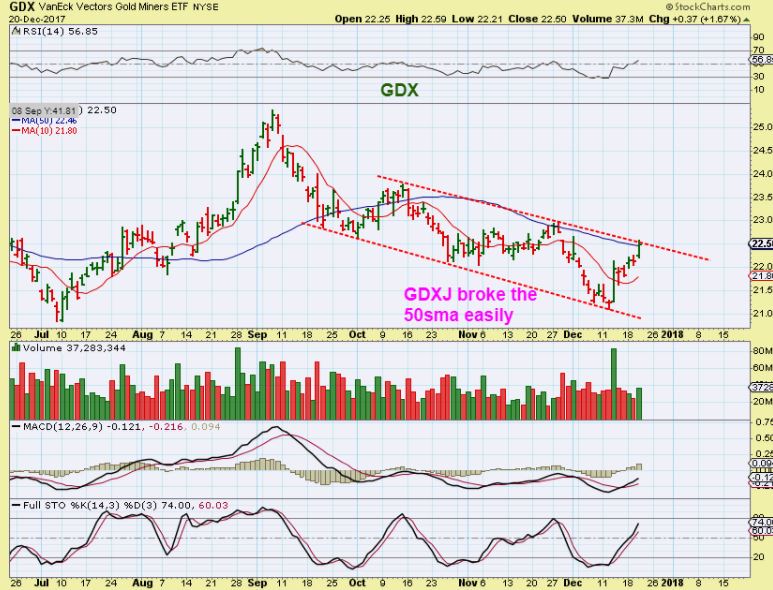
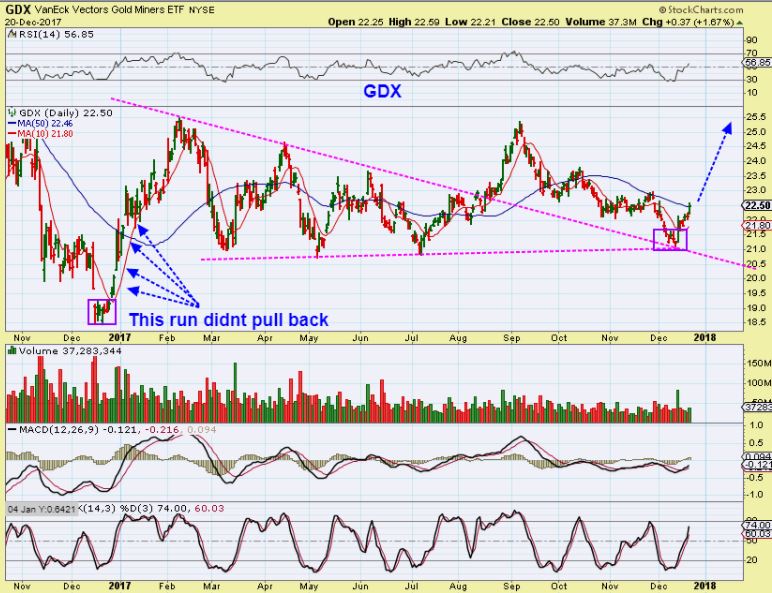
GDX – GDX ran to the 50sma, and instead of pausing or pulling back, it actually broke through. Can it push above this down trend line? GDXJ says yes it can…
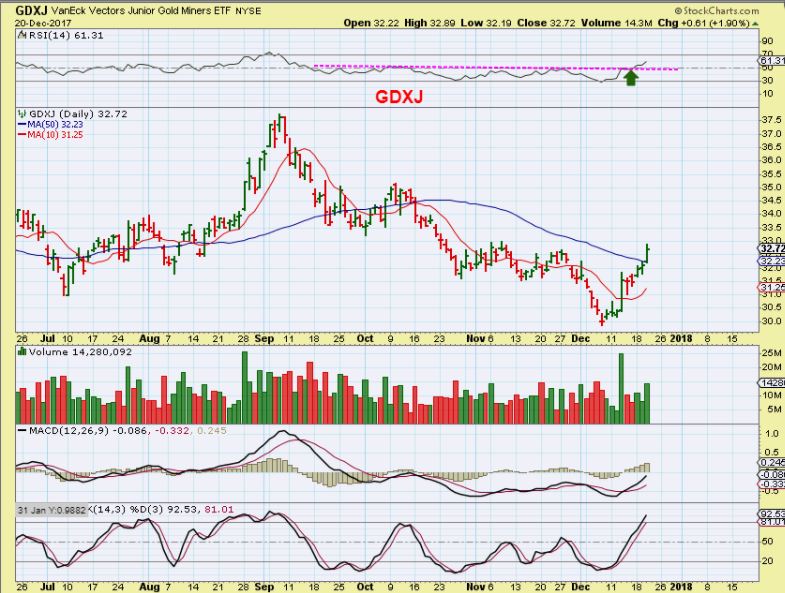
GDXJ – Better than that was the way that GDXJ ran up to the 50sma, closed there Tuesday, and then broke above and closed well above the 50sma. The 200sma is above at $33.46 and that would be the next likely target.
GDX – This is, in technical analysis, a normal break out, back test and then a run higher. That is normally a very bullish chart set up. Did you notice how Miners ran out of the lows last December? With the 50sma not acting as resistance, this could be making a similar move, please read the chart.
I mentioned that I sold a small portion of my JNUG Tuesday at the 50sma (Sold JNUGG @ $15), but after watching the morning action in Gold Tuesday & Mentioning it several times in the comments section, I Bought my JNUG back a bit higher near $15.15ish. Miners were NOT pulling back and Gold was set to pop intra-day. I held that position overnight, and looking at last December, I may not sell any again for weeks if the ICL is confirmed.
ABX 2016 – AS A REMINDER, Miners like ABX in 2016 just slowly ran higher day after day after day. Breaking above the 50sma & continuing onward, people waiting to buy a pullback missed the moves. This ran $7.50 to $14 before most knew what to do about it- no visible pullbacks.
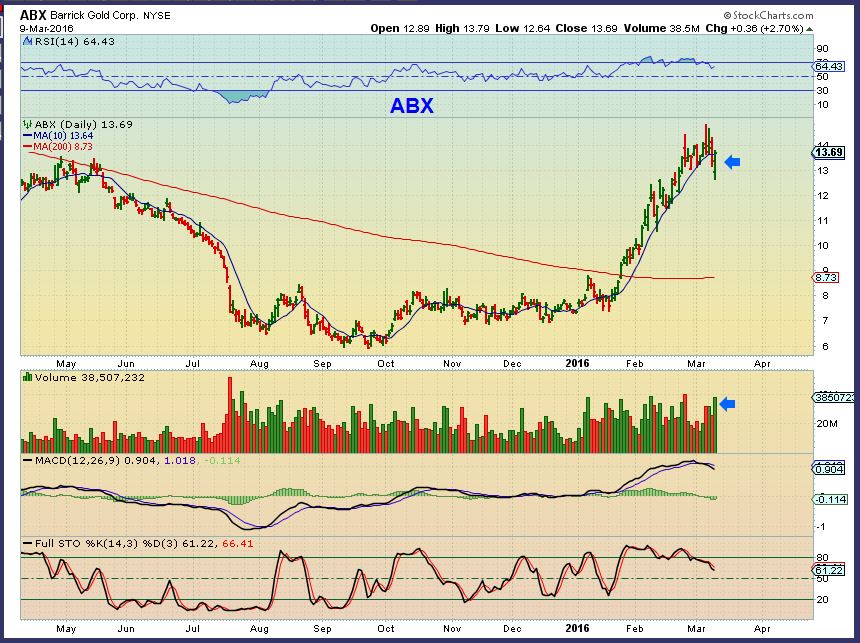
ABX 2016 – AT CHARTFREAK, we did not let it run away. Most people got left behind, but I was telling my readers that after a quick break above the 50sma, these look set to run higher the SAME WAY THAT THEY DROPPED. That drop was relentless selling day after day after day, so we could see the buying in the same manner. And we did. See the left side of the chart.

SO you should own some MINERS at this point, they may be starting to ‘melt up’ like in 2016, and you usually can’t tell for sure until later. I was saying BEFORE the FED meeting that some Miners were no longer selling off with Gold, some even bottomed in November, and I showed BTG, SAND, AG, AUY and a few others as Miners that probably would not hurt to hold a starter position, and then add when it seemed right. I did think we could get more downside, but some Miners stopped selling off with Gold. Miners became more bullish after the Fed, and I mentioned that I was buying GPL , JNUG, and I would own more too, but I was holding too many trades (Blockchain and Medical MJ). I said that I would be buying as I lighten up on those. Add tot hat the recent COT reading, it now looks like we are at the ICL. Miners seem to be responding bullishly, I will show some Miners in the following section too…
I’m going to do something a bit different for your Thursday report. I’m just going to list a number of different stocks in alphabetical order, and I’m treating each stock individually. Now if you want to come back to the report and look up that chart of AUY or NAK, or TGB later, they are alphabetical and you can get there quickly. In the future, I will probably go back to grouping them by sector.
Alphabetical
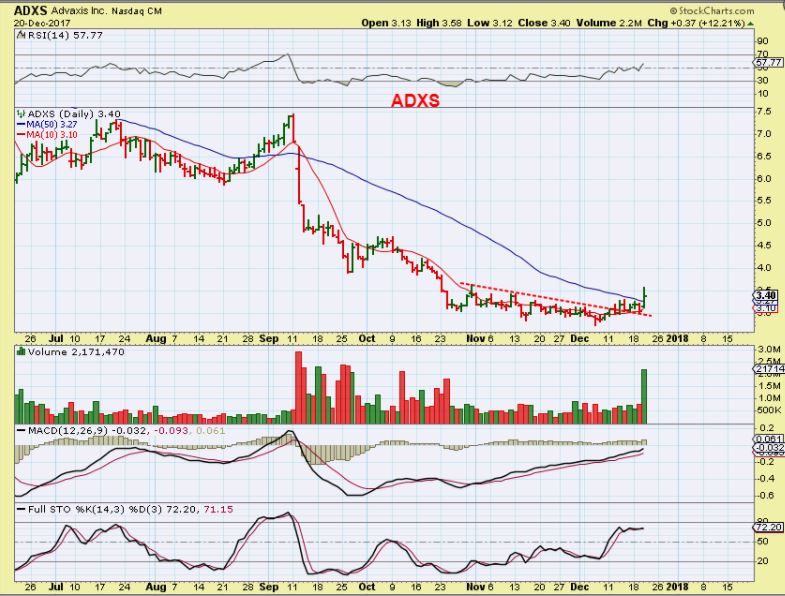
ADXS – This is a buy, but it is a pharma / biotech company so it may have added risk. It is a nice base that suddenly Popped, broke the down trend, and closed above the 50sma.
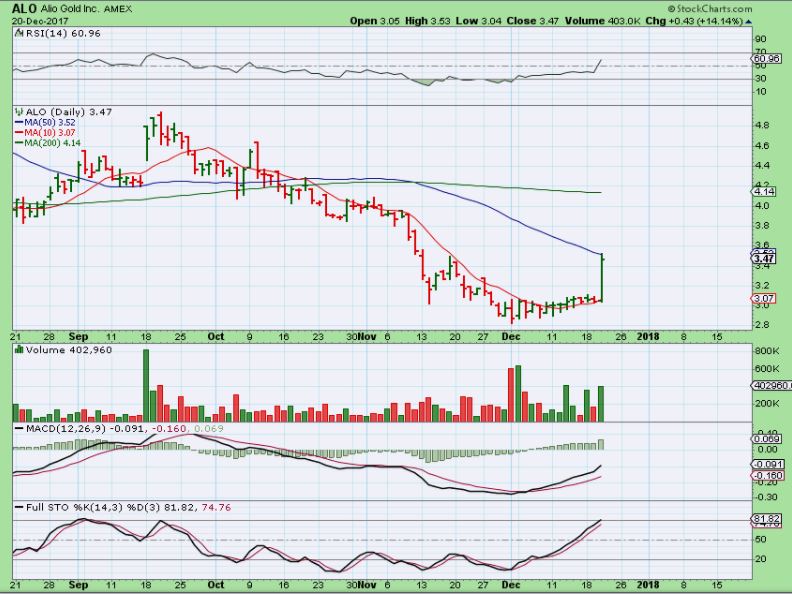
ALO – This is just to show that MINERS are moving off of the lows one by one. If this flags under the 50sma, it could be bought.
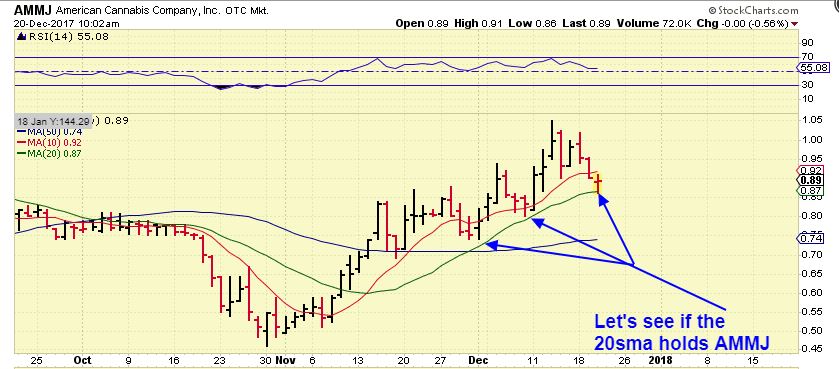
AMMJ – I posted this in the comments section, looking for AMMJ to hold that green line 20sma again.
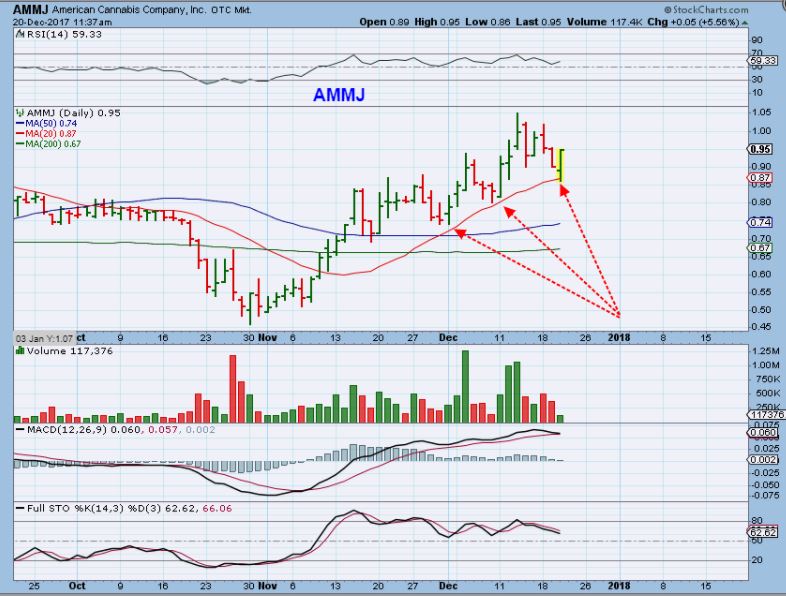
AMMJ – This was captured about an hour later, and it closed the day with a solid looking reversal, so this would be a buy with a stop under the 20sma. Volume remained very light, but should pick up as it moves higher.
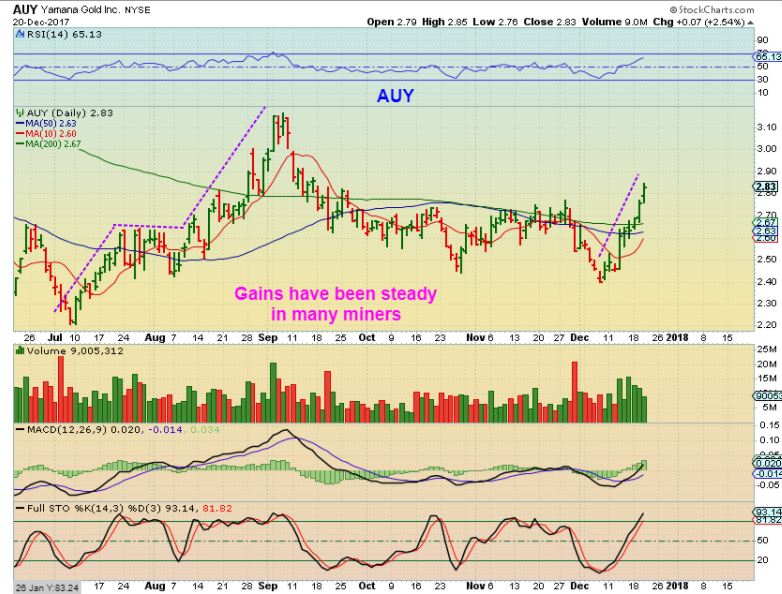
AUY– Another Miner that I’ve been discussing, was AUY. This was Dec 14th at $2.40 and this was a low risk buy too, as it was near recent base lows…
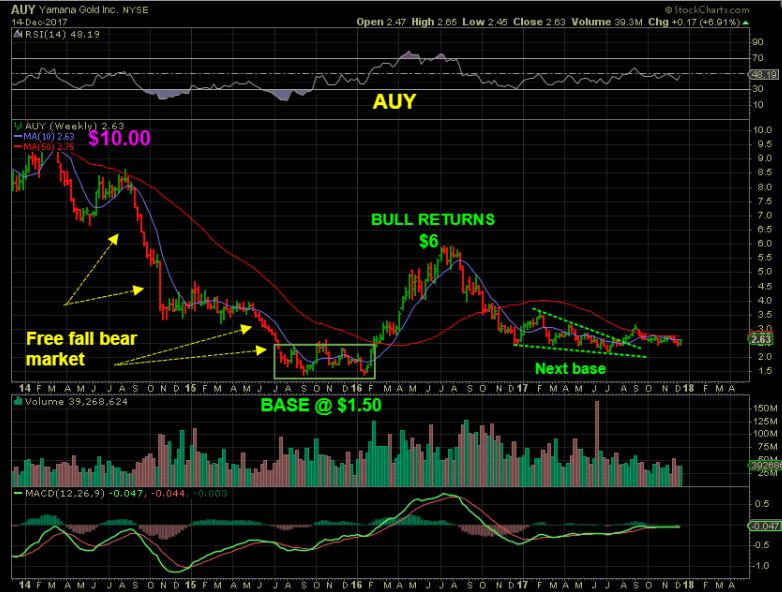
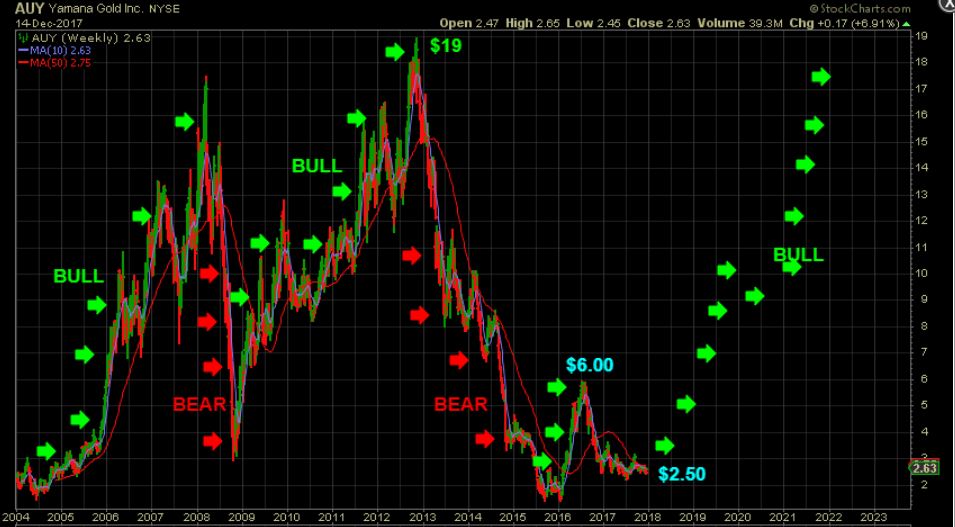
AUY – You may recall that I was pointing out the Big Picture potential , since I think that Miners are returning to a BULL RUN.
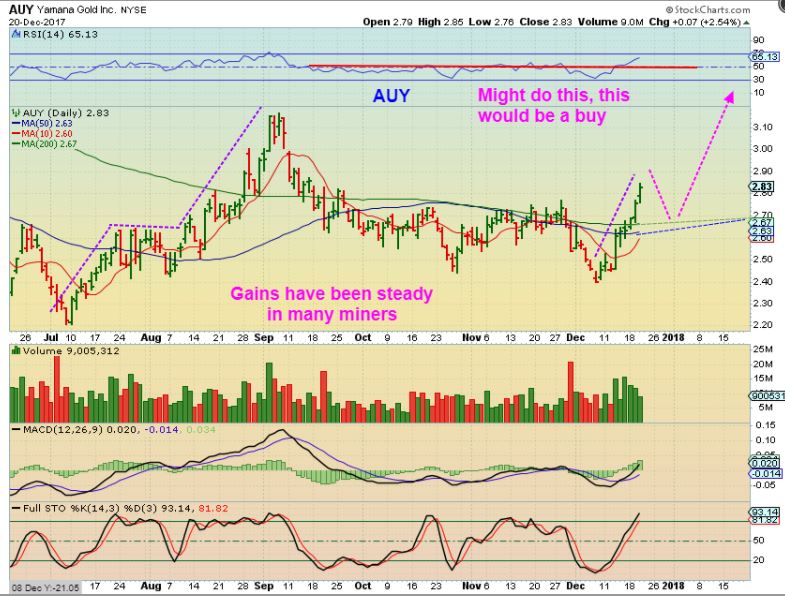
AUY #1 – Since that day, AUY has not had a down day. Miners are slowly rising to the occasion. You can see that it is moving much like the run out of the July ICL. What might happen next?
AUY #2 – It could pull back and tag the 50sma, see the chart, that would be your next BUY, or…
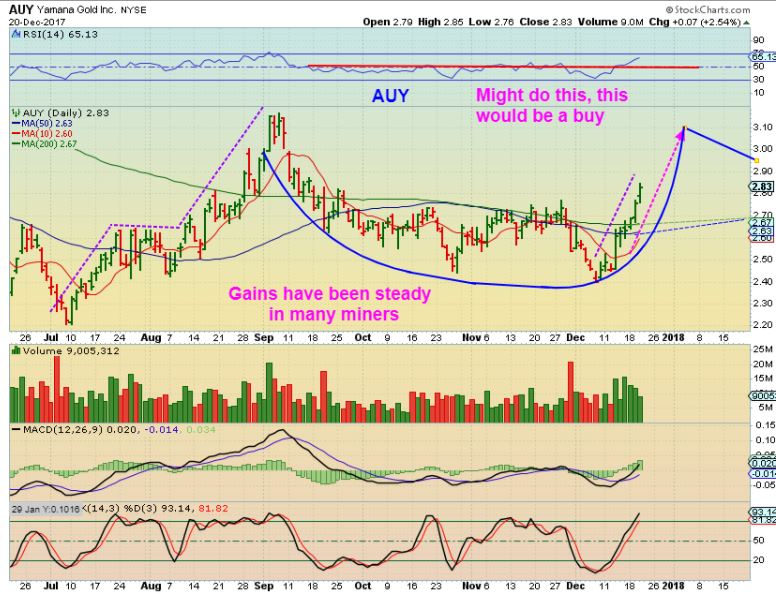
AUY#3 – Or it may just run like Miners did in Jan 2016. At that time, people waited for a pullback, but slowly, day after day, Miners ran away. You may just see a cup form. See that ABX 2016 chart again for an example of how these MIGHT move if we melt up & out of some bases.
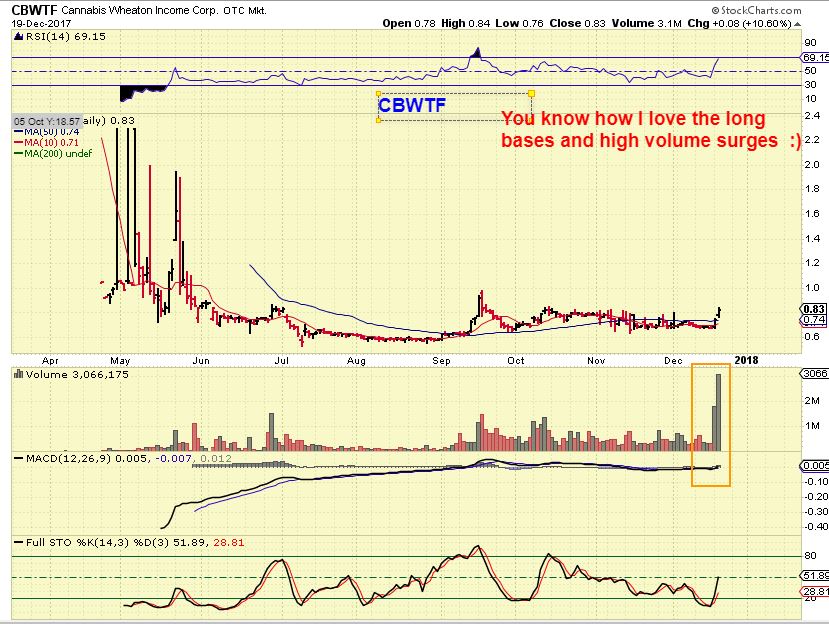
CBWTF – I posted this chart as a bullish set up in early Dec., and the potential is quite impressive if this gets going. It is a medical marijuana company.
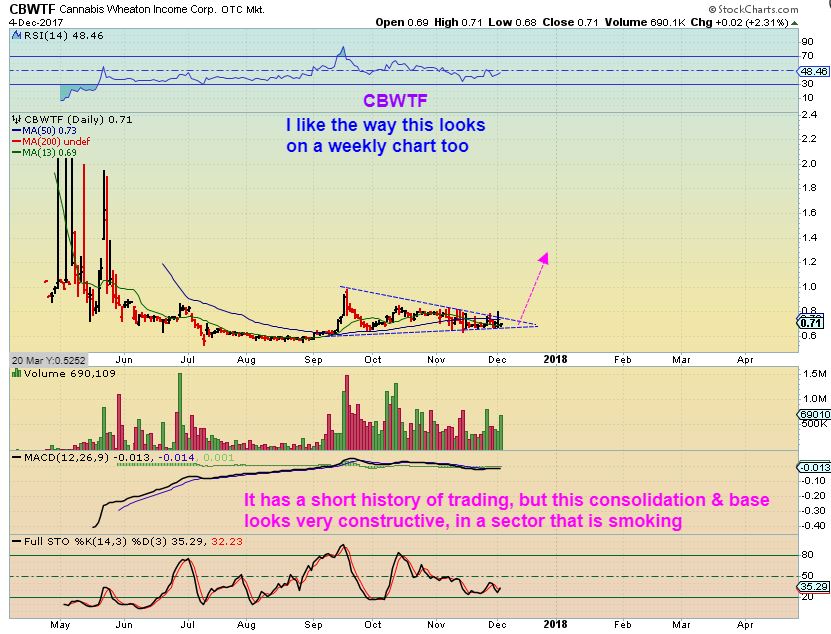
CBWTF– We have a break out of that triangle, and this could really get going based on that volume. Yesterday it hit $1.00, but dropped and closed at $0.94. If you bought this, I would not sell it ( I own it), I think that this could really accelerate with that volume if it gets above this base. Above $1.00 is a break out.
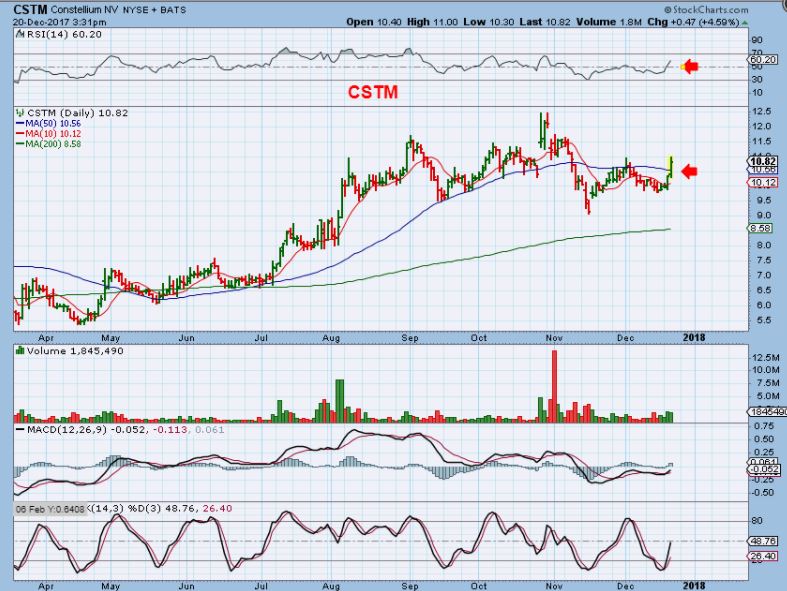
CSTM #1 – I owned this steel stock in the past, it moves well. It looks ready to break out now that METALS are acting bullishly again ( See X or STLD). Breaking above the 50sma makes this a buy candidate now with a stop under Nov or even Dec lows. Notice that it already went $5 to $12 this year, and really only pulled back to the $9 area, but if this runs again…
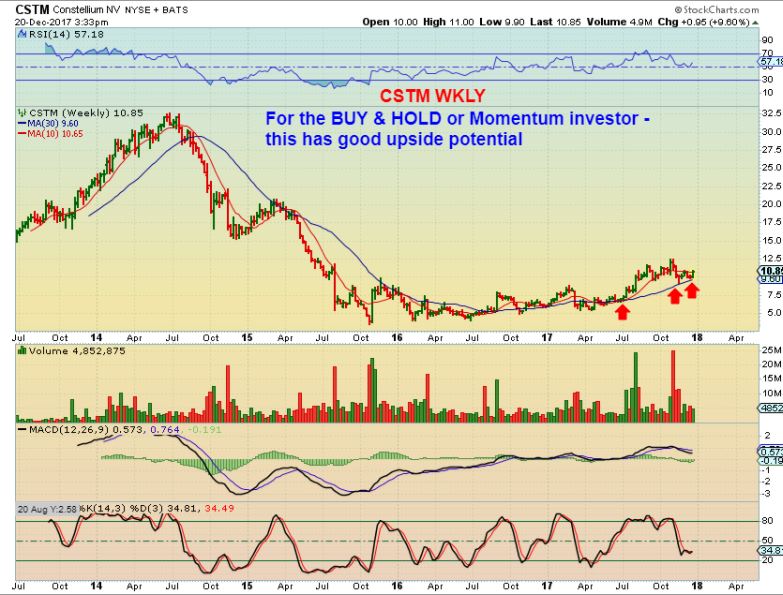
CSTM – The potential for this one is great too. This can be a ‘Buy & Hold’ if that is what you are looking for. This looks like $5 to $12 on it’s way to $33 again eventually.
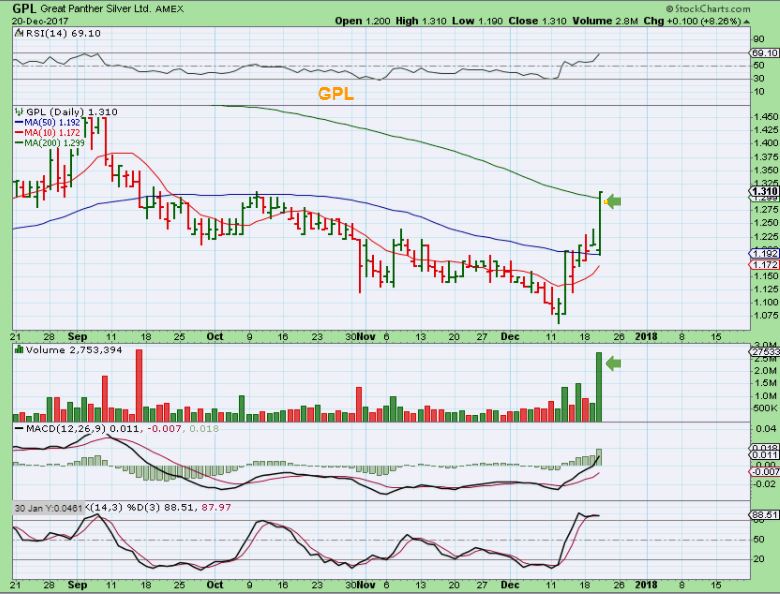
GPL – I posted this Miner on the day that I bought it as one with a 9 month base. I bought that because it was a silver stock and Long Bases get explosive! It looked like a shake out and recovery and the FED Speech had ended. I mentioned that this was one that I bought, but since the 13th, GPL stalled a bit…
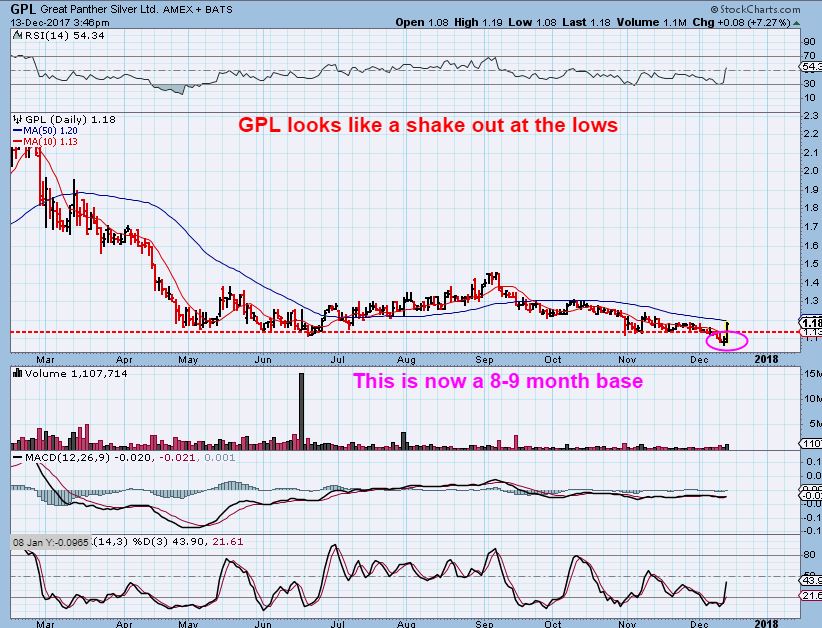
GPL – And then Yesterday it just burst higher and closed above the 200sma. The Miners are on the move. Look again at chart #1 above – that BASE could make this continue to be explosive as time goes on. Look for Miners like that.
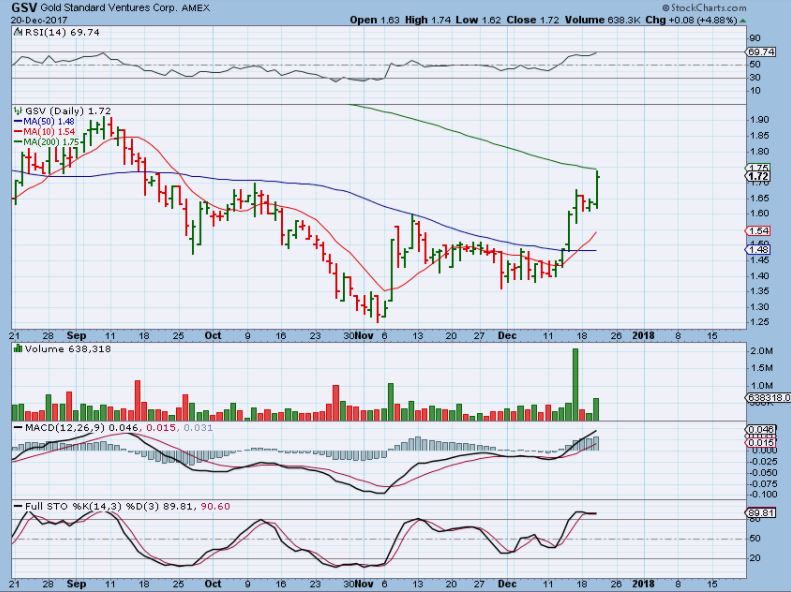
GSV– Another Miner that bottomed in November and is now finding follow through. This one will probably pull back before breaking out and would be a buy, especially if it tags the 50sma.
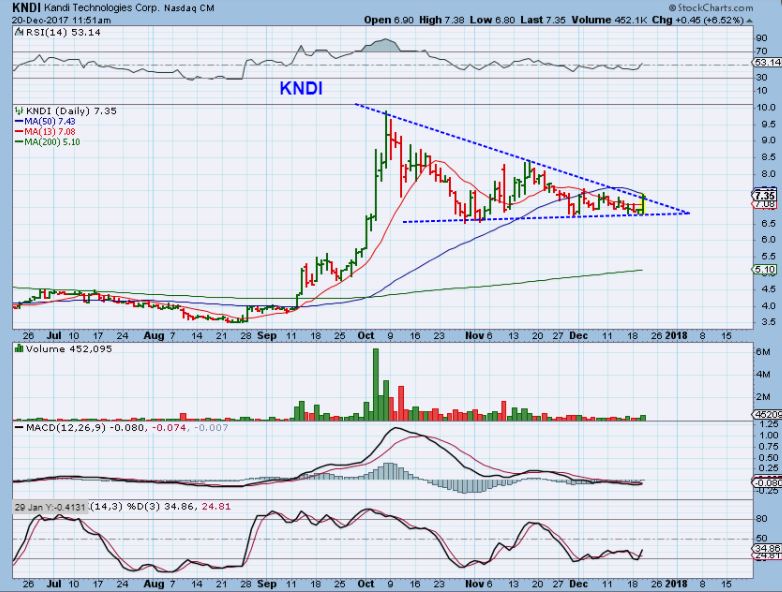
KNDI – This is an old tech stock that some of here have traded. After a STRONG RUN ( $3 to $10! ) in September, this consolidated and now looks ready to break out & Run again. This is a good low risk set up. Low risk because we are either ready to break out now, or your stop is right below recent price.
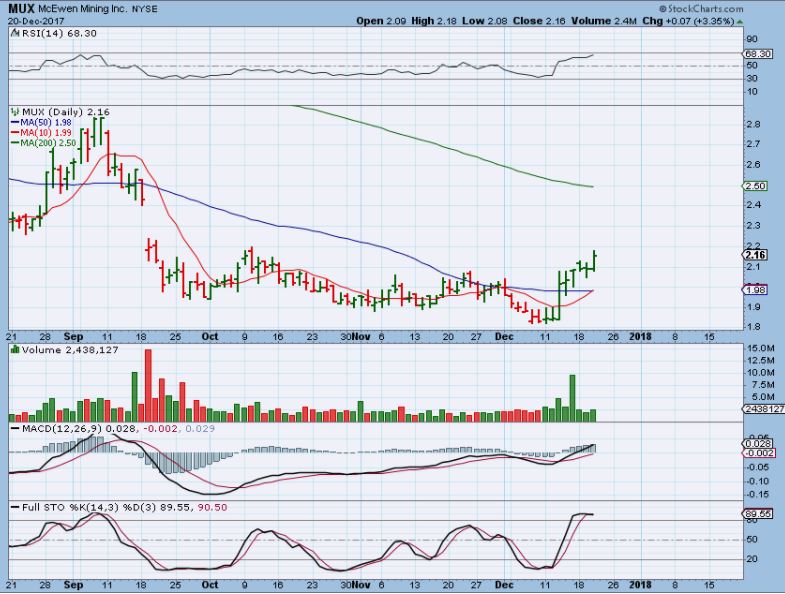
MUX – Another slow melt up, MUX does have a multi month base. $1.80 – $2.20 is a nice trade, but this is just rising above the base, so this is still a buy, not a ‘take profit’. If I didn’t own it yet and wanted to, I would buy a little and hope for a back test of the 50sma to add more, but as we’ve seen, many of these are just rising to the 200sma. This could easily just run to $2.50 if we melt up.
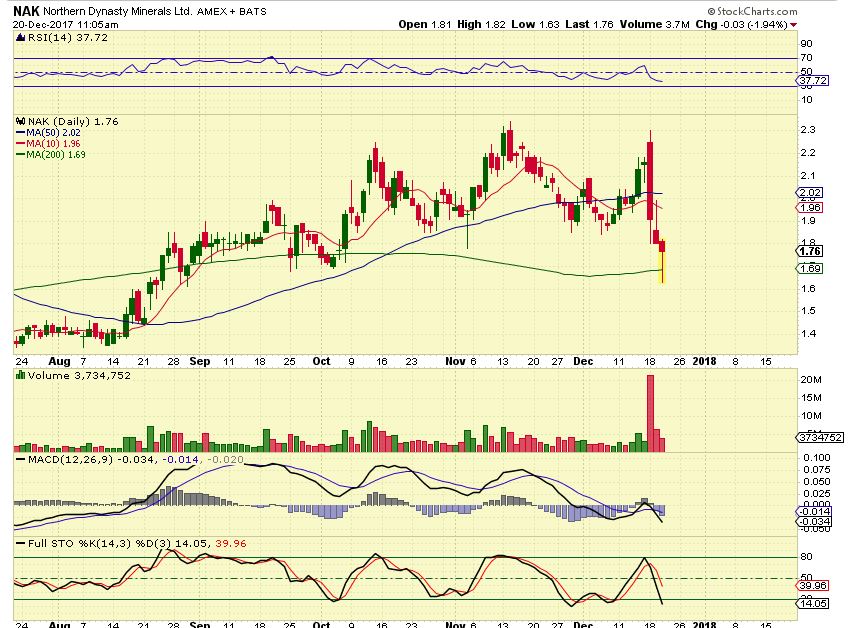
NAK – NAK has dropped to the 200sma, performed a shake out, and reversed higher as buyers stepped in. That was a potential buy point with a stop under Wednesdays lows or the 200sma. Nak is obviously now inside of a larger consolidation as it consolidates ‘news’ of a partnership deal.
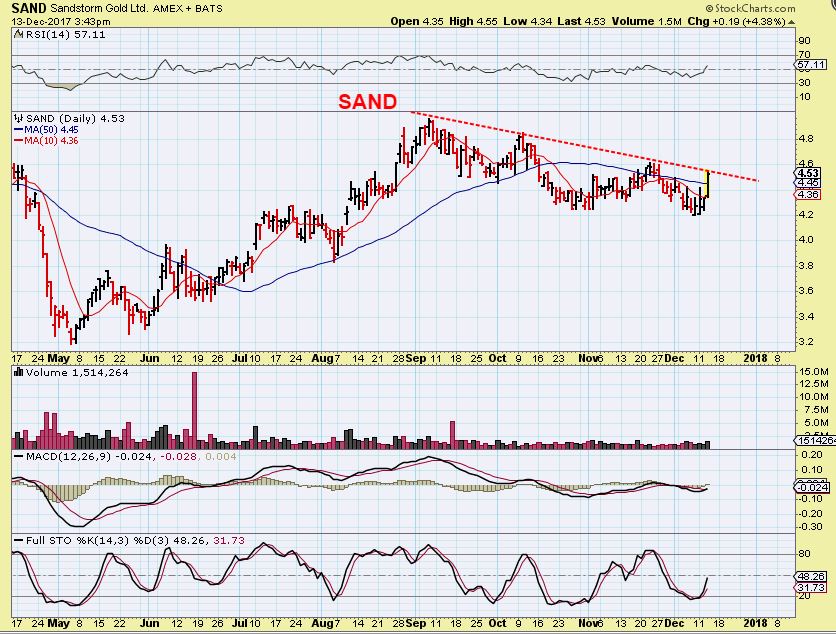
SAND – I posted this as a BUY on Fed Day as it broke above the 50sma and looked ready to break the down trend. SAND had NOT pulled back very much as Gold sold off, and was basically a $4 stock with great potential as a streaming company . I also mentioned that this was an inverse H&S.
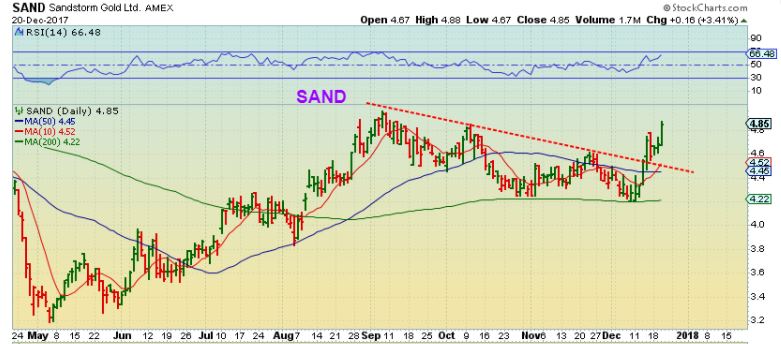
SAND – It did break out, and yet it has stalled last week too. This is still under $5 and THIS is a company that I think will do very good in the Bull Market. It is still a BUY in my opinion. Notice how it handled the 200sma.
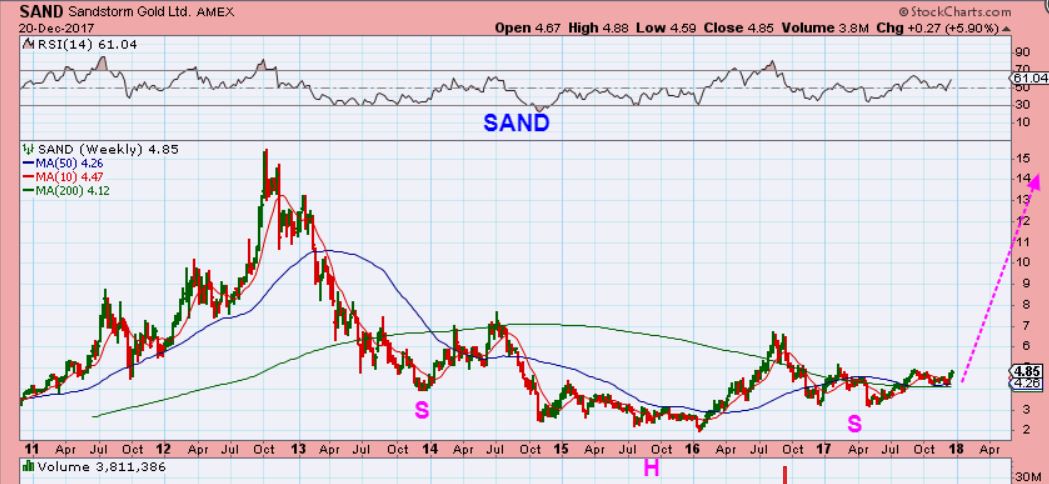
SAND – The potential for that $4 stock is nice. It was a rough ride higher in 2011-2012, but it ran from $3 to $15. THAT is great for the buy & hold (add along the way) type of investor. I would expect this move higher to be a bit smoother than 2011-2012. More like that $2 to $7 run in 2016. $2 to $7 is Big Gains.
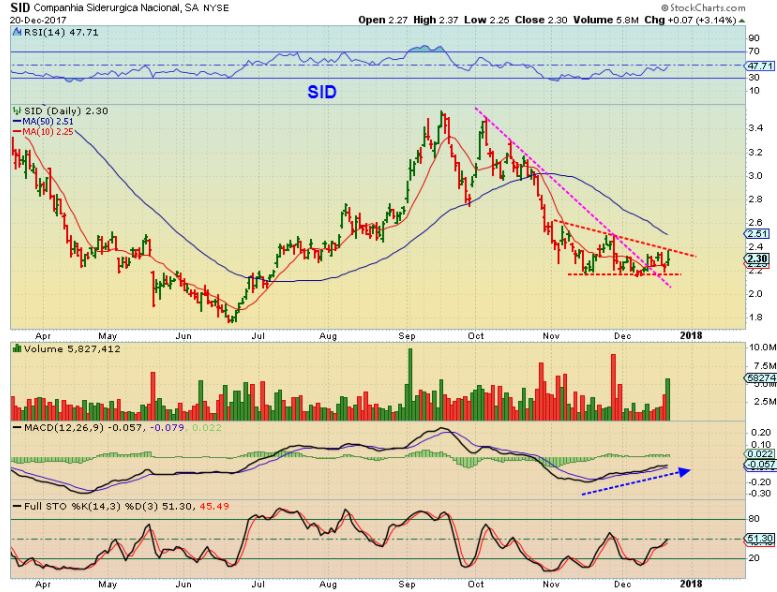
SID – This is a steel stock that really picks up speed the last few times it ran higher. June to September saw it tack on 100%+ In 3 months. I have made good gains on this one personally, and it looks ready to start a run higher again, now that Metals are perking up again.
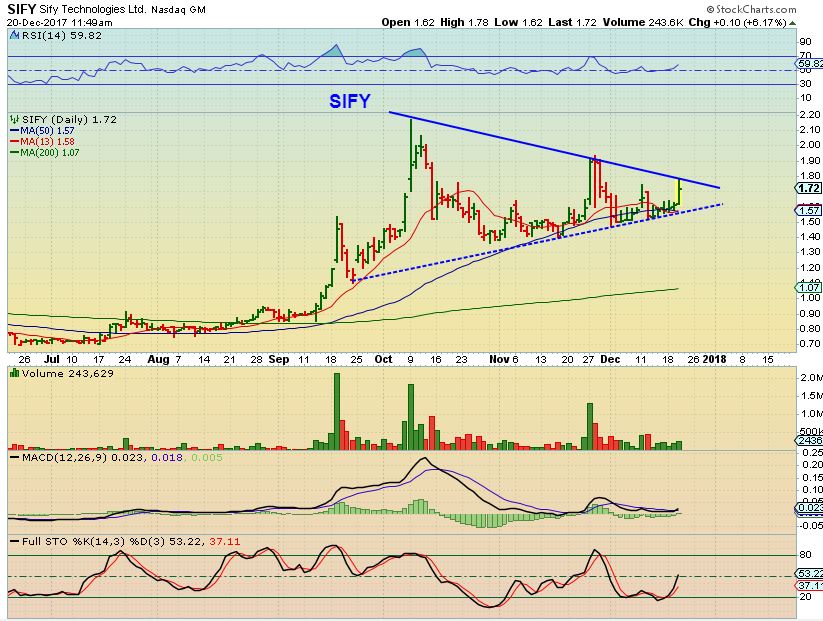
SIFY – Another TECH stock that I used to trade, SIFY ran from 70 cents to $2.20 recently, and then simply consolidated those gains into a triangle. It looks ready to break out.
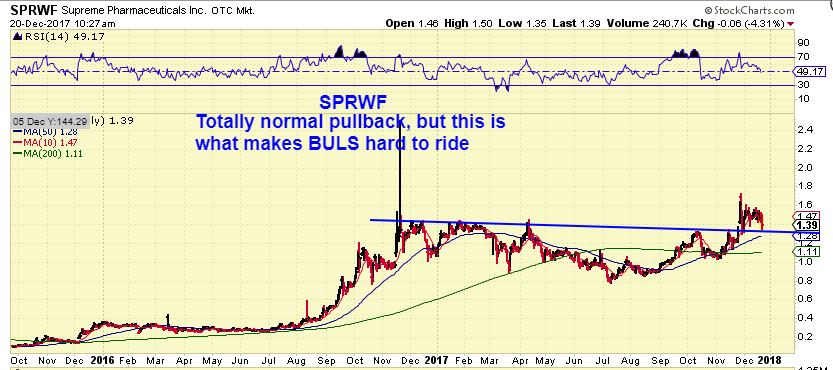
SPRWF – I own this and I know that some of the readers do too, so this is a follow up chart. SPRWF has been dropping, but it looks to me to be a normal back test of the recent break out. A bull run that is not easy to ride, but it does look normal.
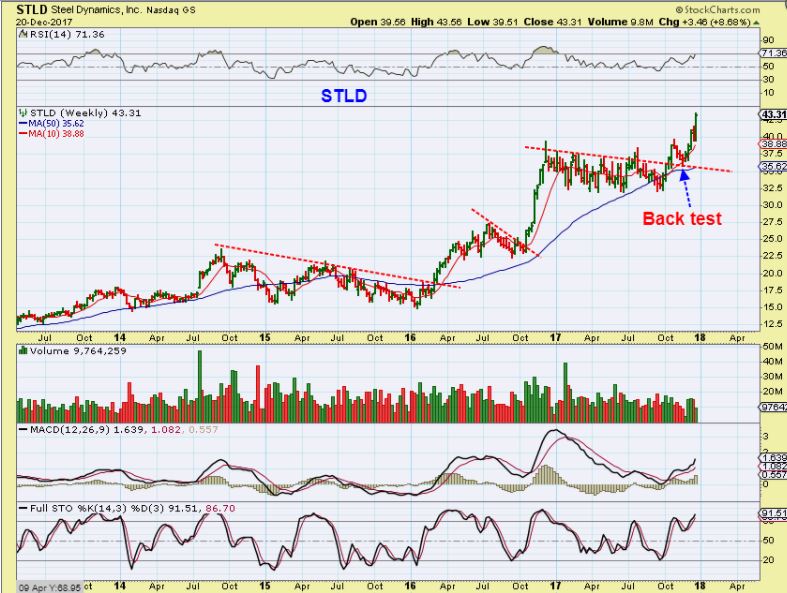
STLD – I posted this chart in October of a Steel stock STLD. It is bullish and after a big run from $15 to $40, it has consolidated sideways. A break out would start the next run higher to $50+, and this would be good for that BUY & HOLD investor too.
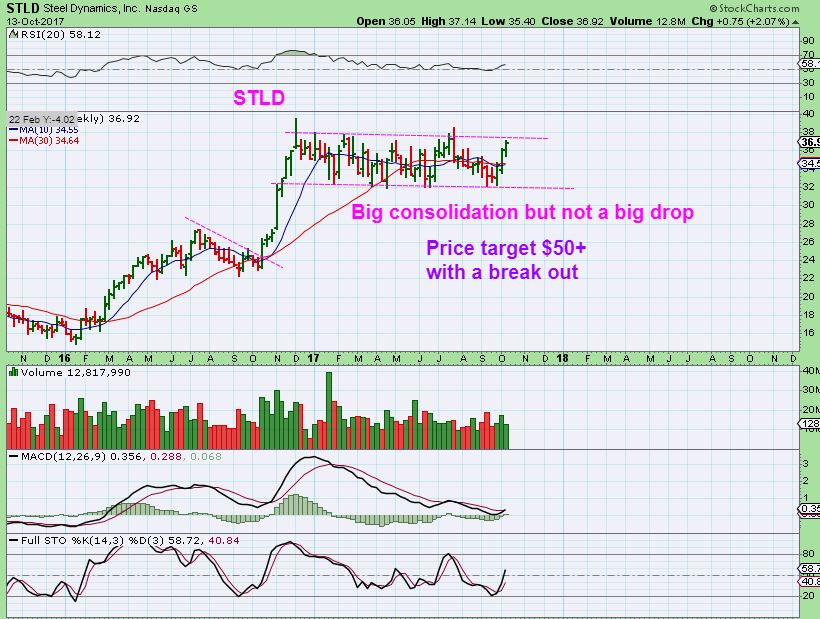
STLD – It broke out, back-tested ( Like SPRWF is doing now 🙂 and is now continuing the next run higher.
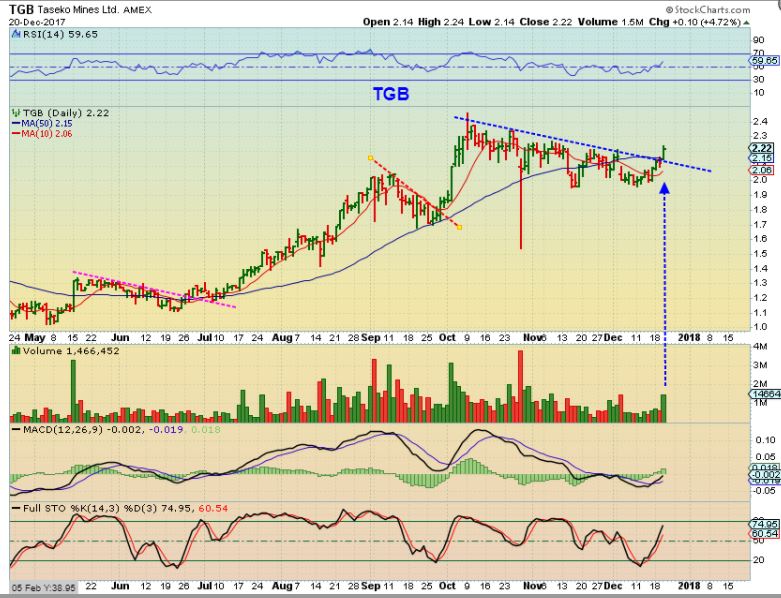
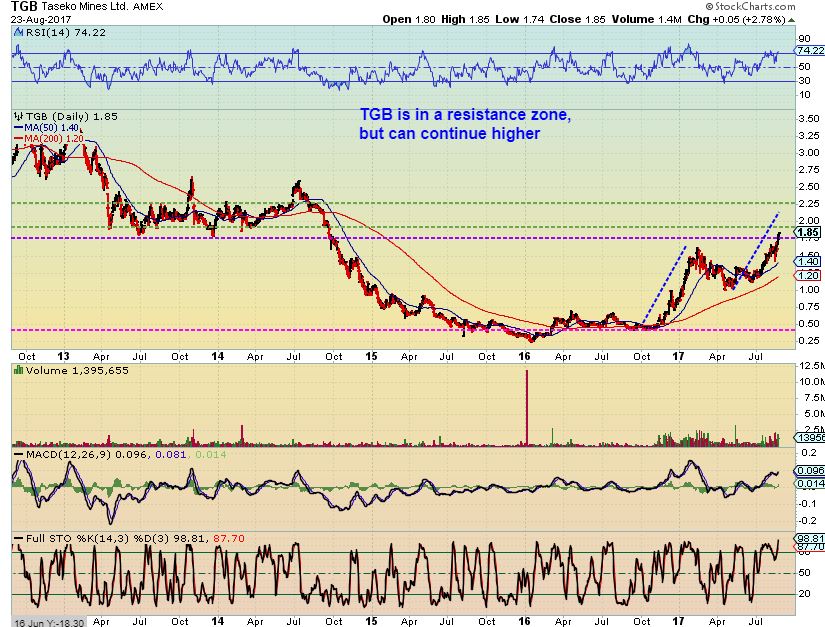
TGB – I posted this earlier this week as a ‘BUY’ now or ‘BUY the break higher’. I bought this, after showing a chart of Copper running higher. I have owned this several times, and make good gains when it gets running.
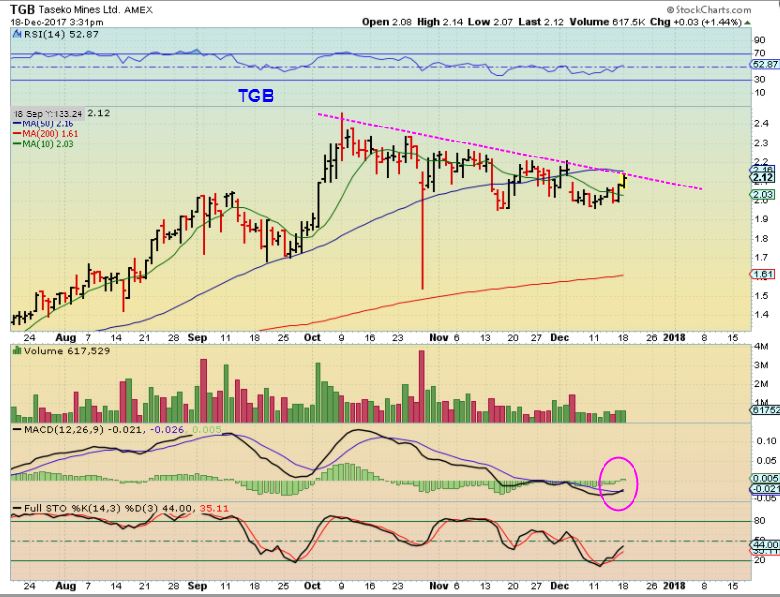
TGB UPDATE – It broke out yesterday, this is a buy.
TGB – And this is my reason why (older chart). It is now back at $2.40 and this has been a great recovery stock!
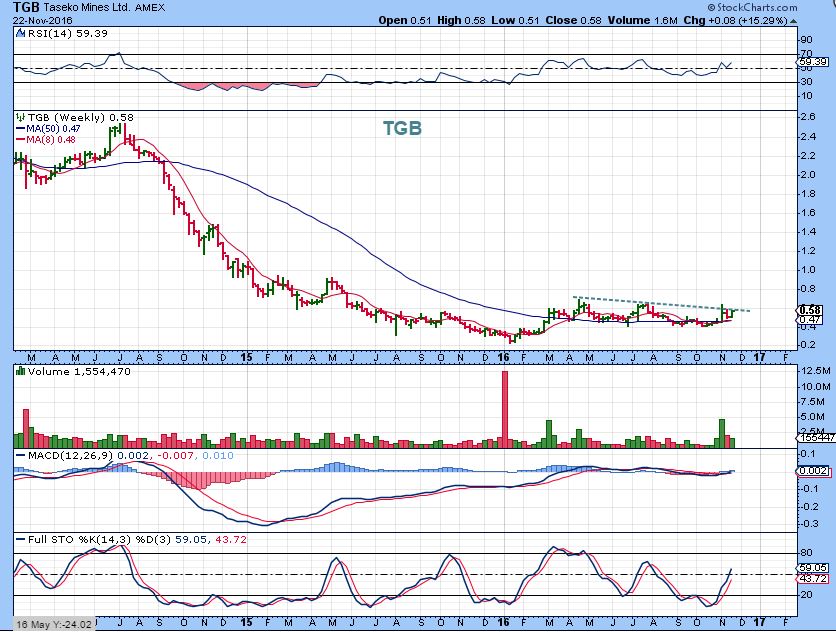
TGB – I knew that TGB would struggle for a bit in this $2 to $2.50 green resistance areaa, and that is why I sold it. I think that it is time to get back in, it is now at $2.40 and above that Green resistance zone.
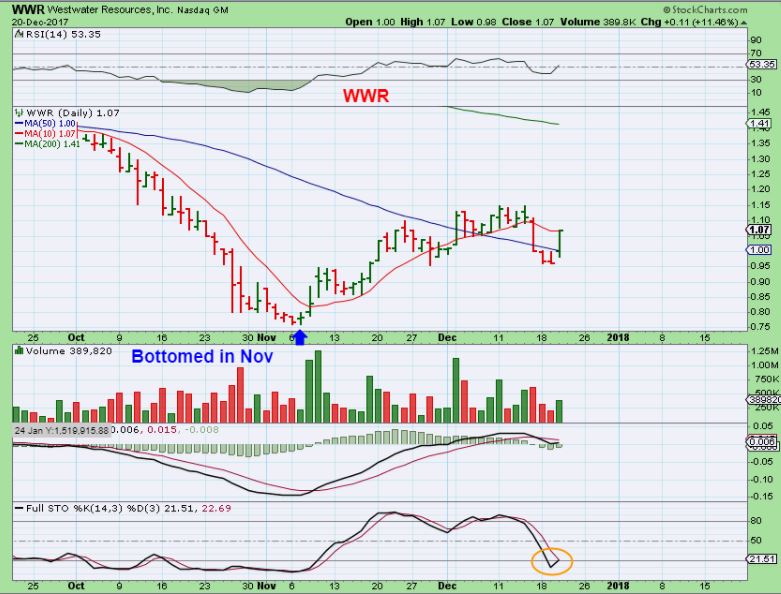
WWR – After bottoming in November, Westwater resources rallied back over $1. Then , in December, they announced that they are acquiring a Graphite Company, and the stock dropped sharply for 2 days. Actually, that is probably a smart purchase and I think that this company is ready to go again. I’m looking for follow through on yesterdays reversal.
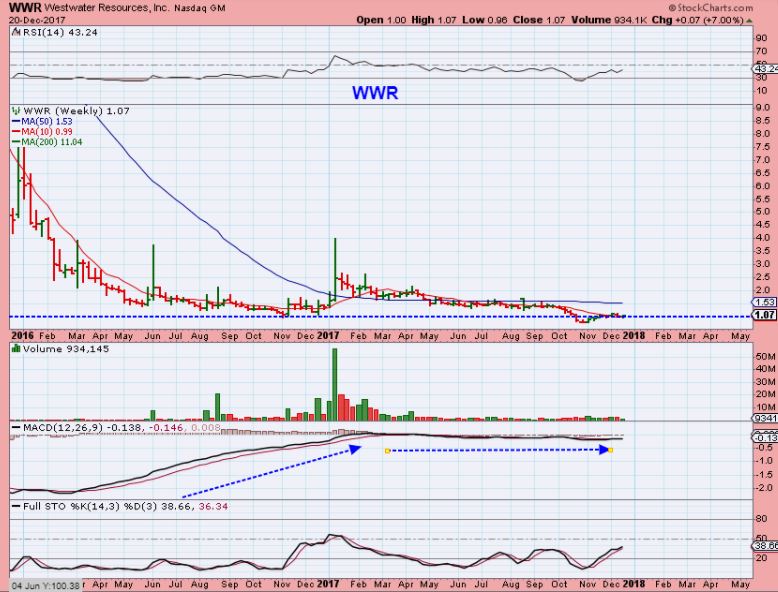
WWR WEKLY – Long base and a possible shake out on the news of their new purchase.
So there we have a summary of GDX, GDXJ and a look back at the move out of 2016 lows. For many miners, that was a time of ‘Melting Up’, and currently we are seeing some Miners burn right through the 50sma and on to the 200sma. Will we experience another slow melt up? Time will tell, but it does seem that we have the lows in place and have started the next run higher. We do not have a confirmed ICL in Gold, but we certainly have a confirmed DCL, and the follow through does not seem to indicate that this will be a left translated daily cycle. THAT leads me to believe that the ICL should be in place. The COT also greatly improved.
Above we also have a few Tech, Metals, and Miners set ups that look Bullish. Some are short term trades, and can be bought and watched, others are even longer term trades or investments, and I base that on how they have been acting all year.


I love the new format! Even though it wasn’t by sectors found it really easy to go thru the material. (and yes go back to find out more about a stock that’s all ready on the radar). Thanks CF!!
Wasn’t sure if it’d be better or distracting not being put together by ‘sector’ – I figured some would like it and others would prefer each sector. I’m still not sure How I felt about it after looking at it.
I like it, thanks!
That is a beautifully presented list of gifts. Time to put some in my basket!
Me too – and cut some of my others 🙂
I’m hoping that things get moving .. and not just my stock account— came down with a bad case of bacterial bronchitis before Thanksgiving, then tripped over a 3-year-old during a dance party after a Christmas concert rehersal – fell broke my right wrist…..
Surgery was yesterday… am in great spirits and so thankful it was only my wrist ….. thanks CF and everyone here for the entertainment and advice!
Oh wow, Crystal….hope you mend up quickly!!
That’s weird- we pretty much wrote the same words 🙂
WOW! That sounds like a bot of a rough stretch, glad ur on the mend!!
https://uploads.disquscdn.com/images/981fd551c36df3f78f64650167674fb0ceeadc2a5d255c8f727d85c7f864f695.png
SpeedRecoveryGirlfriend 🙂
Thanks – love the window box and the cute cap… but where’s the elf-get up? In the wash?
Hope things improve for you on the medical front…you sound in good spirits despite all, so continue to have a Merry Christmas Season.
Thanks Nancy – it is a silver lining to have no pressure to shop, cook, decorate, wrap, entertain, etc. etc. I just get to rest and count my blessings!
Take advantage!
Do you have a cast? Get some red and green markers and have everyone sign it….it will remind everyone to take good care of you and spread holiday cheer!
Indeed, though am thinking of having a unicorn in sequins 😉
LOL – I see they handed out some Pain Meds with the surgery? 🙂
J/K
Thanks for the reminder on the possible melt up, not letting people waiting for pullbacks to get on board. I am pretty heavy into miners but would like to add, while we are already up I will tae your advice and only add smaller amounts, then add larger amounts if we do get a pullback. So far, so good.
Same here, we could get a melt up to the 200sma on GDX, GDXJ, and then if it breaks out from there, it is probably a melt up situation. More often that not – we can break the 50sma, run tot he 200sma, then drop back to the 50sma as support and a buy
Good morning, Alex –
TOS is showing that the 50day on GDX is at 22.62 instead of Stockcharts’ 22.46
Does that make much difference? (since that would mean GDX didn’t close above the 50day?)
I tried another charting service and got what you got- so that is less impressive, but is well above the 50sma – so it remains valid and stronger than usual in my opinion.
Although only here for few days, it is very exciting here. The list is my x’mas gift, thamk you
Hey Roger –
it’s been nice to have you with us too. I am usually here in the morning, and in the afternoon may break away for lunch & come back and catch up on comments.
Therefore – I dont reply or comment to them all, but I try to read them all, and we appreciate your input too.
I find the comments section here to be another set of eyes, because some will suddenly say ” What is up with AUY” or : “Take a look at MUX” and it gives you additional input during the trading hours
What a great menu of choices!….I wish I had more available $!
Ditto!
IPI might be feeling neglected of some CF attention
Yes, it looks like it may be setting up for some upside movement out of the recent sideways move
That 6 month chart looks really good ( Price above the 50sma).
Good heads up- thx
Alex, do you think IPI will be above $4.63? I’ve built up a position last couple of weeks.
Over time, yes
thanks, Alex
I showed some attention to IPI this am. And so far so good…thx for the great heads up…so focused on miners forgot about this one!
NAK put out info this am:
has finalized documentation and will file for a US Clean Water Act 404 permit with the US Army Corps of Engineers on Friday, December 22, thereby initiating federal and state permitting for the Pebble Project under the National Environmental Policy Act (“NEPA”).
“At the outset of 2017, we established three ambitious corporate objectives for Northern Dynasty and the Pebble Project,” said Northern Dynasty President & CEO Ron Thiessen. “We committed to reaching a resolution with the US Environmental Protection Agency (“EPA”) to restore the Pebble Project to normal course permitting, to re-partnering on the Pebble Project and to initiating permitting under NEPA. As we approach the end of the year, I’m proud to report that we will hit our mark on all three important milestones.”
Really well done, Alex!
Thx Peter. – appreciate it
OWCP…gets ok in Israel for next stage test in 2018 for its sublingual med mj delivery pill system.
it’s up 🙂
If it gets going & can break above that 10sma, I know a few here will be happy about that
Alex, would you go to full miner positions once the IC trend line is broken on GLD? Until then, be ready to add on a pull back?
Yes, I’m pretty much waiting for Gold to show some strength, I ‘d like to get confirmation of an ICL, and not just a DCL.
Problem is, if you wait too long, with the MIners forging ahead, you risk losing an entry- so as long as I have a decent chunk now, I’m ok. I can always load up at the next dcl
Love this report, love the format and love your work:) What a nice Christmas present:) Thank you, CF.
Thanks You Kathleen 🙂
NSRPF getting clobbered
I have no news as to why. The size of the blocks makes it seem like a purposeful smack down.
Here it is
https://www.marketwatch.com/story/novo-provides-exploration-update-from-purdys-reward-2017-12-21
I might have to stay away from NSRPF, too news driven. Bob Moriarty is correct, it´s hard to drill holes for terrain that is nuggety. I think they could mitigate some of the volatility if they just got to work mining gold and let the averages tell the story.
Wash-Rinse -Repeat.
Stopped out of CDE. If 10 day holds will buy back. Maybe a fake out.
CBWTF nice CF – I don’t own it, too long other MJ’s!!
KNDI very nice open, I might go after it if it holds up
NDEV you little rat….
AUMN running.
NAK 🙂
One of the most difficult Bull Rides I’ve ever been on
PYDS: here is why it ran up yesterday, stock offering at 2.55. seems like a lot of companies pump their SP before they do this. holding pretty good at 2.9ish, that’s a good sign, at least for now
NXTD: another crypto play, on a strong 5 day run and now halted
MUX looking pretty sweet, tried to go down this morning and got scooped up. It seems like that gap at $2.40 should get filled in short order. http://schrts.co/jjwk1R
LTEA: long island iced tea, is another blockchain bandwagoner. up 195%
Every time I look at MYMMF it’s going up. Crazy.
I had to stop looking, I think I sold it near $2 Lol
Thank you CF! Have a great Christmas =)
Saw this mentioned on CNBC while exercising yesterday but saw little else about it. Possibly responsible for bitcoin/blockchain reaction yesterday.
http://www.independent.co.uk/news/business/news/bitcoin-latest-updates-north-korea-south-youbit-exchange-hack-cryptocurrency-a8121781.html
these hacks happen almost daily, it is the nature of the beast in the crypto world. the primary reason bitcoin is down this week is due to the addition of BCH to GDAX. this is just another sign the beginning rotation from the 800lb gorilla (BC) into alt coins is here. look at the moves in ETH, LTC, XRP, DASH, IOTA for example over the last couple of months, not to mention the smaller altcoins like REDD, DOGE, LSK, REP…the gains here put measly 200-300% penny stock moves to shame. cryptocurrencies are here to stay even as wall street big wigs talk crap about them and gov’ts around the world begin to try and regulate them (some are even trying to ban them, reminds me of prohibition and you know how that turned out). our IRS has ruled that BC is a “property”, not a currency, and will be taxed as such. can you imagine how much tax money could be collected on these types of incredible gains? staggering, would drawf legalized MJ tax collection. anyway, i apologize for the rambling and lengthy post, i will return to stocks now
That’s alright, I love passion!
AG came back to kiss the 200 MA. Is it a buy/add here? http://schrts.co/Egp2Gc
I plan on adding. Missed it today but likely tomorrow, pending price action in PMs.
Added CDE back with stop under today’s low. Stop was too tight.
I see CDE came back to test the 10 day MA too.
Alex do you see that this could be a 1/2 cycle right now for miners?
Sorry, I’m not sure I really understand the question.
If a cycle is 30 days long, we are not 1/2 way through yet if you mean Gold or Miners
https://uploads.disquscdn.com/images/0882ead7d95e6730aab9eef5c1e954408cdbe7059372625b76a1a4d4917ccba2.jpg
Thanks Rob!
Today COULD be the 1/2 cycle low for a few miners such as CDE and ABX. A day 10 touch of of the 10 sma for CDE gaining energy to charge through the 50sma. Thats a target of 8.40 for CDE which would fill the gap that was made in October??? I’m just thinking out loud here.
XBI alert: may have put us to sleep, including me, but it’s flirting with a potential close above the 50 sma. If so, could be a good LABU opportunity.
I think that CBIS is a buy on this break out
HBM was a buy the other day with TGB. It is steadily climbing day by day. Probably forming a cup
FCX did this – and never stopped !
I picked some HBM warrants yesterday. They expire July 2018. More of a lottery type play. I did NOT go heavy in them.
I like the company and the chart
I think you mentioned that the weekly is forming a cup and handle. Target would be around $13.
On a 5 yr weekly chart – It looks like a small cup and handle formed in the handle of a larger Cup and handle 🙂
Is this pattern valid in TA?
https://uploads.disquscdn.com/images/460de6b98de24afb7e6b312282d96fd61980d924bad31b365f66cc73abad42d9.jpg
It could be.
I dont know about price projection wise, but it is a bullish set up, moving higher out of the 2016 lows and now that cup & handle along that downtrend line. If it breaks out above that, it should do a nice run over time.
Thx. If anyone picked it up in January 2016, and is still holding they are a genus. 🙂
We bought it here, but who could ride that drop in Jan to July of this year? $9 down to $4.50
Not genius – they’re in a coma 🙂
hahah. yes. A lot of that is just fantasy. isnt it?
Yeah, it gets crazy=- Check out X
if you could buy & hold from Jan 2016 to now = Awesome, but WHAT A RIDE ;- t
Only STLD seems to have been easier to hold through the years
we have those a lot here in CFland….
*speakn4myself of course
*snicker
Some of my shares are from April 2016. I liked the company and added along the way…it is a bright green spot in my acct. Some was tough to ride, but it has been good….places to add.
I already have it. should I buy more?
It depends on how heavy you want to be in it or not. Maybe you have enough.
I see it as breaking out from a flag / above a downtrend line & the 200sma, and it was overold, so it should keep moving higher.
Alex. I sold NSRPF a while back before the initial drop at 4.55. With this large drop today do you think its a buy back? Also I am still in CRMD. Does that have potential?
NSRPF is overbought after that bounce & is in a heavy volume sell off. I would watch it at the 200sma. See if that holds for support, because this used to be the one every one wanted- and right now with Miners moving higher, it is selling off.
CRMD is consolidating, seems rather neutral, but could break higher
Just scrolled through my ENERGY stocks- Man they look good.
AREX, NOG, SN,
WPX & RES breaking out.
BWEN, ERF, WTI, etc – Energy starting to look good again. Puzzling.
DQ KNDI JNUG
lmao
ahhhhhh , I was basically talking about ENERGY moving higher, while expecting that sector to drop.
yea… i was just thinking out loud.. unrelated…sorry…
who or what is MICT…dang
Alex….what do you think of IMLFF here? Thanks!
Tought call really.
It looks a bit too extended to be considered low risk, since you could buy it and watch it drop to the 50sma, but yes- it also can go higher.
If I already owned it I might add, but I don’t know if I would personally start a position here
Thanks! I don’t own, just been keeping eye on…
Alex…..also, what about POTN? It looks like it could be wanting to break out of a longish kind of triangle thingy…?
Could be
GOLD just hanging around again, and Miners moving higher. Nice
Yes, very positive. Although the volume is low, I like how GDX is rising from that 50sma
Excellent charts, CF! The menu of choices is incredible right now. I don’t even have any spare cash to add to my CBWTF
Should I sell MYMMF? I’m up 46% on it.
lol … u have chartfreakItis….
*Im up 45% ,,, lol ….
You’re asking that guy that sold it around 42 to buy it back later – lol.
It is extended, but apparently that doesn’t mean i cant go higher. I always sell some when it gets over extended, just to lock in some gains and let some ride.
EXK – another blast from the past that went from about $1-$6 – could it be setting up too?
EXK. I’m in it to win it!
Hopefully the 40-60k share dumps are over with Novo..
MUX is +3.70% today. It is one of the leaders of this (hopefully it’s in) IC
It´s also about to trigger a long term buy signal (monthly moving average cross to upside). n´t suggest anything for the short term one way or the other, but it becomes a hold for several months at a minimum.
VERI looks great here….
Veri interesting 🙂
Still in MBOT at break even. Man that thing will bore you to tears.
MBOT=SUX
B2G was a leader going into this gold bull and now just putting in a flag for 6 days
CLD finally breaking up! Same with many energy
Tempted to add SWN today.. Triple bottom bounce
THAT looks really good, and I think it is Coal? Coal ash? something, I’ll have to look it up. Good catch – nice sideways cup like move.
IPI Wow…
and NSRPF – WOW
RON called out IPI in pre-market down below , and I dont even think it was higher yet 🙂
days ago, it’s not an easy ride. I lost half of my position. my cost $3.78
Much more volume in JNUG than GDXJ again today so far. 🙂
ALEX should i sell CBWTF canibis wheaton now?
Hey Robert –
If you want to lock in gains, you should sell.
Can It go higher? Yes. Can it drop? yes
it may do what MYMMF did- it may do what ATTBF is doing.
There is no way of knowing, so you have to decide what you want to do with your money
RDUS waiting for this to break up… Flaggin on the daily tight wound under the 50… This wants higher
Just added RDUS, stop 28.50 PT 1 of 34
dang.. AREX…
Thats what I was lamenting- Energy stocks are really looking good again.
Nog looks excellent, AREX looks ready, etc
I stepped out ofr a walk, and now notice NSRPF traded as low as $2.78??!!
Just about tagged that 200sma
was that your target?
originally, but I’m not sure what it is doing here with that high volume selling. I need to see it hold up better now.
How are you going to play it?
I dont know if I want to
IMGN finally
can we load GROW here?
Look on a weekly chart at the 10 ma. I’d say it may go there
I don’t usually do this I like to trade the charts (and I should have paid $1.00 yesterday but had to sell something today to make room) BUT I took a look at the CBWTF press release that is stoking this run….here is my q&d
company will be producing 200 million grams ANNUALLY from the new joint venture facility they are building, 49% partnership
that means right now the company is trading at around a $2 per gram produced – annually I stress.
That sounds way too cheap. Compare to Canopy with $3bb market cap.
I am not looking to day trade, this will be buy and hold for $10 plus in a few months.
hope it helps. Long at $1.17 Thanks CF for the referral
Nice- Thx for this.
Alex I just have to thank you. When you posted your “gut feeling “ about miners the other day…I think it was on the weekend report, I jumped on JNUG in pre market Monday and have have been holding and will continue to hold till something changes. My account has NEVER seen such an increase in value in such a short period. I thank you and I’m glad you jumped back in also.
yep, this is the best site online for making money with big swing trades….IMO….
just think a lot of the gold community writers are waiting for a lower low…may not happen…if it doesn’t many will be rushing in later.
That’s great Kenny – As a reminder though, a pull back to the 50sma could feel uncomfortable too.
If the ICL is in place, JNUG will go higher over time, and probably a lot, but just so you know- riding it can get a bit nerve wracking. Its a strong trading vehicle though, glad you made some good gains!
Man, and this been pretty mild. Just think when 15-20% JNUG days pour in. Then you’ll really be making a haul. Whoo!!
GDX working above the 200 day MA now.
CNAB breaking out
NDEV looks like a test of the 10dma…I am long, swing target $1.40
CNAB and CNBX looked similar to me a mot=nth or so ago, so I bought CNBX.
CNAB just keeps running, CNBX runs, drifts, runs, drifts. A tad boring for now.
CNAB does look nice
I own both, agree CNBX price action is eh…..but still think an MJ rally in early 2018 is in the cards, and raise all boats….CNBX too I hope!
FFMGF is another one that came back and tested the 10 and 50 day MA´s and held, now starting back up. http://schrts.co/ekvooa
more on CBWTF……the market looks like it is around $7 per gram….works out to sales of $700mn for CB’s share…..10x sales = $7bn =$20 per share……….those are the numbers. I am buying more if it tests the $1.00 breakout
Well it was $1.15 when I left for lunch, and its $1.20 now, so you keep talking it up – its working great! 🙂
Actually, that’s good info , thanks for sharing! good stuff. .
It may be a bit extend for me to recommend that anyone buy now, those are some big gains in the last 3 days, but the weekly chart, unbelievably, is still over sold. on the stochastics.
yeah i agree it can pull back to the $1.00 breakout – but I am playing it for the big numbers – can’t believe what I am reading…..anyway all good, thanks again for the heads up
OK, I went away at lunch and when I came back, I was logged off the page. When I sign back in I see 136 comments, and I cant tell what I read or didnt 🙂 So I will just answer the most recent ones. Sorry about that.
Then I may run out again.
Cf, when u have a sec… would u call RDUS a buy now if it closes here?
I already added it lol
but wanted your head nod
It looks good and the MACD is in a good set up. Could use more volume, but looks like it wants to break out.
I liked CLD too.
Overnight… I jumped on XRP (Ripple crypto, XRPUSD) and made 25% on the trade. It hit my stretch sell limit, I reloaded as it corrected.
It remains strong and I’m going to just HODL for a good while.
I saw Ripple last night. Very nice move recently
Actually- I got a txt from a friend that owns it 🙂
hi JT – what exchange did you buy XRP on? Thx! nice trade!
I’m on Binance.. because it was the only way to buy IOTA at the time.
thanks, just signed up.
good position JT, rumor is XRP will be making partnership(s) announcement soon. also, could be the next coin to make GDAX. LTC rumor: AMZN will start accepting for payment.
Yes the list of banks is impressive. The price action is also telling, no correction whatsoever after tripling. Best moonshot candidate in the near-term
Again, what is up with Energy. WTI, PDS, DNR, AREX, CPE, QEP, etc etc – Many more —all look good, and look to be breaking out or ready too.
i am not convinced until these little guys take out the early november highs that a lot of them made then. oil has defined a lot of the skeptics by not pulling back from the late november high. the powers that be are doing their best to confuse us. OIH, XOP and XLE sure look good this week
OIH smashing through the 200 MA to the upside. Seems most commodity stocks doing well, perhaps inflation is around the corner?
http://schrts.co/7zJbQ8
ARTTF also getting nailed with the drill results it looks like.
Absolutely MINIMAL volume in GDX GDXJ
So that’s not to good for higher prices, is it? Tight stop? Sell? You’re take on it?
https://globenewswire.com/news-release/2017/12/21/1268664/0/en/Cannabis-Wheaton-Income-Corp-Announces-New-Joint-Venture-for-Development-of-World-s-Largest-Indoor-Cannabis-Facility-with-Licensed-Producer-Partner-FV-Pharma-Inc.html
CBWTF release…..
Is UNG oversold enough to buy?
Fleece Navidad bitcoin.
lol, good one!
Shout out to RonB! $IPI shaking a leg today…lots of crops to fertilize apparently. 🙂
Poo, I just recently sold it out if boredom. And desire to buy miners.
I am seeing CBWTF as halted on the Canadian side. Just a heads up.
ALTR, NMRK, CASA, AQ are IPOs I think are undervalued and could run with Santa:)
yes was just about to post. halted it looks. hope it opens at $5.00 manana
trading halt confirmed 253 EDT on CBWTF
“At the request of the Company pending news”
Hi Alex – I’ve been gone all day and just found your reply to beginning of day comment on GDX’s 50-day MA – Thanks!
fwiw, here’s a picture of daily chart of GDX –
thin redline is 50day, currently at 22.61
the blue line connects the bottoms of Dec. ’16 and July ’17
the mustard line is bottom of interior channel dating back to Aug. ’15
https://uploads.disquscdn.com/images/9382fd7413ae479e98b6fe1467f1f1d6e9547d57da7ae1b8e45ae9b192de34bc.png
GRVY is a low float play that might have that look about it
GLD moving up, USD moving down and GDX/GDXJ moving sideways
TWMJF close above 17.08 is a new all time high close…….
Someone bought CANN yesterday and said that it bounced right off of a trend line.
Congrats on THAT grab
that was me CF 🙂
what happened last 10 minutes …whoa! is this the beginning of this sector meltup? everything was popping today after an eh day yesterday
Yes, they were, I was watching GRNH, CBIS, TRTC<, GBLX, CANN, and more.
Even AMMJ added a couple of pennies for me , to give me faith that tomorrow she breaks out 🙂
yeah and CNBX even a single penny….
I am hearing out of Canada that the late day run is being blamed on a nefarious internet poster CANNABER who has been mercilessly touting CBWTF forcing the trading system to break down…….
I blame it on ROB, the guy posting above. he’s from Canada, aye?
aye ( or as Canadians spell it …eh)
Whaaaaat? Geddy never told me that – interesting
Serious? It’s definitely “eh”, eh, ya hoser.
Can we get 1 BESIDES CANN to do that, please? Preferably, 1 that I own? 😛
I actually thought that it was you.
I didn’t see a trend line to buy, but I saw that reversal after you posted it and today had excellent follow through & volume. That was ra nice buy- congrats 🙂
thumbs up – your call to get in the first time!
Yeah, thats twice you played that one, right? Its got your number on it.
#PlayItLikeAFiddle
CLF…
Yes, I saw that too. CLF, SID, CLD, X, AKS, VALE, HBM, MDR, even WKGS – commodities catching fire here lately
Alex, did you pick anything up today?
no
I picked up some GOLD.V at the 15sma, hoping that it would bounce, but it blew right through it to the downside. I cut it loose. I suspect I will regret it, but I was kind of hoping to catcha falling knife at that sma. I honoured my stop
Yeah, you have to honor ( Or Honour ) your stops, you never know when they’ll save you, keep you from the Color ( or Colour) red =-)
yeah, better watch your neighbour ( or neighbor) too. 🙂
aks is doing ok https://uploads.disquscdn.com/images/d017df0e92205bb1ba7a416e7da465a4d4b69a0a1b5a775c62bb9783d73e8654.png
I have been lurking daily but have not posted for a long time. I thought you guys might find this interesting.
I just noticed that the P&F chart of GDXJ posted a “Bear Trap” signal today:
http://stockcharts.com/freecharts/pnf.php?c=gdxj,PHTADANRBO%5BPA%5D%5BD%5D%5BF1!3!!!2!20]&listNum=1
For those not into P&F charts, here is the definition of a “Bear Trap” signal:
“A bear trap is a triple bottom breakdown followed by a reversal after only one box is made in the triple bottom breakdown. The breakdown is possibly due to stop-loss orders or short orders being hit just below the support level, and the quick reversal suggests higher prices ahead.”
Personally, I’m pretty heavy in JNUG right now. I won’t say how heavy because I don’t want to scare the women and children. LOL
I would not be scared. Actually these days women are more brave. 🙂
last year, I heard one woman had 1M share NUGT LOL
I edited the post to remove that old saying, so as not offend anyone.
I’m not offended at all. 🙂 That is really an old saying. These days kids bought bitcoin to become millionaire.
thank for the info
Steve are you still full throttle on the QQQ going into 2018? I’m looking for an entry point…….maybe. thanks and Merry Christmas!
I have been riding TQQQ for a few weeks, was VERY heavy but have lightened up to a small position by my standards (10%) to lock in profits and because I think stocks may sell off into the end of the year like they did last year. But the big reason I sold most of my TQQQ was because I switched horses to JNUG last week on Fed day and I’m now VERY heavy in that. I think/hope JNUG will have a January run similar to last year when it tripled from late December to early February. I’m betting pretty heavy on that right now. I’m still VERY bullish on stocks medium to long term, I think we are in a long term bull market in stocks similar to the 1980’s. If you are looking for a good entry point for QQQ/TQQQ a tag of the 10 day SMA would be good, lower is better of course, but dips have been shallow lately.
Thank you Steve. Yesterday during premarket, I noticed what may (or may not) be one of the “signaling” lower shadows that you mentioned a while back. It reached down to 16.29. Later, I saw at 9:40, the price dipped to 16.29 briefly and never returned there. I missed that dip but I will find one soon. Thank you for the QQQ info.
JNUG- Sorry, My image would not appear here. If you look at the 10 minute candles on Etrade its still there.
C.F., looks like the music has stopped for Bitcoin, at least for the time being. As usual, as soon as I decide to get in.
Is there any reason not to dump all Bitcoin/blockchain holdings heading into the long weekend? Thanks!
Alex, ditto what Cason said…I tried SRAX…how does that look to you now?
The Friday Report was posted