
Tuesday – Sharp Turns
In the U.S., Thursday is a Holiday and the markets will be closed, followed by a 1/2 day of trading on Friday. Usually many are traveling to be with family on Wednesday afternoon, so the markets volume & trading lightens up on Wednesday. That said, it is a bit hard to know exactly what to expect going forward, especially after Tuesdays trading. For now, lets take a look at Mondays trading, and review a couple of the ‘Changes’ that we discussed in the weekend report.
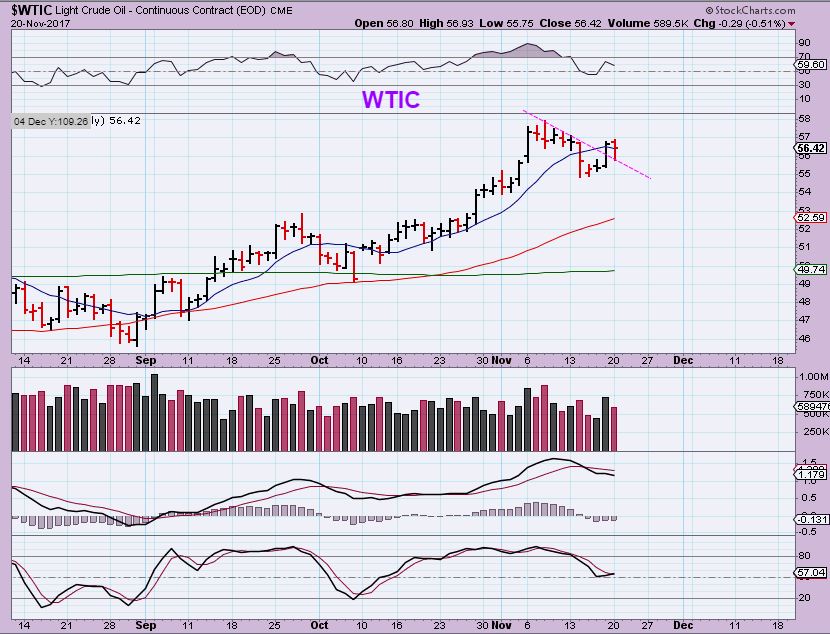
WTIC – Notice that Oil is still up near its recent highs, but…
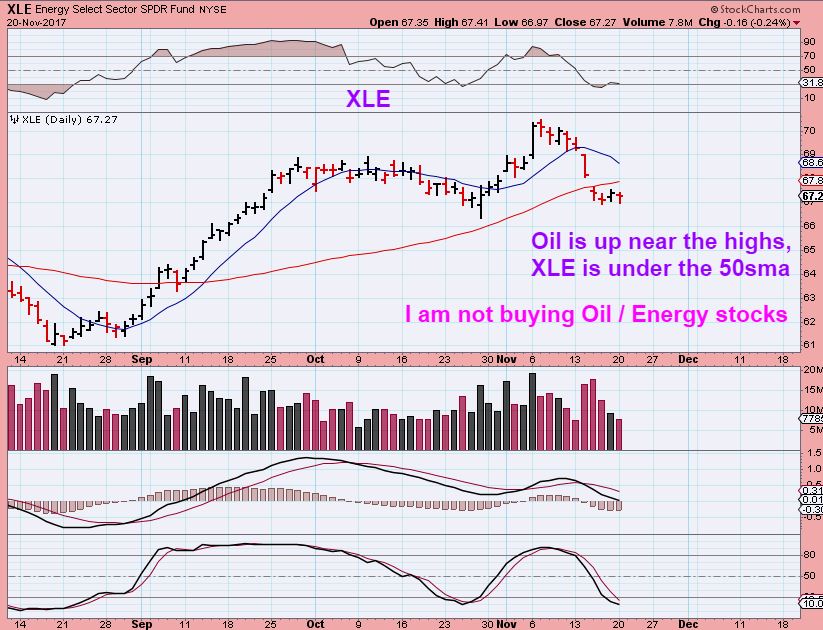
XLE – Recently The ENERGY stocks sold off rapidly, closed under the 50sma, and on Monday they also closed slightly red with Oil back near highs. I am not buying Energy stocks at this time, and I think that they are signaling that Oil will not stay at the highs. If Oil sells down, this could become a bear flag.
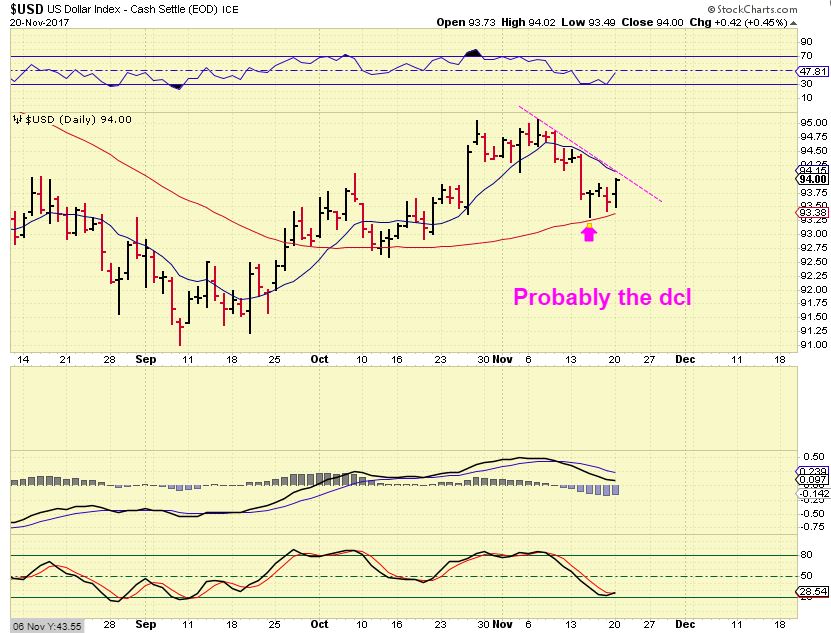
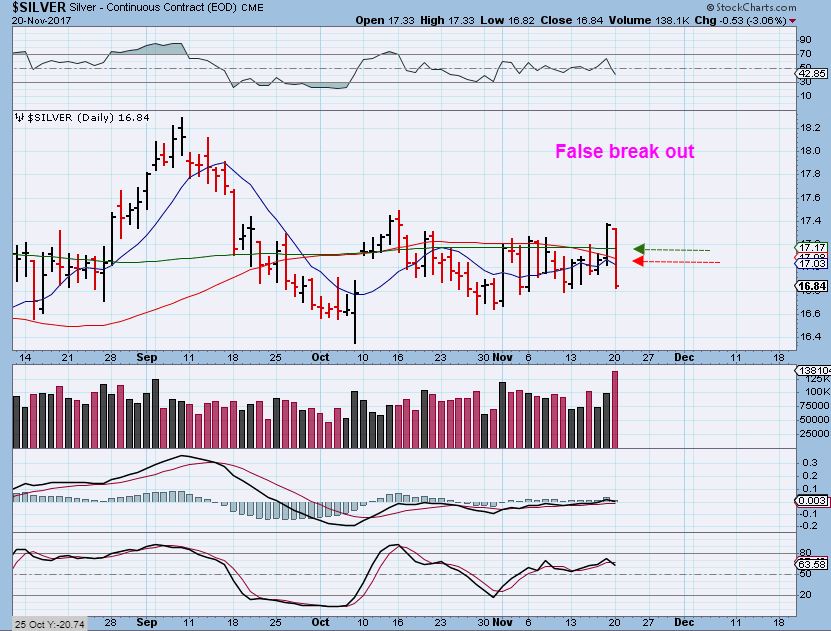
WE DISCUSSED THE USD, GOLD, SILVER, and the MINERS in the weekend report. Gold shot higher Friday, Miners broke out, and the USD was due for a dcl. Was it a false break out by the Precious Metals, with the USD within the timing for a DCL and expected to move higher? Or was something changing?
USD– The USD likely has its DCL in place and would be on day 3 here. Look for a break above the 10sma. So did this push higher in the USD affect Precious metals?
GOLD – See the chart, the break out over the 50sma was reversed. A possible Bull Trap
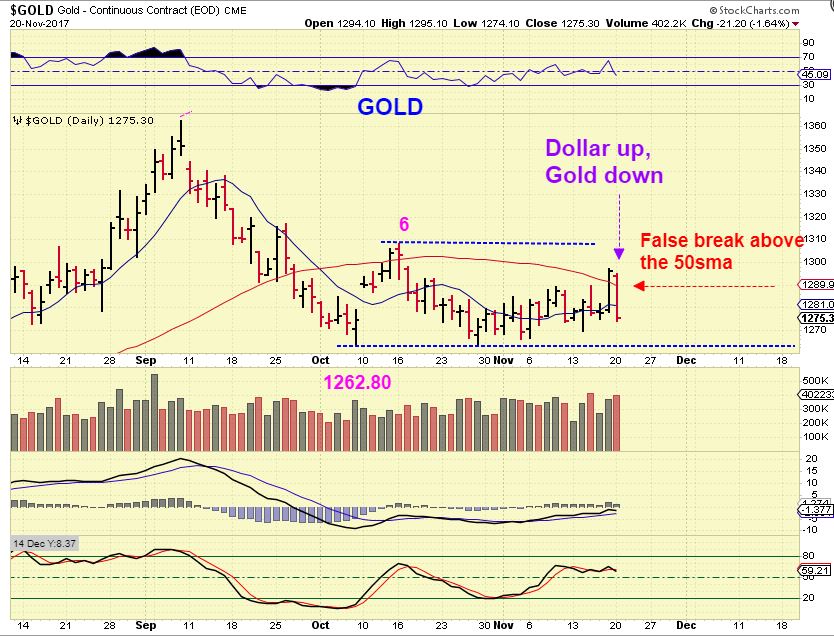
SILVER – It looked like a BULL TRAP, breaking above the 50 & 200sma, and on Monday Silver sold off with high volume.
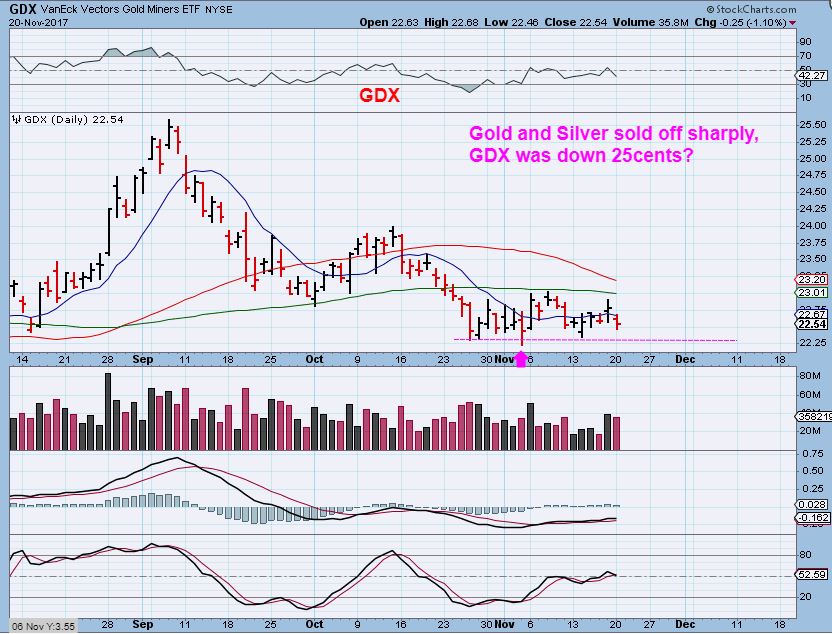
GDX – Miners did not drop as drastically with the Metals, but did close below the 10sma.
GDXJ – GDXJ had broken above a downtrend line, but gave it up on Monday.
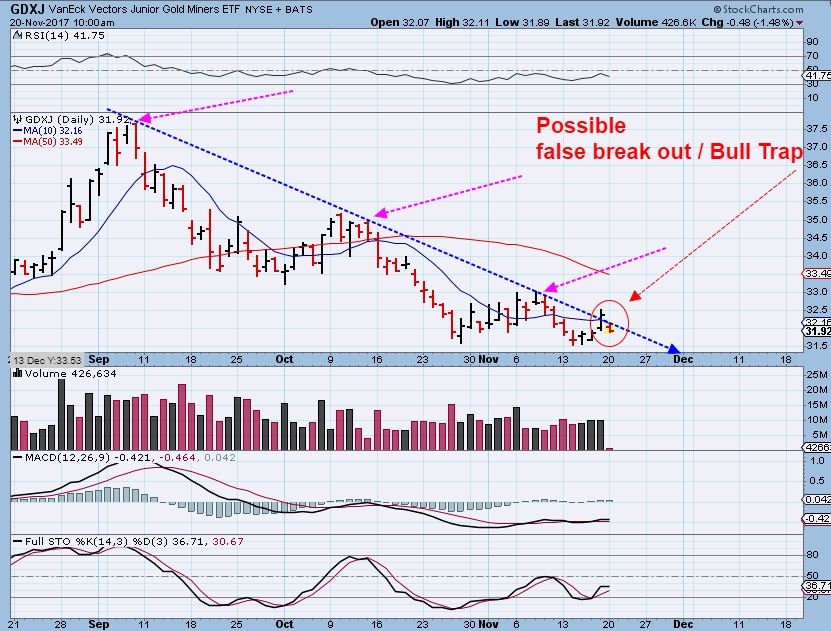
So in our weekend report, the changes that we saw did not make a lot of sense in many ways. We were either seeing a major character change, or a head fake / bull trap type move. At this point, considering cycle timing, it does appear that these were bull traps.
Let’s look at some of the other trades
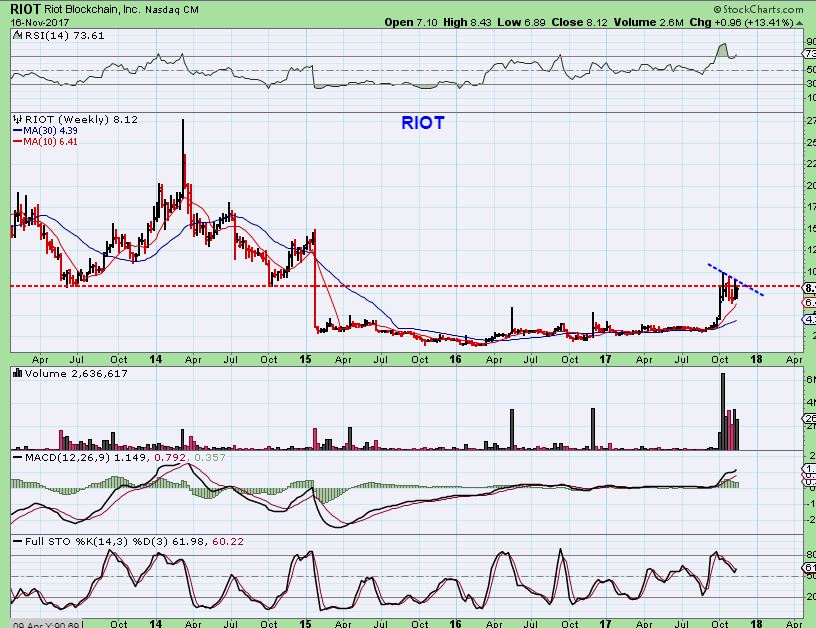
RIOT – I have traded this repeatedly, and warned that it does move like a Cheetah. FAST. I was looking for a break out here.
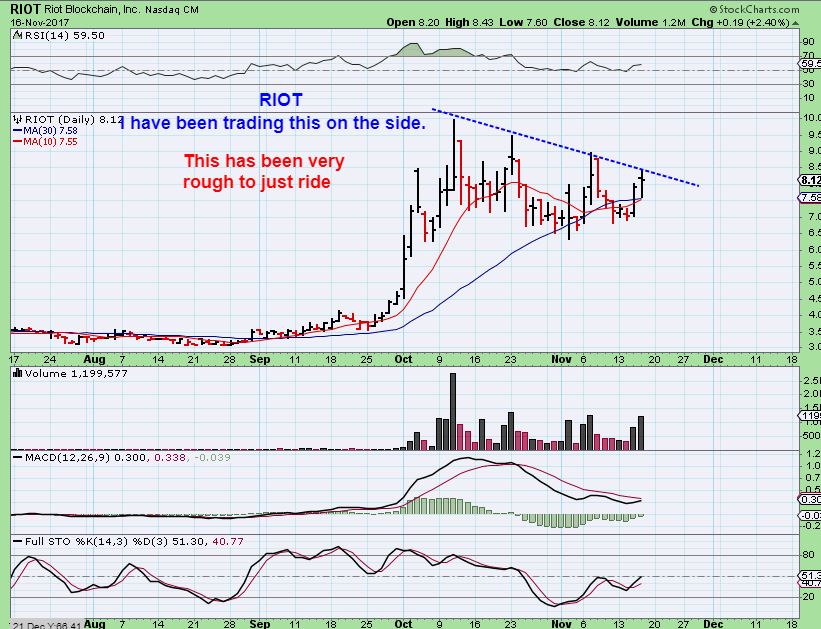
RIOT– I also pointed out the upside potential on the weekly chart if this breaks out & runs.
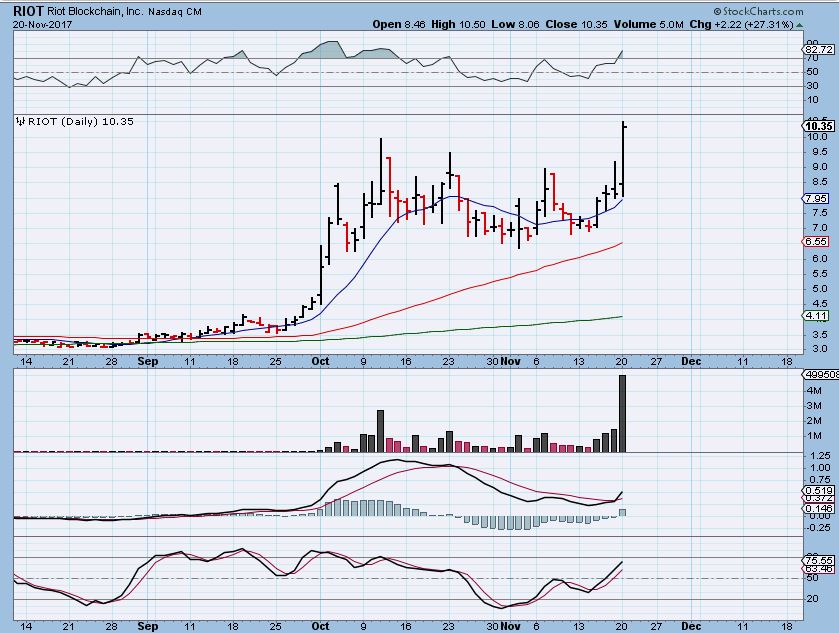
RIOT – It dropped down to $8.06 in the morning, and I mentioned that I was adding to my current position. Then RIOT shot up to $10.50 midday. This runs like a Cheetah! It closed up almost 30% today alone. That volume could indicate strong buying pressure that may have follow through. Congrats to those that bought it, I hope we get immediate follow through.
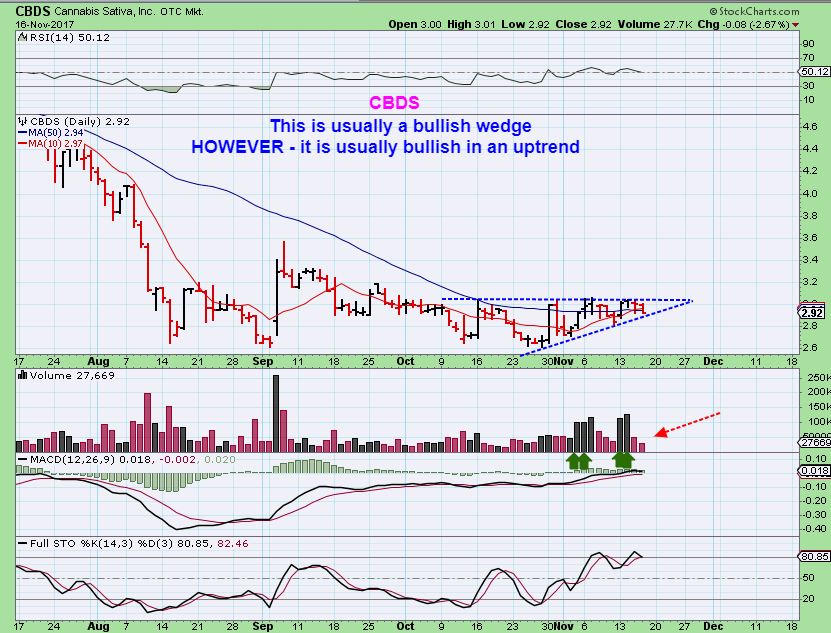
CBDS – I pointed this one out twice, saying that this pattern was bullish in up trends, and I like it, if it breaks higher – it is bullish. This sector has been acting bullishly.
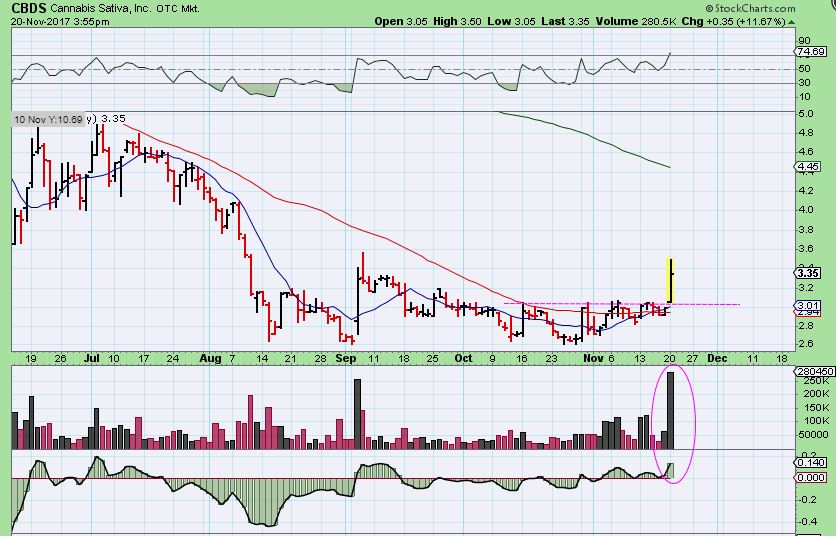
CBDS – And there we have our strong break out. It was up over 15% midday, and I think it has further to go. This sector has been smoking 🙂
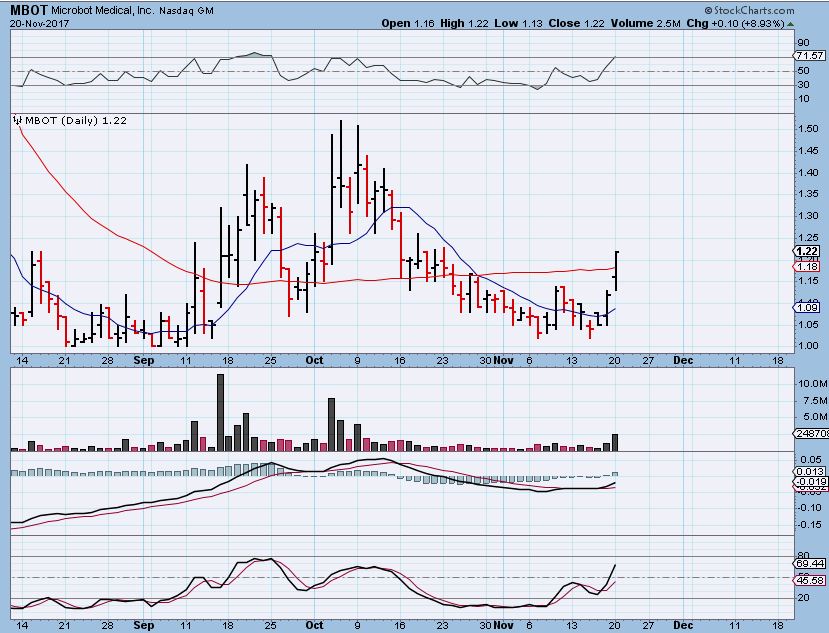
MBOT – MBOT got moving on Friday and we looked for (and got) Follow through on Monday.
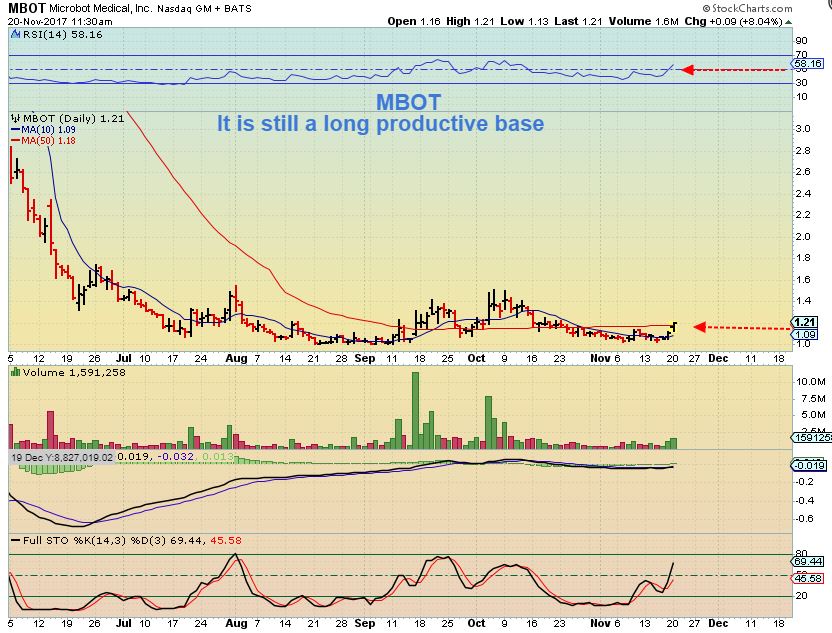
MBOT – This close up view shows that MBOT ran from $1 to $1.40 , and then $1.07 to $1.50+ in September. Those are BIG GAINS, and you may want to decide now if you will sell, or hold and hope for a break out & continuation this time. Scroll back up to the chart above this one, and you’ll see why it is hard to sell. It looks like it wants to run much higher to $3 if it gets going.
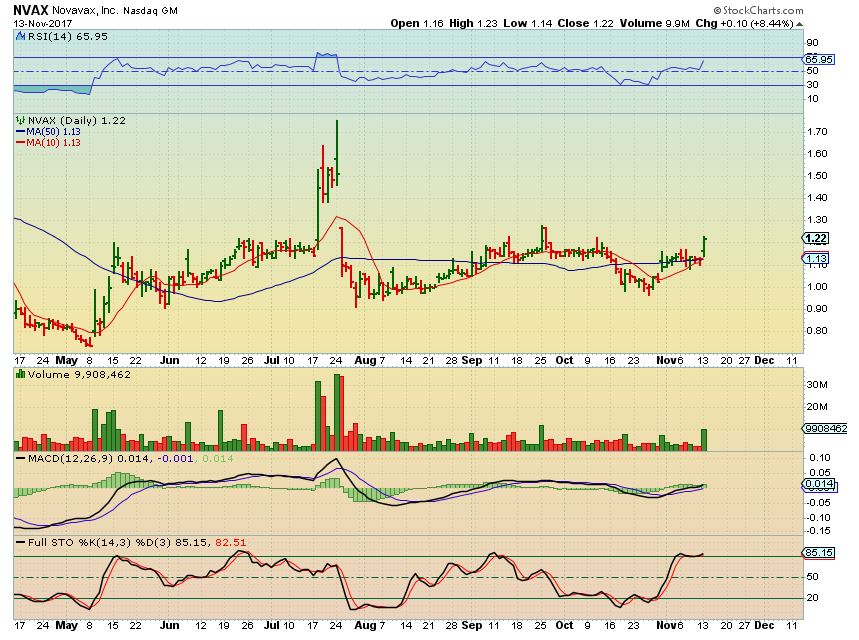
NVAX – Over a week ago I mentioned that a reader named Chuck ( who doesn’t post in our comments section – thx for the heads up) emailed about the heavy short position in NVAX. It started to break from a 2 week mini base above the 50sma. We would expect higher price after this POP. I used this chart on Nov 13.
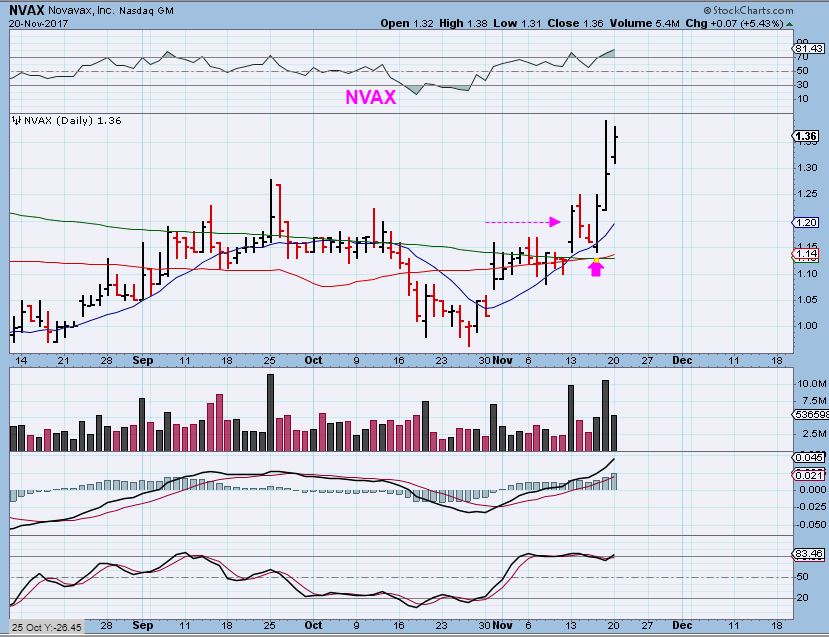
NVAX – After that POP ( Magenta arrow), it dropped for 2 days, but reversed on support last Thursday. It looks to be on its way higher again, hitting a high of $1.38 Monday. This is still heavily shorted, if you own it we do have higher expectations.
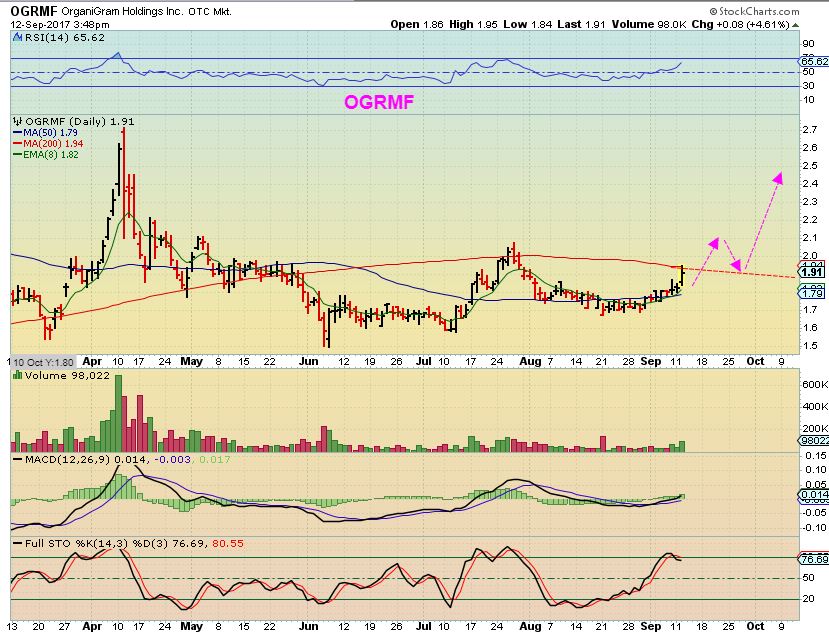
OGRMF – I was asked if I am still holding OGRMF, APHQF, SPRWF, & CNBX. Yes, I Sold MYMMF ( It did start higher again today), and I still like these charts and sector. Below was the break out in OGRMF.
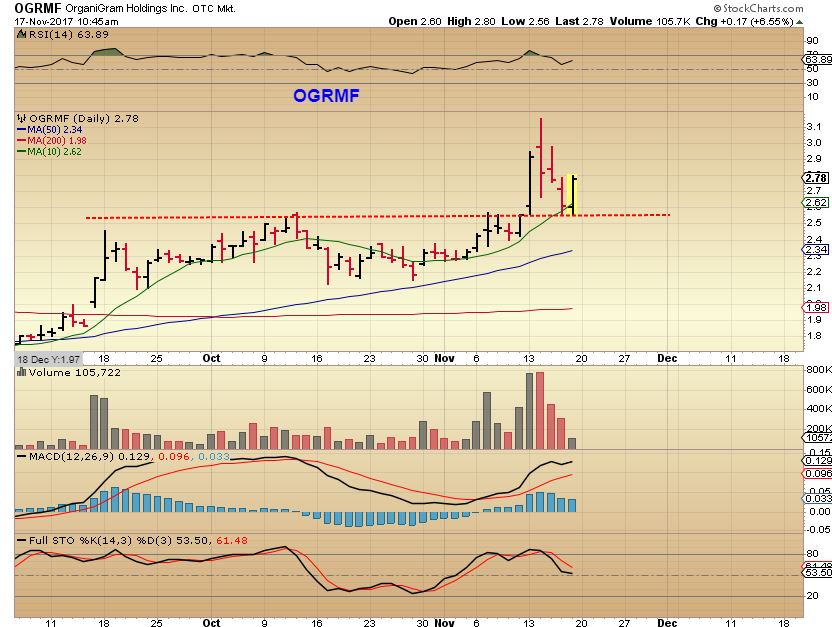
OGRMF – After running higher, it dropped to support and reversed on Friday. I still own it and it looks like more of a buy than a sell.
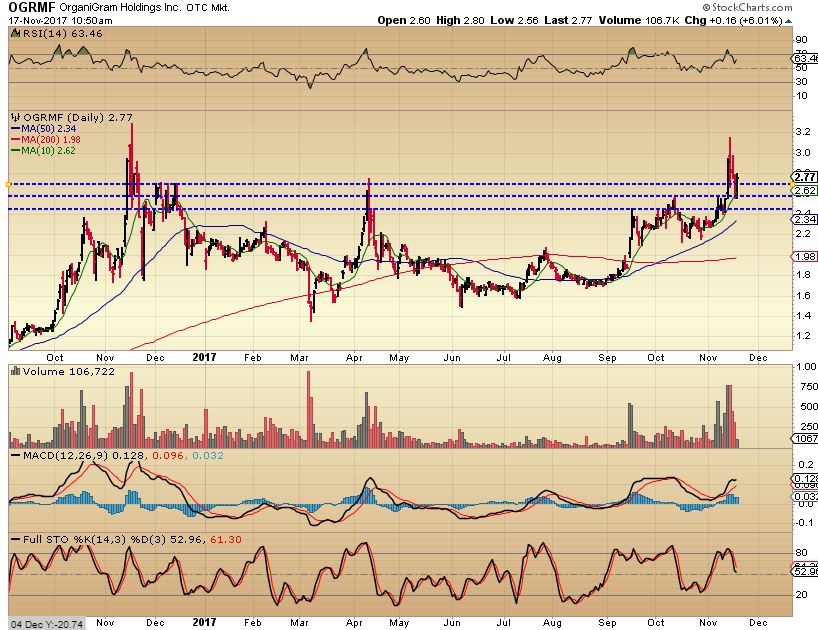
OGRMF – This is a bigger picture and it shows that it is just trying to break out, trending higher since June.
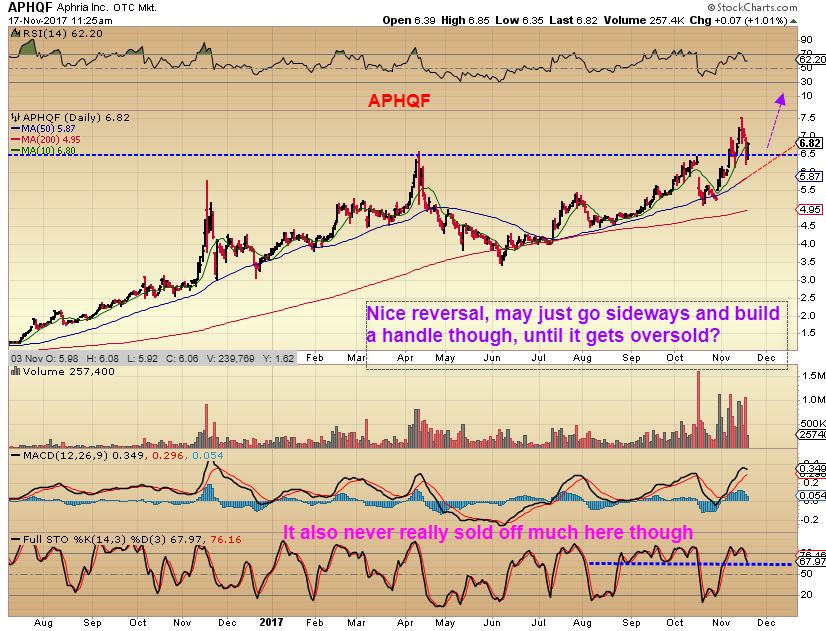
APHQF – This has been choppy, but it is also bullishly moving higher.
Again, it is a holiday week and trading will probably lighten up as the week goes on. The bias can be to the upside in the general markets, so we’ll just see how things go from here. The Precious Metals sector seems to have put in a false break out on Friday and reversed Monday, so we might expect more selling there and a bit higher price for the USD. Enjoy your Tuesday trading 🙂
.
~ALEX
.
On Monday, I mentioned in the comments section that I have been watching the Semiconductor sector with some expectations going forward. I’m sorry, I was going to share those today, but with all that happened in the Precious metals , Energy, and other trades in this report, I just ran out of time. 🙁 The things discussed in this report were a little more time sensitive and needed to be covered today. What I was going to point out about the Semis was less time sensitive. That information isn’t going to change anything if I put it in this report or the next one, it is longer term information. I will cover that in a report this week, most likely the next one.


Thanks Alex. I’m holding a small position in TNA and it seems to be going very well so far. I’m also thinking of Martin Zweig’s long ago commentary about holidays, which roughly equates to if there is an up day before a holiday, you will probably get another two days of up movement after the holiday.
Tes, it looks like a dcl ( Finally) after that long sideways correction in the small caps. It is believed that markets float higher or are rather directionless going into holidays. It has a bullish bias, unless we are in the middle of a heavy sell off. .
BLOCKCHAIN: I see RIOT at $11 pre-market 🙂 This could ‘Gap & Go’
delish….
TxCFSmch 😉
I spoke too soon, its at $10.50
#Jinxed
jinx
Ok, let me re-state that…
“Hey, RIOT is down a little bit premarket! At least we dont have to worry about it gapping open and having to fill that gap!” 🙂
imagine my surprise when my limit hit… i just saw “executed 10.25.. i was like HUH? that has to be a misprint… ha ha ha
Pre-market trade? Sell?
buy
This is one of the more difficult trades to ride that I can remember. I have traded it for a while now, and it still hasn’t settled down. Even yesterday it dropped to $8 and then shoots up to $10.50. Big swings.
well… it *appears* to be in a 4 consolidation… no? i entered *expecting* a 5th up to 14.70 ish… so its more of a swing… tho .. i have also DT around some pops/drops when i can…
NICE BUY MARIA
total accident… i had a higher limit set.. and prepared to pay MORE ……..hahah
watchn CLSN… see if it holds that gap…..
is it my imagination or does MARK want a taste of 15….
It’s your imagination 🙂
hahahah
*i do have an extraOrdinary one…..
#MewoW
i still cant take my eyes off that DaddyLongLegs off the 200 …. on MXWL
Speaking of running like a cheetah…
Cheetah Mobile is up $2 pre-market 🙂
nice …
ILikeCheetahs
**andGiraffes
VZ… gonna push thru that gap… or tip over…hmmmm
u jinxed it!! lol
Refresh : So this is how GOLD trades lately… Doesn’t it look like they are trying to remove long traders and short traders with these sudden slam downs and then surges higher. Definitely makes it hard to know what ‘direction’ Gold really wants to go in. This is a 2 hr chart, but it shows up in every time frame.
https://uploads.disquscdn.com/images/2ba70ec5c08a93ad72838d8bac46c06d4feabe74695ebaa7b45e37760360cad3.jpg
That reminds me, I came across an article examining how most of gold’s gains are made on a Friday. https://www.silverdoctors.com/gold/gold-news/tgif-almost-all-of-the-gold-price-gains-occur-on-fridays/
Bought a little rocket fuel (RIOT) here at the open. A VERY little. If it goes bad should only singe my eyebrows.
In the time it took me to type that, it’s up 15%. Holy crap.
I had a $14 target ( or more)
How do you determine that?
Volume & price projection
Perhaps in one of your weekend reports you could show how that’s done. Or if you have a link that details it out, I’ll read it.
I’d never heard of this one before.. and i’m not in it.
.. but looking back at a long term chart, it seems like a really clear EW ‘obeying’ stock.
and currently, it looks to be in a 3.iii.v wave… is Missy Elliott around to give a reading?
edited
*corrected that wave number
RIOT – Another 20% day so far
Real nice shootin´, Tex!
wild bronco….
BTSC is moving along with RIOT
Alex, what can you tell me about gaps? There’s a gap in TNA. Does it usually get filled the first day?
They vary. Look at TNA at the end of September. Filled a few days later, but they dont always
Thanks!
Gold looks like it wants to go back to 1290
Alex All the components of LABU are now in positive territory, is it time to re enter
It keeps batting it’s head against that 70 resistance level. I’m in it, but I would wait for it to clear that resistance level at a minimum.
Looking at XBI & LABU – That seems to be the 10sma , so thats good advice. If it gets above the 10sma it could run more easily.
( Or, buy it will a stop under recent lows, but thats over 10% below )
Your breakout may be happening now. Perhaps it sustains it this time.
GLNNF vs. RIOT…the battle of the bubbles.
Riot exhausted on an intraday double top
Hi Alex, WTIC’s 10 sma is 46.42 according to stockcharts. If we close above that, are you confident we completed a DCL in oil?
Hi Peter,
No I dont look at it that way, and I believe that Oil has further downside. The set up doesn’t confirm that a dcl took place.
The XLE is weak too.
Okay, thanks.
Uraniums (URA) are looking a lot like the pm miners just as they started their big run in 2016, complete with a break lower that failed and instead turned and ripped higher almost every day.
That would be par for the course for me…I have been stuck in 2 Uranium stocks for way too long and finally got out of UUUU today with a tiny profit….so now it will be free to take off for sure!
Maria…..VSTM looking promising! https://uploads.disquscdn.com/images/5f5b36d2b6ecb093d95986c8a500aced2f450f340fb54d196b6f49888c7d468c.png
GROW … is lookn like my dark horse .. .;)
Is there a giraffe dance?
also SRAX …
Nice volume so far today
This is new to me.
I own this – Like the chart a lot.
I have also been watching PRELF, I’d like to see a close above the 10sma and not a drop to the 50sma.
I wanted to add when Grow was at $3.05, but I snoozed and — boom!
The daily chart is extremely bullish looking
ok shh.. no more talkn about it…. lol
Alex,
this gyration with gold and silver seems to confuse investors and traders. Do you think a definite direction is coming before the FOMC meeting?
I would think so, or at the very least, the OCT lows should be run by Gold- to shake out longs before a rally.
That´s only about $10 lower in gold and .50 in GDX. What do you think, if anything, of all these recent ¨pros¨coming out and saying they are waiting for the Dec lows of last year to get broken, with plans to load up then? Guys like over at Gann, and Jordan Roy-Byrne out today saying the same thing, but it seems to me they are all parroting each other.
Yes, and I am specifically talking about Gold . It would run the stops in Gold, and could take it below the 200sma to run those stops too. Then it gives me a failed daily cycle.
GDX already broke the Early Oct lows giving me a failed daily cycle. Gold didn’t break the daily cycle lows, , and I would expect to see that.
Sounds reasonable, much more so than taking out the Dec 2016 lows!
I kind of wanted to take out Dec lows : )
It still could happen, and I only say that because I have seen ICL sell offs that just drop FAST for the final 5 days and then reverse just as quickly. I’d like JNUG at $6 please 🙂
Hi Ralph,
Was tied up all day just getting around to reading the comments.
Another thing that is being mentioned by a lot of these guys are the COT numbers saying that the speculative positions are not washed out enough for a big rally.
If you check out either 321gold or goldSeek commentary they have an article by Jack Chan and if you scan down his charts he shows how speculative positions vary during bull and bear markets. The amount of contracts currently trading since the late 2015 low are perfectly normal for a bull market.
Check it out and let me know what you think
not the follow thru I was hoping for on UA
Drop to the 10sma?
Im trying not to be impatient. Up a nice chunk and gave it all back lol
still think it looks ook?
There is a small gap in price down around the 10sma. I think it might go there, but if it holds at the 10sma should be fine. I know what you mean though, when you get a good entry, get some decent gains, and give them back on a normal pull back & take the chance that that was all you get to the upside.
Hopefully it was just a move from the low to 1 & now 2, and you still get 3-4-5 to the 200sma
How about now… on UA… man this is a hard hold here…
Alex, what do you think of PRELF on this pullback? I don’t own…but was wondering if might be good time to jump in…..or…? It’s falling while others like GLNNF, etc. are going up….?
I’m watching to see if it tags the 50sma ( Or reverses and gets back above the 13sma).
Try pulling up the chart using only a 13 sma, and a 50sma. The 13 sma held it up & now has held it back
Ah, I see that now….I usually have a 13 sma set on mine but wasn’t paying attention to it….ha….Yes, I see what you are seeing….the 34 day was tagged on 11/14….it’s around the 34 now…maybe that will be the spot it will reverse at….perhaps….maybe….
I use 13/34 often too, but hadnt looked at it until you just mentioned it.
THAT might do it, it is kind of squeezed there now 🙂
Boy!! Did I ever screw up by letting go of $EKSO! :-(((
oh my EKSO…
*kickn the dirt
Grow is really taking off now too .
hmm… look at KOOL off that 200mva… no volume tho….
has anyone been observing AXU today….unusually high volume… is that a bull trap?
Wow. It looks like a news POP & drop, but I dont see the news.
Whats up with AXU today, huge volume too?
Wednesdays report has been posted