
Weekend Report – Changes
It comes as no surprise that markets can evolve and change over time, so when a change appears, it is best to listen. It may or may not amount to anything in the long run, but we take note of any changes anyway. That said, I have seen ‘changes’ in the markets this week in a couple of areas, so we will listen, discuss, and prepare. As I mentioned, they may not amount to anything permanent, but we still need to listen and prepare, so let’s discuss some changes in the weekend report.
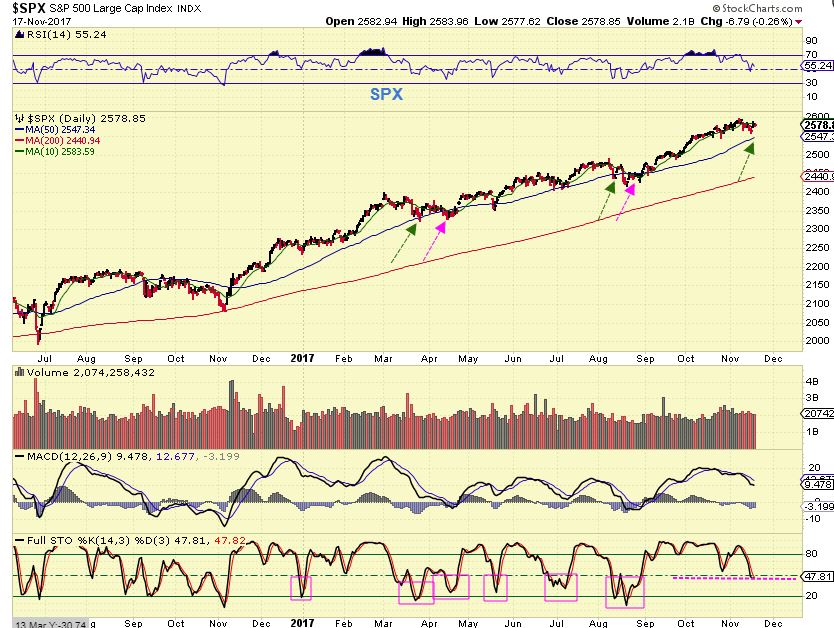
SPX – No change here, but I wanted to point out that in the past, the SPX did visit the 50sma a couple of times before moving higher. These were areas of ICLs that did not sell off as deeply as the ones in the past (see JULY & NOV 2016). So, will the markets just continue higher, or are we coming due for one soon?…
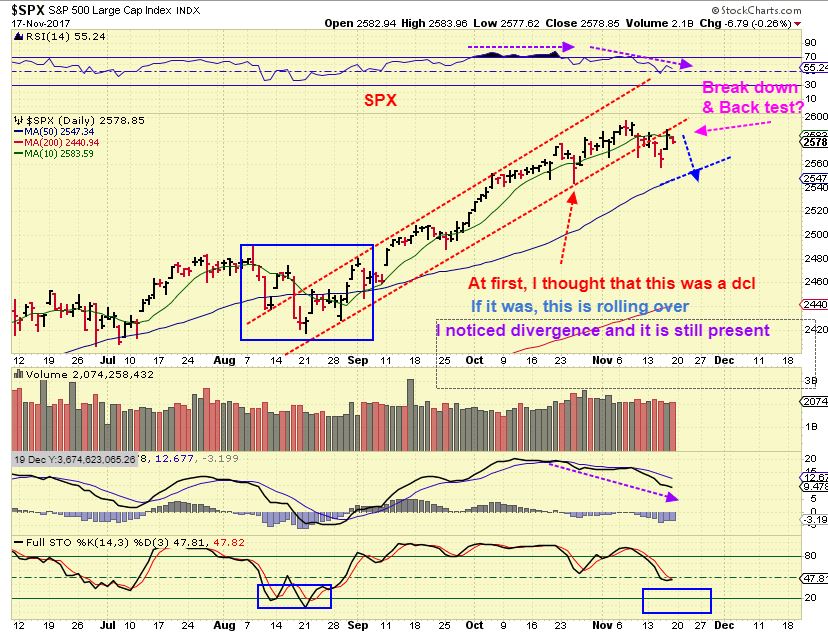
SPX – If we are going to make that drop to the 50sma, the SPX may have just done a break of the current channel and a back test. A push higher above the red line is bullish, a struggle here could drop to the 50sma, similar to the drop, bounce, drop seen last August (blue box). Let’s look at the weekly chart.
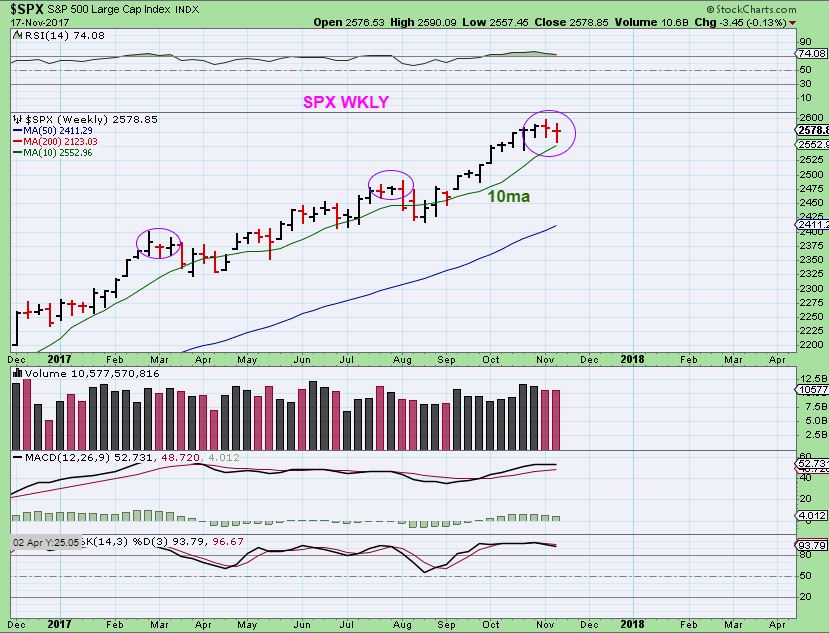
SPX WEEKLY – In the past, the weekly 10 ma was tagged or even slightly broken. This drop was close enough, but past drops did break through, so we’ll keep an eye open for such movement sooner than later.
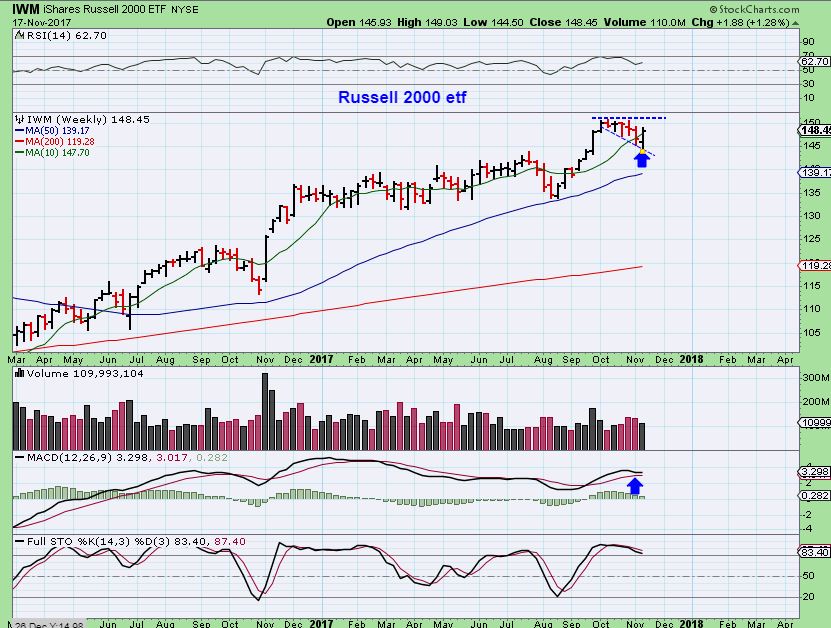
THE IWM Weekly (Or RUT) – The markets are all acting differently. We also saw a reversal on the Russell 2000 and it closed above the 10sma after a 5 week sell off. It may be ready for its next leg higher. Note that the SPX & DJIA have just recently started to pull back. The RUT & TRANNIES have been pulling back for weeks. MArket sectors are not all in sync.
NASDAQ – And the NASDAQ broke to new highs Thursday. The NASDAQ had been consolidating while the DJIA & SPX ran straight up recently, so it too seems to be on its own Timing. It looks like day 2, but the MACD is not agreeing with this move higher.
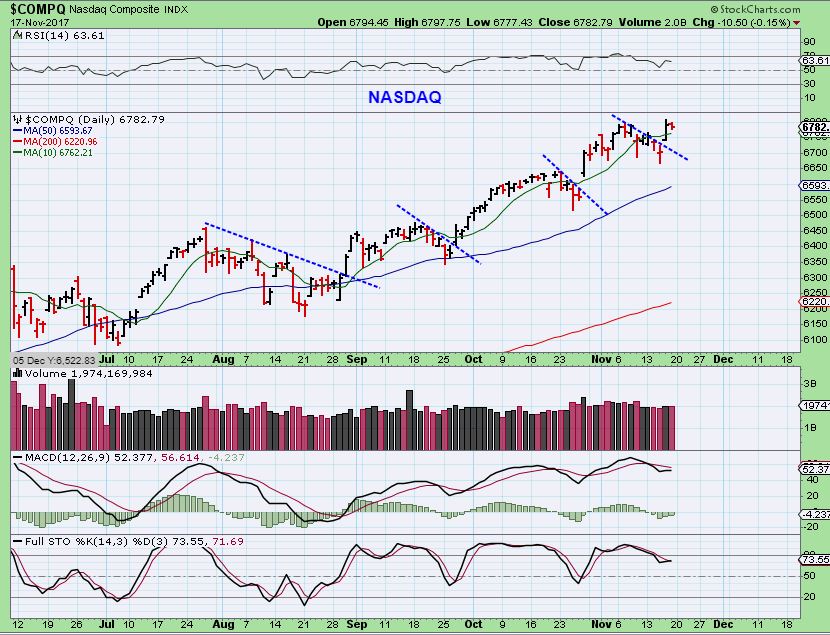
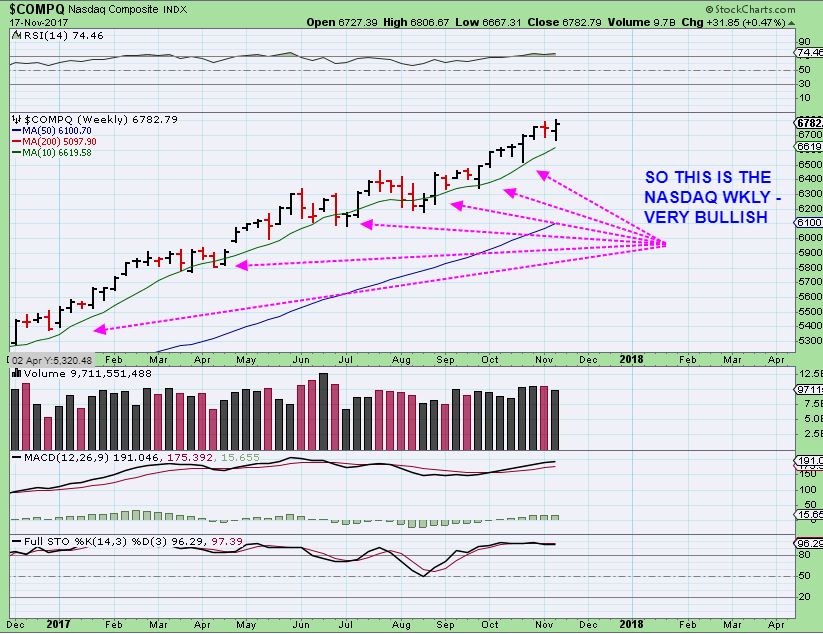
The NASDAQ has been in a strong bull run higher on a weekly basis, with new highs last week.
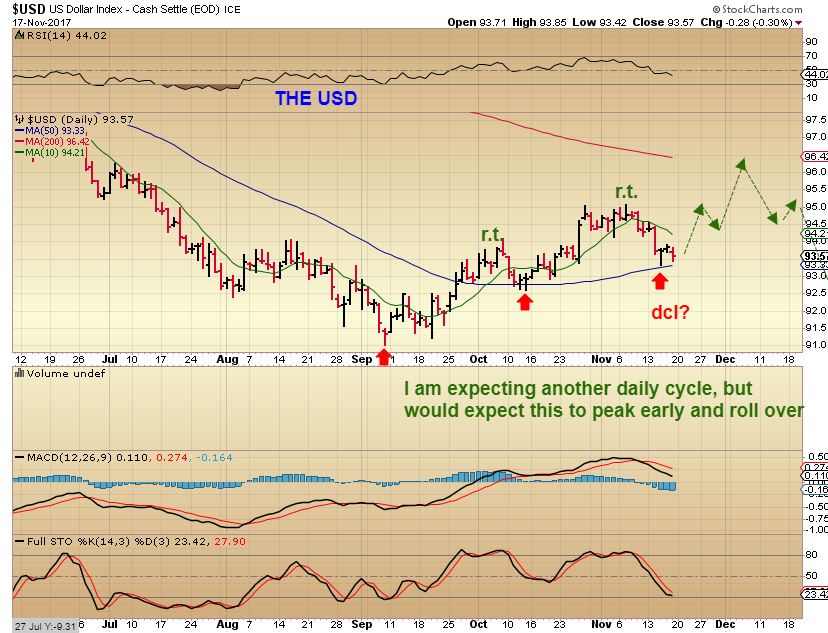
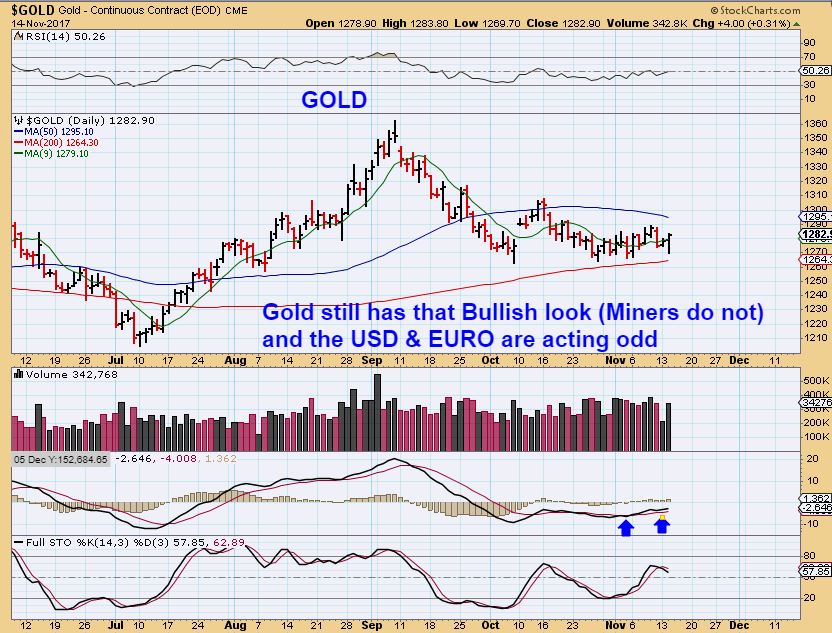
USD – I have been saying that I expect another run higher out of a dcl, a 3rd daily cycle that then rolls over and Gold can then rally. So far the USD appears to be acting as expected. However, when we discuss GOLD – We will discuss interesting change this past week.
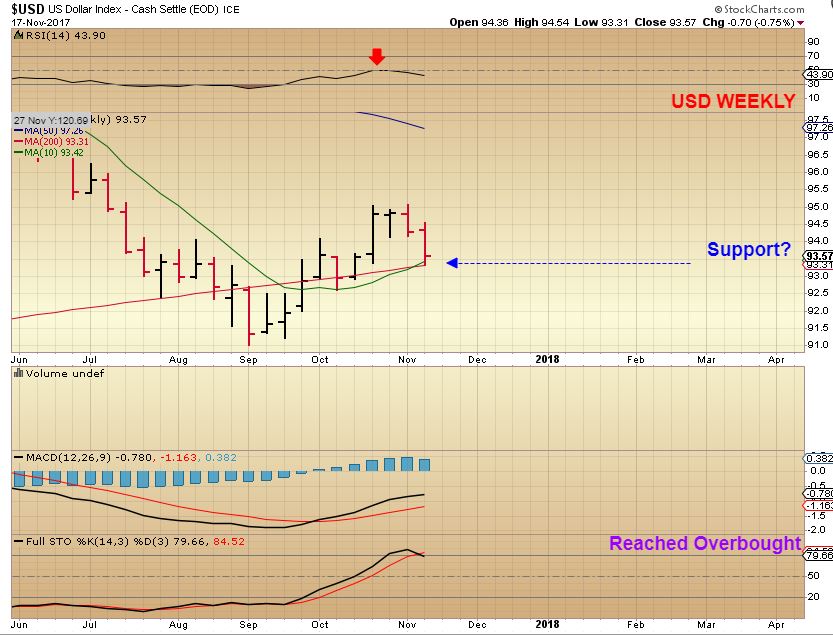
USD WEEKLY – Last week was a pretty big down week for the USD. It is on support, let’s see what next week does. If this were to break down and bounce lightly only back testing this support within the next dcl, that would be a change here too, but so far the USD is acting as expected.
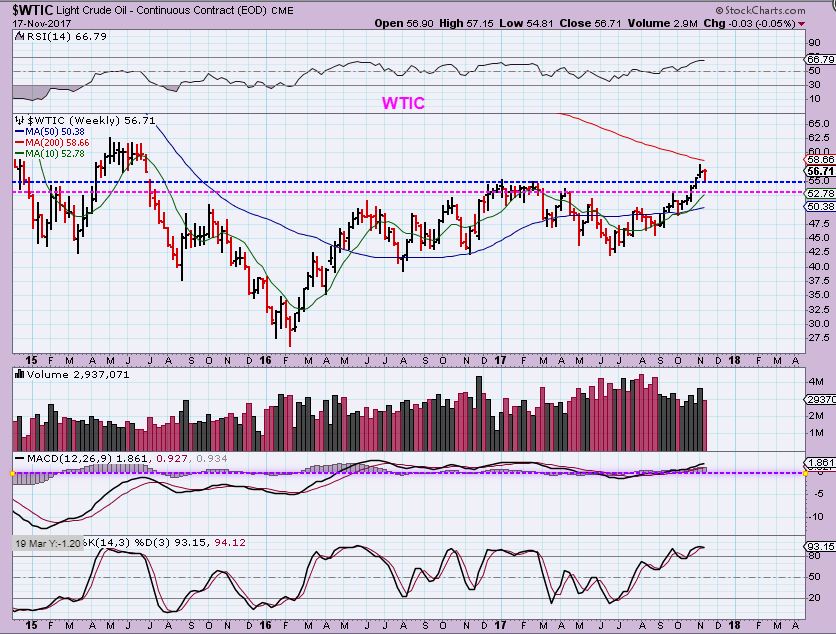
WTIC WEEKLY NOV 17 – Oil had no unexpected change with a pull back here, but The XLE definitely did change. I had been thinking that OIL would back test the recent break out area and it actually did and recovered, as seen here…
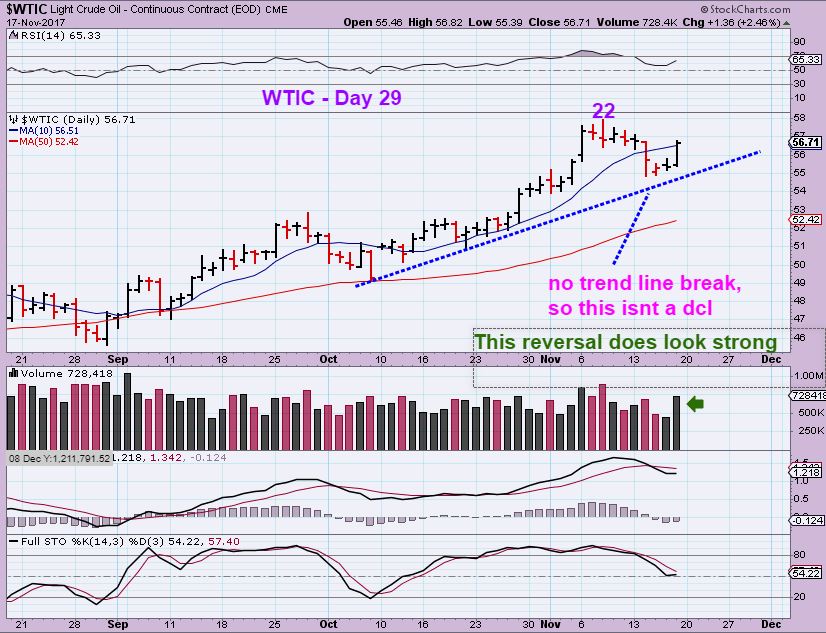
WTIC DAILY – 2.5% reversal, that is impressive, and so Fridays move looked real, but the dip didn’t break the Blue trend line, so we dont have a dcl here. Oils daily cycle can last well beyond 30 days, so we’ll watch this play out ( Note: The XLE doesn’t seem to believe this move higher in Oil).
WTIC – I did mention a possible a-b-c type drop, but if price moves much higher, this will not be an a-b-c drop. The COT picture for OIL actually looks like it calls for a deeper pullback. I am not buying Oil stocks here.
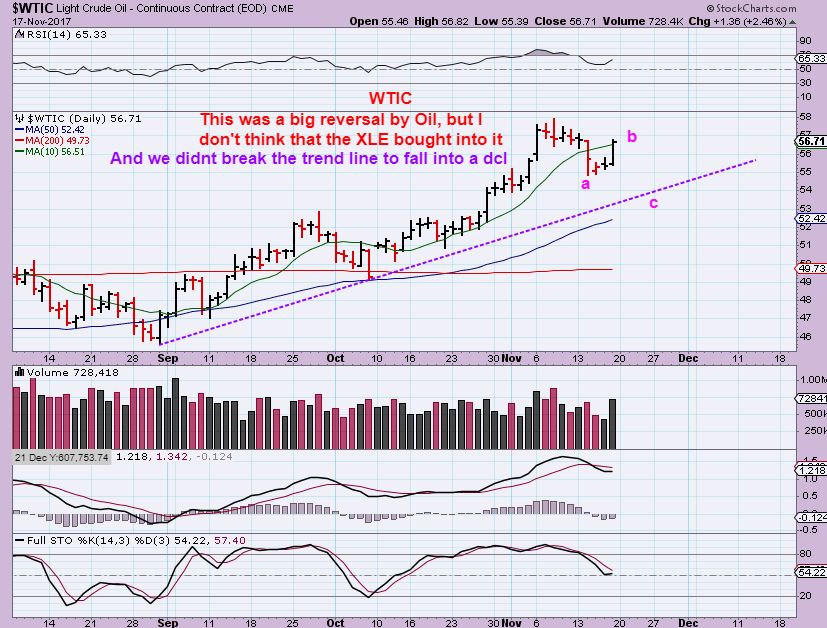
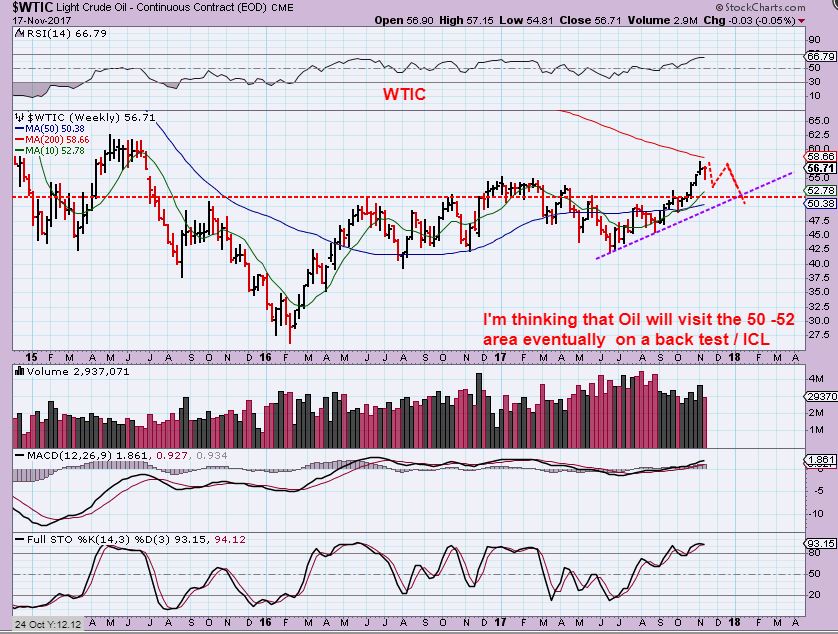
WTIC – Big Picture I think that Oil will move around and eventually dip into a dcl & Icl. Let’s look at OIL / Energy stocks.
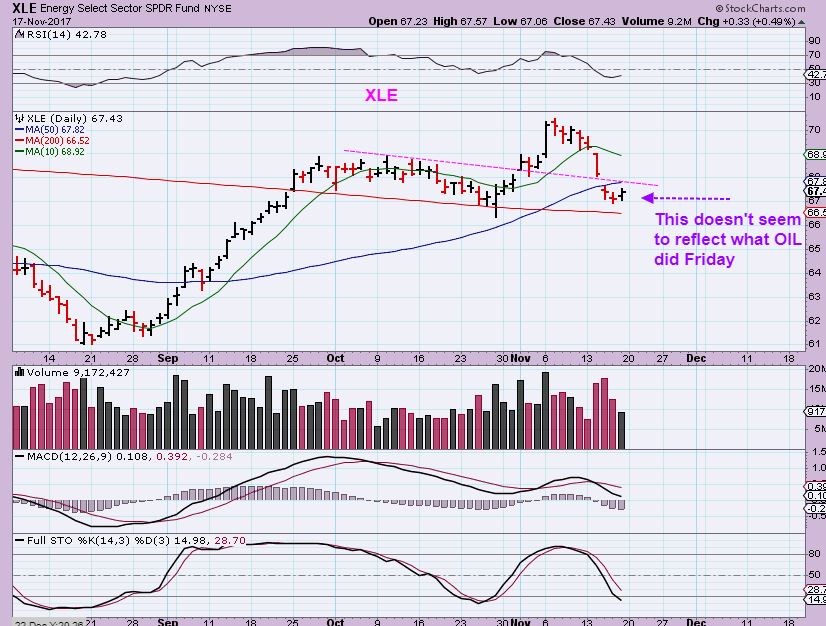
XLE – This is where 1 Big change took place just over this past week. And with Oils big reversal, the XLE was only up 33 cents. Count the candles back 5 days, and you will see that as of Monday, this still looked fine. SOMETHING CHANGED.
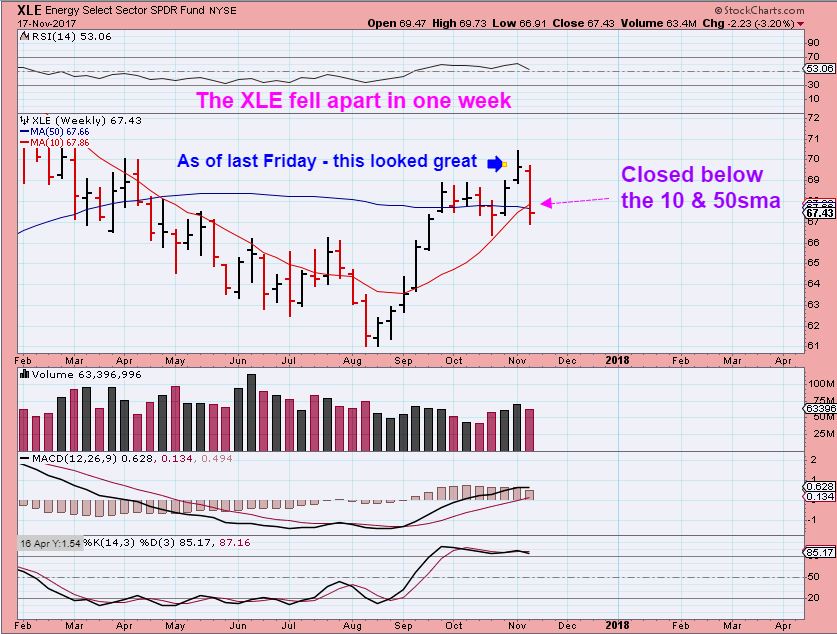
XLE WEEKLY – Last week the XLE just fell apart, and that was a BIG change from what I was expecting. This price bar broke & closed below the 10 & 50sma, despite oils big reversal higher Friday, so I am not buying the dip personally. It remains overbought despite that drop.
PRECIOUS METALS
So this is another area that is Changing, and we should take note, though it may be a Bull Trap. The major Change pretty much only took place as of Friday. Is it lasting? I can’t know for sure due to common market ‘break outs’ and ‘fake outs’, but it is noteworthy, so let’s take note. The COT still seems to be calling for lower Gold price, but the action Friday was very noteworthy.
GOLD 1 week ago – Over a week ago I was pointing out that the ‘set up’ in Gold was actually Bullish Looking. Gold did NOT break the OCT lows, while Miners did by a lot. The MACD was also rising. I pointed out the EURO as starting to look more Bullish too, and will review that as well.
A bit confusing
GOLD WEEKLY – THIS trend line break is not really expected at this point, and Gold closed above the 10 week MA too. It looks like a week 6 burst higher, since the Oct Lows were never broken for Gold. Recent lows for Gold were OCT, and the ICL was July – so it seems that that time period is too short for an ICL in Gold. I think that this could be a low for now, but it still doesn’t look like an ICL, so THAT gets confusing. IS THIS A BULL TRAP, OR WILL THIS HAVE FOLLOW THROUGH?
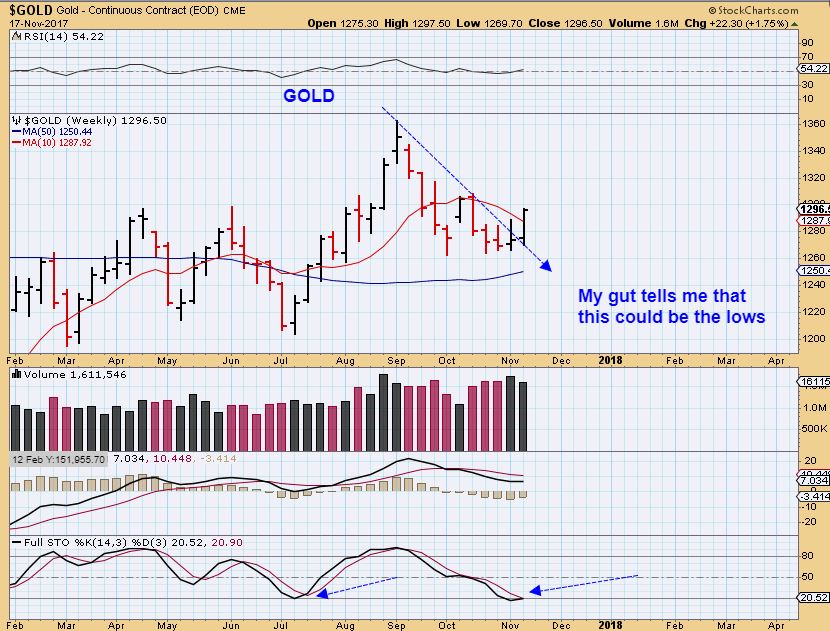
GOLD WEEKLY – So using technical analysis, I mentioned last summer that I thought we’d get a break out from a triangle and the back test could be the ICL, but I expected that back test in Nov or Dec. So far, we DID get a break out & we did get a back test, but that back test was that Oct low. It does not look like an ICL, so I started to mention possibly 2 back tests after a bounce. Will the Next ICL be a 2nd back test? That could be…
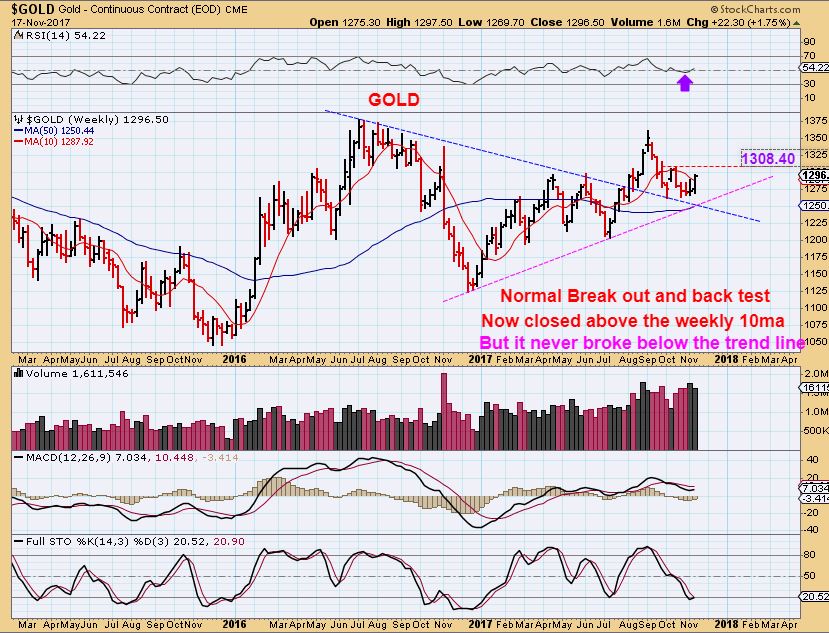
GOLD – So I’m still watching that 1308.40 mark. I would think that a break above that would be very bullish. I also want to point out that if you remember our last dip into an ICL in December 2016, MINERS PEAKED IN FEB, and made lower highs from then on into the July 2017 ICL. It was different for Gold. Gold made higher highs in April & then again in June, as seen here. So GOLD & MINERS traded out of sync. Now lets look at GDX.
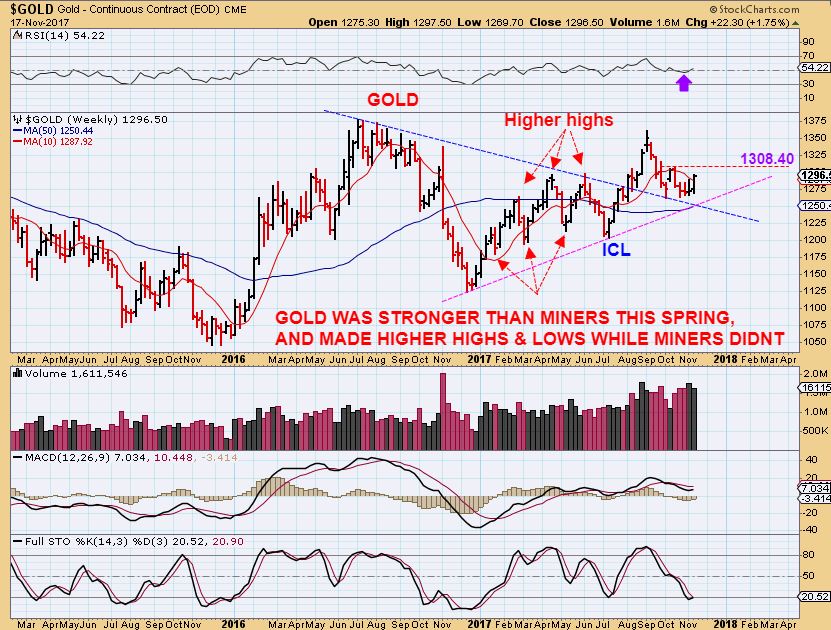
GDX – Compare this chart with the Gold chart ABOVE. Gold was making higher highs in 2017, and Miners peaked in Feb & made lower highs as seen here.
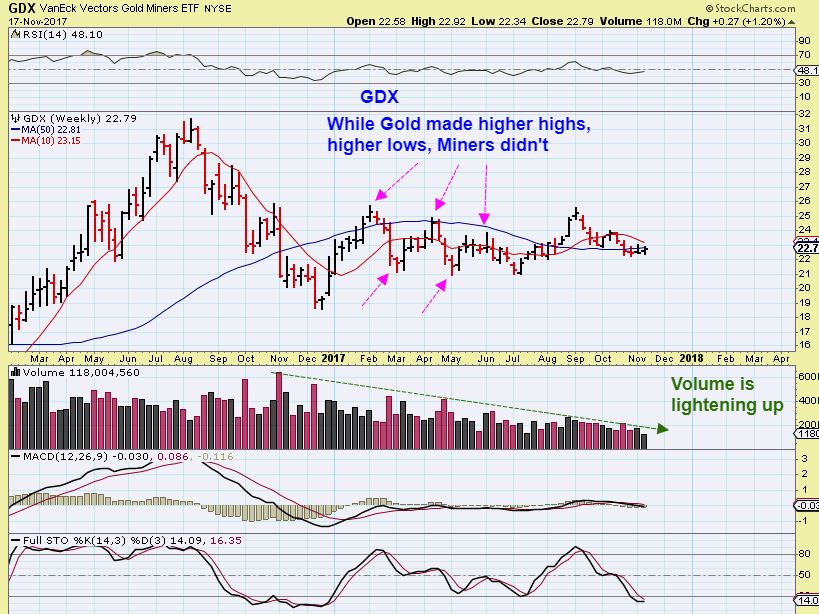
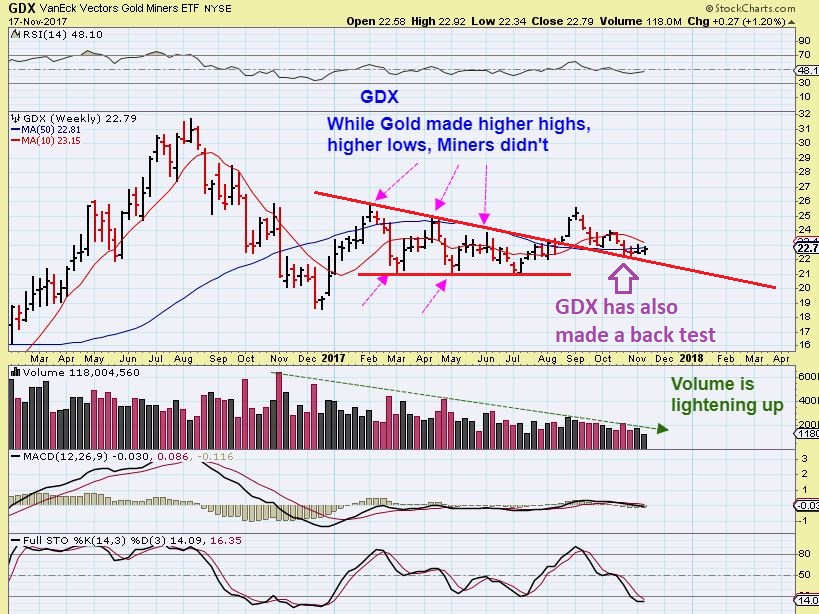
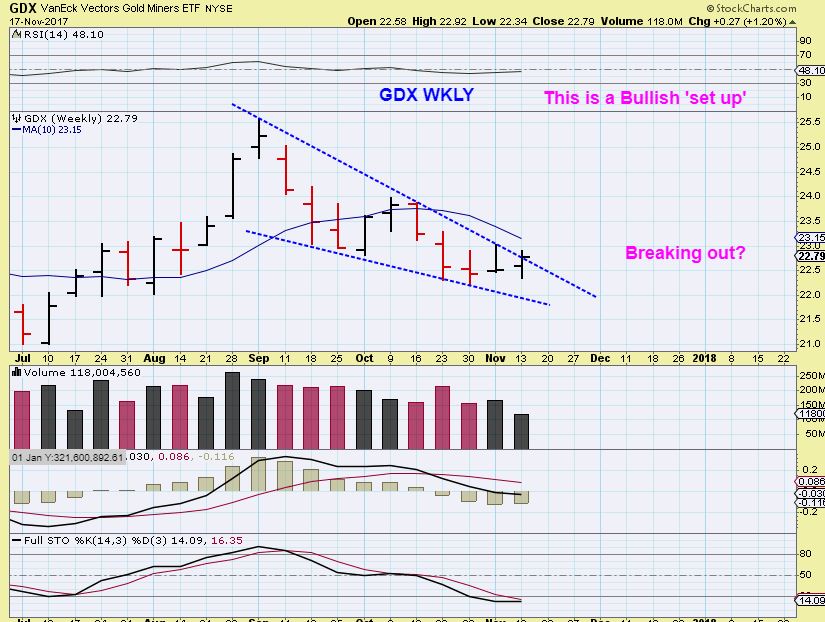
GDX WEEKLY – SO we see that Miners had a break out & back test too. Maybe that is even a double back test, like I was expecting.
ON THURSDAY, I MENTIONED OB THIS CHART THAT THIS SET UP LOOKED BULLISH – We may have put in a dcl at the red arrow, so this would be day 9 and it looked bullish. The timing was still late in the intermediate cycle so I wasn’t “buying’ here, but that trend line break was bullish too.
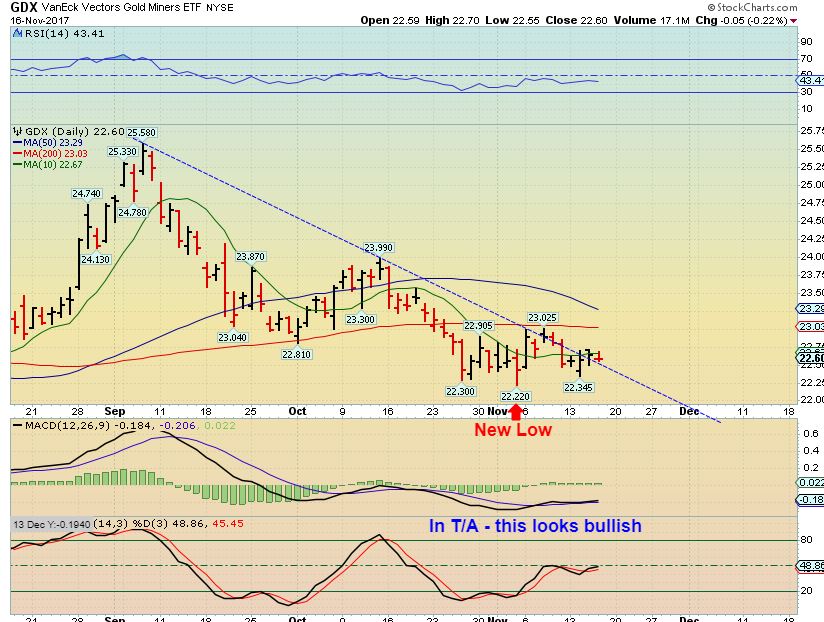
GDX DAILY – Now we see that GDX broke the downtrend decisively Friday too. I posted this in the comments at 1:30 p.m. on Friday afternoon to show that. GDX made a new low 2 weeks ago, a DCL? So with this POP on day 10, WOULD IT HOLD INTO THE CLOSE?
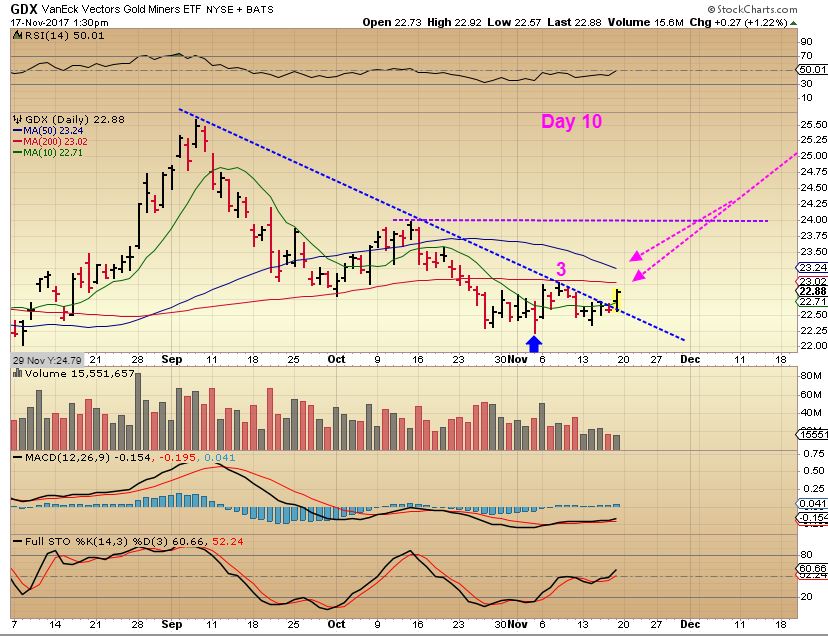
GDX – It did sell off a bit going into the close, but remained over the 10sma & Volume picked up. Do Miners want to break out higher like Gold, or is this a Bull trap, drawing in buyers before really selling off? I will add this thought, as a trader – you COULD buy a starter position as long as you dont mind getting stopped out, knowing that this could roll over as a bull trap. Let’s look closer…
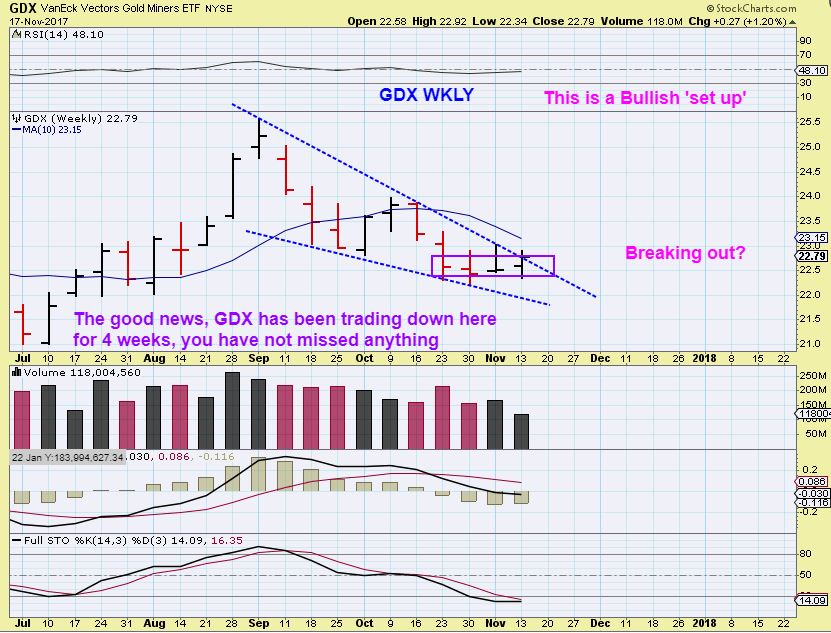
GDX WEEKLY – A descending wedge, oversold, and breaking out? This also looks bullish. Next week will add to this story, right? We should see follow through as a Break out or a drop back & a break down.
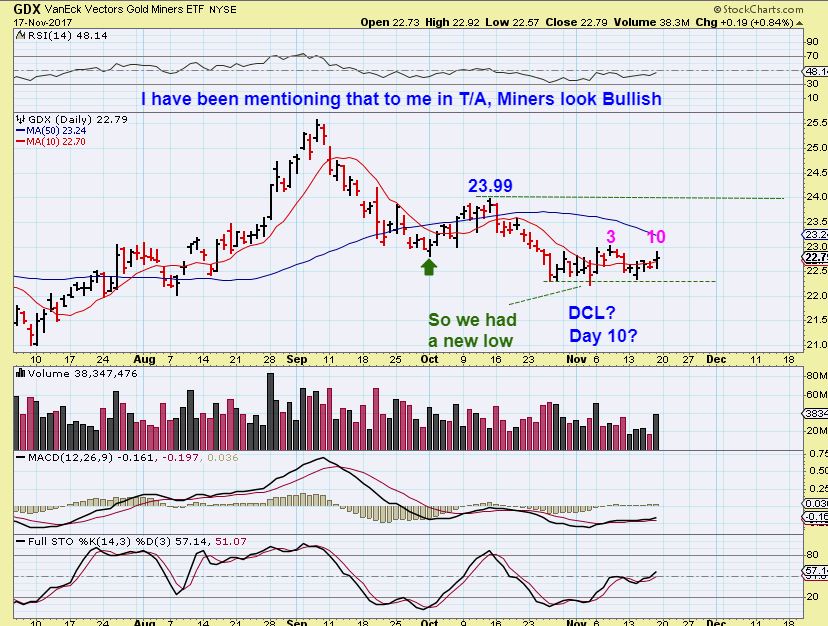
So let’s just say this, “What if Miners just break out & run from here?” It has not been what the set up calls for using cycles, but the good news is that if it were to take off higher, Price is still at the lows. Miners have traded here for 4 weeks, we haven’t missed anything, according to the chart below. The next run should be strong, and we would catch most of it, but is this an ICL? That question remains unanswered for now.
GDX – GDX has actually been trading in this area for a month now. Buying with a TIGHT STOP is one method, knowing that it could drop. If you are wrong going ‘long’, you will be stopped out. If it continues higher, we can watch the progress and figure out what is going on here. Let’s continue a bit further…
GDXJ – GDXJ has now pushed higher too, and I posted this at 1:30 in the comments section. GDXJ put in a new low 4 days ago (This week), so this could be day 3. Interesting.
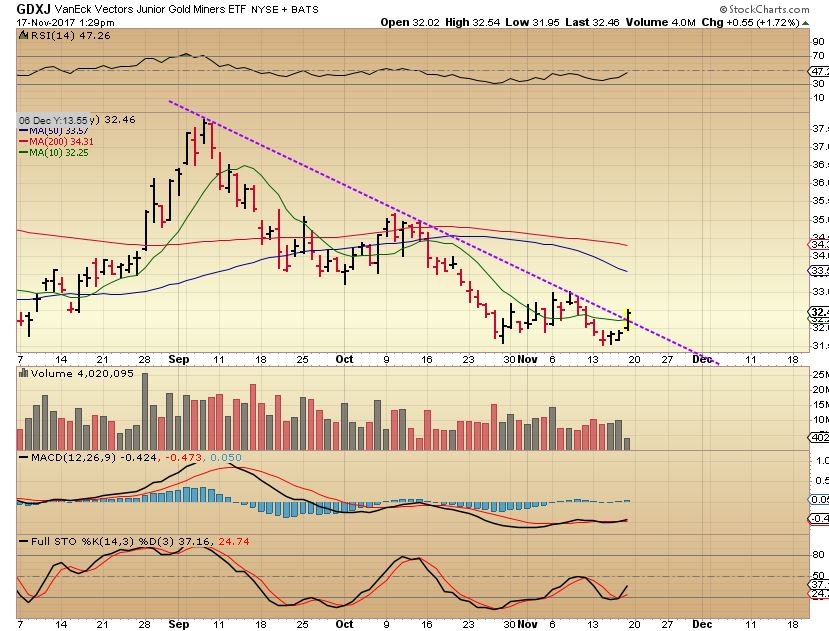
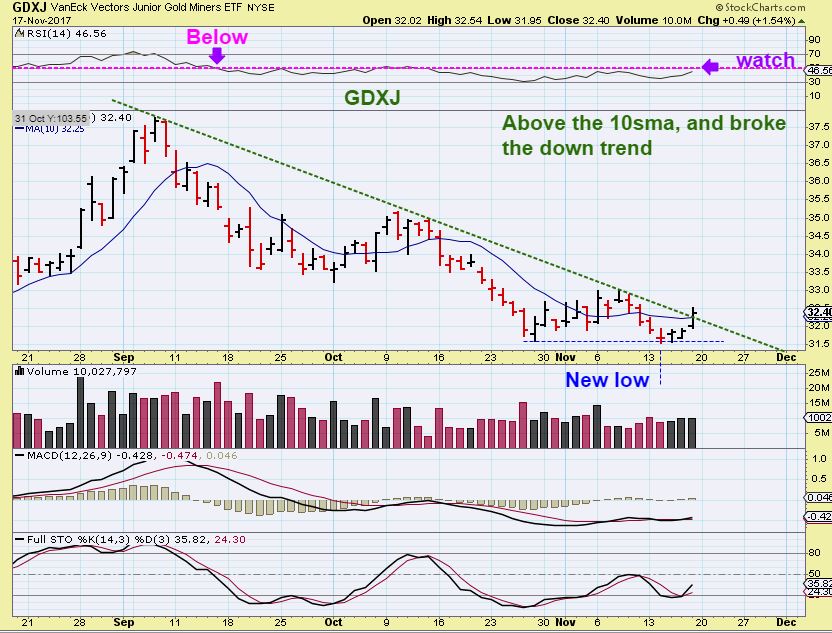
GDXJ – And GDXJ did close above that down trend line & the 10sma. That is usually a buy signal for me. This means that GOLD, GDX, and GDXJ are not really in sync again, timing-wise. BUYING here could work out for a short trade, but a TIGHT STOP at recent lows would be needed. A sell off could still go wrong quickly, with plenty of time to drop. Let’s discuss the short term a bit further.
GG – SO GG looks like it might want to break higher, and if so, it would do that this week. GG is a big part of GDX.
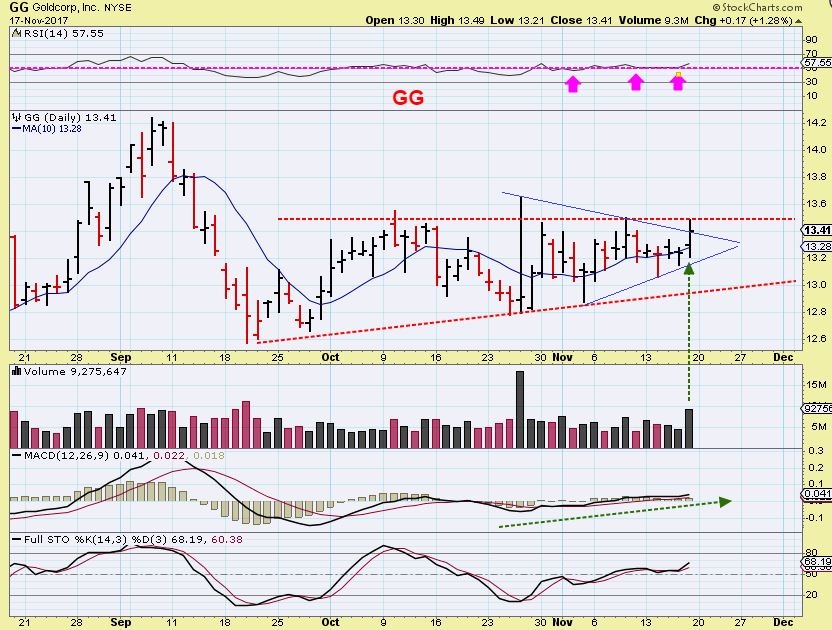
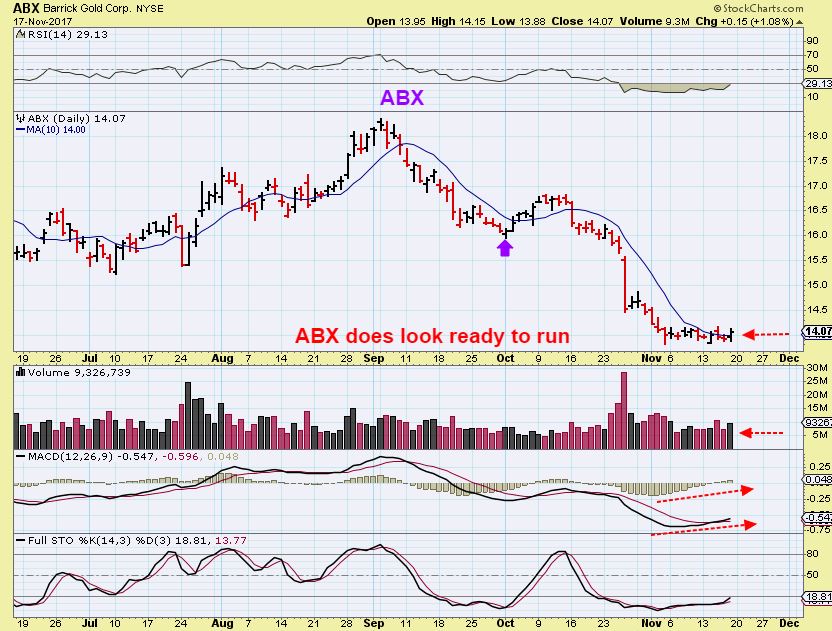
ABX – ABX was slammed down a few weeks ago, it has based out, and it too looks as though it may want to run higher too, next week. It could be just a bounce, but ABX is also a big part of GDX, so if it runs higher next week, along with GG & NEM, I would expect GDX to move even higher.
REVIEW EXPECTATIONS LAST WEEKEND
GDX #1 – Last weekends report showed Big Picture analysis like this. I expected a break lower, but key points were pointed out with circles.
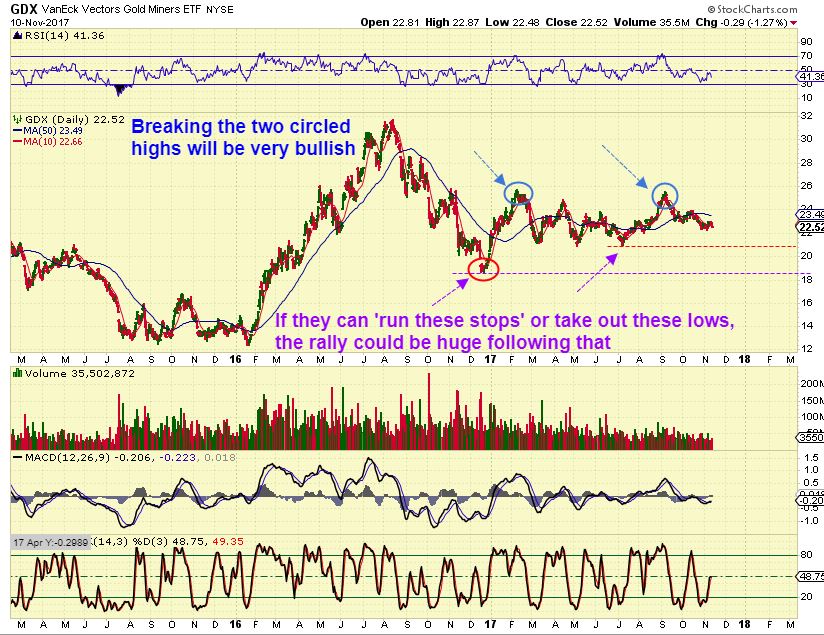
GDX #2 – I honestly expected this run of the lows, and it very well could still happen. Friday, however, we saw a down trend line break out, so I must remain open minded, and listen to changes as they pop up, and see what happens when it comes to follow through.
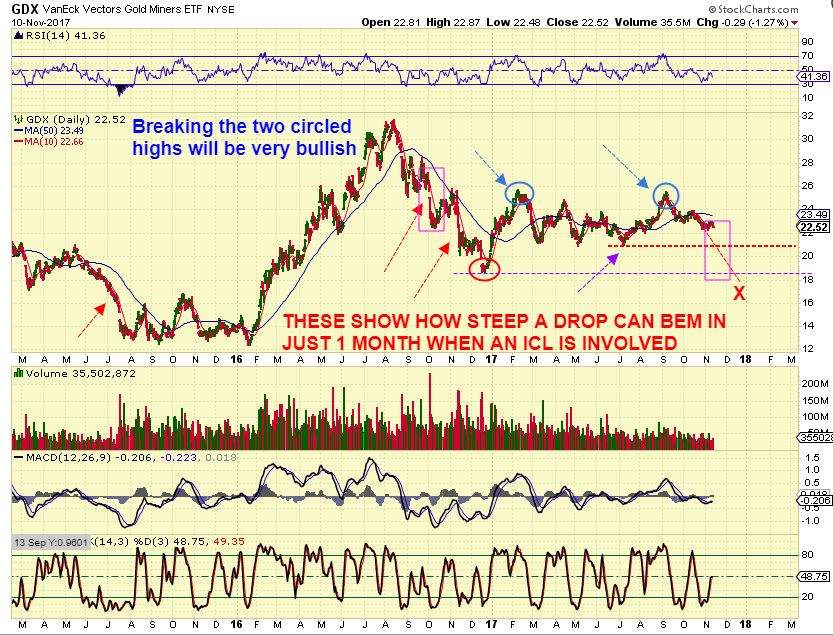
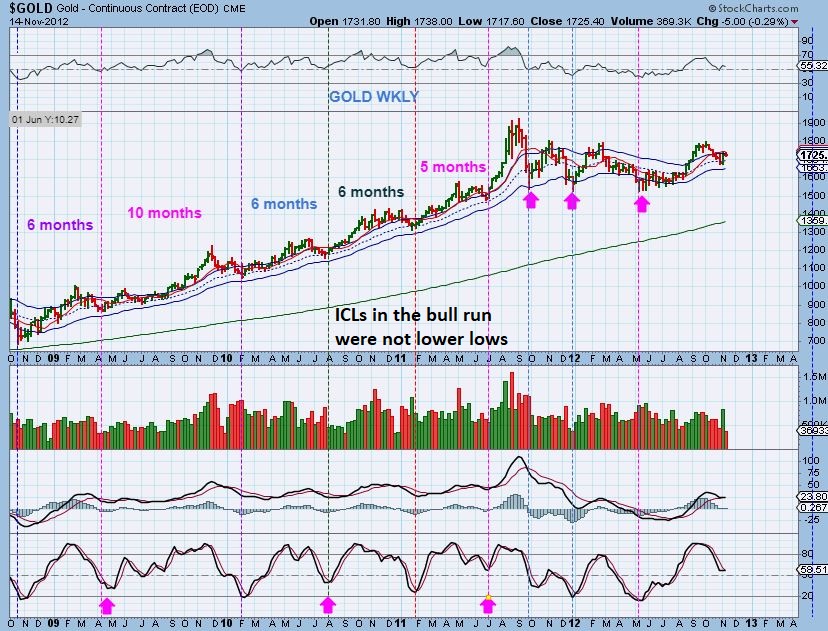
I went back through the BULL MARKET RUN in GOLD & MINERS and I did find a couple of instances when the ICLs seemed to be 8 months apart, even 10 months apart, and they also were higher lows, not simply ‘Stop runs”. These also looked like MILDER ICLs , don’t they? You do not see a galring sharp drop on some of these points that would be ICLs. The dips into the ICLs did not seem to be extremely steep, but do seem visible on the charts. This chart raises a couple of questions to me. What is the ICL from July forward came 10 months later? What if the ICL makes a higher low? SO we examine the historical precedence and keep these things in mind. This was a BULL MARKET RUN in Gold.
I will close here, simply saying that we really did see some big changes all in one week …Last week. The XLE looked great as of last Friday Nov 10 , or even Monday, but suddenly it just sold off and the weekly chart now looks a bit ugly. Oil looks fine, but the COT does look bearish for Oil and I would expect a bit more selling eventually into an ICL here too, even though we got a strong reversal on Friday.
I’m watching the USD closely since it is on support and due for a DCL. I would think that the USD higher would drop Gold & Miners.
GOLD , SILVER, & MINERS started looking more bullish internally a week ago, and I have pointed that out, but expectations were for a DCL/ ICL drop in the near future. Suddenly Friday we had a down trend line broken to the upside in GDX & GDXJ, price was seen as closing above the 10sma, and possible early cycle counts in the Miners after breaking to new lows and recovering. That downtrend line looks bullish, but it doesn’t look like we had an ICL. How do we handle that?
1. Patience to allow a little more time
2. Watch for the parameters to be broken of not
3. Take a small position KNOWING that you could see this play out as a ‘Bull trap’ a ‘False break higher’ and you could be stopped out? I will obviously be covering this area in the next report, after we see what Monday trading brings our way.
I’ll sum it up by saying that we definitely did see some ‘changes’ taking place last week. Whether they are short term blips, or longer term trend changes remains to be seen, and next week should give us a better idea of what these changes mean. I will discuss even more changes below after signing off, so Stay Tuned and Stay Frosty! Thanks for being here at Chartfreak, and enjoy the rest of your Sunday 🙂
.
~ALEX
.
XEU LAST WEEK – Last week I mentioned that the action in the Euro needed to be monitored. It looked Bullish, Like a day 5 break of the 50sma, which would hinder the USD ( And might be bullish for Gold). That alone was an interesting ‘change’, has this changed?
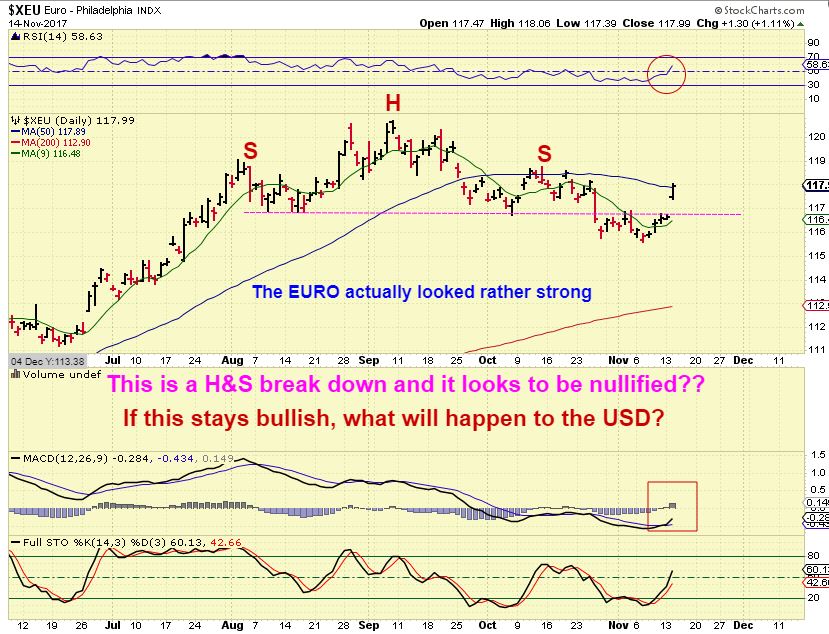
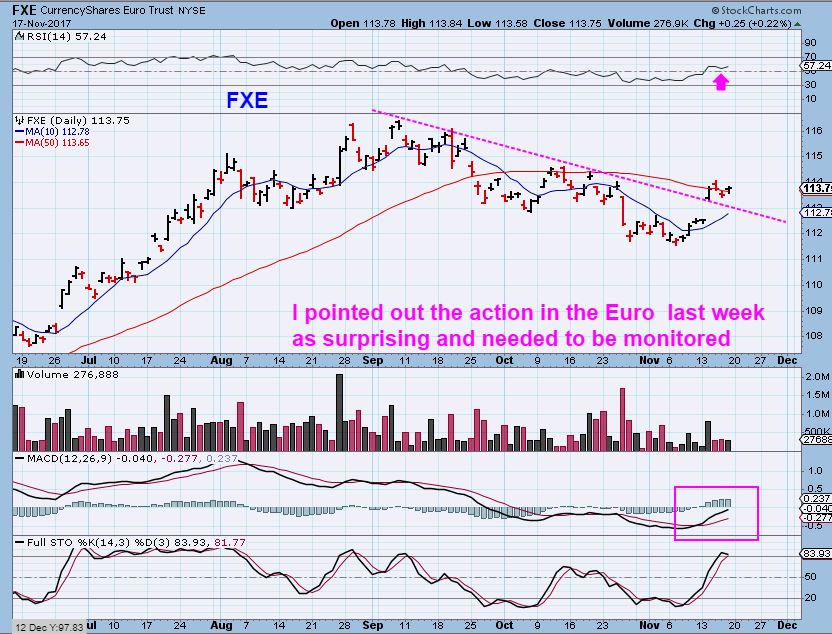
FXE – Day 8 and The EURO is holding up and not selling back off. It seems to have negated or nullified a H&S pattern, and again has closed above the 50sma, so…
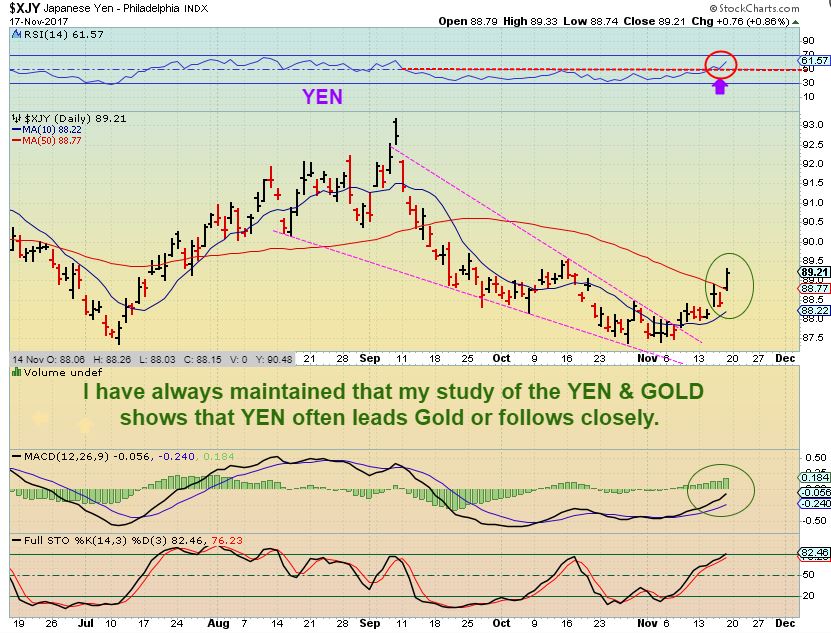
YEN – Please read the chart, this looks like day 16 and a new peak. Isn’t that quite bullish? Last week I noticed that The YEN broke out of a descending wedge pattern, but I didn’t think much of it. I thought that it would ‘back test” and Gold would put in an ICL in a few weeks when it did. Last week, the Yen continued higher out of its’ lows, now on Friday it closed above the 50sma, and I usually see the YEN leading Gold. These changes are adding up.
So when this happens, I need to keep track of the changes, and try to anticipate how they do or do not affect our big picture. Short term, various areas that I expected to be ready to sell off seem to be holding up or even breaking out higher. FALSE BREAK OUT? REAL BREAK OUT? Only time can tell at this point, but it is noteworthy that it isn’t just 1 area changing. I noticed changes in the YEN & the EURO last week, and now Gold & the Miners had a few changes in character.
Please read the opening paragraph again. That really sums it up . STAY TUNED!


Thanks for the report.
🙂
Thx for an amazingly thorough analysis!! It really helps me to think of different ways to look at the market.
Thx Deshy – Me too- lol.
This crazy market forces me to look at EVERYTHING !
Very useful observations, CF. Thanks! I´m 33% invested in miners, looking to get it all to work into a December selloff. If that dosen´t occur I will just add lightly as we drift higher, and be patient for the next selloff wherever it starts from.
If we have seen the low recently in miners, this sure is turning out to be one tough sumbitch to buy. I would think it near impossible to buy 3x etts into up movement, for short term traders, so that could keep them on the sidelines watching.
It’s odd, because some of these individual Miners are still at THE LOWS ( even ABX in the report), others like FNV nar highs, and SA- which was up at the highs, just sold of very sharply & rapidly last week. SA sold off they was GDX normally sells off into a dcl… Then Gold bursts higher 🙂
And NSRPF, which I did want to buy down near the 50sma, is down at the 50sma, but it did not react at all to Gold, GDX, and GDXJs Friday action
It is a tough one.
I am going to have to take a closer look into KL, not only do they own a bunch of NSRPF, but this morning I learned they have soem Bonterra as well, another one having a good run.
Hi Alex,
Thanks for the great report.
Looks like your GDXJ chart also has a positive divergence for both the MACD and Full Sto.
big W to 35?
Could be worth a try ‘trading’ it if we get follow through and people honor their stops
Yes, I noticed it starting when I posted this chart in a report last week. You can see that I underlined the MACD rising while GDXJ made a new low.
It is definitely mixed signals of bullish looking set ups short term, and cycles calling for a deeper ICL type sell off (And a $$ rally, etc)
https://uploads.disquscdn.com/images/99c728a9f160d61ccb1e40d7fe9fee1d187ddbc4310fe6d24b050a8fb7eeef4a.jpg
Thanks Alex! Hey, it looks like MBOT was above the 50 day earlier this morning in pre-market. Maybe it’s getting ready to go.
Yes, it started moving a bit on Friday, a little follow through would be nice 🙂
Just as a follow up- those Uranium stocks did POP, pull back , and have some more follow through higher on Friday.
Look at UUUU, DNN, UEG, UEC, CCJ, NXE
Adding to my silver futures this morning on this dip, not adding to any miners as yet.
Ralph, I hope U don’t mind if I short on U, ? Thanks. John
And that was my break out on CBDS and the volume is solid
Mny others also looking good in this sector this a.m.
https://uploads.disquscdn.com/images/9d57a4c122014404bc75164d0ba0c662ec60230f5a7a01b65145068ce46a742b.jpg
Still have my CNBX. 🙂
Me too – and it looks to be continuing higher after dropping Friday toward the 10 & 50sma
Bought a initial position on a buy stop at $3.06, filled at $3.08. Added at $3.21, almost full up.
NAK has some pretty big volume so far.
SO we needed this week to help us understand the changes that we saw last week.
We are only 1/2 hour into Monday, but this is what shows up so far
Refresh
https://uploads.disquscdn.com/images/b1f2818beec0c211d3f1c9fcd9601129b5d5db66bb62c83cb846b132b2b56404.jpg
Added to APHQF this morning
Forgot to add the chart
refresh
https://uploads.disquscdn.com/images/99ce18f8c525e51e368cc25ac61750794253ce1995fd68c906679863006306a6.jpg
MBOT – Good volume break higher, above the 50sma 🙂
Over the 50 now.
Go MBOT!
RIOT’s ripping.
Just about to post this 🙂
to add or not to add?
refresh
https://uploads.disquscdn.com/images/c0cb26d02117cebb0d190b1637bbca43534c05cef4883f383d8bf597cfefd73c.jpg
If it breaks out above yesterday’s high, it looks like it could start trending up, but that’s a tough buy. I’m gonna just sit here and watch you play with it, but if it back tests that trendline, it would be awfully tempting.
Yes, Friday I thought that maybe we had a false break out when it gave the gains back. I was looking to make sure ( from that point) that it would put in a higher low, and I also drew a bottom trend line for my stop. What I like at this point is that it went from lower highs / lower lows in that consolidation to now making higher highs and higher lows as of Nov. and is holding above the 10sma.
That said, it is still one of the harder ones to ride comfortably, because it swings $1 a day at a time at times.
Thinking out loud, the 10sma meeting the upper trendline would be strong support and fit your requirement for a higher high. Could be as low a risk entry as you’re gonna get on this thing. What do you think? I’m new at this, and just trying to roll the scenario around in my head.
That would be a good support ( or added strength), but I also think that the higher low is already in place, and then the higher high was Friday & today as it passed the Nov 7 highs, the higher low was the Nov 10 low higher than Nov 2 – forming another shoulder on an inverse H&S
refresh
https://uploads.disquscdn.com/images/174c99a4797af24930e053c9384a7c07e579a23382eb1722bd02b14313faa5d5.jpg
Got it. This is like a tutorial – “How to Play With Rocket Fuel”.
Exactly – And when playing with rocket fuel, there are no guarantees of not getting burned – lol
I do expect a double on this one, Block chain is heating up for sure, but nothing is a certainty in these markets.
this was the long term chart that I posted too, in an older report. it shows the potential if we get a real break of that down trend line
https://uploads.disquscdn.com/images/ce59bd2e09c53840beeb9890be91675b57b2e6bd5c207fc4f286d414f9795988.jpg
I used this chart to point out the bullish set up in CNBX too – A high volume break out above the 50sma at 84 cents.
I also Mentioned that I bought it. It is also moving higher again today, now moving above $1.00
EDIT: I just took a small position in this one.
https://uploads.disquscdn.com/images/107ce7a97ac58dd2459697757a4fc162b34775e9dc1530c02def5108b940d767.jpg
Here is another one I am waiting to get out of without a loss. Get going CNBX.
Yeah, I had made money on this long ago…then….bought again and held…..way down big time in it, not sure I’ll recover from that purchase…..should have bought more last week to average down but couldn’t bring myself to push the button on it…..I’m just holding and maybe can make a tiny piece of it back….:) On the bright side, I’ve had some other mj’s that have done ok 🙂 And that one was ok…just my stupid move for holding too long when I should have sold….
I made and lost money on this one too. Made really good on a strong run that it had, but got chopped a couple of times after on early entry. At least this looks more like a bottom area with upside potential .
You are exactly describing, what is apparently, my “trading style”. LOL. I get on board too late and stay on board too long…and don’t get off when my loss is small.
That is why you did well with the Miners out of an ICL. It isnt toooo late, even if you wait for a week to be sure. Then they get bullish, so they make up all of the losses on the short term pull backs as they keep reaching for new highs. They usually run higher for 3 months or so , on average ( 2-3 daily cycles), so your gains add up… and the good news is that MIners are going to be setting up for that kind of a run again. 🙂 I really think that after all of this sideways consolidation, a break out this time could be the bigger one again, more like 2016 when we came out of those lows.
In other words, make sure you have money to buy, you will do very well again. 🙂
That’s the problem..too much tied up in dogs.
Yeah, I used to hold too long..and sometimes still do….but….this past month I am cutting things loose quicker….I hesitate to do it but once it’s gone from my account and I can’t see it any longer I feel better knowing at least it can’t go down on me any longer 🙂 And I’m trying not to scream if I sell at a little loss and then it runs up without me…..:P I chant over and over “it doesn’t matter, if you’d held it would have kept going down, there is always another trade, there is always another trade, there is….”…..hahaha 🙂
I am trying same as you! I just hate to take a loss…any loss. Ever . In any part of life. LOL
CNAB – an old MJ stock that we used to trade here, is breaking off of recent lows, taking over the 50sma too
Just a heads up – just looking around at different stocks 7 ETFs in various sectors & noticed that ZSL has some pretty strong volume this morning ( Short Silver). It hasnt broken above the downtrend line tho
SOOOOOOOOOOOOOOOOO , this is MBOT and once again, it looks good ( It only looks pretty on up days, right?) 🙂
So the questions are:
1. Will it break free and just keep running this time? 100% or more?
2. Will it pop & drop & Keep consolidating as we have been seeing
3. Are you sick enough riding this that you will sell on the pop or
4. Does hope for a solid run have you holding on? 🙂
https://uploads.disquscdn.com/images/d320af47f0604ed94cf3c306bbd2161e825f19d0c00837ffe180324b76c41205.jpg
Been in MBOT for weeks, so I’ll take door #4.
I think I’ve been in it for Months (August?)! I sold a little on a pop a while ago, but the rest has been a good test for seasickness
#1…yes please , and giraffe-like if possible.
#2…no please SO boring.
#3…If it pops enough, yes. I already have an order in.
#4…if it suddenly looks great, I will probably cancel my order…at which time I am sure it will crash down….LOL.
LOL – great answer, though I expected most to ponder silently 🙂 Thx for sharing.
I think I kind of agree too. I said that I was going to sell it all on that 2nd POP in early October, but I still own it
Great answer!
GEVO’s been driving me nuts for weeks, but i think it too is finally getting its act together..
just needs a close over that 50sma, which will coincide with a break of the d/t line since sept.
SRRA has been driving me crazy. Traded it short term, wish I held on longer now.
And I agree on GEVO – Get over the 50sma is a good start
MXSG. I’ve been watching as they progress in fits and starts. Announced grades on their heap leach pad 4x precious estimates as they near production. Above the 10sma, broke above the 50sma on the announcement (I see it’s retraced and is back under), with volume up the last two days. (Not sure why volume is not showing on the chart.) Might not be able to escape a downdraft in the metals, but at least today it’s bucking the trend.
https://uploads.disquscdn.com/images/ec4016e1ada88f7362540736207310b7b84b2c1813b47b4d4e87462eb7b03876.png
Certainly a good one for the watch list ( I dont think I had it, so thanks).
If we get the sell off in precious Metals, it gives us time to do some due diligence too. 🙂
I’ve been hanging out with MU for the last 2 weeks…It’s truly something to be thankful for. Looks like it wants 50. Has really pumped up my portfolio. 🙂
MU has been very nice. I still like CY long term too.
I have really liked some Semis, and MU, CY, AMD were mentioned by me, but I used to own the company under ticker ONNN and I kept looking for it, and couldn’t find it.
Found it under ticker ON now, and it has been nice too.
Kenny, As have I. My IRA is loving it.
EDXC is over the 200 day for a change.
OOH- I have owned this for a long time (Over a year) , so I dont even look at it anymore, I like that move today and volume is increasing too. Above the 50sma and the 50sma has turned up.
I own this because I liked the fundamental story, their earnings showed increased sales, etc, but the price has been quite choppy. I think that I am liking the set up here- thx for posting.
Trying to get above the upper trend line
https://www.tradingview.com/x/w4y2PpZ8/
Yes!
UA first target hit, sold 1/4 at 12.00
Nice – I think it is gunning for the gap at $14 / 50sma too
I have 13 as my first sight, if I can get thru there, 14 is next. I just want this to close over 12 today lol
I own CY ON and MU. AMD is dead to me
Nice!! I agree on AMD. Taking a serious look at ON.
I lucked out on ON. Back on the 6th a limit order I thought Id never fill actually hit at 20.50. so been trailing stop ever since. I like MU the most however. Intraday volatility, no way im day trading it, but its keeping me alive lol
I’m holding on to MU till something changes…I’m not DT it either. It is still highly undervalued…Earnings come out middle of Dec.
Yea, well i have a PT of 50 on it for my first half sell and will re-evaluate from there. But earnings should be good. Just been burned bad on earnings twice this qtr… AMD and SNAP
I’m not buying AMD ( for a possible trip to $14) , but it did put that higher low in so far, that I discussed as a possibility. crazy huh? Each earnings release drops it to the lower trend line.
You could short it into earnings, and flip a week later. 🙂
Refresh
https://uploads.disquscdn.com/images/345efc872c4df8276102e5dea1ad8a8f2207d7831019315a48a2db9c8b552501.jpg
Check out CREE as well brother
Thanks…I appreciate it…will do.
I should mention that the weekly charts of these do look a bit overbought and might get a pull back.
I have actually been watching the SEMIs and should include what I am looking at in a future report.
It is a short week, maybe I’ll do that tonight.
Please do!
I will, Today would be good because it is Monday and the weekend report covered a lot.
Maybe I’ll discuss Precious Metals / Semis
Great Alex! Much appreciated. Looks like a good sector to be trading in, but we need your outlook. 🙂
SRRA moving higher……..
Wishing I held my TNA longer but still good gains for a two day swing
RIOT – A BUY in last Thursdays or Fridays report, up 20% today 🙂
I know Maria said she had it with me, but where in the world is maria?
with carmen san diego
hahaha!
alright u guys…………………… LOL
sorry .. busy and running by the seat of my pants these days….
yes im still in it.. ;o) also OWCP
picked up am
CDS, CNBX, GROW, MBOT, SRAX, NVAX
giddyup……………………
CBDS** not cds
ps. sold all of my EKSO on morning pop..
will look to reenter later
that’s my trading act
in swing.. still in AMPE, INFI, XXII, couple others i and how about that Overstock freakn TANK…dang gina… about to cut infi if it doest head north pdq….
nice trade!!! I got out waaaay too early but I guess chump change is…chump change.
and how about DQ… i stalked that mofo for yrs….an di toltally missed this entire .. well most of this move..
cant complain tho.. ostk has been a GREAT sloppy seconds… 😉
teehee
bye
ps. Do u think changes are happening.
pss. Do u think this could be a fakeout
lol
oops i forgot
psssss. Thoughts?
*UdontHaveThem
I have no thoughts on ur questions 🙂
#Rhetorical
thank you forRIOTcosts $8.34
CF, I want to add to TWTR but not sure if its a good idea where its at now… Thoughts? Still holding from 17.50 half my starter
Well, it was a high volume break away gap at earnings and I think you kind of missed the pull back ‘test’ of the high volume candle buy, but it still looks bullish here. Can it pull back from here? Yes. It looks to be in the middle of a move and it is difficult to predict how a stock will act in the middle of a move. Reversals and support levels are where you can best get an idea of what a stock wants to do.
Would like to add to my DUST, but waiting for volume in miners to show me the selloff’s for real…
You have a new look today
Yeah. Shave and a haircut.
GOLD was down about $20 , and GDX is down about 20 cents ( less than 1%), instead of the normal 3%.
Kind of odd.
just like Friday, except Friday was to the upside
True- so Miners seem to be flowing , but nor really leading or following as much as they usually do
VSTM… was waitn to see if it touchd down on that 200day…
but IDK… soooo .. i nibbled….
also likn MXWL
I am also seeing my short term daily stochastics not working very much, usually when set to 5,3,3 they predict turns well, but besides miners and metals not having follow through on their stokes, I am seeing it in things such as URA and even QQQ and SPY. I think we are going to have to wait for a direction to be decided, and for more groups to get in sync.
In short, I don´t see Friday or today as being overly bullish (Friday) or bearish today, so not much to be done barring special situations like the Mary Jane stocks today.
THANKS ALEX…… you don’t advice to buy DUST or JDST?
I had it last week and sold it all on Friday-morning.
Great work Alex. Thank-You!!!
When I said that RIOT was tough to ride, I was serious.
It dropped to the 10sma and touched $8.06 today, and then it just hit $10.15.
Swinging like Tarzan again, but thankfully higher.
https://uploads.disquscdn.com/images/a2e77b9f58aa100f9b94012c4c23925c45fb1edbc4940e661f613d11994a1043.png
*obvi he’s a litttttle more buff than u ….
jus sayn 😉
And I only eat 2 scoops but the hot fudge & sprinkles is a nice touch.
It really does look like MBOT wants to close above the 50sma.
WWR…..
Tuesdays report has been posted