
Nov 10th – Fried-day
SO MUCH TO WRITE ABOUT, SO LITTLE TIME. Today is Friday, the last trading day of the week, so a quick review and a discussion on a few trade ideas…
.
3 SPX CHARTS
.
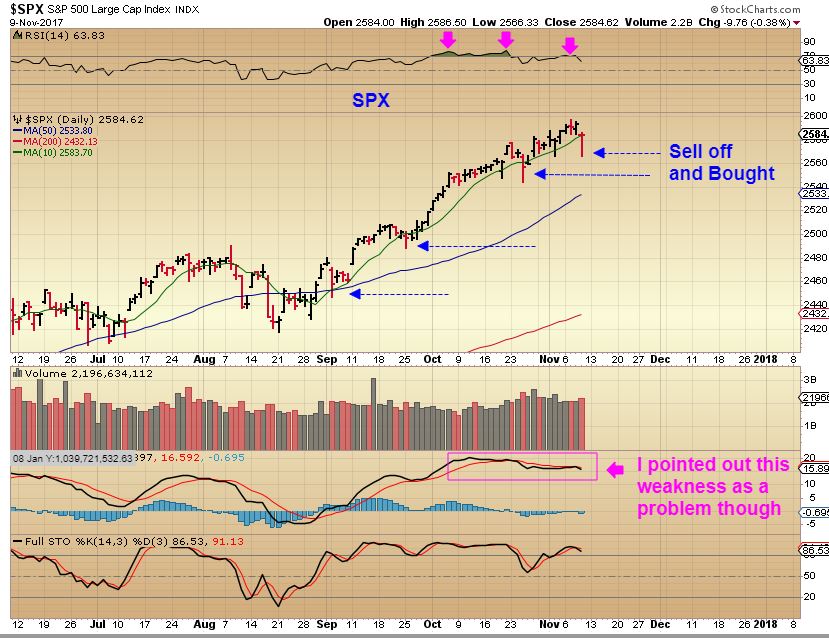
SPX#1 – Thursday saw the Markets gap down, sell off, and then start to recover, so we get another ‘buy the dip’ reversal, however …
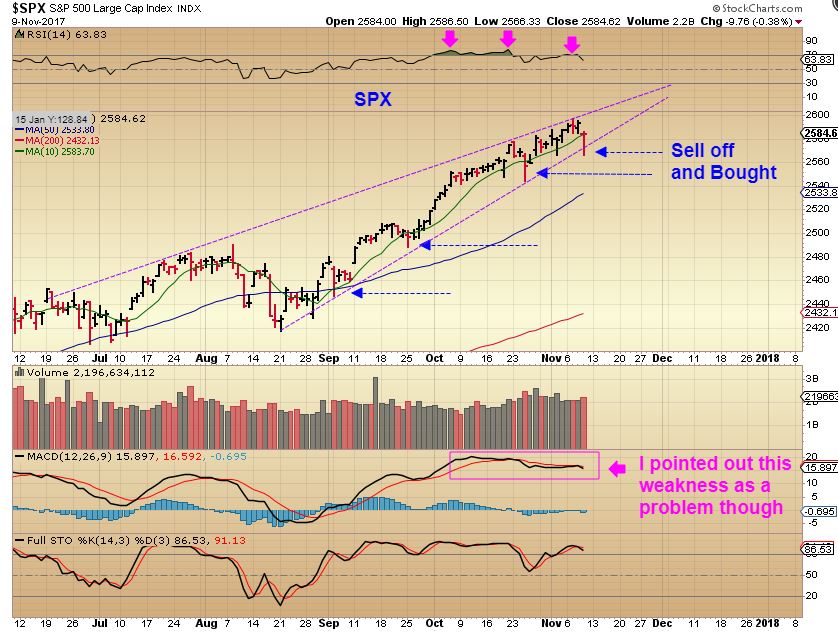
SPX #2 –
1. I had drawn a rising wedge in a couple reports earlier in the week. These are often bearish short term, especially if that MACD doesn’t correct itself.
2. It also BROKE THE TREND LINE ON THAT WEDGE, which raises a caution flag.
3. I have pointed out the divergence all this week, so now we could see a drop. So far it remained a ‘buy the dip atmosphere’, but we are close to the apex here, I’d look for a ‘reaction’…
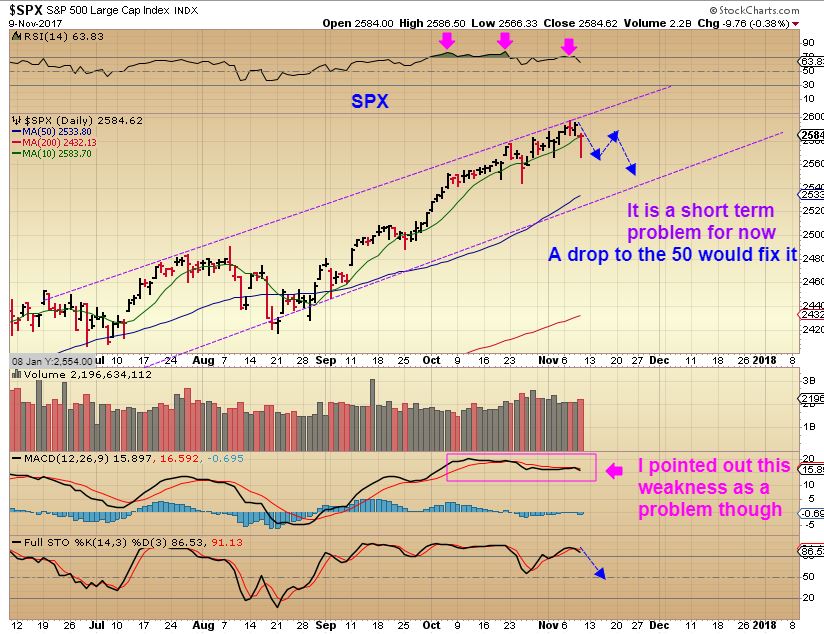
SPX #3 – Dips have been shallow lately. If we got a normal sell off ( Say to the 50sma as a dcl) It would undo that wedge and form a rising channel. We would have a visible DCL. A push higher and through the top would also change this to that parabolic run possibility that has been discussed here. I will have more in the weekend report.
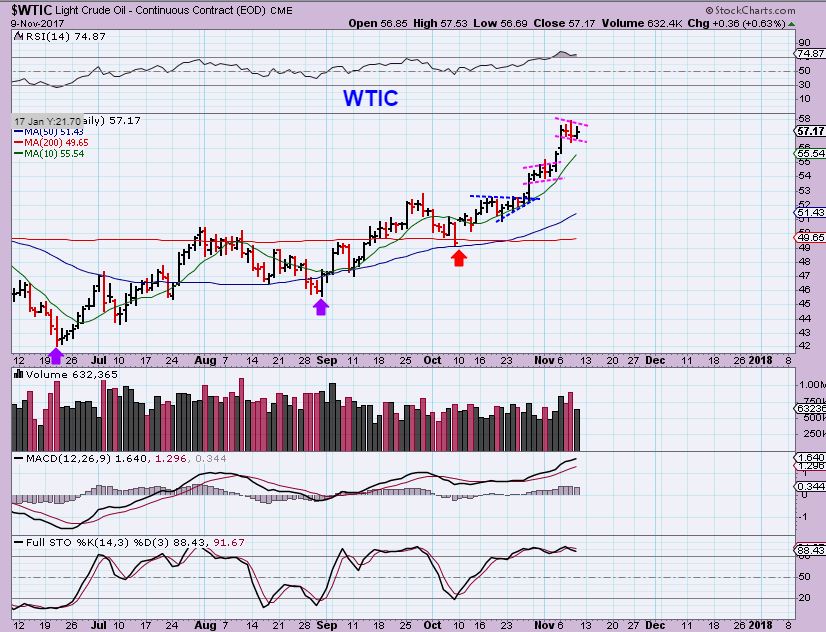
REMINDER: My Oil chart from NOV 6th, Oil is at a resistance area, but is quite bullish after the recent break out. I mentioned that it can pause, consolidate sideways in a bull flag, or back test the break out (All 3 scenarios keep it bullish).
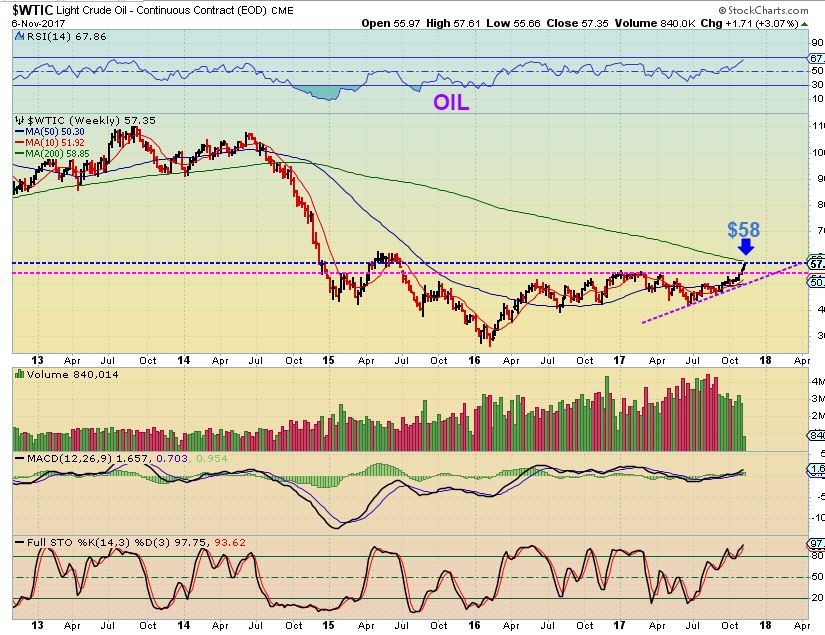
WTIC – So far we have the bull flag sideways consolidation. Is that hurting Energy stocks?
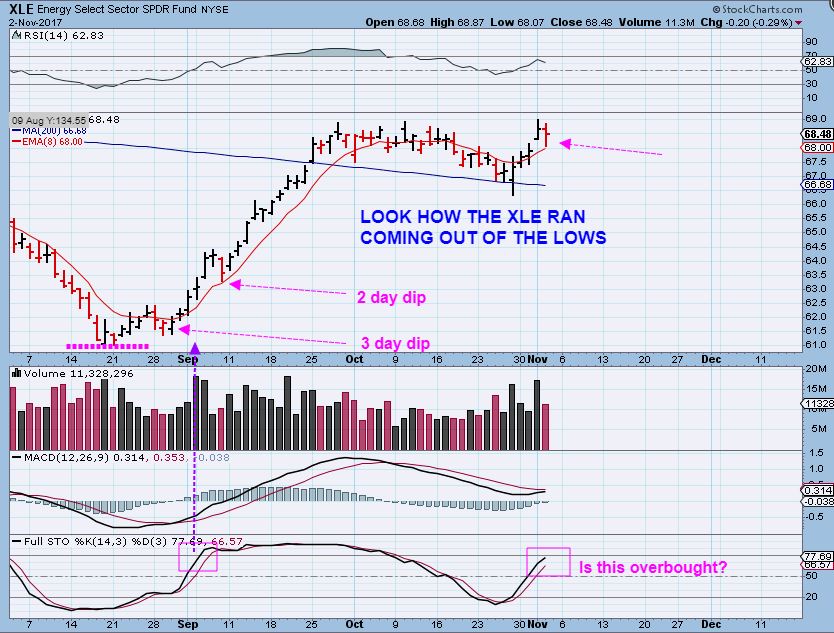
on NOV 2– I pointed out that we needed to be prepared to see dips , similar to the ones on the first run higher, in order to be able to hold on to our positions. I pointed out 2 dips or pauses in the first run for you on this chart last week .
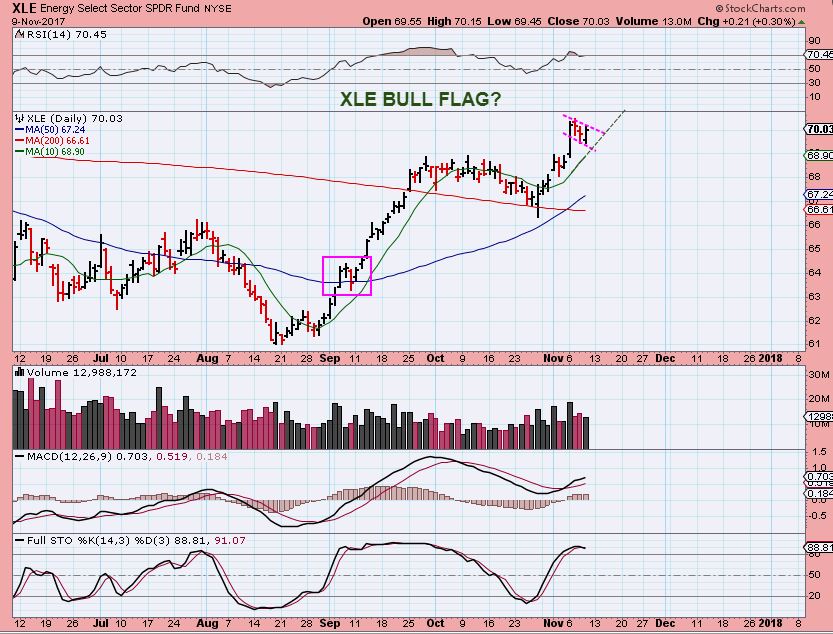
XLE – After that first dip, this is actually what I expected to happen too. A pause in the form of a bull flag, similar to the one in the 1st run higher. This remains bullish so far.
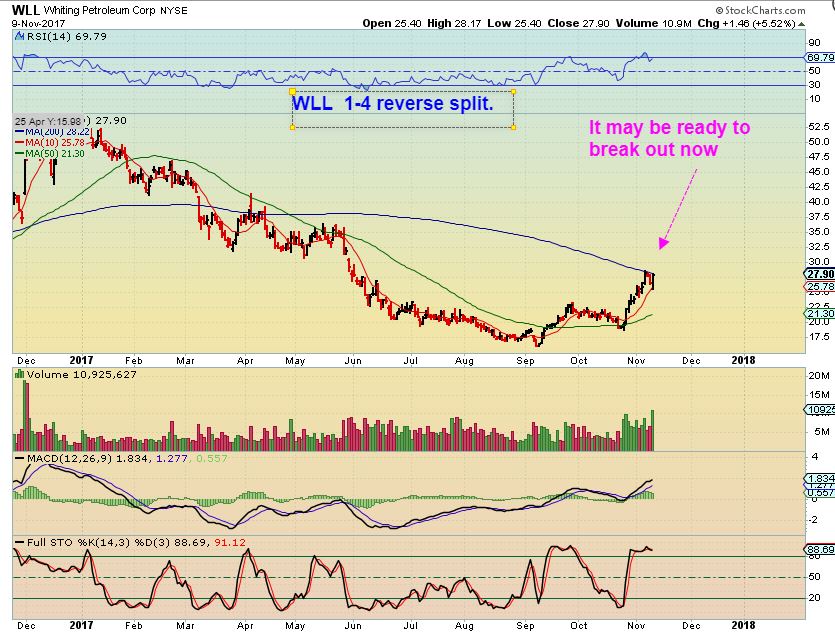
I am still holding my Oil stocks purchased weeks ago, with the exception on WLL. I mentioned on Nov 6th in this chart that I sold the 1st half at the tag of the 200sma. The chart was still bullish and fine, I just wanted to lock in gains as an active trader.
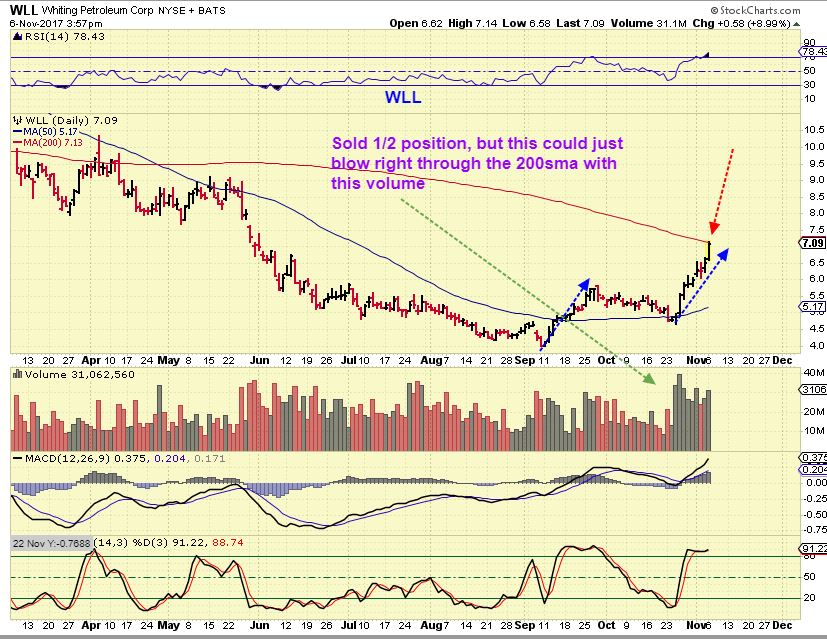
WLL – They did a reverse stock split and it tagged the 10sma and is now back up pushing on that 200sma. It may be ready to break out now after that small bull flag.
GOLD #1 – Gold is out of Sync with Miners, since Gold has not broken below Oct lows, and Miners dropped well below their early Oct lows. I am wondering if Gold is actually still inside of one daily cycle tht started at the purple arrow, since it did not take out Oct lows. I will simply say these 2 things again :
1. Miners are weaker than Gold
2. Gold & Miners are not in sync right now, so I am watching them separately …
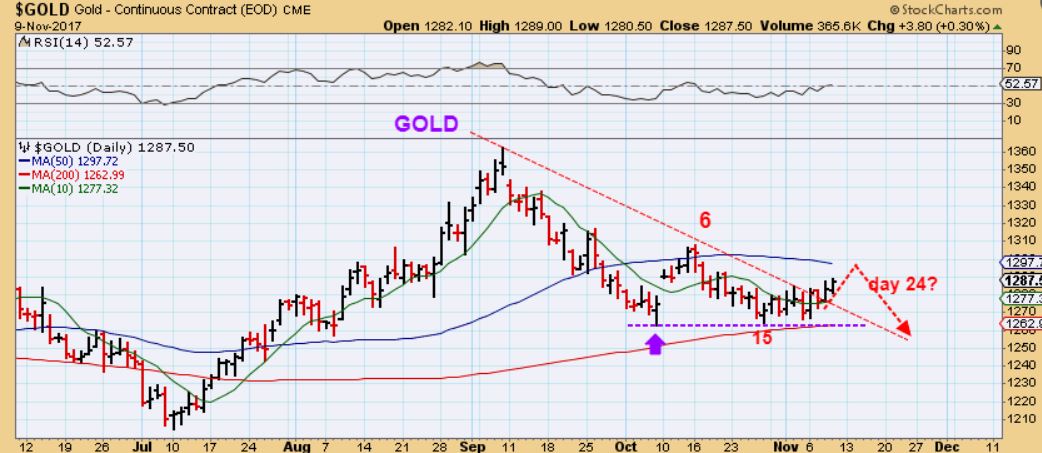
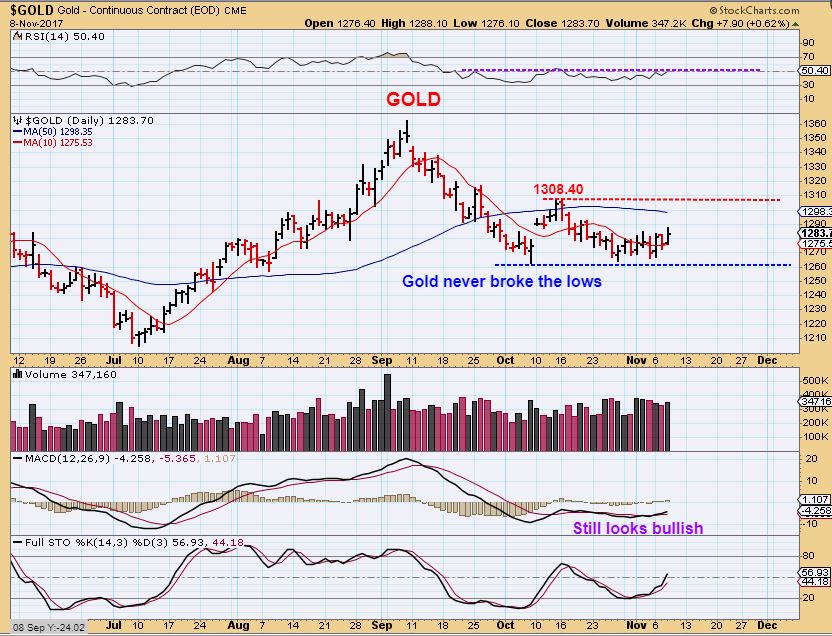
GOLD #2 – Yesterday I said these were my parameters, and I do NOT expect Gold to rally above the 1308.40 daily cycle high. The 50sma may hold Gold down.
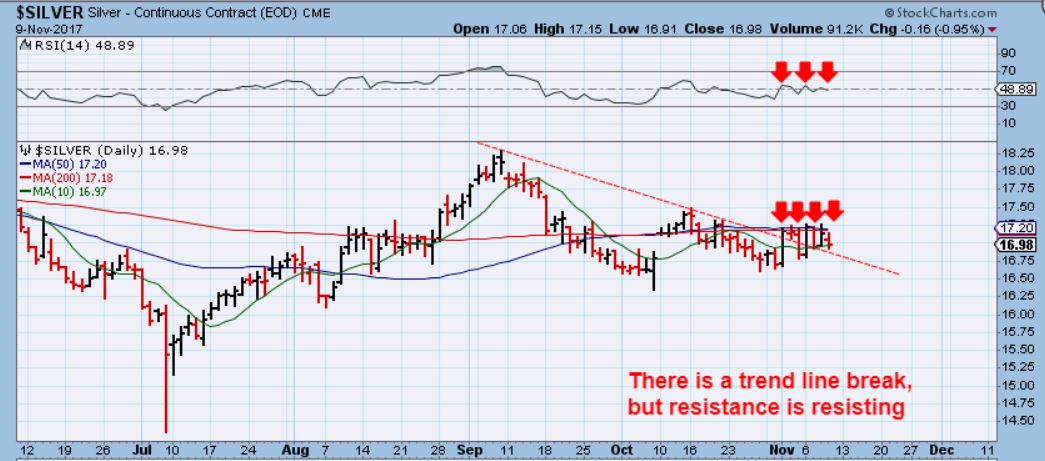
SILVER – Silver also keeps Popping every morning, but it remains under the 200sma so far. Let’s look at Miners…
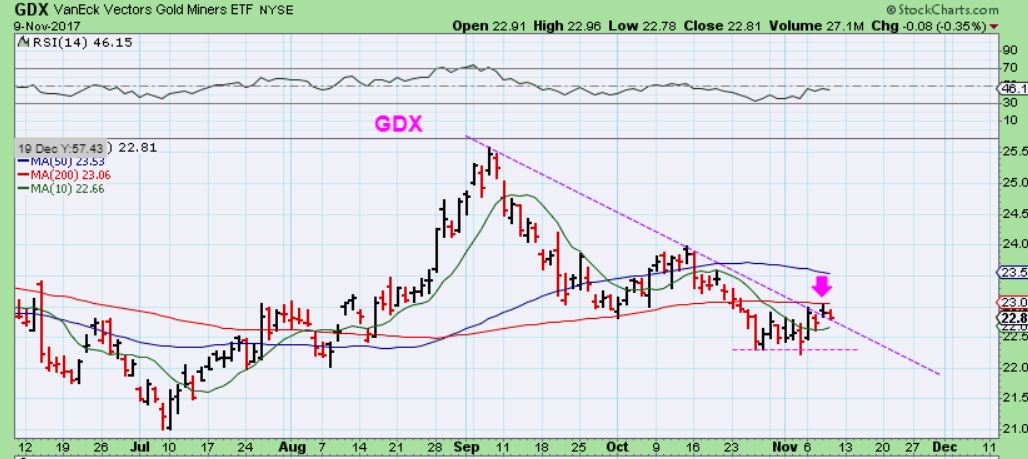
GDX – We do have a downtrend line break here, but no follow through. Price is being held below the 200sma, even though Gold has Popped $8 for the last 2 mornings. Notice the early Oct lows, price broke below daily cycle low. I have not recommended buying Miners yet, I think we have a deeper low ahead, and we have been doing well in other areas. Based on this chart, we have not missed a thing in GDX.
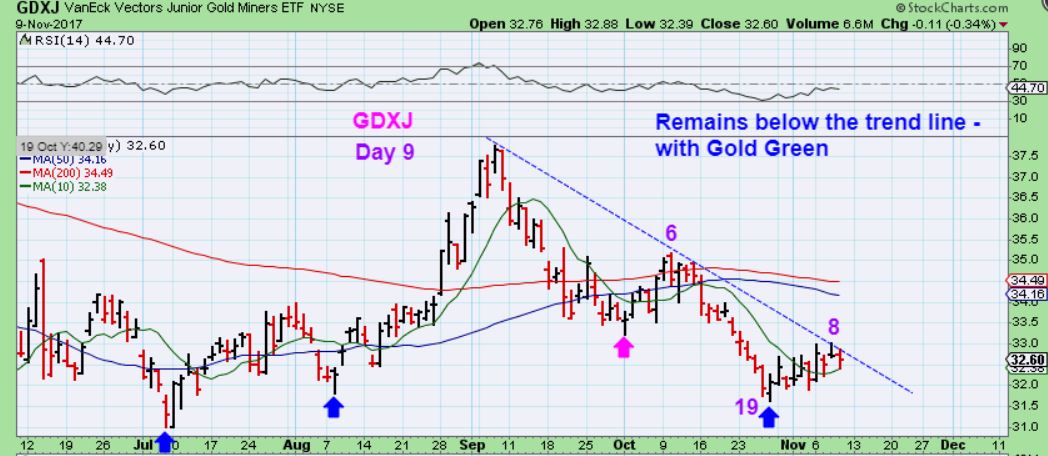
GDXJ – GDXJ appears to be on day 9, with a day 8 peak. I would expect a drop here soon too. As this plays out day by day, we continue to see it act as expected. If we saw any significant change, we could react within a day, but so far this is going as expected.
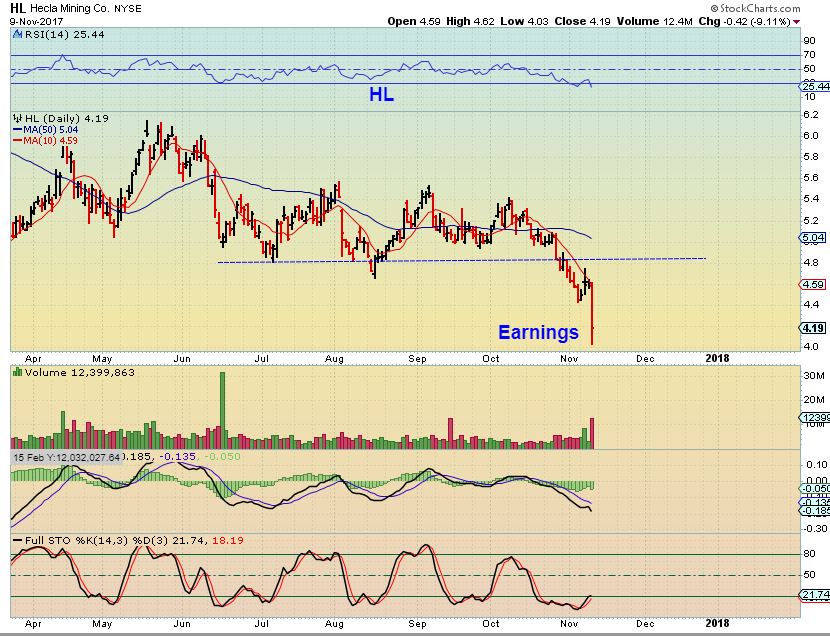
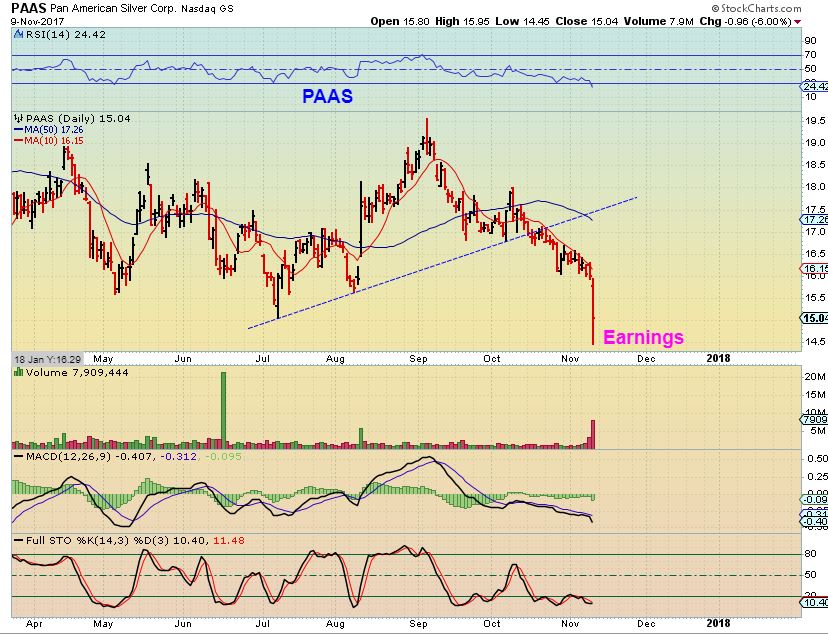
So I have talked about the mixed bag that is within the individual Miners. EGI, NSRPF, FNV, SA, IAG, as showing strength, but others like EGO, ABX, PAAS, etc down at the lows right now. Well, yesterday a few more miners released earnings and this is what happened.
HL – Slam to new 2017 lows
PAAS – Slam
SO I am not in a hurry to start jumping into miners yet, especially since my analysis points to a sell off ahead. I think we are going to get an Excellent buying opportunity that will produce great gains %-Wise after that drop. We get these opportunities usually only 2 times a year ( an ICL), and this is when you want to load up & enjoy the ride. Each person here can make their own mind up when it comes to seeing a Miner acting bullishly like FNV or NSRPF still trading near highs and wanting to start a position, but may I recommend starting small, so that you can add on the dips.
Enjoy your Friday trading and your weekend, I will discuss a few trades after signing off. Thanks for being a Chartfreak with me!
~ALEX
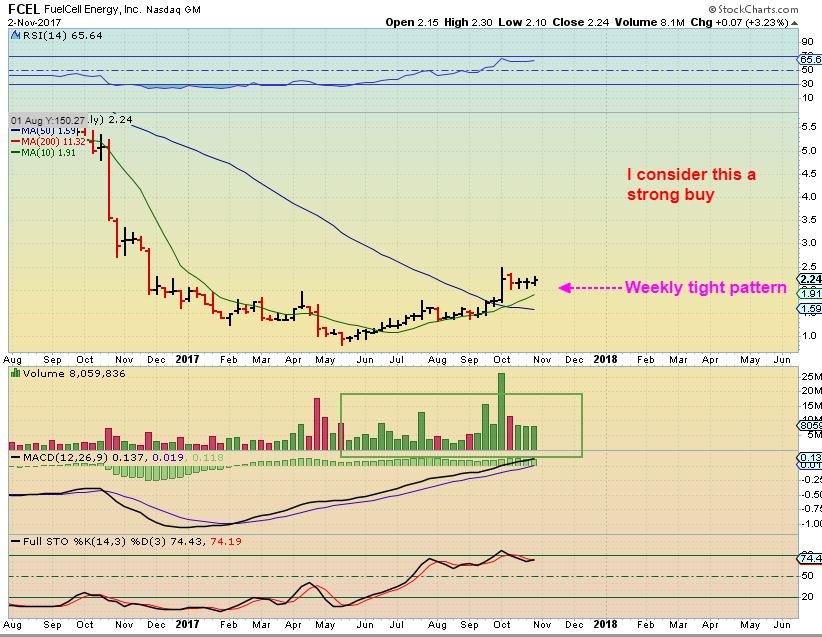
Let’s discuss the FCEL trade again. It was recognized last week as a weekly tight consolidation, often very explosive when they break higher. It is working over to the 10ma on a weekly chart. This trade remains bullishly set up, but I want to share with you one way that I often look at this trade.
FCEL – So on a daily, I would have expected it to continue sideways to the 50sma. Yesterday, it dropped down and may fill that gap as well as tag that 50sma. This is still a bullish consolidation, but that MACD caught my eye. That is losing momentum on a sideways move. Is there any other concern?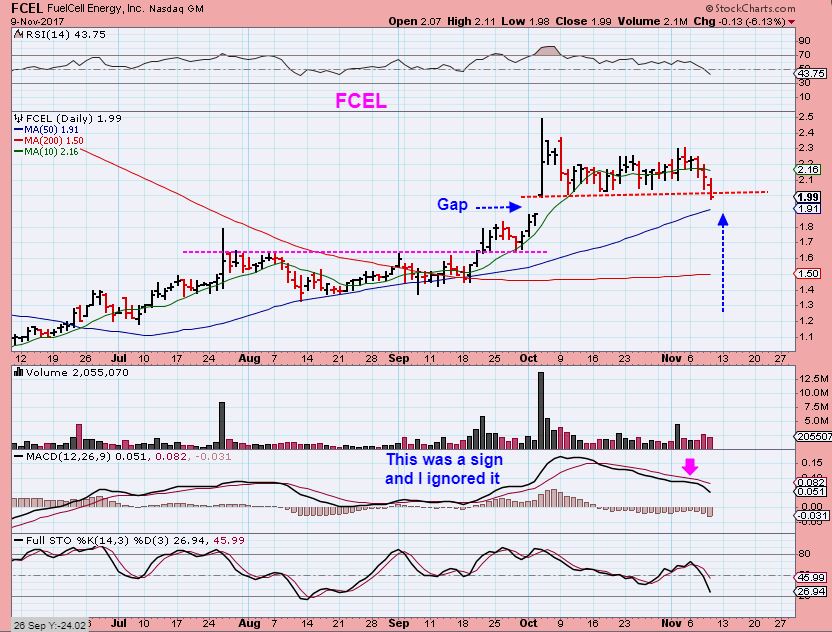
In my trading experience, I have always traded certain stocks together, and I have mentioned this in the comments section. With FCEL there is a small group that runs very strongly together and they always seem to move at the same time, even being weak at the same time. Those stocks are in a group of Power cell / battery / clean energy type plays known as FCEL, BLDP, PLUG, CBAK, etc. I usually see these run together, so I wanted to look at a couple of those and see what I am seeing there…
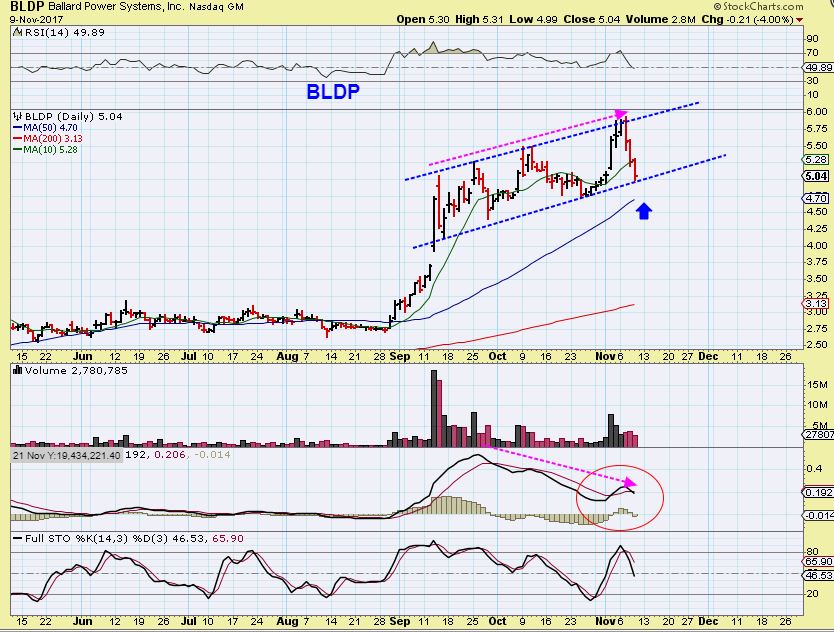
BLDP – Obviously, BLDP had a strong run higher too, as FCEL was trading higher, but it got way ahead of itself. This chart isn’t bad, it just seems to be dropping to the 50sma at first glance, but this MACD was warning of a drop coming too. And then I saw…
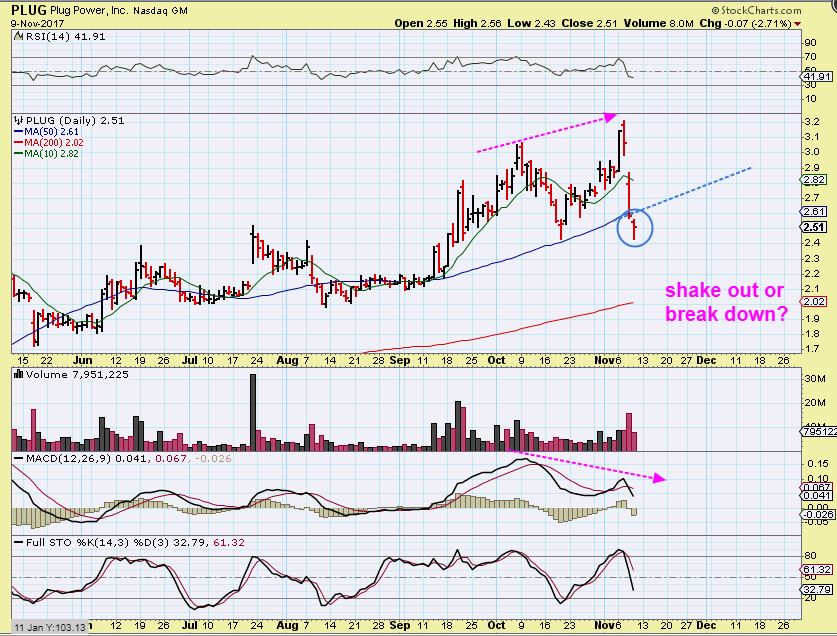
PLUG – PLUG also raced higher, double topped , and dropped back to the 50sma, but broke below it. Right now it looks like a possible shake out, since it was a reversal and could recover Friday. The problem? This is not oversold and it caused me to think that this group of stocks may sell down further? Now Back to FCEL…
FCEL – Honestly, this chart looks fine, but those other charts above cause me want to watch this one closely. A gap fill and reversal off of the 50sma would be great, but today is Friday and it breaks down & doesn’t reverse higher today, the 3 weeks tight ( or 4 weeks tight) pattern is broken. I haven’t decided if I want to sell yet or not, because really this chart is not bearish. I wanted to point this out to you, though- so that you can decide for yourself if you want to hold this with BLDP & PLUG dropping from their run higher, so swap it out for something else. Again, the chart is fine, and maybe a mental stop is just fine…
IF I DECIDE TO SELL & GO TO CASH FROM FCEL, I CAN WAIT FOR THE DROP IN MINERS TO USE THOSE FUNDS OR I CAN FIND SOMEWHERE ELSE TO PUT THE MONEY. URANIUM STOCKS POPPED NICELY ON THURSDAY ( URG, WWR, DNN, UUUU, UEC, etc) and we discussed it in the comments in the morning when they started to take off. I cant ‘recommend’ them as low risk entries until they pull back, but experienced active traders can trade them as they see fit. I will keep an eye on them for bull flags , pull backs, or other entry points. Let’s take a look at other possible opportunities out there…
ADD THESE TO YOUR WATCH LIST-
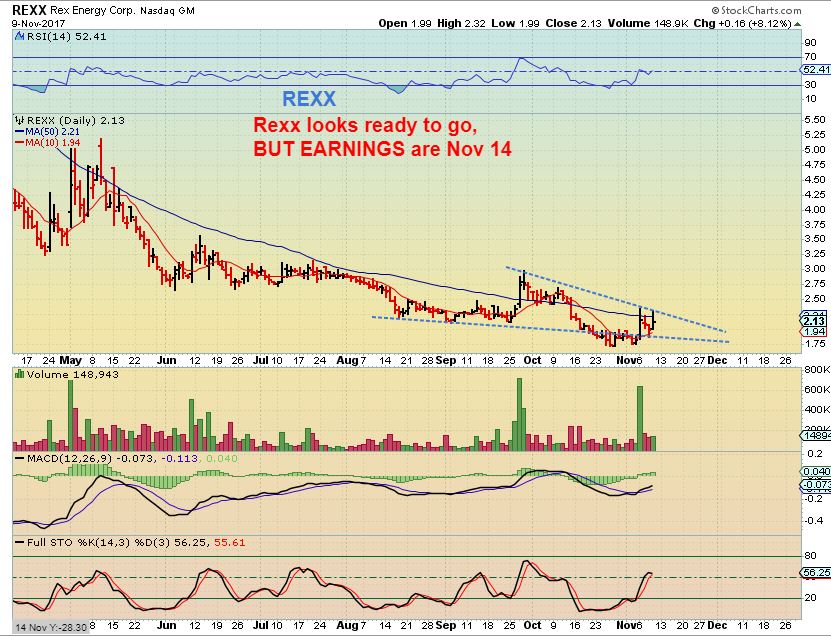
REXX – I really like this set up, but they do not release their earnings until next Tuesday, so this is on my watch list. A break out here could really run.
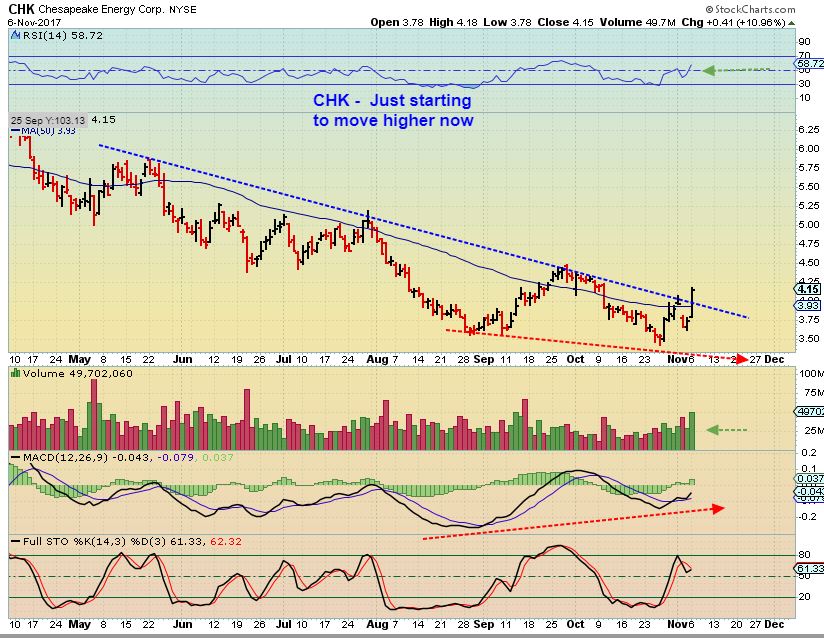
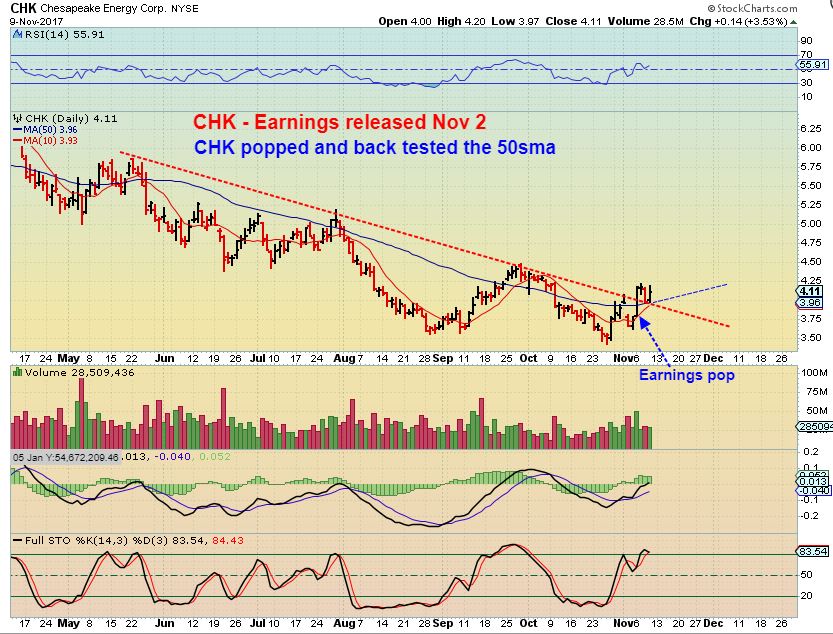
CHK – CHK has released earnings and I pointed out this POP above the 50sma and down trend line as a low risk buy. That was 3 trading days ago, did we miss the move?
CHK- price is actually exactly the same. It has now back tested the 50sma and trend line. One could actually sell FCEL and Buy CHK is this set up here at support seems less risky that FCEL.
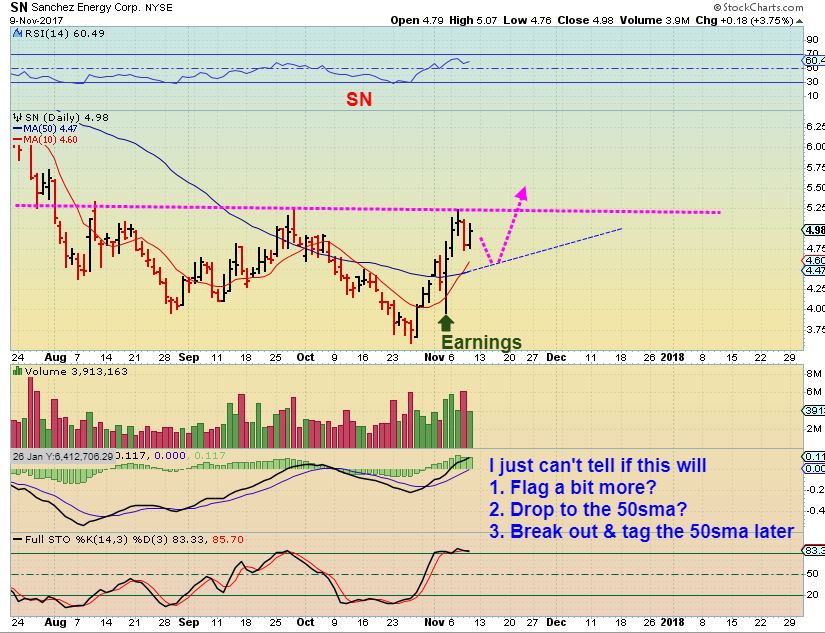
SN #1 – SN also released earnings and did a strong reversal at the 50sma, as pointed out on this chart. It looks like a mini bull flag, and I wanted to take this view so you could see the upside potential, but I’d also like to zoom in…
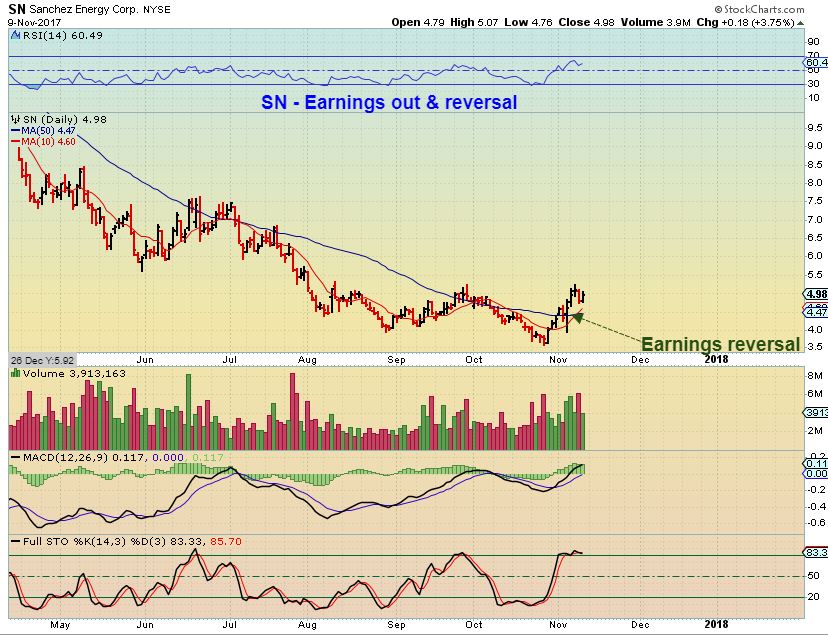
SN #2 – Here we see that reversal at the 50sma, and a push above recent high points. It MIGHT tag the 50sma in a back test, but I believe that SN is building strength to break higher. Please read the chart. If you see this breaking higher Friday, it could be starting another leg higher.
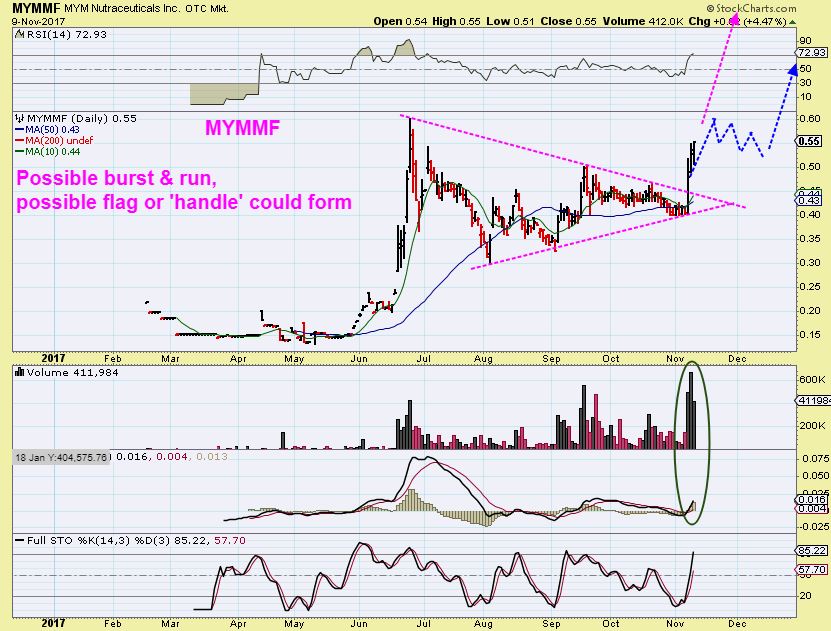
MYMMF – I’ve been pointing this out for a few days. It is almost at my original 60 cent target. I have been asked if this is a buy & hold candidate too. I would say yes, it could just continue higher or it may add a ‘handle’ and then break higher. It does look longer term bullish. I plan on selling 1/2 at the 60cent mark, since that was my original plan.
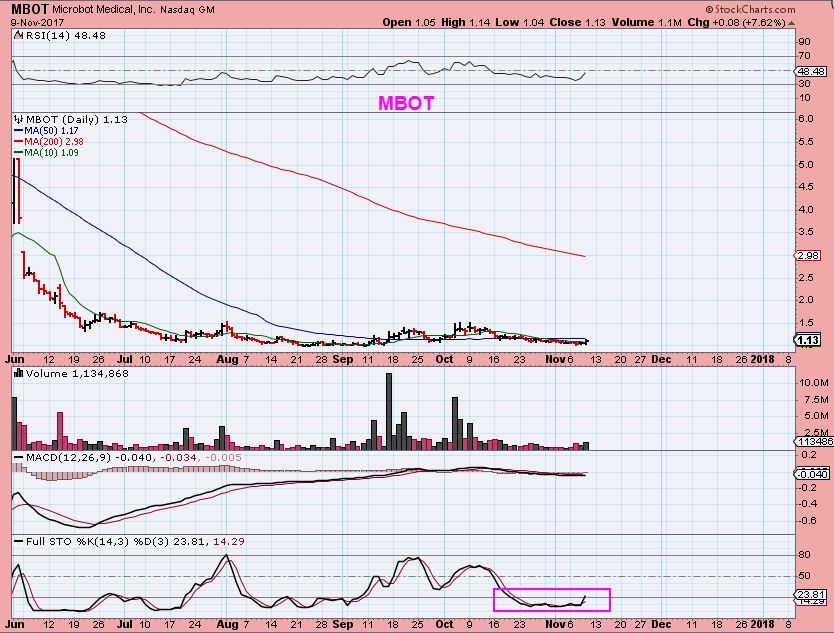
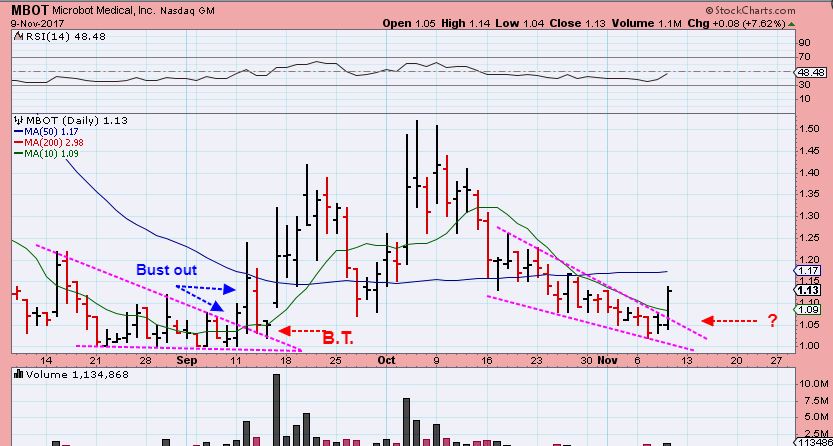
MBOT #1 – The big picture, I’d love to see this move over the 50sma area again, it did move above the 10sma. This looks like an easy ride from this view, but this has given us 40% gains, taken them back, added another 40%, and dropped again. It is very oversold and may be ready to go again. Let’s zoom in.
MBOT #2 – It doesn’t even look like the same chart, but here it is. It ran from $1.00 to $1.40, dropped to $1.07sih, and then ran again to $1.50+. This looks like it is starting to go again, it is above the 10sma and broke from a downtrend line.
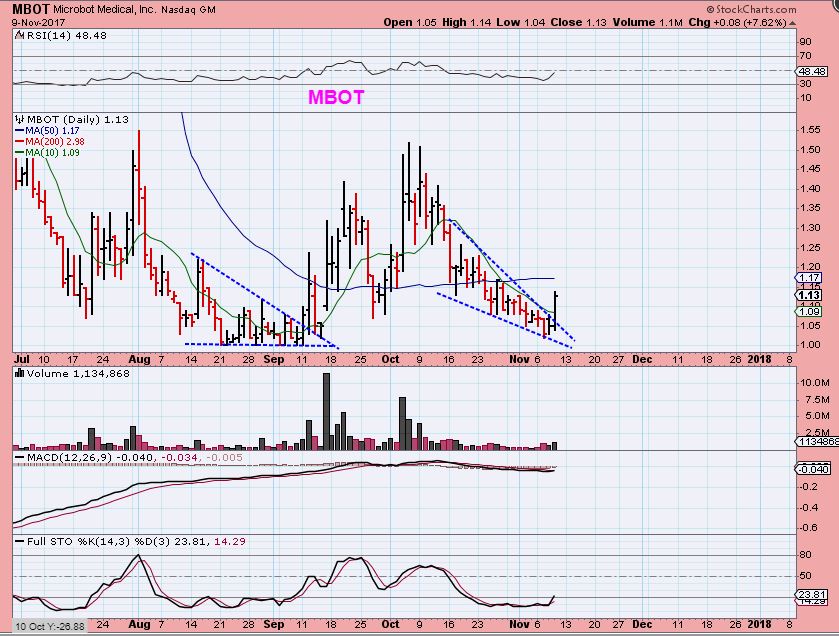
MBOT #3 – The 1st time it broke out (blue arrows) it did drop back sharply to back test ( red arrow). Will that happen again? No one knows for sure, but I wanted you to see that in case we get a dip.


Great report Alex!
Have a wonderful weekend!
Thx- You too Zig!
Thanks Alex – do you see any possibility that biotech stocks are headed for an ICL right now?
It is possible, that is why I had the charts of LABD and the XBI in my report yesterday.
I was looking for a break out in LABD & break down in XBI – if we get that, it could escalate selling.
So far yesterdays move formed reversals, but its something to keep an eye on.
Thanks, Alex. I’m ready to reduce or sell my positions, but don’t want to get caught in a trap. If you have additional insight intraday, please share. Thanks again.
CREG is $7 in pre-market . It was a bit over $1earlier this week . Crazy chart.
Cf i kno this chart looks like a bears dream long term but what bout this current base? DKS
It looks good, as log as they dont have earnings out soon.
PGH is down 15% in pre market
yes,
Earnings release last night – Earnings call this a.m. at 8:30 eastern time. That’s why I didn’t recommend this one yet.
Some of these earnings reports are leading to a pop, others a drop.
Alex,
can you refresh me which Marijuana stocks are in your list? I lost mine and would like to reconstruct.
thanks
I have about 40 & them, but that list is not in front of me right now. I can check later, but
If you meant the ones that I mentioned that I own as Canadian I own MYMMF, OGRMF, and APHQF as of about 1 or 2 weeks ago. There was also ACBFF, MEDFF, and TWMJF in that group.
Others off the top of my head were CNBX, EDXC, CBIS, CNAB, CANN, REDF, AMMJ, BLOZF, MJNA, and a TON more 🙂
thank you that is more than enough
UEC..nice
Bear flag breaking on JNUG? If so, is there a projection for the low?
What’s with LCGY? Is it not trding?
I show it up 1 cent
INFI … wow… spike down this am just like pattern.. THOUGHTS CF ………………… 😉
hope it continues
https://www.tradingview.com/x/iXUOsyNX/
My honest thoughts are that you start your overlay in the middle of the base, so it doesnt give me enough history to know if that underlying pattern is also breaking from a base? Was it rising in a steady climb? was it coming out of a steep drop off and descending wedge pattern before starting where you picked it up….
so my ‘thoughts’ are that I cannot compare ‘apples’ to ‘apples’ , if you give me 1 apple to compare with the overlay of a 1/4 of another apple.
#SorryYouAsked? lol
so u’ll have no thoughts on this either then? lol
https://www.tradingview.com/x/bDdId3D0/
ill try and inc more info … but mostly if im counting waves… 1=5 OR A=C … generally – so id take that …
No thoughts 🙂 – Its comparing the start of a run up ( The overlay or underlay) that could be on 1 of 5 to a move that could be 3 of 5
is this what ya mean?…
shape of wave1 ≠ shape of wave3 ≠ shape of wave5
Well, yes, kind of if I understand you correctly.
Maybe more like it may or may not = it. Wave 1 might be exactly like wave 5 , wave 3 might be longer, but I think that seeing the history leading up to that run ( on the overlay) is important to understanding how that run higher came about.
It is hard to explain what I’m saying in words though 🙂
The overlay as shown may not even be a part of a 1-2-3-4-5 move higher, it could be part of an a-b-c correction ( the b wave) and it could be in a different time frame. So it is just hard for me to compare 1 run moving higher to the move out of a base on another – if that underlying run didnt have its own base included.
yup.. same here.
Seems that the context & preconditions of a wave matters.
I’ve tried to shoehorn previous wave patterns into other scenarios myself, and it just wont play that game
YES- you put that clearly in 1 sentence 🙂
“Seems that the context & preconditions of a wave matters.”
lol.. yes.. using Fibs helps tho… because if I “think” this is a 4 of 3 lets say…. then presumably this last leg *should* reach the 1.61% …. thats how I use them… anyway…
i recognize what i *think* is a similar pattern… and when I overlay it.. if it matches the Fib projections for each of the coming waves then I do paste it as an “light” overlay to watch and see if this is similar…obviously patterns break… and if a stock im watching breaks down..when i “thought” it should break up…. then i move it to 2nd hand watchlist… ha.
im always really wondering.. is this Logic correct? How would you draw this chart & projection… either with lines/arrows or Elliott wave impulses…
am I getting warmer? lol
i can talk later about it… gotta run
so … i guess just based on your expert technical analysis… could you see this pattern continue… you know like how you use Elliott Waves in the report……………… L .. O .. L
Which pattern? If you mean the blue one that you have overlayed above? I can’t tell what its history is….it could be a wave 1 run to a temp top, it could be a wave 3, or a topping 5. I can’t tell from just seeing 1 leg of the run.
Hope that helps
sorry im not making myself clear… pretend u look at the chart for the first time… and you do your workup on it…. that’s really what im wondering i guess… how would u draw it… what would be your projected path it *might take… is that better? ;o) Im trying to see if im WAY off … or close… so I can learn what to look for …what im missing that would disprove or approve my logic…
comprende?
#LearningAdventure
Ok, I didn’t understand that you wanted my opinion on INFI alone?
Yes, I could see it follow that path when I just look at the chart alone. It could form a cup as it runs back up to recent highs.
yeah… i dont care about my counts or anything … just looking to learn the logic of why/how this “projection” could be wrong… ie. macd, stoch, volume… whatever it may be that would disprove my theory…so i can learn to look for that in the future… Its all about the logic….
#DieHardLifeLongLearner
MYMMF- this is the trade that I detailed saying that it would run from 40 cents to 60cents ( That is a 40%+ gain) and I would sell 1/2 and let the rest ride.
It just hit 60 cents, I am not selling any at this point, based on the fact that volume is really pouring in. My experience is that if it is about to break to new all time highs and volume really starts to swell, I trail it with a mental stop.
RRC movin on up .. got an initial target of around 26.00
.. thats one of the good lookin nrg bases. btw
(in case you were wondering)
NAK still working on that break out – its been a long strange trip 🙂
Would you add if it breaks over near term resistance of 2.20, Alex? TIA
Hey Ed, I just got back in from of the screen, looks like a better set up to add might be if ti puts on a small handle toward the 10sma ( or a bull flag).
I do believe that someone said that NAK has earnings next week? MIGHT want to wait for that to happen first
WG rebounding from devastating losses of yesterday.
ENPH is on the verge to breaking the 2 year pattern of lower highs & lower lows with a close over $2. Resistance up ahead. CF, is we move into resistance, what are your short and long term targets?
https://uploads.disquscdn.com/images/7e755509cf856c76f40f607d70b06d519270534ad88b40832c47ecf98cbf5918.png ?
I had a $2.25 short term, but it looks like it could exceed that.
refresh for my chart from September.
The long term chart that I had in past reports shows that is it starts trending higher out of this base, it could do very well.
https://uploads.disquscdn.com/images/1214e8ed5a29f51c83eb98ed6dd7d38f143195156242d9efc4f48f3d723ca182.jpg https://uploads.disquscdn.com/images/d2d317bc73c8eae9901c1117cf1674d05e41befd9d4d6d16b08290a3d68358a2.jpg
Thanks CF! I have a similar short term target where I hope to take partial profits.
yesssss…
I usually ask first then think… But this time, I bought NFLX and now asking… CF what u think. lol..
I like it where it is right now, off the trendline on the daily, sitting on the 50, could move sideways a bit. 190.25 entry, 189 hard stop, if it triggers, looking to add around 186 again as this thnig has a pattern of poppin and dropping after ER, but never breaching the 161 fib when it comes back. Looking for an initial PT of 200 conservatively..
Freaks, feel free to spot out any flaw in my plan
It has been a great stock & a great run. It looks good on the 50sma, but you know how these often do a small shake out now if they are not oversold yet.
I didnt like the MACD looking like that as it makes new highs, so usually it drops and tries to re-set momentum. As long as you have a stop – you are in a stock that has been in an amazing bull run.
I set my stp tight CF.. risking 1.25 for even a lower high of 200 im ok with either way… I feel the RVR on this for me is great…. Thanks for the reply
i now its too early to celebrate, but up a buck already – cant be mad
make that 2.00
EAT entry at 32.50 working out really well here
Alex, Any thoughts on $EKSO? Didn’t catch the bottom but seems a lot of vol. breaking down trendline going back to April. and IF it cracks 1.40 may make a run to $2. Does that seem reasonable??
Refresh – 20 %
https://uploads.disquscdn.com/images/4e6db746dd18c01964f9e5a6b74c937e7afda7baf37b4024731808c5f7c38d92.jpg
Here we go, getting qa little pressure on gold, looking like GLD wants to come back and tag that 200 day MA.
ZYNE
JCP… wow.. lol i thought retail was dead?
Oh it is lol… Dont they always pop at Fat Man Chimney Time?
yeah … if ONLY i had time… that CREG… w .. o .. w
CREG was sweet.. ROKU on fire today.. CRCM looks like a nice short…
nope…
“M’
M beat earnings…. still not touching it yet
PIR KSS BONT…lol
picked up TANH tiny tiny starter
Short swing OAS 10.70 – stop loss tight 10.80 looking for 200 sma test.
EKSO…breakout…
MYMMF – at 74 cents! NOW should i sell 1/2 … And add it to my OGRMF position for when IT breaks out? 🙂
See also ACBFF
KLDX – AGAIN. Earnings, and that used to be one of the good guys, now 2017 lows
wow
Seems like just as many miners, if not more, have been getting clobbered as have jumped. It´s like they are taking turns getting hit.
And some that POPPED will give it back during an ICL sell off.
IAG is an example of one that Popped the other day after earnings, but is dropping for a gap fill and who knows if it will drop even more. The 50sma rejected it.
VJET had earnings last night and is actually up 10%.
I think it was DDD that did the opposite.
Alex – STLD was recommendation a while back. It’s been in a consolidation for a while now. Do you view this as a bullish consolidation?
2 charts here, so you can see what has happened…
This was a STLD chart that I used in a report at that time around $36 – $37. It actually broke out and ran to almost $40, and has dropped back to $37- you can see on the 2nd chart that it looks like it could be a back test. If it drops back down inside of this consolidation, then it could just keep churning and consolidating like this. I would say it is long term bullsih, but is taking its time getting into that next run higher….If you look at a 5 yr chart, it is a bullish chart long term, but if your patience is wearing thin, you could cut it loose. So far , it is ok, just not a spectacular run yet.
https://uploads.disquscdn.com/images/7d862810ac5ae4188e5c3d7573e39aa811e834cc57cc25dcf4451192e0dd4181.jpg
https://uploads.disquscdn.com/images/6286d096a693562c97dc7b8825046e9fd1ce5f3ebdd452e1fdec4232ef472718.jpg
That really helps. Thank you. Crossing my fingers for a back test and breakout!
Added AAOI at 44.50 – starter
Looking at HPJ and the 50sma – it may do another bounce
Edit: I looked at the chart again, it usually does a little 50sma shake out before running, so I’m not sure if todays move is the start of the next run, or a fake out – then shake out – then a run?
CF, I want to add to my remaining TWTR… what u think about adding here?
You could add a 2nd chuck with a higher stop on just that 2nd chunk ( like 19.50 JUST IN CASE it is really doing an a-b-c down. It looks like it is not though. A power break away gap like it had on earnings often doesn’t get filled.
I like it.. I set a buy limit this AM at 19.50 actually lol and of course it didnt fill.
😀
ive been meaning to plot these two cuz i thought they looked similar…
wow… 3day chart .. NAK and HPJ
https://www.tradingview.com/x/0MqhYq6S/
you can see that inverse action on 1/2017 .. cray cray .. i see that a lot …
ALEX….. what’s your thoughts on Biotech? I think LABD looks still bullish?
THANKS A LOT ALEX !!!!
Hi Geurt,
I covered it in yesterdays report and mentioned to watch a specific area for a break down or break out using the 2 attached charts.
SO far , there was a break down in XBI & a break out in LABD yesterday, but with no follow through today. I personally would wait for a recovery or there may be follow through next week by way of selling in the xbi, buying in the LABD,
https://uploads.disquscdn.com/images/76e624c70459e996102055dd670d8bfc0fab52b52acdf43ab9577b65f281d670.jpg
Refresh, I had the wrong chart above…this would be the POSSIBLE break down in XBI if it occurred and it has
https://uploads.disquscdn.com/images/39b08f37290449c56968becdea74590f2ae04159917d89b2bdc0f2d37181a3ff.jpg
ALEX….. I will give you a big THANKS for your help.
I know you were talking about it yesterday, but didn’t know where and how to response this afternoon with LABD. I own some of it.
Wish you a blessed weekend.
GGIFF has had a two day shake out which really had me doubting my sanity when I doubled down yesterday with a purchase. While great to feel vindicated in holding I must admit it leaves a bitter taste.
dunno how you guys have the balls to buy stuff so high up… +2500% since August.
gives me vertigo.
i am only really comfortable buying stuff thats in the basement, or at least has been trashed for month after month, preferably more than a year.
refresh f5 for my edit 🙂
The tag of the 50 sma and gap fill on FCEL was almost TOO perfect.
My chart has gap fill at 1.89. Low of the day did not quite make it. But I would rather just go up again.
bullish 🙂 very nice easy/clean count too… i like it
Thanks, Nancy, I did not look close enough 🙂
It does look too perfect with that tag of the 50sma and reversal, but I like it
I’d had a bid in at the 50 for a bit now. Took a nibble today, I can exit early next week if this is a fake-out.
LABU came within pennies of stopping me out before heading back up a bit this afternoon. Phew.
A little more follow through Monday would recover a break down that I was pointing out. That would help ( or even before the close today).
I gave up on it today, which means off to the moon on Monday lol.
Peter, hope you are Right. I mean, sorry that trade didn’t work out better for you.
Yeah, I was already in when I saw your comments this week. Gonna hold through Monday to see if we can recover from here. Stop right about $72, and will leave it tight for now.
well wasnt a huge day for me monetarily – however, my confidence is boosted significantly, NFLX played out exaclty how I drew it up last night, and so is aaoi and twtr. so feeling really confident again is worth more than realized gains to me… About 660 in unrealized gains on both twtr and nflx, and 80ish$ in AAOI all swings for me. these follow my targets and itll be a nice 4k potential closeout when/if they hit. Stops all set tight. have a good weekend
Oh and DAMN U HOS
Yeah, that wasn’t the bull flag that I was hoping for 🙂
I’m hoping that it is a drop to the 10sma, and not the 50sma. Light volume compared to that move higher though, still looks like just a normal pull back.
When I entered MYMMF, I mentioned that it had a minimum price target of 40% higher, and i would sell 1/2 there & let the rest ride. It has been rising each day since then, and Today at the close MYMMR is up almost 40% today alone, and almost 100% from that original entry. Congrats ( I know 2 people followed my trade in MYMMR – even if you sold today, 70-100% is a great trade).
This is NOT any kind of bragging about a trade, it is to point out a sector that is really outperforming (And many MJ stocks did last year Oct – Dec too). It is to help people to see that these can break out & run strongly… Even 100% in a couple of days
THAT SAID, see charts of…
-TWMJF, MEDFF, ACBBF – these have really out performed ( and now ad MYMMF)-
I think that OGRMF looks ready to go as soon as next week, so I have been mentioning that recently.
So I own MYMMR, OGRMF, and APHQF and mentioned that I had been researching this area for the last couple of weeks.
There is another one that I have had my eyes on, and the chart set up is looking quite good. I need to do a little more research on it to be certain, and will put it in a report soon if I see that they are likely to be profitable in this area too.
Have a great weekend everyone.
EKSO…I mentioned earlier that it broke out…up another 13% after hours. Enjoy the weekend everyone.
The weekend report has been posted