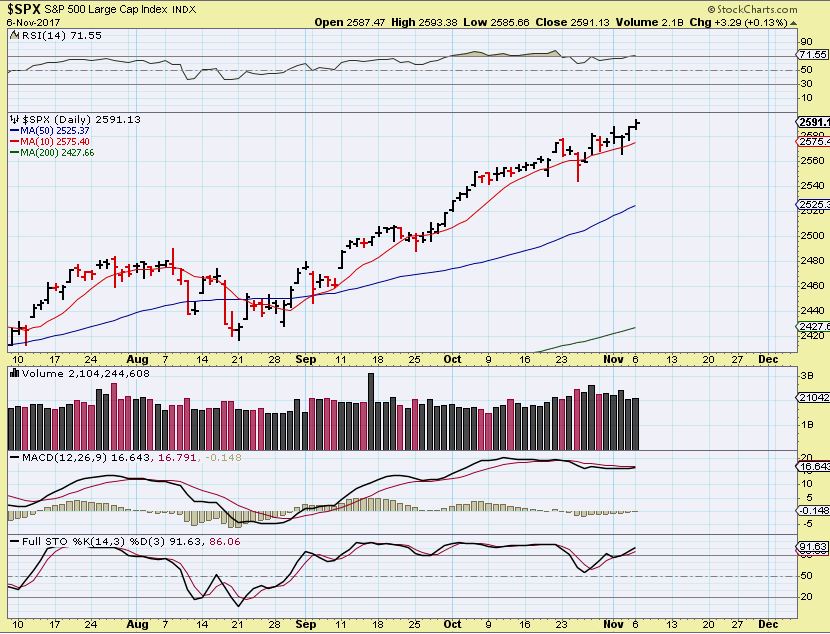
One trading day after the weekend report and expectations have not changed, except that almost everything improved, so let’s take a look…
SPX – No change from our expectations
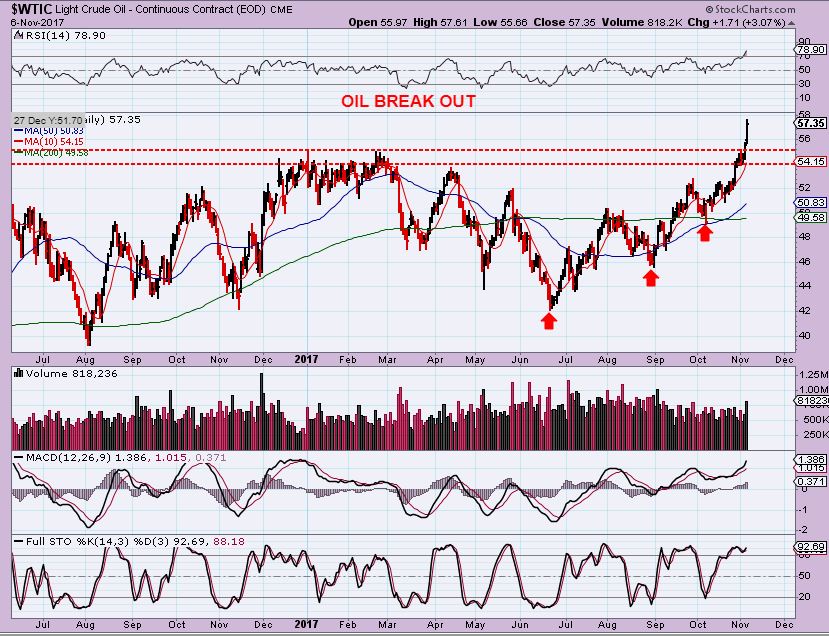
$WTIC #1 – There must have been people shorting oil, because it popped and broke higher by 3%
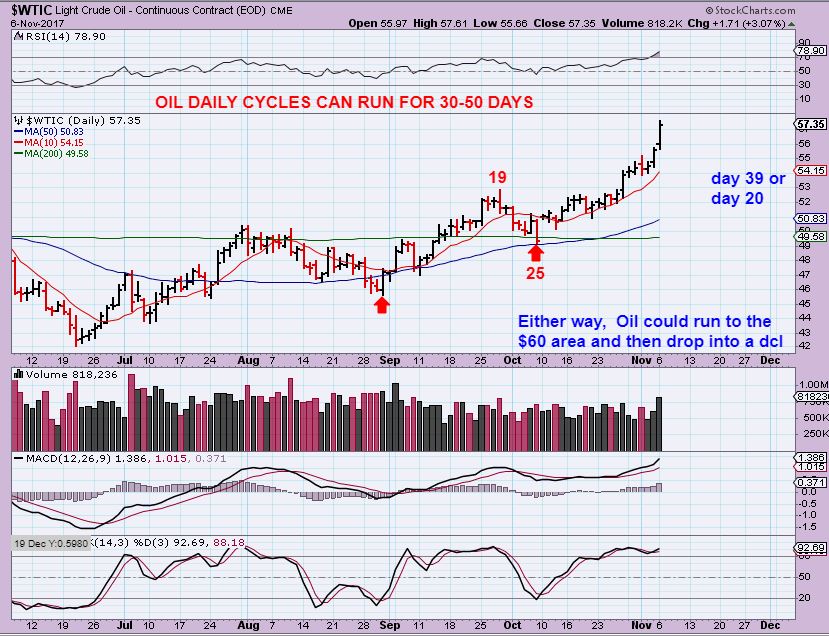
$WTIC #2 – As I have mentioned, it is hard to know if this was a 1/2 cycle on day 25 or a dcl. IT does not really matter, since OILS CYCLEs can run from 30 – 50 days. Oil is at $57 and would probably run to the $60 area and start to slow down, maybe go sodeways, and eventually seek out a dcl. Either way , this could end up Right translated. Either way this could begin to dip into a dcl after tagging $6o – we will just keep an eye on it.
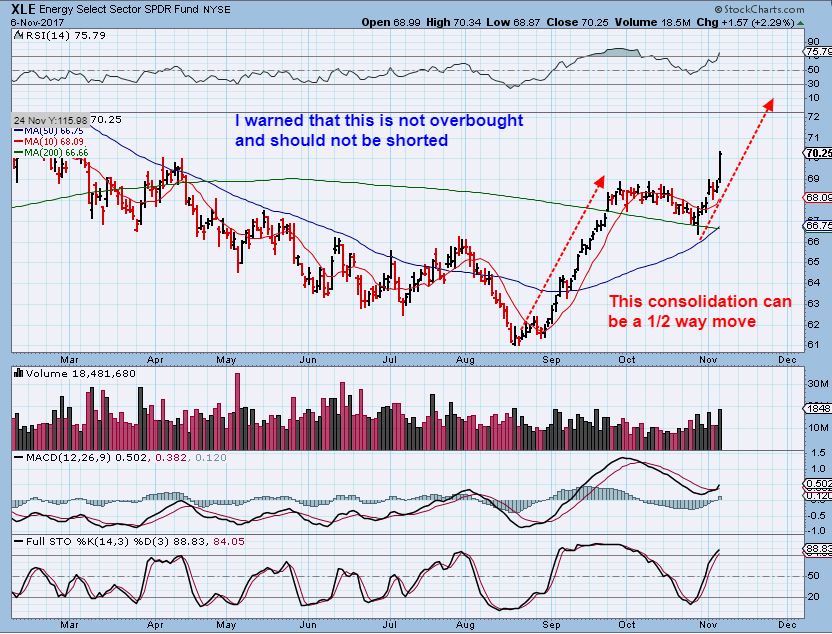
XLE – This was a big break out too. You may recall in a report early last week, a few people were asking me where to short this, and I said not to. These consolidations can actually be 1/2 way marks and this is still not overbought. I have encouraged buying for a couple of weeks now, and I have mentioned how I trade this in many of the past reports. Break outs, Earnings, pullbacks, etc were important parts of this. I wrote a special report on “Pull backs” , because that was when people wanted to short, and I mentioned that we buy the pull backs. I will explain a bit more at the end of this report again.
USD is possibly starting to pull back into a dcl now, so …
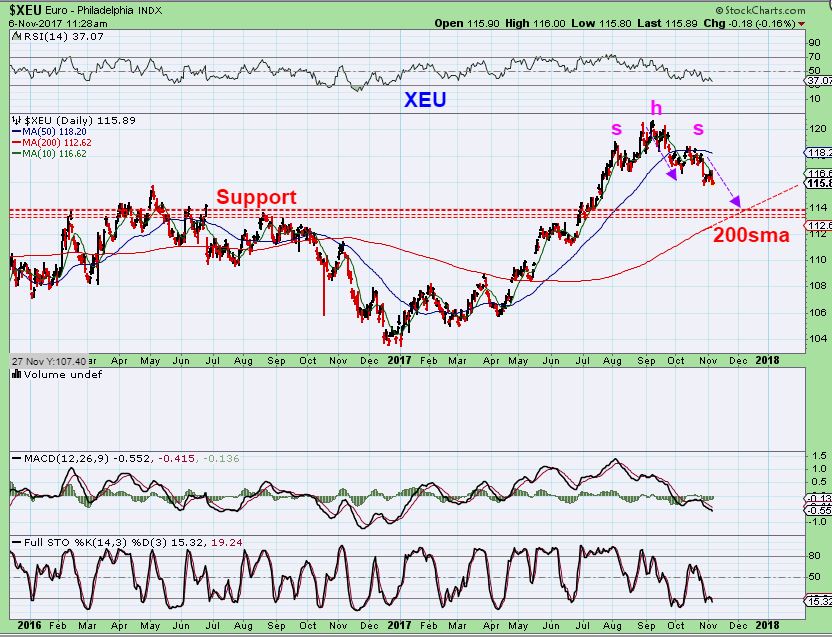
THE EURO – The USD is dipping down, so the EURO should bounce with GOLD, but then I expect the USD to move higher maybe 1 more time in a 3rd daily cycle. That would sink GOLD into an ICL, and the EURO would probably drop to support as shown here. It is a solid set up for the bigger picture.
I WANT TO SAY HERE THAT, JUST LIKE WE SAW LAST SPRING, GOLD SEEMS TO BE HOLDING UP BETTER THAN MINERS. WHEN THAT HAPPENED, I USED CYCLES A BIT & TECHNICAL ANALYSIS TO GUIDE US THROUGH. REMINDER: GOLD LOOKS RATHER STRONG HERE AND I WILL DICUSS THAT, BUT A PUSH HIGHER IN THE USD WOULD PROBABLY CAP GOLDS PROGRESS.
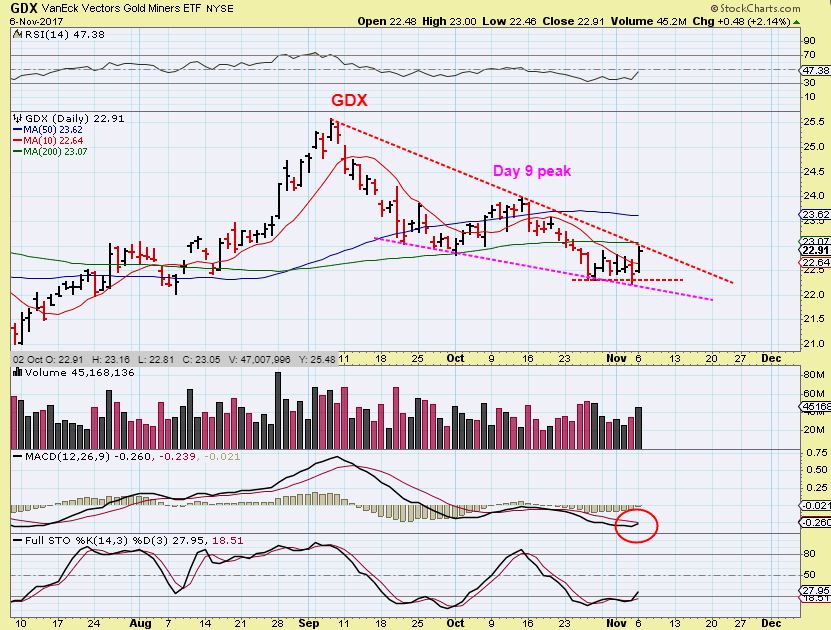
GOLD – Gold held up stronger that Miners. The 1262.80 lows were not broken. The day 15 lows were not broken. Did we start a new daily cycle breaking above the 10sma and trend line? I wouldn’t think so, but this needs watching. Remember that I have repeatedly mentioned that “Triangles form and throw off cycle counts” in my experience. Please read the chart, this is an odd set up though, let me show you why…
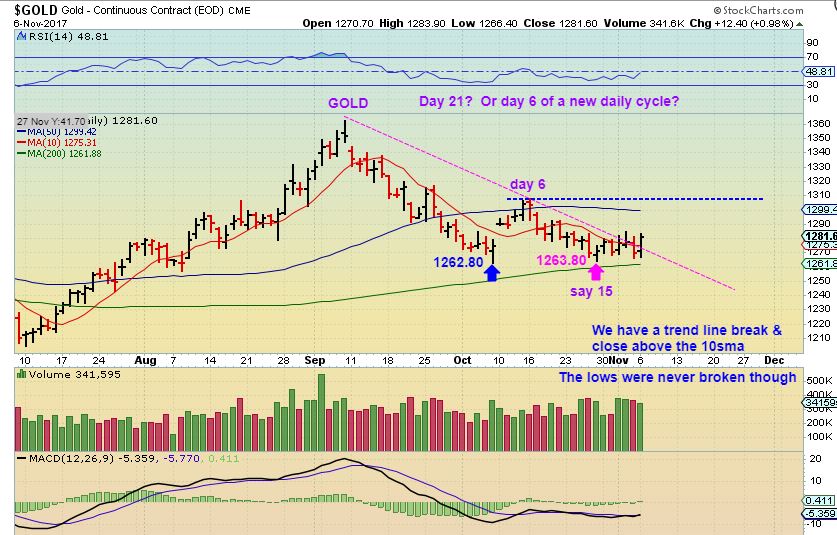
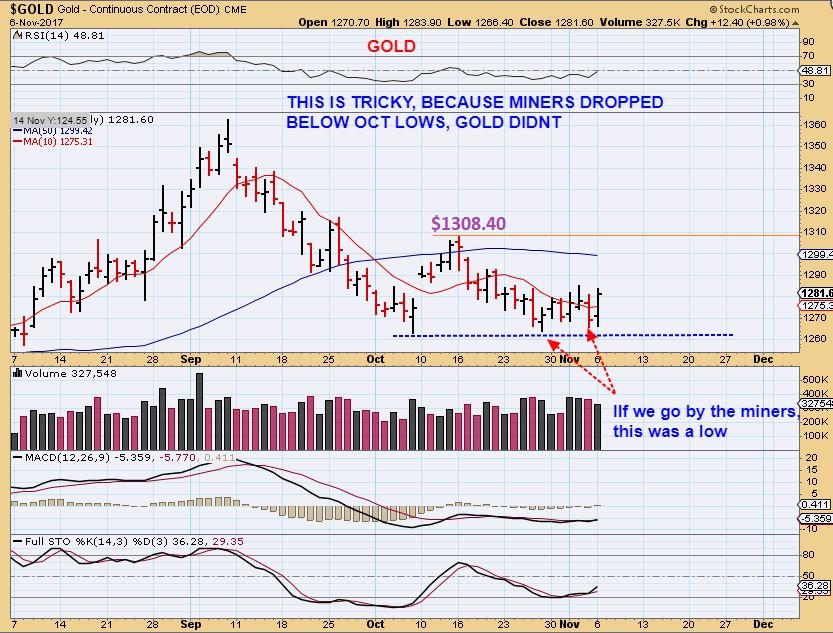
GOLD – GOLD never broke the Oct lows, but the Miners did by a lot. That makes Gold look pretty bullish with a higher dcl, but it still is Left Translated, so I would not expect a strong rally. I do NOT expect Gold to break the 1308.40 highs. If it did, we would need to really take a look at Miners. Let’s take a look at miners now, because they have lined up bullishly in more than one way …
HUGE IMPLICATIONS
GDX #1 – Compared to GOLD, you can see the weakness that lead to the recent low.
1. Miners peaked in early September, and then dropped to the 200sma.
2. After a day 9 peak, they then broke the early Oct DCL as expected, and on Friday they broke the recent lows too. Now we see a possible swing low, close above 10sma, and trend line about to break?
3. Since the drop was not very deep, we are already at the intermediate trend line. That is usually Bullish when it breaks. GDX looks, at this point, like it wants to break that Downtrend line, because it is out of room. This gets tricky, because Price is already very close to that day 9 peak. If that gets taken out, this would indicate to me that an ICL was in place, even though it is pretty early time wise. Let’s look closer …
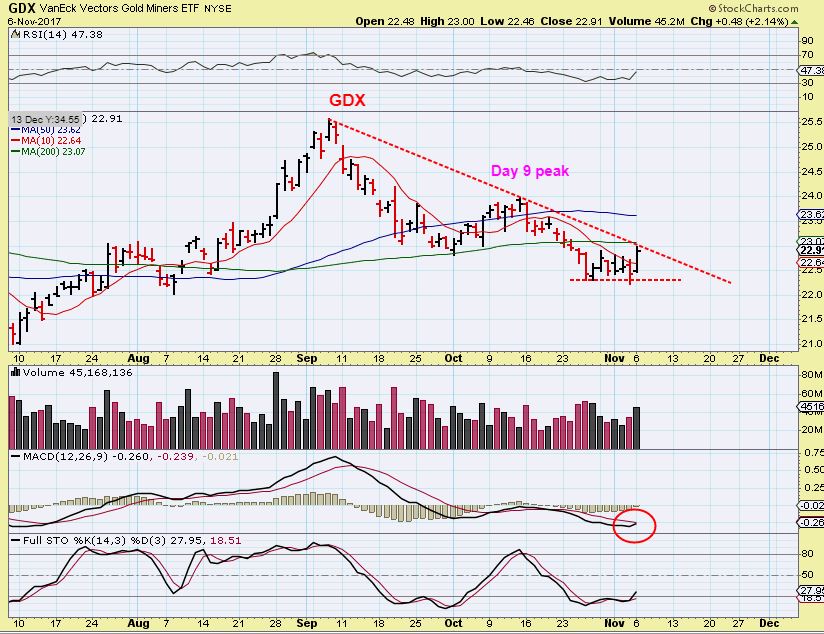
GDX #2 – Using Technical Analysis, I would normally buy a break of the 10sma, but only if we had a break of the down trend line. This is the trend line that also indicates an intermediate cycles boundary, and a break above usually indicates that the down trend is over. Volume increased today, GDX is quite oversold, and it looks like that 200sma would not hold Miners down, but we’ll see. Currently we are making good %-Gains in Energy, so we have not missing anything here yet, but I want to watch this closely, because the expectations are that Miners should NOT break above that day 9 peak. Realistically, we should have another drop after a bounce here, but that 50sma needs to hold price down.
So how could this play out with an ICL still ahead of us?
GDX – GDX should roll over, or it could bounce to the 50sma area, start to crawl along it drawing in buyers, and then roll over like this. It would be a break out of the trend line, and a back test. If that was an ICL, then those lows should not be taken out on the back test. It would be a sideways move at first, and then take off higher. This break out seems early and is a bit odd though ( 4 months from July).
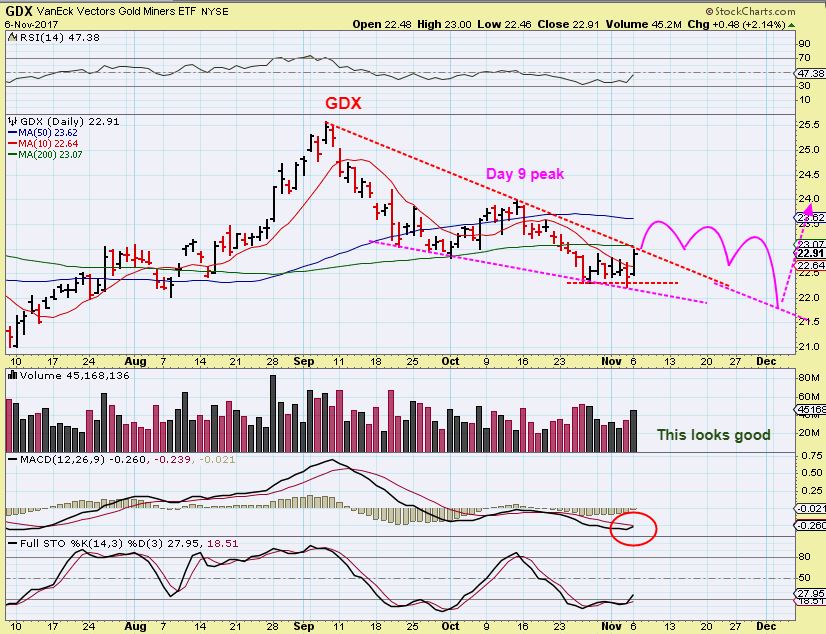
GDX back in September, I pointed this out as possibly 1 long daily cycle from Oct to Dec as a double back test, or 2 short sideways daily cycles. It basically rolls out sideways like we saw in March to May to July. This really does seem to have bullish implications on a daily & weekly basis now, it needs to break down to play out as originally expected.
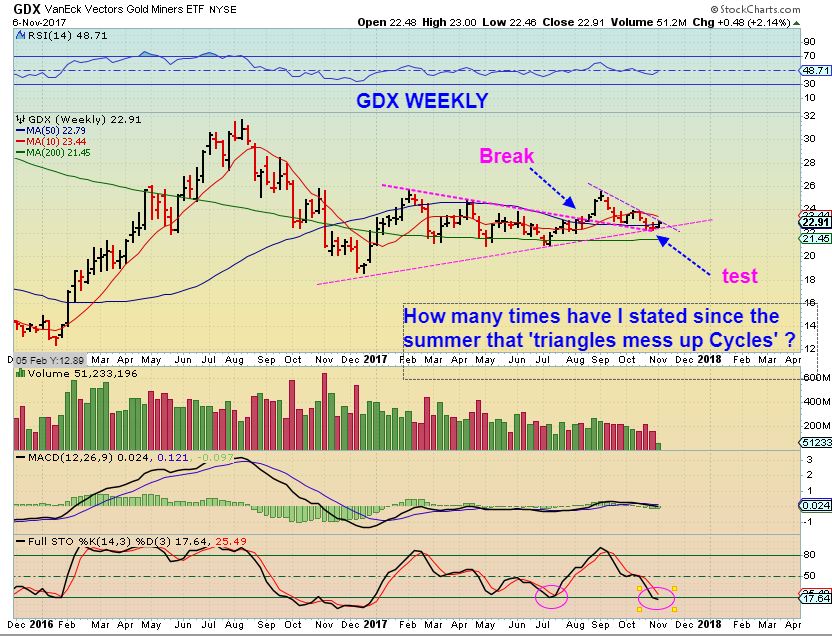
GDX WEEKLY – Here I see a Triangle break out & back test ( blue arrows). As oversold as the July Icl. A break out higher really has me feeling that this is a series of higher lows, and we’d see a higher early ICL. I expected this to break down, now I am watching this area a bit more closely, to see how it plays out.
I want to mention again before I sign off and move on to some trade ideas, that SOME MINERS actually have been resisting the sell off that we had in Miners. We have strength in some Miners, but others were getting slaughtered. I mentioned this before pointing out that SA is still up near 2017 highs vs EGO getting crushed. Notice that this is EGO today, so I have remained cautious…
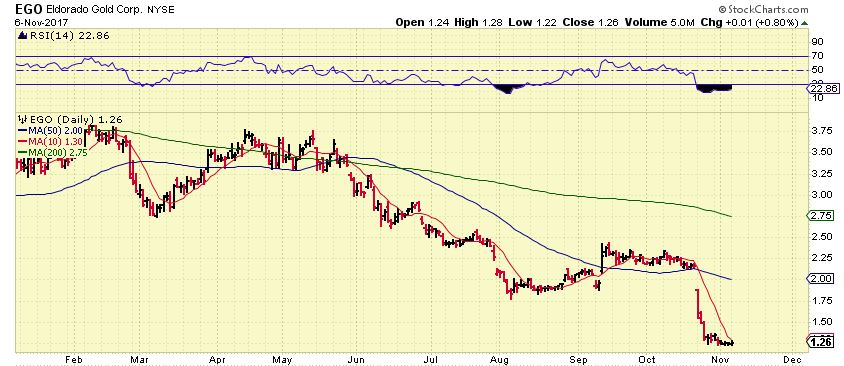
REVIEW : SO GDX put in its Highs in early September, then broke down for 3 weeks to lows in Oct, bounced for 9 days and sold off again to new lows. While this happened, SOME miners like SA & NSRPF remain near the 2017 highs and this was FNV today. Not exactly bearish.
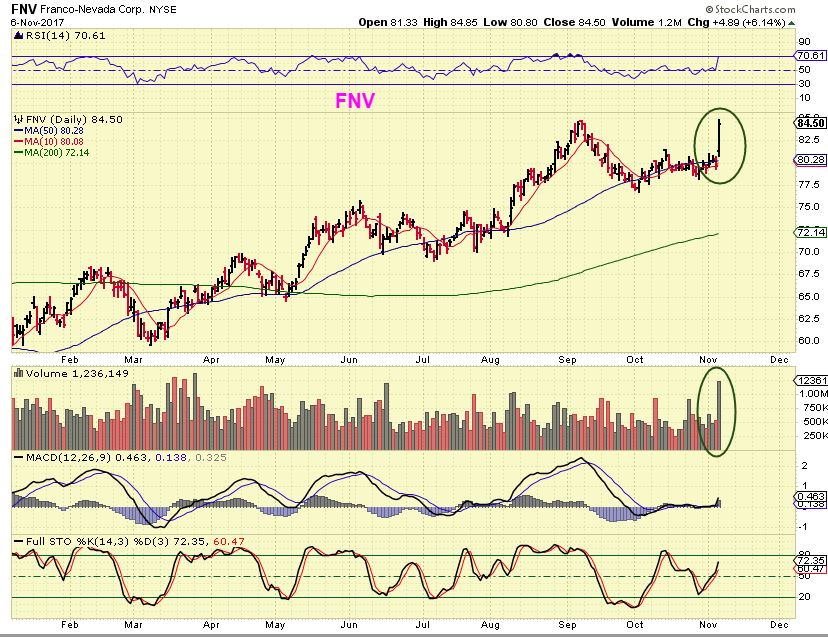
Since we saw EGI, NSRPF, and a couple of others holding up well too, it is becoming a mixed bag here. I am not buying at this time, I want to continue in Energy trades until I see exactly how this wants to play out. My expectations are still for one more dip down in Miners after a bounce here. I will, of course watch this day by day and report what I see. If you wanted to buy FNV or you want to buy NSRPF to get a starter position, that is up to you,. They certainly have resisted the bearish selling that Miners usually get in these conditions. Bullish Miners like FNV also seem to recover quickly when the time is right.
Enjoy your Tuesday trading, I know that Monday continued the treat of owning Energy stocks. I will discuss things a bit more after signing off here, thanks for being here at Chartfreak!
~ALEX
MINI-LESSON – I had a lesson about ‘pullbacks’ and not selling or shorting this sector, but maybe buying the pull backs instead. Lets address that again.
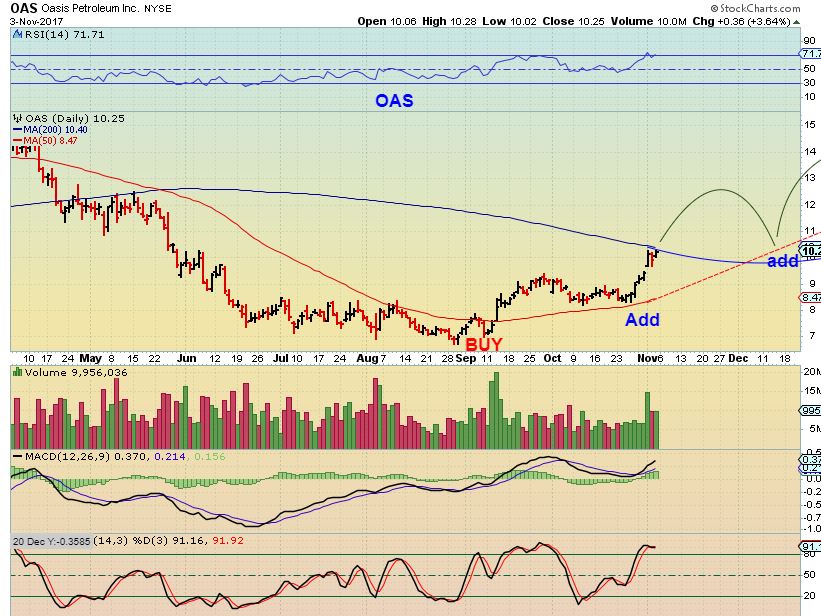
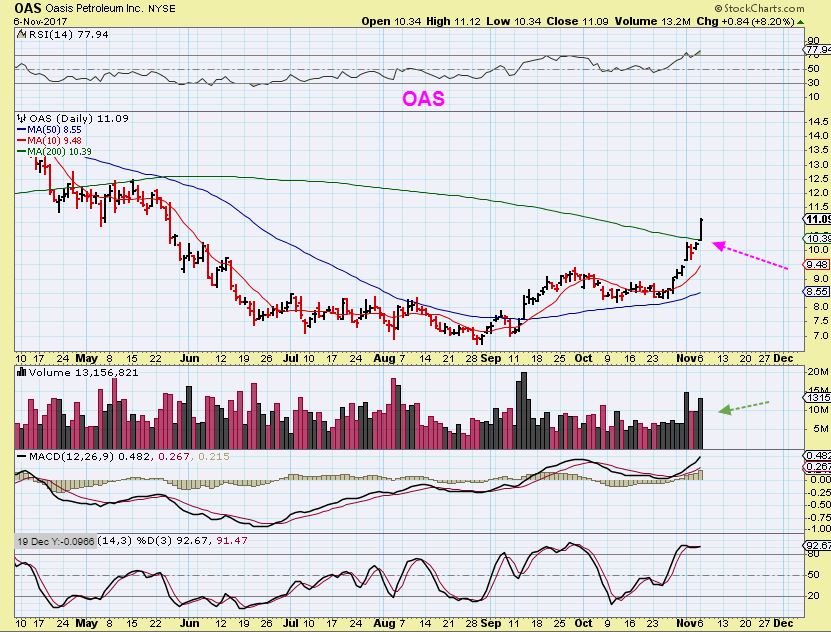
OAS on Nov 2 – I called this a buy down at the 50sma ( 2) , and as it approached the 200sma, I showed how it could continue to play out bullishly after just a pause at the 200sma. The idea was that , like BTE, some of these may not finish the ‘3’ at the 200sma, they may just pause, bull flag, and continue higher.
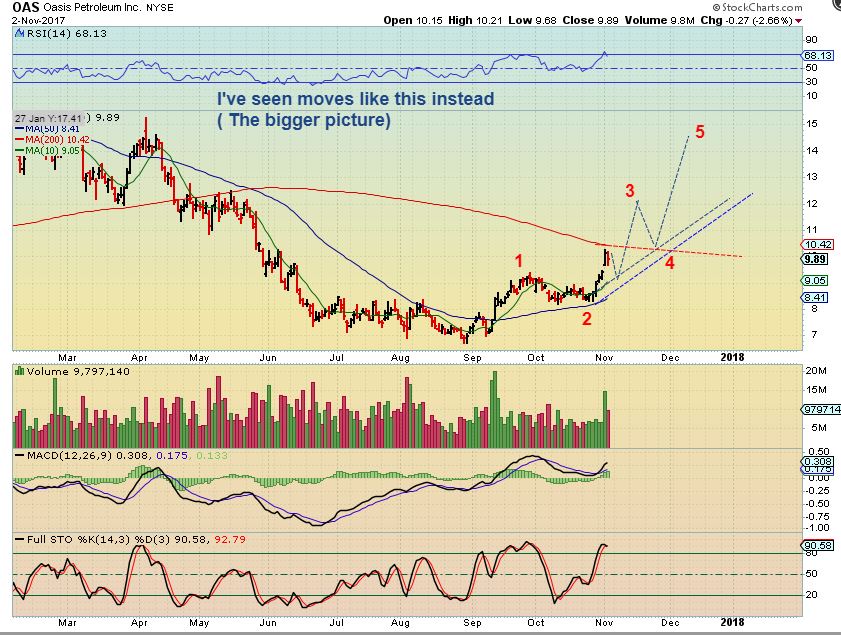
OAS- So on NOV 3, I drew it as a bull flag hugging the 200sma and it could POP over and have more upside. This is how bullish things looked to me.
AND OAS BROKE OUT AFTER A 2 DAY BULL FLAG and continues higher. That said…
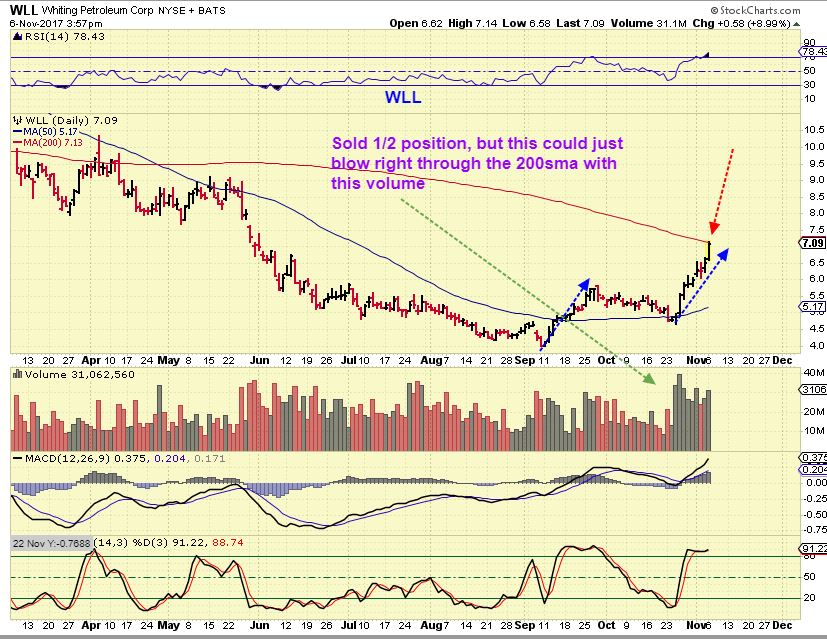
THAT SAID- I sold 1/2 of my WLL at the200 sma today, because that was my PLAN when I entered the trade. Now that I see what OAS and BTE did, I think that this may also just stall & keep going. I’m glad that I held on to the other 1/2. If it bull flags I may add, if it breaks out tomorrow I will just ride the other 1/2. Now that other 1/2 in cash at this point needs to be deployed 🙂 , so …
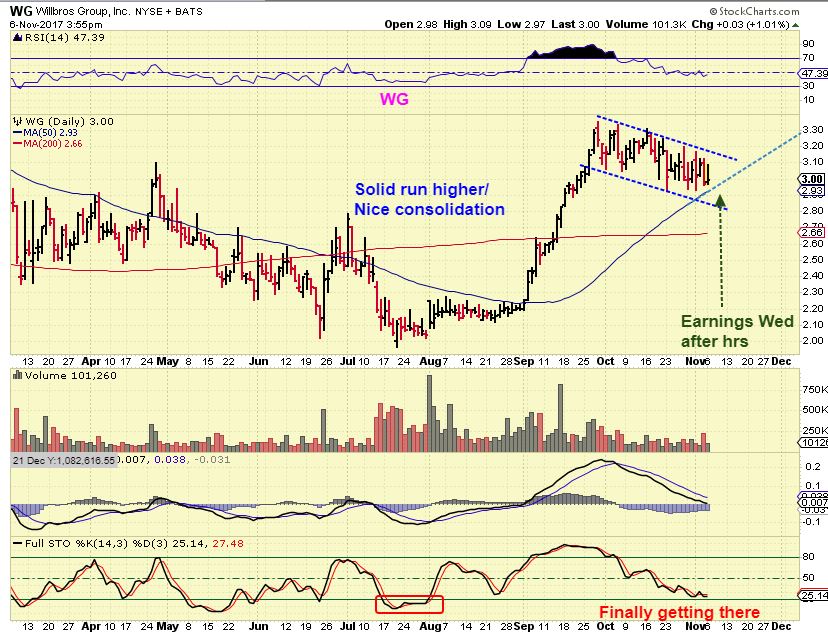
WG – What a powerful run WG had, and it has not finished consolidating yet. It is finally getting oversold, and nearing the 50sma. Earnings come out Wed after the bell, THIS is on my watch list.
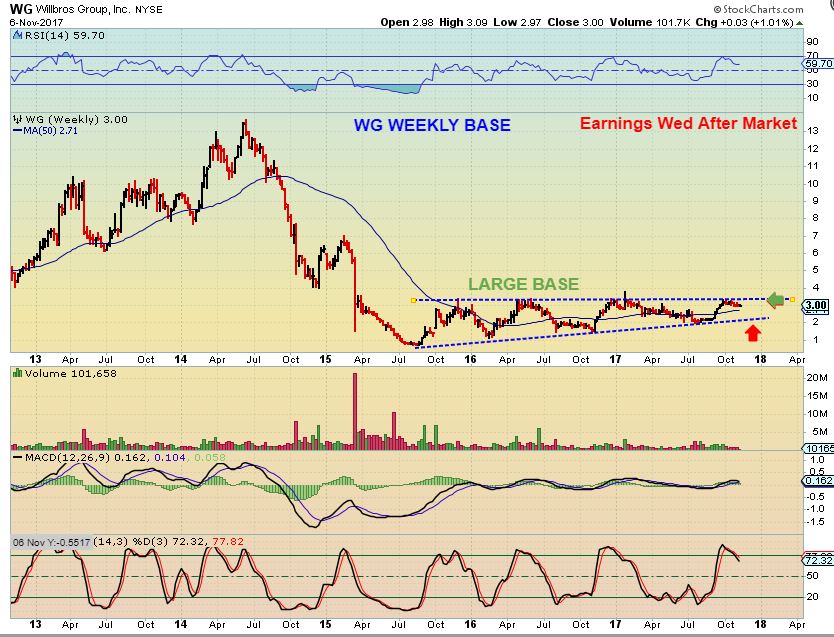
WG WEEKLY – This is a BIG BASE consolidation. These can fly! Do I buy before earnings at the 50 and take a chance? Maybe, I haven’t decided. I did that with WTI and…
WTI – Initially it dropped on earnings, but has been higher for the next 2 days. I think that this is going to continue higher too now, so I added to my position Friday.
1. I started small before earnings 2. Let it prove itself 3. Added since it does seem to want higher price 4. See the weekly chart that follows
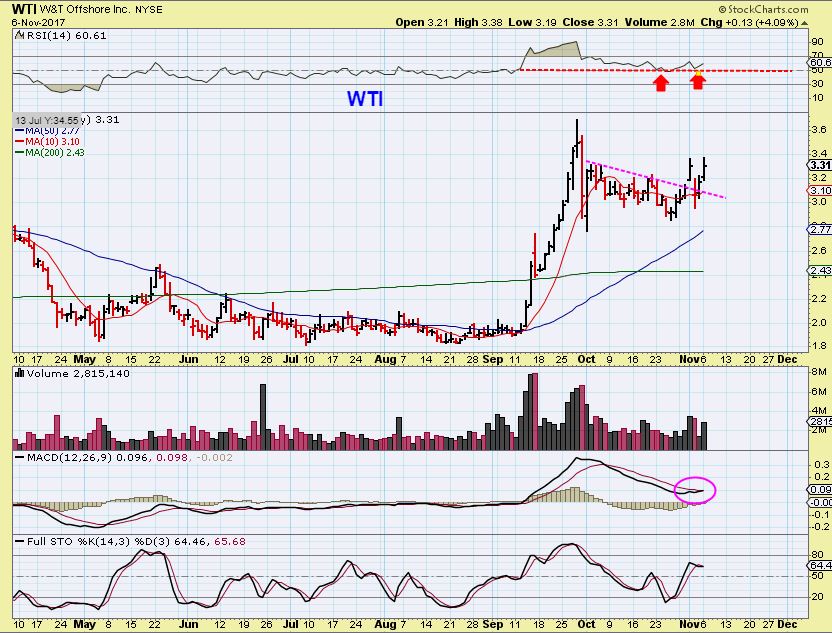
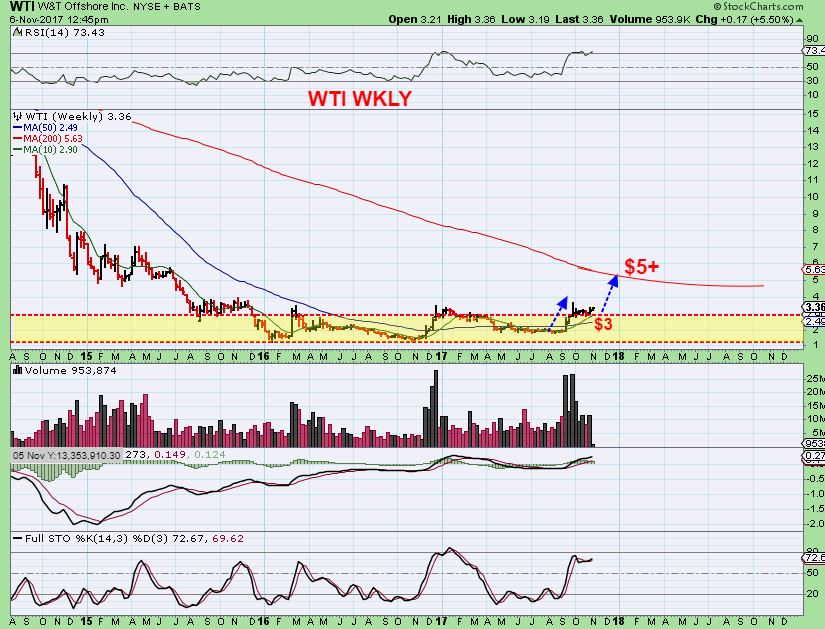
WTI – This is a very long base too, and it looks like Price is riding Above the base. Even $3 to $5 is a good trade. $3 to $5 is over 65%.
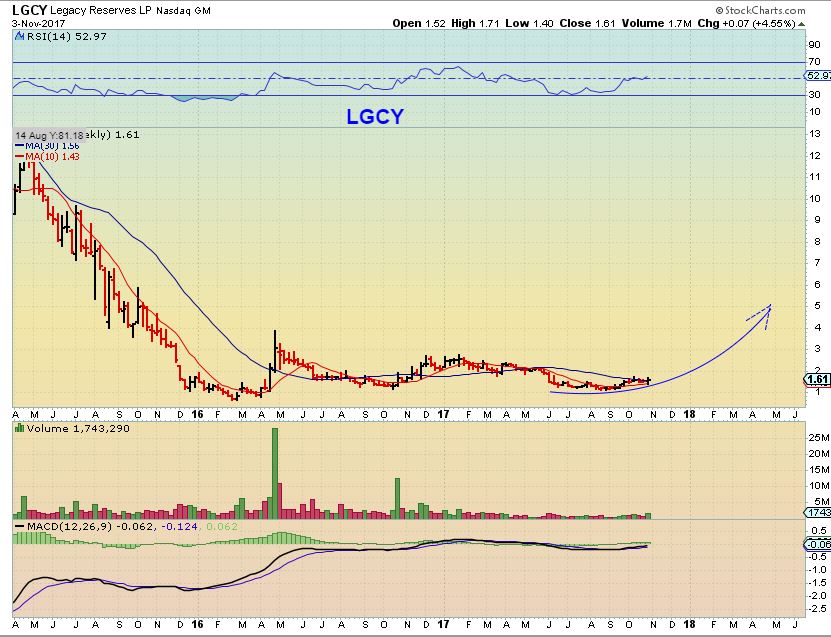
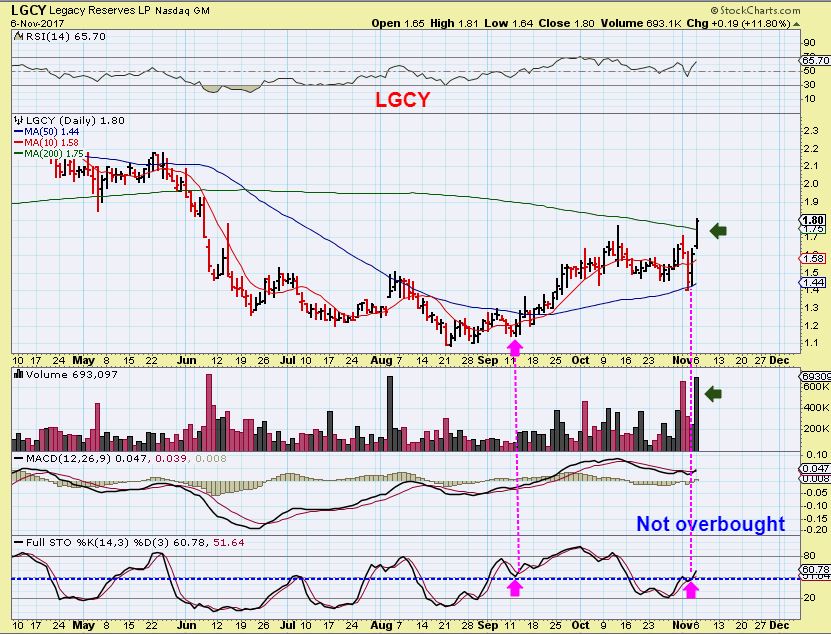
I had LGCY in the weekend report as a buy with 3 charts, and below are 2 of the weekly charts.
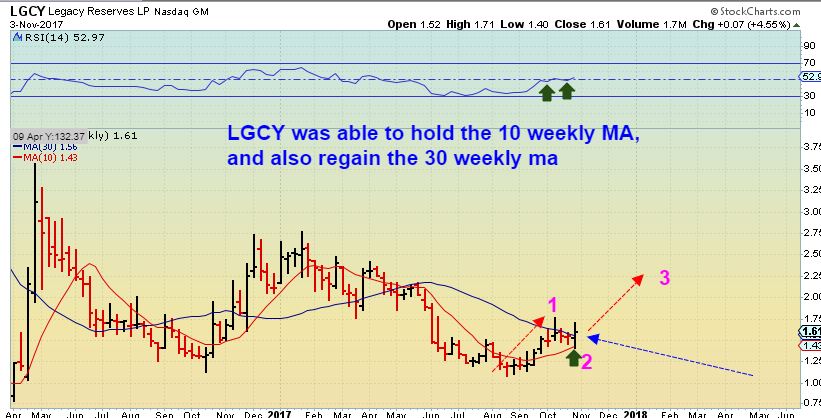
LGCY – SO I posted this in the live comments area and added at $1.72. It was showing me that it would push right through the 200sma.
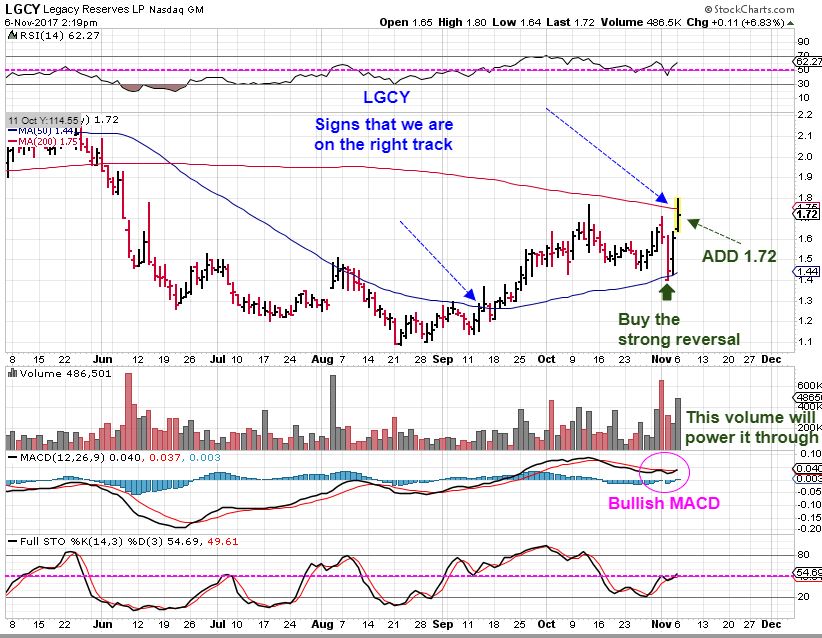
LGCY – And here is how it closed. If this continues to follow through, scroll back up to the weekly chart to see how Bullish this could get. This looks like an inverse H&S now too.
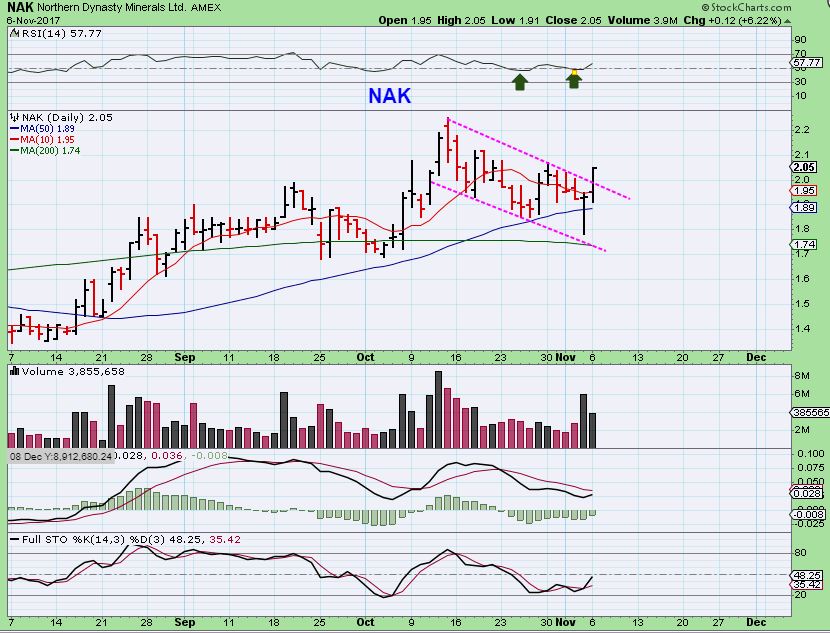
NAK – NAK was in the weekend report too. It held the line, reversed back above the 50sma.
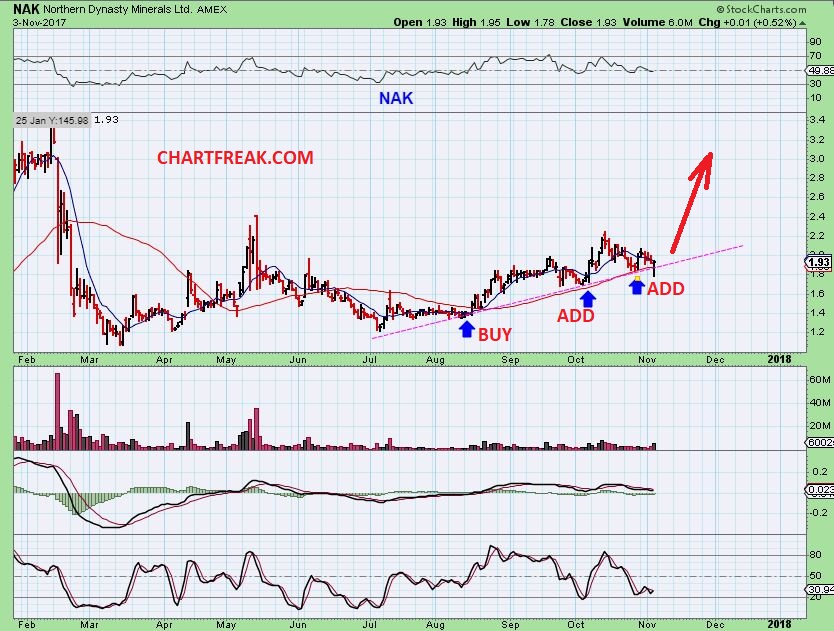
NAK – SO I posted this in the comments section pointing out that a break of the down trend line is bullish. This is oversold, but still making higher lows, higher highs.
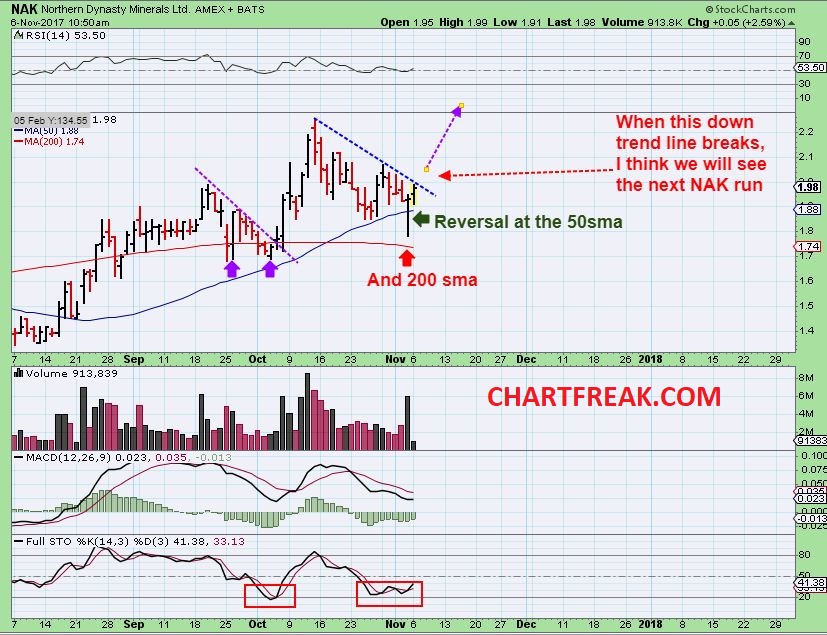
NAK – NAK closed bullishly, I think that it is ready to run again.
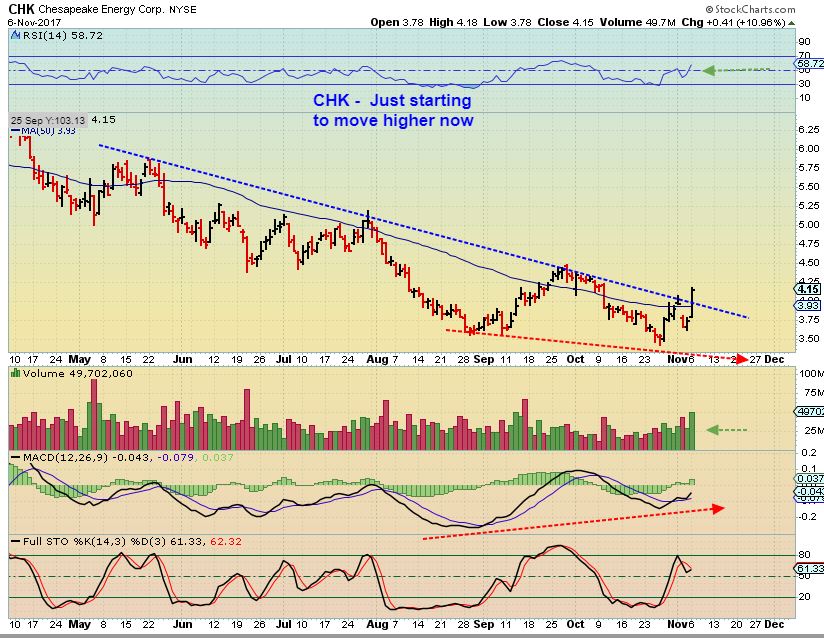
CHK – Earnings were released last week, and this looks ready to go as it breaks from a downtrend. My WLL $$ might go here in the morning, I haven’t decided yet.
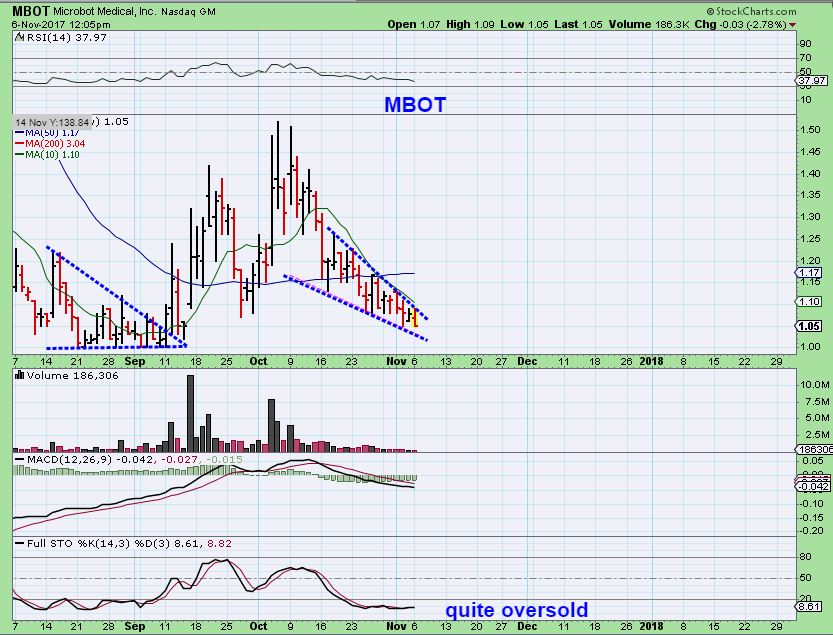
MBOT– MBOT looks to be dropping inside of a descending wedge. A break higher could be all it needs. What I look at on this is the difference between volume on the way higher and selling volume. I own it, but I wouldnt buy it unless it breaks out first.
CTRV BY REQUEST – No change on this one, but because the trend line slants down, price continues to drop down too. It is oversold and a break above the 10sma would be bullish and could lead to another strong pop.
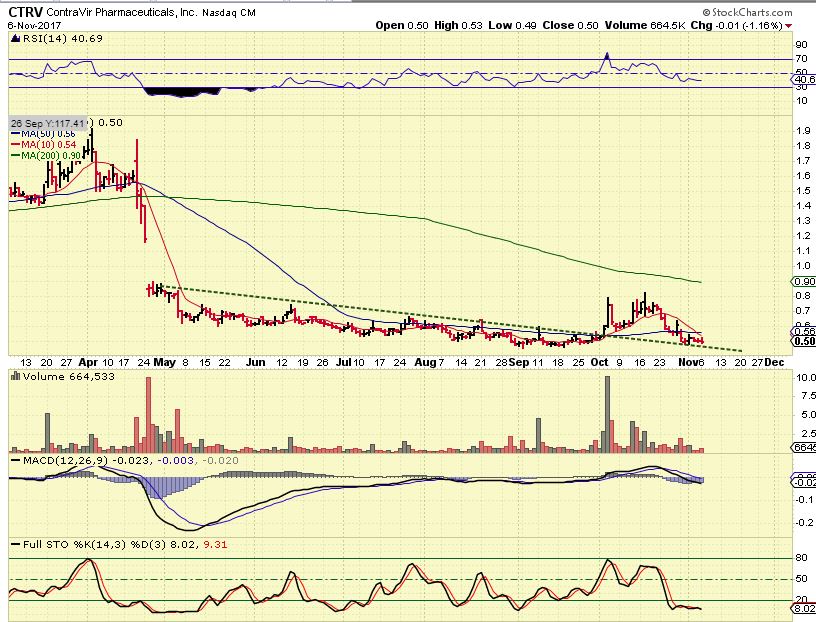
I actually sold mine to buy energy stocks a week ago. As an active trader, that is what I do when the action is across the street, I take a walk across the street. If I still owned this, I would have a plan. That means that I am waiting for it to pop, but I would have to have & honor a stop, or I would sell it ( like I did) simply to put the money in an Energy set up that looks ready now.
Weekend Report – Things Are Still Lining Up Nicely 
 November 7th – More Of The Same
Scroll to top

VANCOUVER, Nov. 7, 2017 /PRNewswire/ – Northern Dynasty Minerals Ltd. (TSX: NDM; NYSE American: NAK) (“Northern Dynasty” or the “Company”) announces that its wholly-owned Alaska-based subsidiary Pebble Limited Partnership (“Pebble Partnership”) has hired retired Major General, US Army & President Emeritus of the University of Alaska Mark Hamilton to serve as its Executive Vice President of External Affairs.
“Mark Hamilton is among Alaska’s best known and most highly respected residents, in large part for his tremendous accomplishments and service to the state over 12 years as President of the University of Alaska,” said Pebble Partnership CEO Tom Collier. “We fully expect Mark’s vision, his leadership and his credibility to materially advance our efforts to re-position the Pebble Project, to ensure it provides meaningful and enduring benefits to the people of Bristol Bay and Alaska, and to help create the social and political conditions necessary to permit this project in the years ahead.”
Alex, thank you very much. I continue to learn more and more from you. I really appreciate it.
Thanks Peter,
I am still learning too 🙂
So of course I had to check out the charts of DCIX & TOPS ( Shippers) yesterday and I used to own GLBS – also taking off.
SO I wondered if all Shippers will rise with increased Oil prices.
Ticker ‘SHIP’ released earnings this morning, and now it is up 50% after already running from roughly $0.90 cents to $1.20
Highlights included :
Highlights of Third Quarter 2017:
Net Revenues: $18.9 million in 3Q 2017, up 119% compared to $8.6 million in 3Q 2016
Net Income of $6.5 million in 3Q 2017, as compared to a Net Loss of $5.9 million in 3Q 2016
EBITDA: $14.2 million and Adjusted EBITDA: $2.8 million
SB and SINO did well yesterday too. I own SB, and it was up over 9% at one point yesterday.
Yeah, I had a few in my reports about a month ago and I owned GLBS & NM for a while, I liked the set up on SB a lot too, but I mentioned in my report that I was bored with NM sideways move and sold it to buy something else.
Hang on, hopefully it will pick up speed… 🙂
Tops is up another 60% premarket. Thats over 400% in 3 days
Alex, XCO is finally moving up. Could you point out target areas?
The stock set up looks good right now,
but I’m not sure if they released earnings yet or not, and if they report badly, they wont reach targets.
I have targets roughly $2.00 and $2.30 and if could even just head right up to the 200sma, which is a lot higher if things continue bullish. they did almost go Bankrupt last spring, and I dont know the fundamentals for the company right now.
Thanks
Awesome report, CF. I really appreciate you sharing your new observations on the miners as we get closer to that ICL, if it hasn´t happened already.
I guess they like GSV´s recent drill results.
Yeah Ralph, its becoming a tricky set up until it really heads one way or the other, so for now it just comes down to gathering clues.
Some Miners are impressive with their prices still anywhere near 2017 highs – when you consider that Miners peaked in early September and sold off pretty good into Oct and Nov. It is a mixed bag- but the good news is that it overall feels bullish in the big picture. This doesnt remind me of bear market action.
Alex, can you give us your take on the XBI/IBB trend? I’m in LABU, but I’ve also been reading analyses to point to the biotech’s turning down from here. Wondering if I should sell or not.
Well, the basic definition of a trend is higher lows and higher highs.
Often when something is trending, it is bouncing along the moving averages with those higher lows.
Here is a chart – stops should be under the lows and buys should be at the lows.
https://uploads.disquscdn.com/images/1c968196b17cc0d9caa29d8aa7ca2d7b80dcc4483e7a5098472e969fe976dcbe.jpg
For longer term traders, I like this SLV chart, testing the 200 WEEK MA since the 2016 high.
http://stockcharts.com/h-sc/ui?s=SLV&p=W&yr=5&mn=0&dy=0&id=p88789564994
NIce – pushing along the 200 looking like it wants to break through & run
I hesitate to mention this, especially since LGCY has given up much of what it gained yesterday and these remarks may seem negative, but beware that LGCY is a limited partnership and your ‘end of year tax statements’ for LPs are not sent very late. My account raised hell with me last year for the number I had invested in and the amount of paper work they generated for him, and his bill reflected it. That being said while I own this it may be wiser to have it in an IRA account. [Disclaimer I am not an accountant but play one on this site.] 😉
That’s not negative, it’s informative for any that may be concerned about that.
I have found that several of the energy stocks did that – I would get that schedule -k form late from Legacy after I already turned in my taxes
( I think off the top of my head got schedule k forms from Atlas energy, EVEP? BCEI, and LGCY. ) There may have been others.
Yes, Indeed! And, for each one I got thirty lashes and $25 added to my bill.
Wow – rip off. I actually enjoy ( I know, that sounds crazy & probably isn’t entirely true, since it takes me a solid day or two) doing my own taxes with turbo tax small business. Its a flat rate for everything, walks me through everything, and when the forms came late, it was free to do an adjusted tax form.
However, back to your main point, it was a Pain in the neck receiving Tax forms in July from LGCY & I think it was EVEP.
Not only that- LGCY cant even hold the gains over the 200sma – piece or garbage 🙂
( I still own it as long as it stays above the 50sma for now )
Your right! That does sound crazy. Can I mail you mine? 🙂
Sorry, I only have that 1 day to spare : – )
plus, I already know that you’re going to have to amend them in July again- lol
HOS is breaking out on strong volume. 1 million in the 1st hour, and had less that 1 million all day on most days
nice grabbed some tx
And there it goes
Lots of rap lyrics about this particular stock… must mean something! *bort*
LOL – you talking about…
‘Fightin with my foes,
hanging with some hoes,
passing by the time in violation’
if so, I dont think that they mean the energy company 🙂
DNR …. train
fyi- i did hop in some this am… had to take a seat
I wanted to buy that on day 2 out of the lows, but they hadn’t released their earnings yet.
maybe next time I jump in & out before earnings.
well .. it feels like last years MVT train… so i had to hop on… thinking maybe another 30% left ….?
i think the ‘4’ correction could be a running correction like this past one…. maybe…. hopefully? lol
In any event, i HAD to buy at least one seat…. perhaps another one if she decides to stop at another station..;)
https://www.tradingview.com/x/BN9b3HtV/
ps. still not sure if this is 1, 2, 3 .. or ABC .. ** disclaimer
Tagging the 200sma right now on a daily. Earnings must have been good this morning
hopin it fills that gap…. (lickin my chops) 😉
I added to my OGRMF ( I LOOKED AT THE 3 YR WEEKLY CHART)
Hey, it was red when I added, and now it’s green & look at that volume….
Thanks Guys 🙂
Potential 100% countertrend rally may be due in WRR(was URRE) if past chart pattern is a pointer.
just bot me some down at these levels, coz very similar chart conditions prevailed in oct2014, and the c/t rally was substantial after that beatdown.
Would that be WWR?
WWR-WRR …..whats an R between friends? 🙂
yes thats the one
🙂 Well, ticker WRR took me nowhere, and so I tried WWR and I didnt even recognize the name ( I lost track of it).
it looks like its doing a final wave 5 sloping wedgy… hoping for a major pop here, possibly up to 1.50ish
That little wedge it is forming now does look bullish, and even a break & tag of the 50sma is $1.20
looking back at the 4day chart, the c/t rally popped up to the 50sma… so that would be a 200sma target, which is at around 1.60.. so it could be anywhere 1.20 to 1.60 perhaps.
you know how URRE used to overshoot
*c/t rally back in 2014, that is
yes it did, and in a short period of time
ive been following it since i got stopped out at 1.34
ACBFF is having another good day – I think JT said he owned that one,.
BLOZF popped
TWMJF = Leader of the pack
I am still in APHQF and OGRMF ( & EDXC long term)
APHQF similat cup set up & break out as ACBFF a few days ago?
dammit.. SDRL was on my hotlist yesterday.. didnt get a chance to scrutinize them all.
would have been a perfect buy before close, just regaining the 50s..
up 26% now
Ditto
arrrgghh
.. did you see?.. SDLR up 100% for the day aftermarket.
Was stopped out of my ZB futures short this morning, haven´t bought any OIH drillers, but have some bids in just below the market on my favorite miners, and would like to add to silver futures either on a puke out lower, or in a few days if they stabilize in here. I have no idea where they go near term, but like the prices for long term holdings.
By my charts, $CRB looks extended on the WEEKLY charts.
http://stockcharts.com/h-sc/ui?s=%24CRB&p=W&yr=5&mn=0&dy=0&id=p58175279676
Perhaps this is what will lead metals and miners into that ICL we are waiting for?
Kirkland Lakes KL having a great day. Some of the miners acting very well here. HL, EGI even MUX up today. No one talking about them here. A very good sign of at least a temporary bottom.
Kl having a great week.
One of my miners ARCTF got a buyout offer today. Sold it right about at its buy out price. Learned from the past. Sell and don’t wait for the transaction to complete.
Yes, I’ve played it both ways – take the $$ & Run works best for me too
HL had earnings, popped it out of the low
GSV good drill results- very nice 1 day move on GSV
TAHO down 9% , EXK down 5%
Still a bit of a mixed bad=g
NSRPF – that chart consolidation now looks exactly like the August Sept one that broke out & ran strongly.
FRESH
https://uploads.disquscdn.com/images/a64613cd19575789429f58deffe75c88ce4a1bca561a47b617b4e7b9bb936f5a.jpg
CF question… EAT. Im in a little higher than current Price.. I was wondering… based on your eyes, should I add to avg down a bit?
It looks good popping above that 50sma and trying to break the down trend. It isn’t a clear cut read, because it is inside of the base again after that pop and could continue ‘base building’, but it did have a sign of strength pop and may just be dropping to the 50sma before resuming the move higher. You COULD add at the 50sma if it gets there…
Whether you want to add based on that is up to you. It looks good and should turn higher, but if it isnt finished building the base, you may go sideways for a bit
thanks
Non trade related. Schwab sucks… They had a system issue a month ago and credited me 250$ for the issue. Called today to say they need to take that back as they cant compensate for missed opps (however it wasnt that) and they will credit me trades equalling 250$…. blah blah
$WTIC #2 – As I have mentioned, it is hard to know if this was a 1/2 cycle on day 25 or a dcl. IT does not really matter, since OILS CYCLEs can run from 30 – 50 days.
Alex, if the above is true, aren’t we on day 48 and over due for a move down into a DCL?
FWIW …remember this chart i posted a few weeks ago…? it’s still following it …Meow
https://www.tradingview.com/x/gR8PTyna/
Surprisingly I do remember, but I don’t see the symmetry in your chart, no overlap. I think this may be more accurate.
https://www.tradingview.com/x/Dum6zCvk/
did u get some RIOT from am?
No RIOT for me, good thing
Do you remember me showing you this one! Pretty close now.
https://www.tradingview.com/x/fuyy0o88/
:ix
https://s3.amazonaws.com/tradingview/snapshots/k/KqhLYtmH.png
this one
Okay, I see more of it now, thanks.
Actually, Yes, good catch – I think it would be day 45 & closer to timing for a dip. I dont know why I wrote 39 on the chart? It would be day 25 possible dcl or plus the additional day 20 ( 45) or just 20 days from the dcl. Both would likely be right translated and back test the break out, so
We had a break out, and my expectations would be a back test of that break out possibly around $50
Alex, are you planning to hold your energy positions through this period and potentially add, or sell off some?
gulp… GSV… 61% retrace…. hmmmmmm
Good volume, too.
I feel like stops hurt me more than help me. Stopped out GV. They ran it down exactly to my stop, which was the low of the day. I’m moving entirely to mental stops or trailing stops.
I know how u feel.. A cpl of my postions over the past few months have stopped out literally on the dot or a penny or so below.. Wiped out a nice chunk of unreallized quick…
I use mental stops, I´ve had worse experience with trailing stops than just hard placed stop orders. It´s tough to leave an order on the books were bots can exploit it.
DNR… giggle .. c’mon back that train up……………….
🙂 1.54??
Trying to get filled there?
not yet…..
ahh. I thot u were in already.. I jumped in as sson as i saw u jumped in. I didnt want to say a word however as u know… When I mention DNR or MUX… bad things happen
yes i am IN … but want to …. slap a stack of GeorgeWashingtons down … IF IF IF … it holds the pullback and continues up for the next wave… 😉
im with u.. And lips are zipped.
yes shhhhhhhhhhhhhhhhhhhhhhhhhhhhhhhhhhhhhhhhhh
Alex, do you think OIH keeps going up, sideways or back tests the trend line?
I am liking ITUS tho…. your thoughts…. A .. L .. .E .. X
i may add.. think its gonna fly…
I mean .. I’m seeing this as a POSSIBLE … u??
get off the can and stop pretending your not reading this…
https://uploads.disquscdn.com/images/203c765bc19c4d5ae930bded01ef27d0cf2014df537dc8d906b2635314275d73.png
https://www.tradingview.com/x/ODaqw4I8/
Purchased a small stake when you mentioned it yesterday. As you, I may add a bit more. Thanks!
🙂
ATNM is looking sad
but who is sadder… ATNM or MBOT?
hoping this little move down is a final overthrow
Just a heads up that OAS earnings is today AH
yo Crystal!.. watch out on one of our old favs URRE (.. now as ticker WWR)
was jst saying down below, that it looks due for a substantial counter pop soon ..
did notice other uranium UUUU started to move too
Oh really? I almost forgot about uranium. It’s been awhile since my eye twitched 😉
LoL.. i vaguely remember a twitchy eye being involved
i LUV switchy eYe :o)
#Thelma
dang… soooo is this going to repeat THIS move? 😀
https://www.tradingview.com/x/B7YKisRw/
oops forgot the ticker TXMD
Might want to watch CENX if it can clear near term resistance of the 20 and 200 sma. It has been moving lately while most basic materials have been MIA.
GSV and UUUU helping today.
Jeff, May I ask what alerted you to the fact that GSV was going to rocket-up this morning? The drilling results announced at 6:30 AM ? TIA
I suppose. That’s the only news I see other then the hire of Mr. Mark Laffoon to the Company as a Senior Engineer. I added today AG, MUX, BTG, and AUY. Plenty of cash still for down the road.
Didnt set a stop loss on GV and jsut came back and ouch…
I saw that! It literally dropped from the sky.
im taking 1 step fwd and 3 steps back every day…..
Got filled on FFMGF, MUX, and a little SILJ today. Back up to 20% invested in miners and metal, waiting for a smash I hope is soon and dosen´t last long. 🙂
GSV is trading like a small cap biotech!
SNAP missed.. Big crack on the miss…
SNAP and GV… Add these to the (Youre dead to me list) plz
ENPH beat earnings, report came out after close, up in after hours trading…I started to get today when it was down a few cents but hesitated before earnings…just bought some in after hours….
So I’ve only ever bought something in after hours or sold….about twice…..so this might not have been a great move since now it’s moved down….duh.
FINALLY – caught a break. Remaining half of OAS… beats on revs. up another 5% after hours. I needed that..
ummmm …. ?? lol
Gold Weekly …
https://www.tradingview.com/x/1f2GNz1N/
Hi Maria….
The weekly Gold chart do you really expect that?
This would be amazing if so !!!!!
No …. Just amazed at the similarly …
Its a good chart – Further Thoughts? : 0
That’s ur Dept…mrWisenheimer
I cant make out the price target, thoughts?
you rarely have thoughts…
The report has been posted