The various Market sectors acted as expected this week, so let’s take a look and see how things continue to line up in a way that we can profit from.
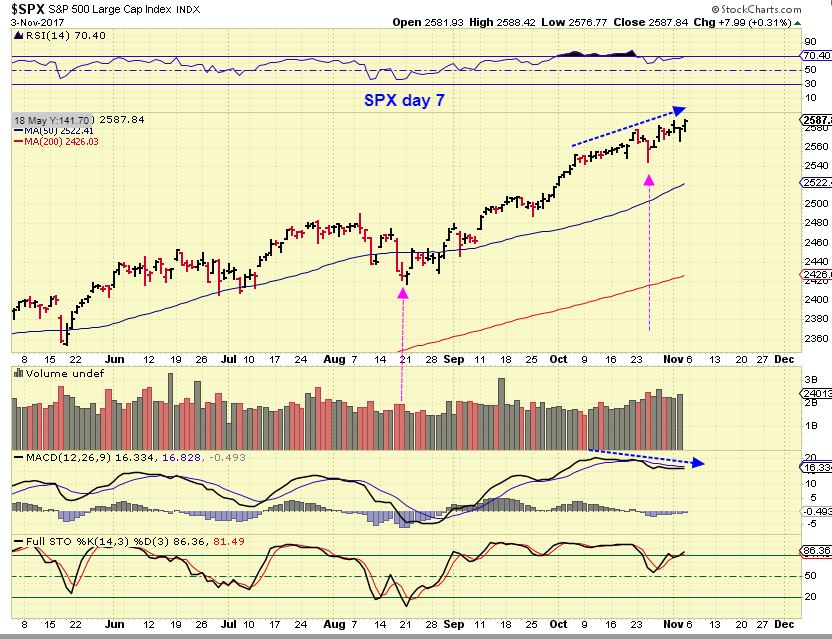
SPX – The General Markets put in another high DCL, and we’ve discussed how the pull backs are more shallow lately and what that implies. This would only be day 7 of a new daily cycle. That dip was sharp , but shallow, so ‘longs’ may not have even been stopped out with a trailing stop. If one was stopped out, this sideways stall has allowed many to re-enter long positions.
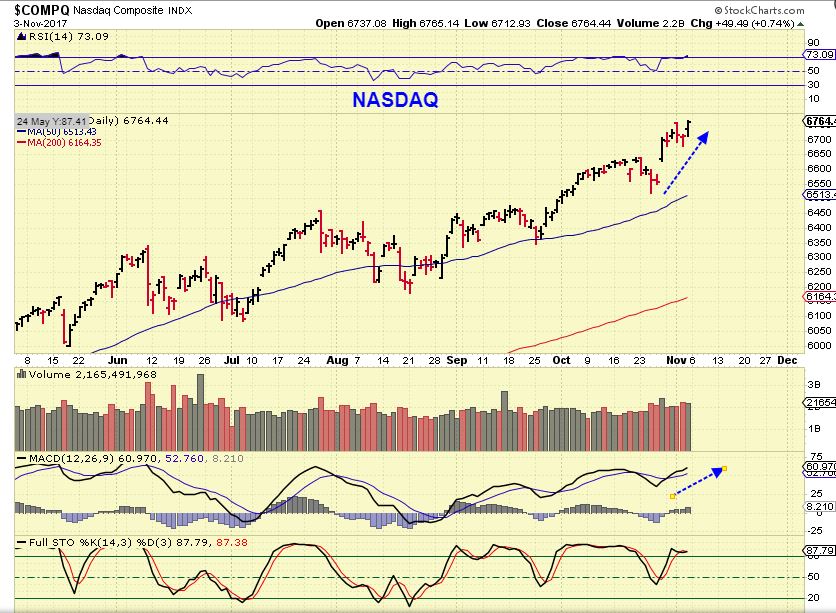
NATGAS – The NASDAQ has also lingered, allowing ‘longs’ to re-enter if they were stopped out. This is also day 7 and these daily cycles can be over 30-40 days long.
USD– The 2nd daily cycle of the USD peaked on day 11 and formed a bull flag in this chart that I had drawn for Thursdays action. I drew that I expect it to break higher…
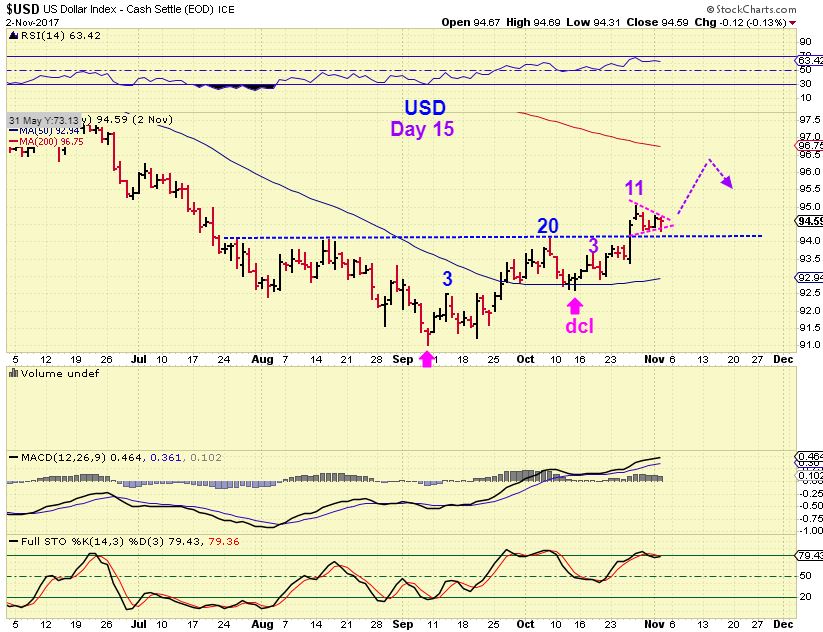
USD– A reversal from that bull flag Friday and we should expect to have a new peak on Monday – day 17. That would give us another right translated daily cycle.
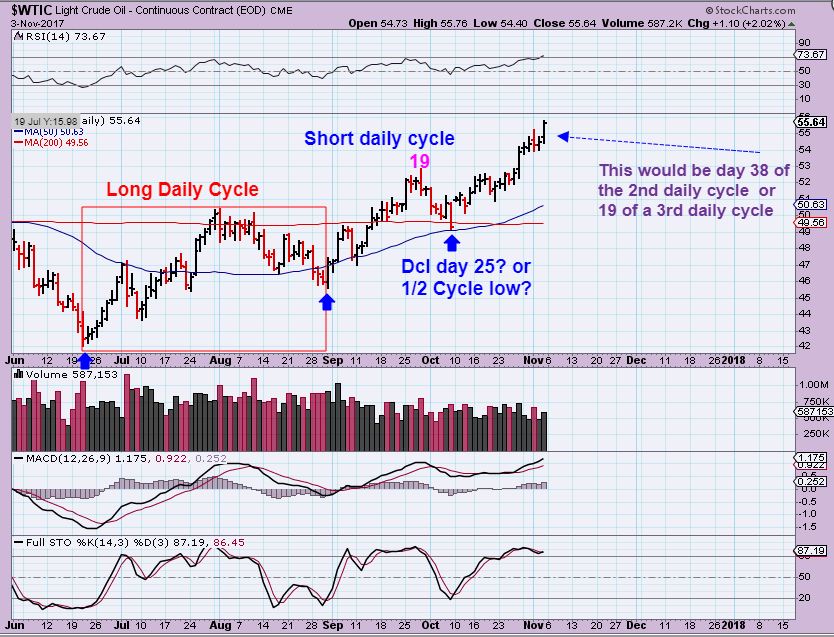
WTIC – Oil broke even higher on Friday and our energy trades continue to climb higher. Some are moving out of double bottom lows, others out of higher lows into what could end up being a 3rd wave (following a very nice 1st wave). Please read the chart. I called day 25 an early daily cycle, but maybe its a 1/2 cycle low? Either way, this is lined up bullishly as a peak on day 19 or day 38.
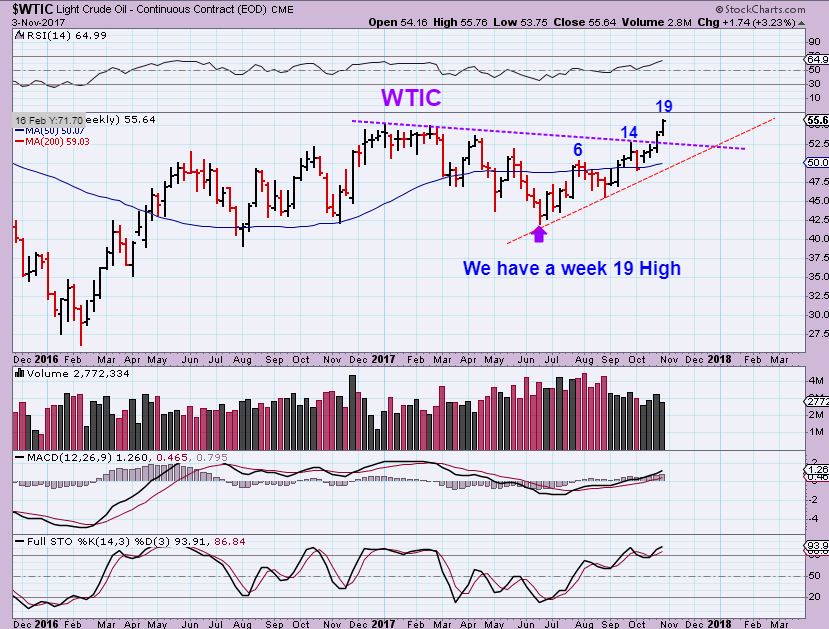
WTIC – I actually drew this weekly chart on Thursday of a possible longer term Cup & handle developing down the road. I drew this before Fridays pop above the red dotted line, so Oil now has moved above ALL highs in this picture. Oil is a Bullish 1&1/2 yr consolidation.

WTIC – I drew this weekly chart after Fridays close as it broke to new 2+ year highs. Consolidations build pent up energy – Can you picture how fast & high this could run if this break out is from a 1+ year consolidation? A back test may be in the future and then higher Oil prices ( You may want to Fill your Oil tanks for the Winter, if you haven’t yet and you live where cold weather is approaching).
OIH – SO in the last report on Friday, I mentioned that I am not afraid to buy new positions (and I would not short this), because it is not overbought. I used this chart below to show that we could be at a 1/2 way point based on the first leg up.
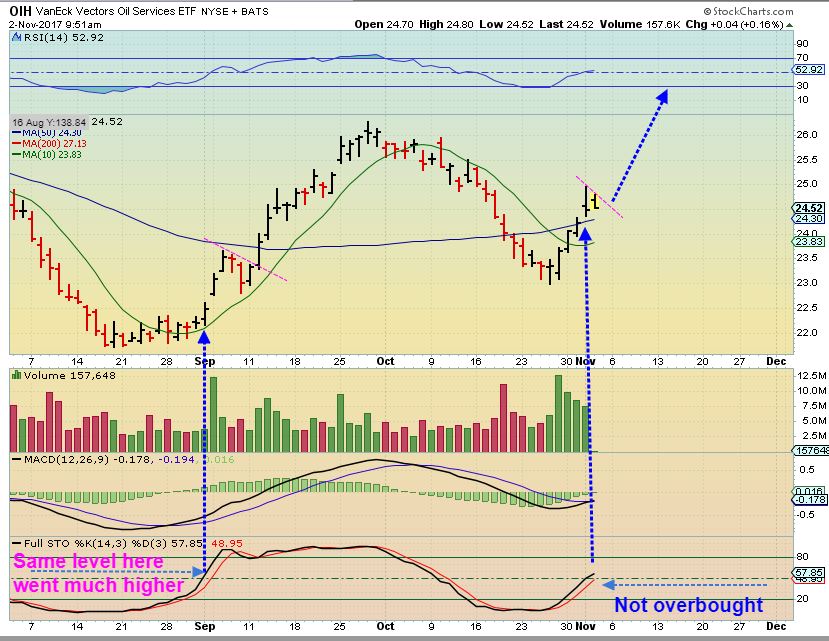
OIH FRIDAY : To try to help us to see that again, please look at the matching Magenta boxes. The current ‘pause’ is not even as overbought as the first Magenta box ‘pause’, and that was only 1/2 finished. To me, that ‘pause’ is like a Bull Flag, and is NOT a good place to go short. It would also still be OK to take a long position in an Energy Stock that is not overbought. I’ll discuss that later. OIH $27 is do-able, and if this was wave 3 of 5? Breaking over $27 is do-able. It could break that 200sma and back test it on ‘4’.

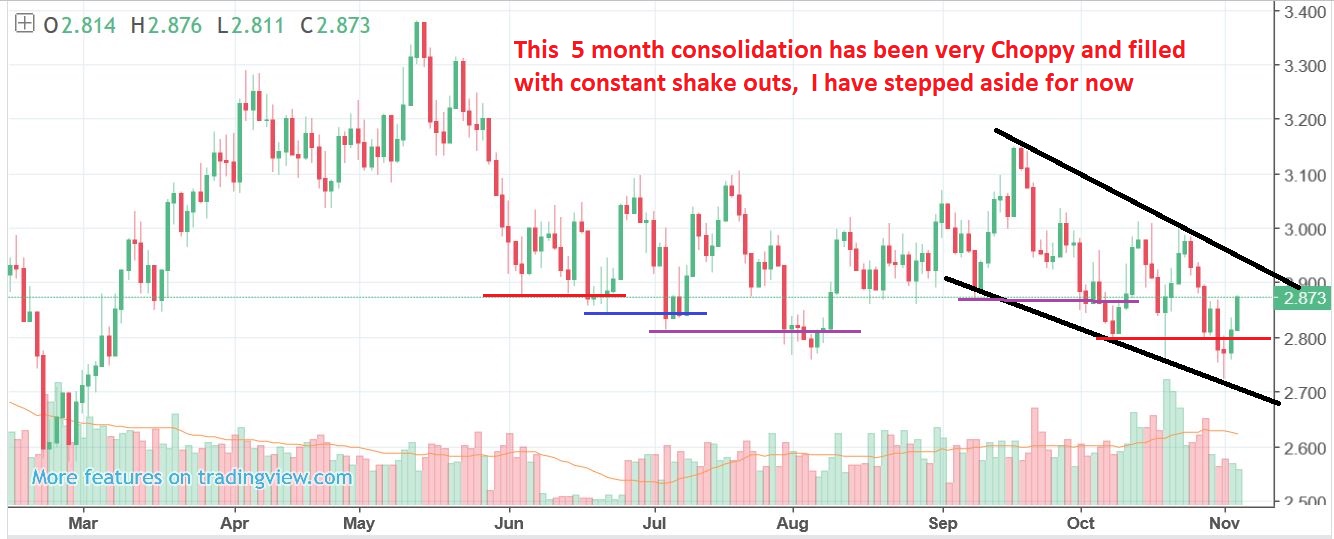
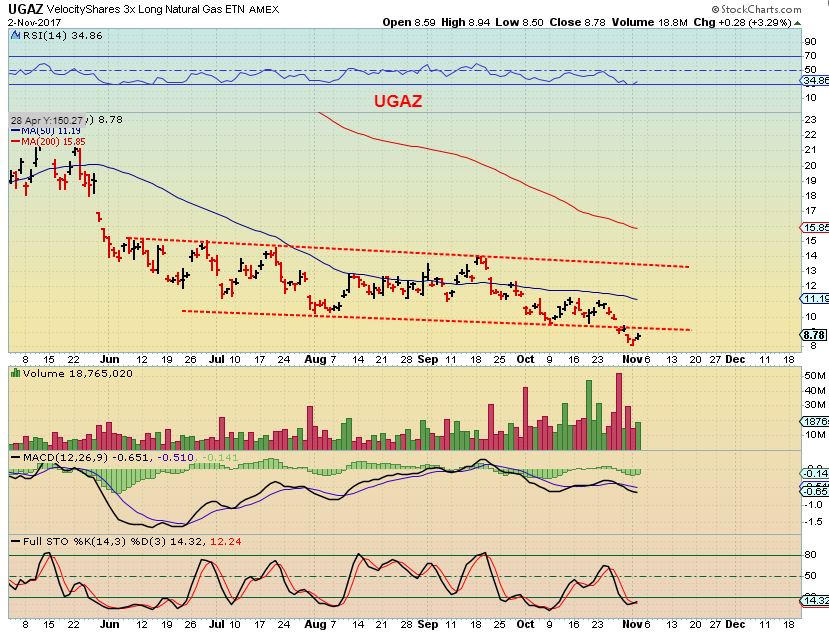
NATGAS – This is how my brain views the Natgas trading lately… “This is Choppy, difficult, tons of ‘running the stops and reversing higher’, frustrating at times, this has been tough to trade and I barley get out with a roll of quarters in my pocket after 2 weeks? So I have moved over to Energy stock trades and the money is far easier to lock in over there.” Eventually I think that NATGAS will break this LONG consolidation & trend and be a good trade, for now I will pass & graze in greener pastures. That is how my Brain views NATGAS 🙂
UGAZ – I drew this for someone on Friday morning, and it moved a bit higher on Friday, but my point was…. If Natgas only makes it to the top of that black line in the ABOVE NATGAS CHART, then UGAZ may not be able to break back inside of this channel, making Fridays move just a back test. A break back inside the channel, however, could run to $11, or even $13.
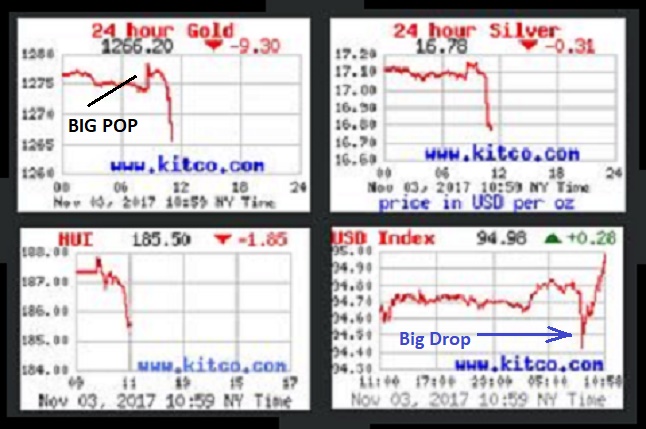
PRECIOUS METALS– We had the ‘Jobs report’ Friday morning and GOLD & SILVER POPPED staright up, the USD DROPPED sharply. That was a head fake, so Gold Bulls may have been excited and started jumping in, only to get stopped out. 🙁 The picture below was captured 1.5 hrs after the market open. At Chartfreak, we wouldn’t be fooled, we’ve expected lower prices in Gold & Miners to a dcl & then an ICL.
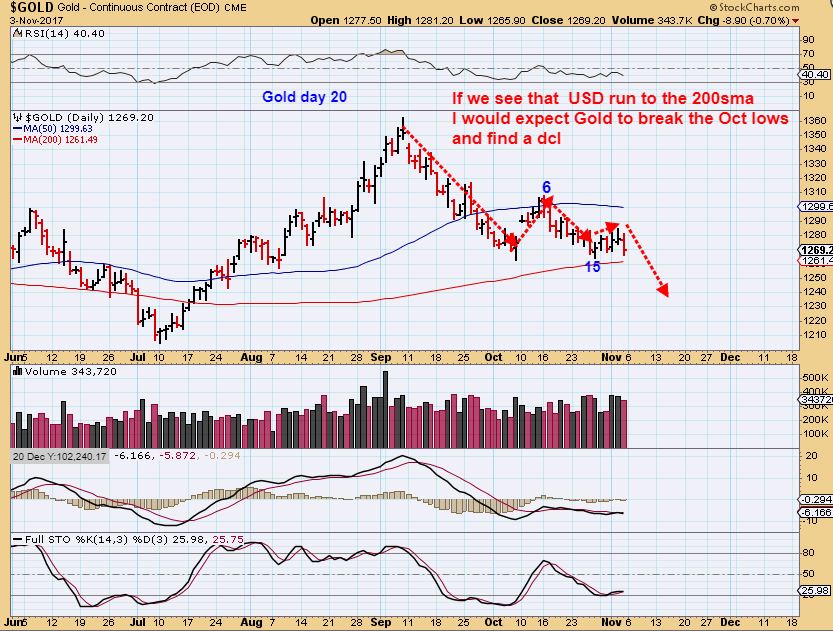
GOLD – Friday Gold sold off and looks like it may be ready to break down below the Dcl on Oct 9 & the day 15 recent higher lows. At day 20, a drop may just be a ‘shake out ‘ at the 200sma, and that could be our next dcl, or this could flush out and then bounce out of a dcl. I am not in this trade ‘long’ or ‘short’.
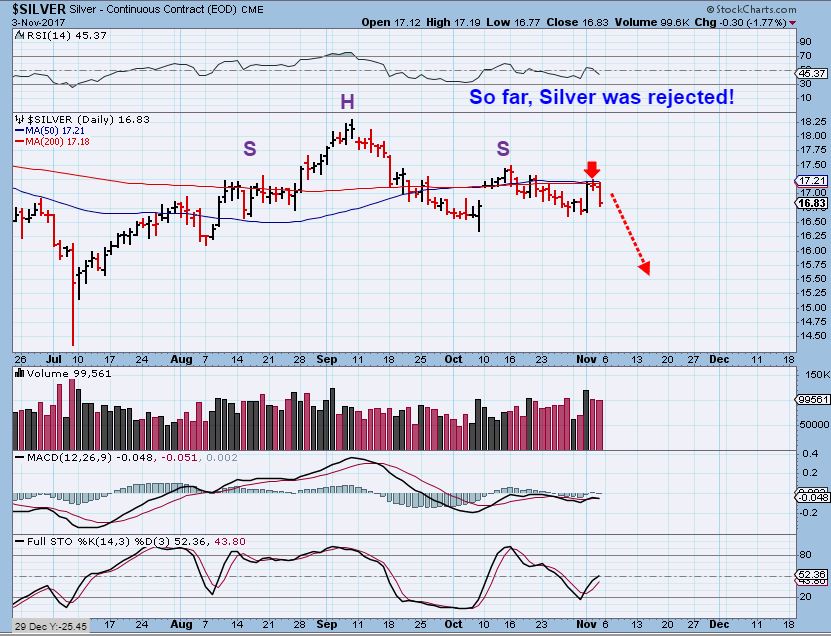
SILVER – In Fridays report, I mentioned that we were expecting Precious metals to drop, but couldn’t help but to notice how bullish Silver looked. It looked ready to break out above resistance and had a higher low above the Oct dcl.
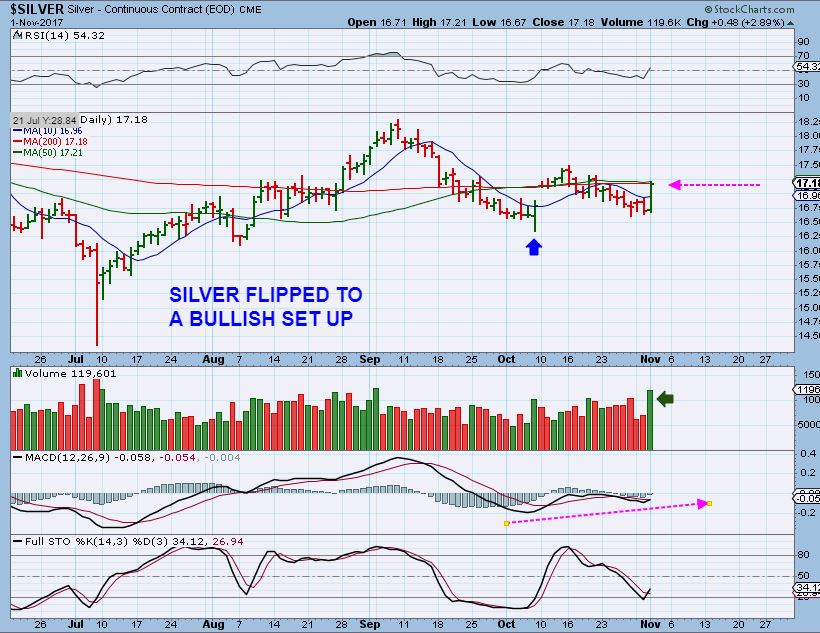
SILVER – And then came Friday. Resistance was resistance and the ‘timing’ is due for a dcl. Now this looks like a H&S. Next week really should see the USD move higher and Gold & Silver move lower. Those are my expectations at this point.
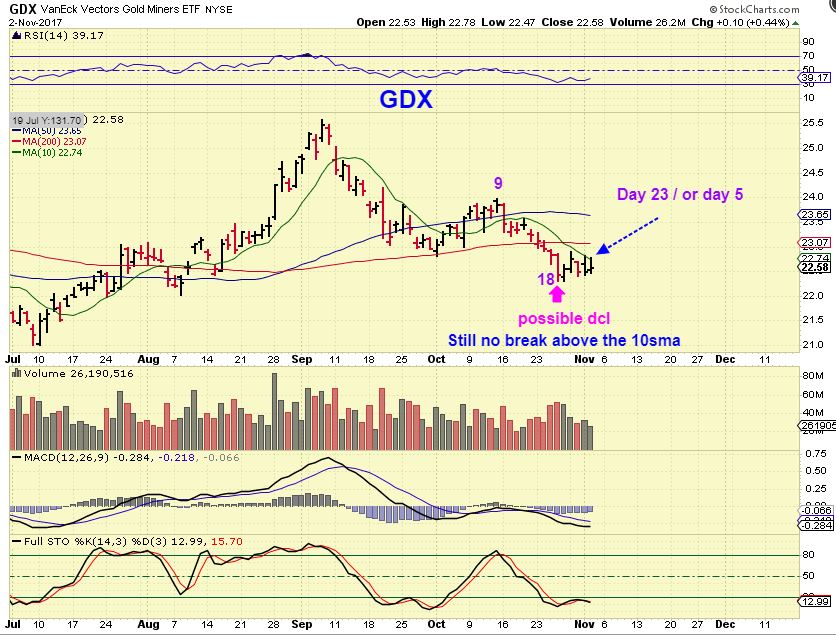
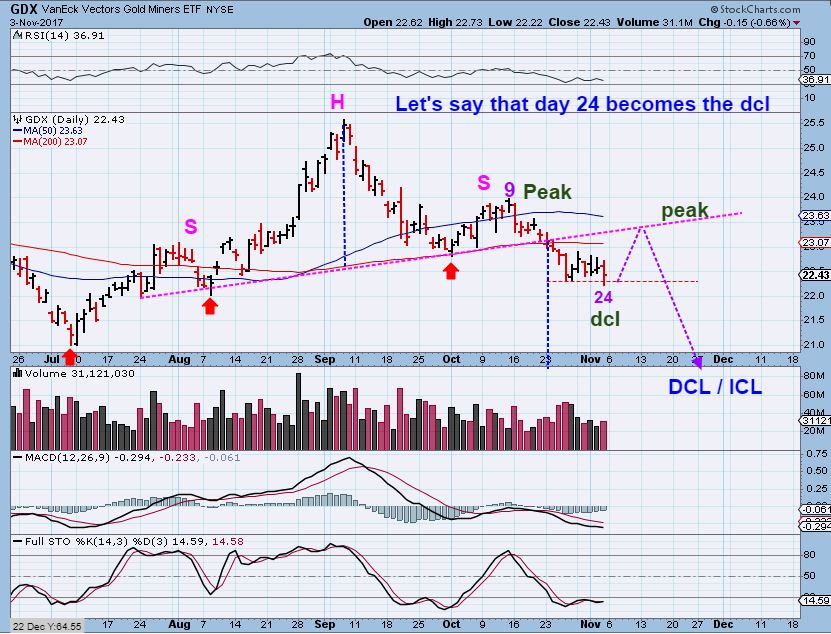
GDX – Friday I pointed out the weakness in Miners. So far GDX was unable to push higher than the 10sma, and if they couldn’t, the daily cycle would continue on day 24. If they broke out higher, we may have a day 18 dcl on a shorter daily cycle.
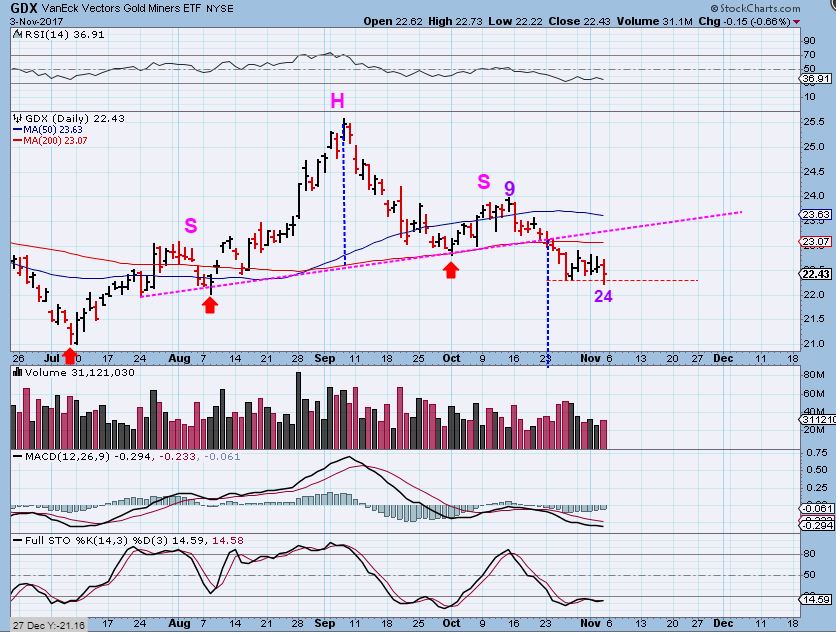
GDX #1 – Friday GDX broke below the day 18 low and Friday was now the lowest low of this 24 day daily cycle. This H&S targets the $20+ area, but a bounce could come anywhere in between too, so I would not be fooled into buying a dcl or bounce. I think that the ICL lies ahead by another couple of weeks.
GDX #2 – So lets just picture it this way ( THIS IS NOT A PRICE PROJECTION, JUST AN IDEA OF WHAT TO LOOK FOR). GDX drops , puts in a dcl, bounces in a new daily cycle, but THAT would be expected to be L.T. too, so it could ‘peak’ early like the last one & roll over into the real ICL Buy Point.
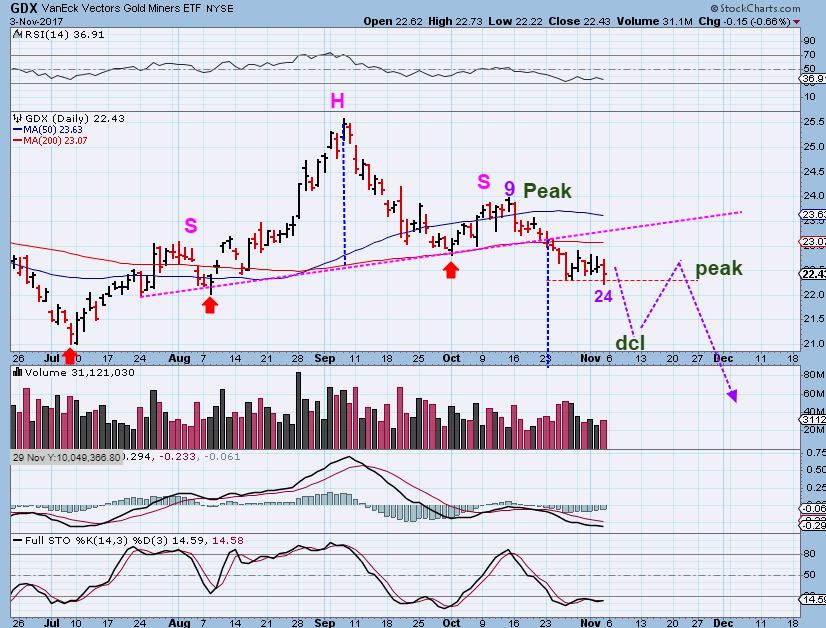
GDX #3 – Even if Friday was a day 24 dcl, I really would only expect a back test of the 50sma / trend line break, a peak early, and a drop as shown.
Review: Weeks ago I saw many people saying that Octobers rally would break to new highs, but I mentioned repeatedly that even though I Did expect a bounce at that 200sma, I wanted to be cautious of a peak within roughly 7-11 days. I played it using leverage, and said that I would only stay in for 7-11 days. I got out on day 9 and the peak was in. I repeat this because I feel that we are eventually going to get a similar set up, and now you know what that looks like when Miners start to bounce. Usually in other blogs, many want to start buying and say that you are missing out, but I think that it will peak early too. Unless I see signs of something different, this is my outlook. I will keep us posted in the daily reports and weekend reports. For now, I am mostly focused on the Energy sector ( and still have a few biotech trades on, and I do own NAK). So…
1. General Markets remain bullish and somewhat early in the daily cycle. They could be heading toward a parabolic blow off top, since the pull backs are becoming more & more shallow.
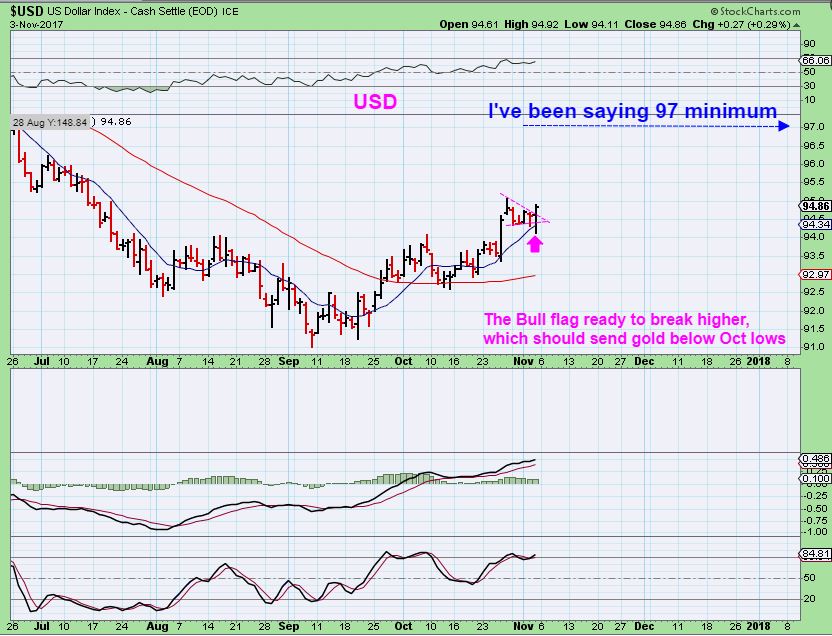
2. The USD remains Bullish since calling the ICL in Early September
3. OIL and ENERGY remain Bullish.
4. NATGAS is too choppy to provide good reliable outcome for my preference so far. I did try and I spent 2 weeks in UGAZ, and made a bag of nickles.
5. Precious Metals do keep bouncing and Gold & Silver have really gone sideways for a while, this is likely drawing in Buyers, but GDX has remained unable to break above the 10sma and keeps falling to new lows. I expect a bounce (Dcl) and then more downside before a real special Buying Opportunity presents itself.
Note: Some Miners are impressing me with their bullish set up despite all of the selling. SA was actually at new 1 yr highs, NSRPF is strong, and GSS and EGI were breaking out this week on 3 month charts. I am still trying to be patient in this area to avoid draw-down, but you of course can make your own decisions in this area if you feel that you are going to miss an opportunity, want to start a small position, whatever your style is. Some of these mentioned Miners may not pull back to new lows from here, but some of the gains from the Energy stocks can make up for missing THE lows in any miners, in my opinion.
That’s a wrap for now, things continue to line up nicely. I will also discuss a few Energy trades below.
Enjoy your weekend and thanks for being a Chartfreak with me!
~ALEX
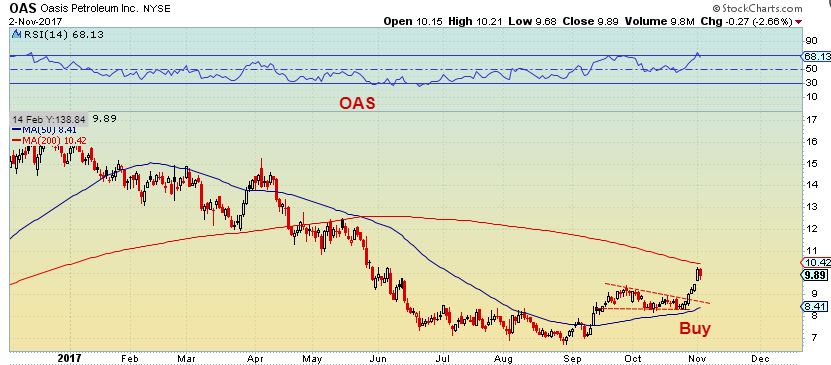
OAS -I want to point out how some of these trades are working out to build confidence in the sector. Oct 26 ( last week) I pointed out this BUY. I expected that a break out would run to the next resistance area, the 200sma.

OAS 1 week later – And so far it has headed right for that overhead 200sma. It also could just break out & continue higher after bull flagging here, time will tell.
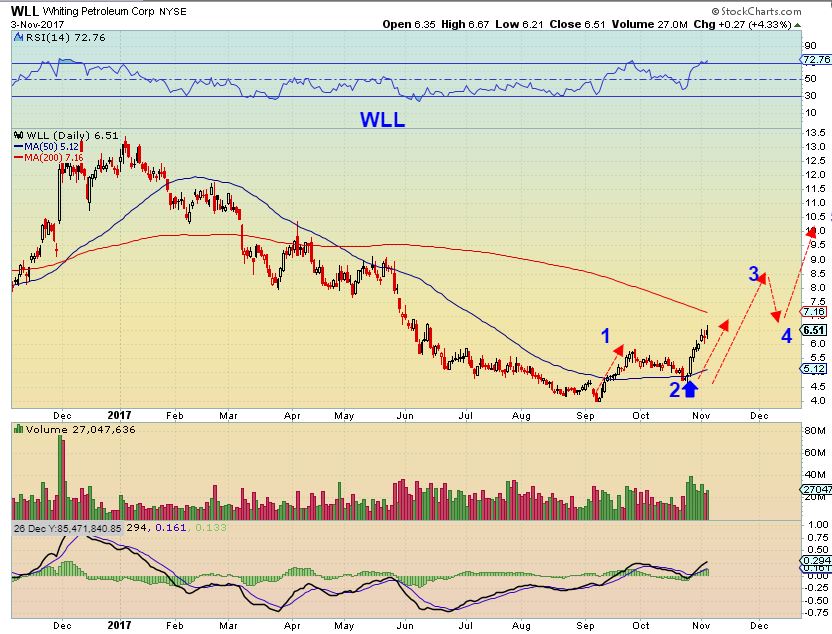
WLL OCT 26 – I mentioned that I was mainly looking for companies that had already released their earnings, I felt that was safer. So WLL released theirs and I bought it breaking out here with the same idea. It should run in a way that might equal the length of the first run higher ( or more if it turns out to be a wave 3, following wave 1&2).

WLL 1 week later – SO far the Run is following through.
So in my daily reports, I have been pointing out which ones have released earnings and which are due to release theirs soon.
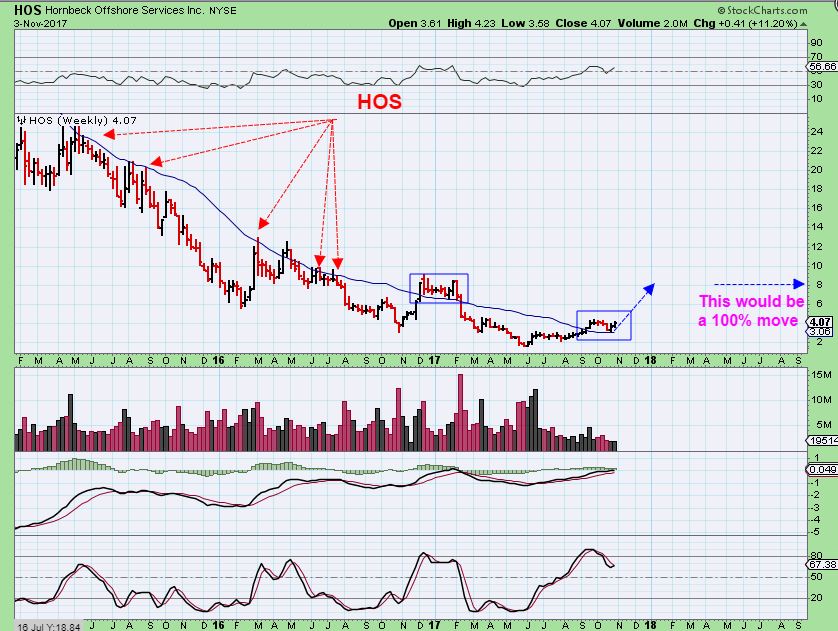
HOS – I re-entered HOS, because I traded this when it ran from the 50sma to the 200sma, and the gains were FAST. It ran from $2.50 to $4.40? I sold at $4.23. This consolidated above the 200sma last week & earnings came out Wed night, & it popped Thursday, so I am back in just below $4. Where is this going?…
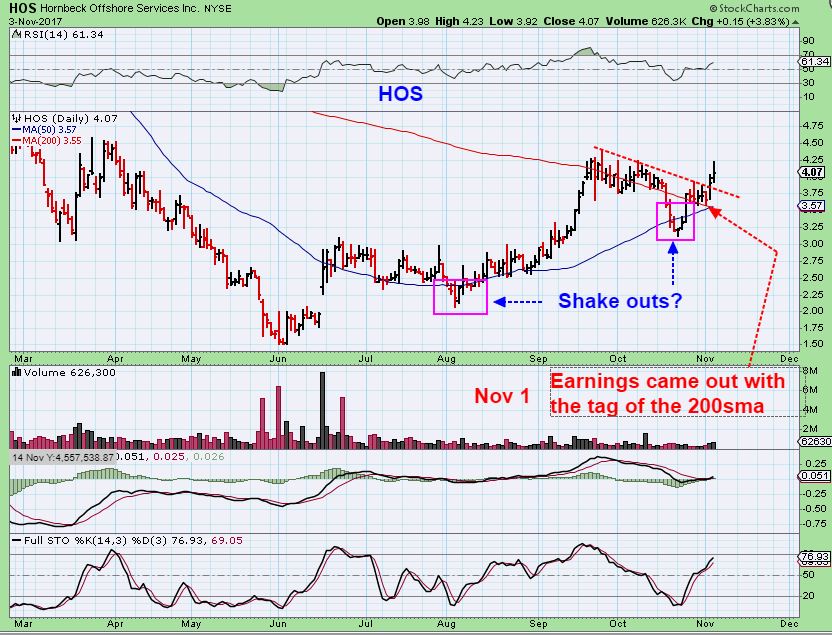
HOS WEEKLY – I’ll take $4 to $8 or $12 please 🙂
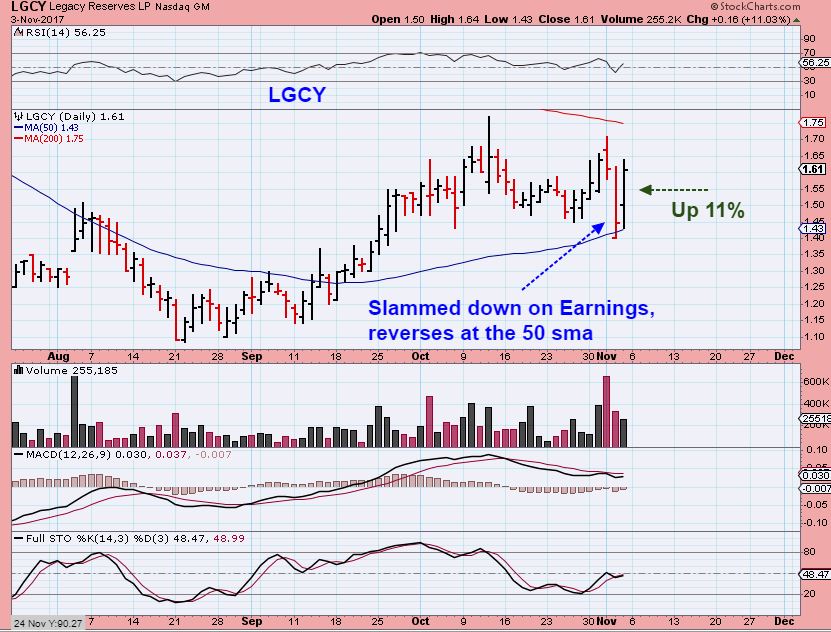
LGCY – LGCY slammed down on earnings, but it basically held the 50sma and then on Friday it shot higher by 11%. Is this bullish or scary? The weekly is…
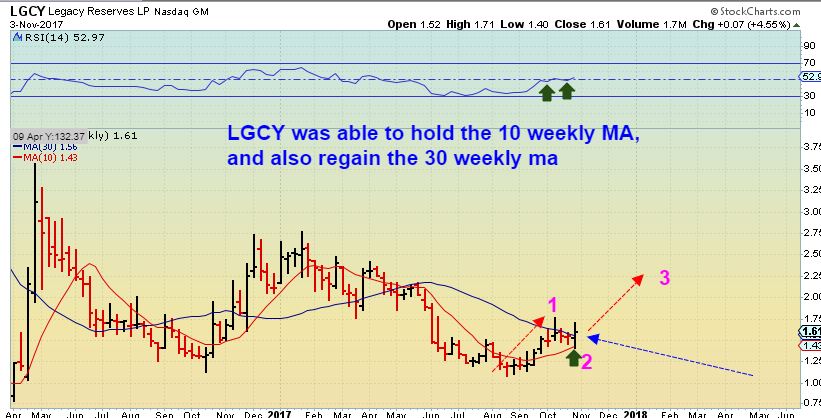
LGCY WEEKLY – VERY BULLISH at this point. It is important for a weekly chart to hold price at the 10ma, and gaining the 30ma is a bonus, so take a look at LGCY after earnings. This is a bullish weekly reversal buy with a stop under the 10 week ma.
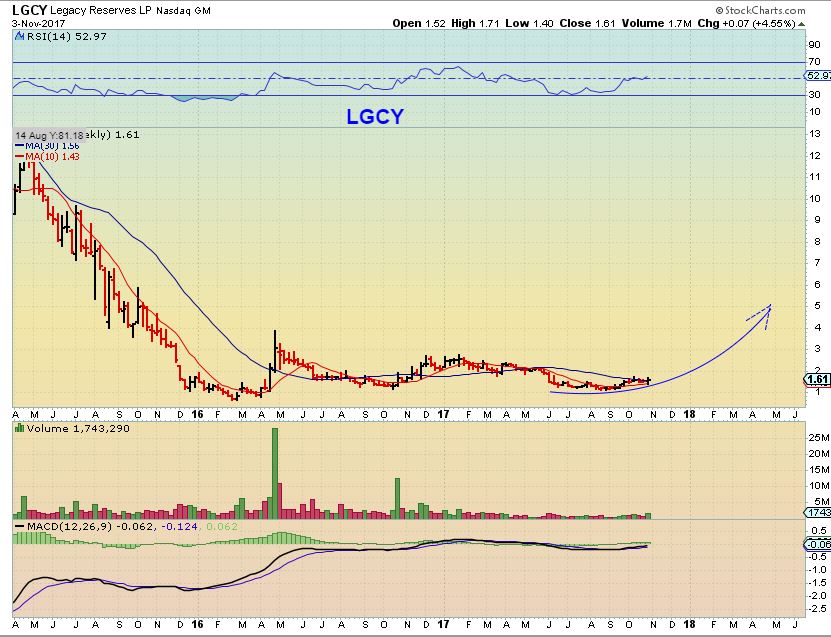
LGCY WEEKLY – And that big picture is not too shabby either. We at Chartfreak rode this from the $1 area to the $3 & even the $4 area last year. It looks like Energy is perking up and LGCY is too.
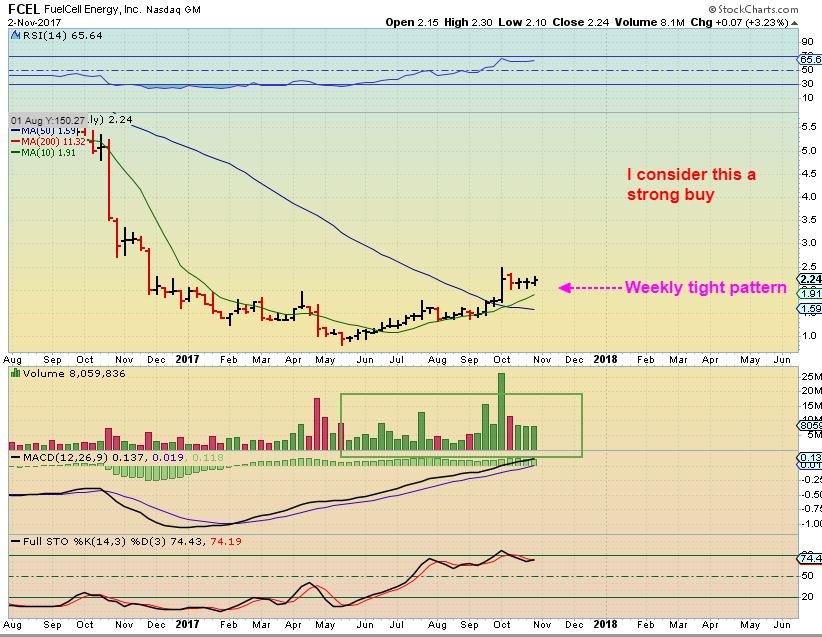
FCEL – This is called a ‘3 weeks tight’ pattern. They also can turn into a ‘4 weeks tight’ pattern, this may be 4 weeks tight. It is basically a Bullish Weekly Pattern above the 10 ma if the volume looks like that, and so I bought it. We’ll see if this turns out well in the coming weeks.
I was asked about buying SID, a steel stock. I made great money on SIDs recent run higher last summer, so I would be interested in going long if it was a good set up. Can we look forward to another great run higher in Sid? Let’s look at 2 charts, a daily & a weekly.
SID – This is not a low risk buy really, this is an ugly break down. Yes, It could bounce higher, but I feel that it will just be a bounce / back test.
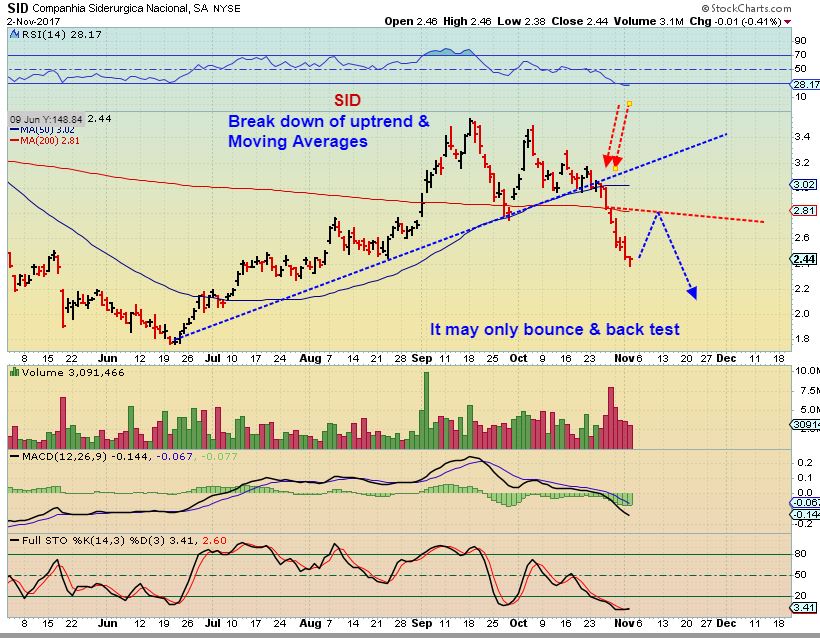
SID WEEKLY – NO SIGN OF STRENGTH AT ALL YET. There are way better trade set ups out there, with far less risk of being washed out, unless this regains the blue moving average immediately.

November 3rd – PULLBACKS 
 Oil & GOLD
Scroll to top

Thanks, Alex. So LGCY, FCEL, and HOS are your buy nows for energy I take it? I got into WTI and FCEL but would like to add a couple more. It seemed like OAS and WLL were for illustration of the trend.
Also, bitcoin talk. I recall you said you were watching BTSC, and I noticed that it closed above the 50 day sma on Friday. Do you think this one is ready to roll?
Hello Peter,
On this report I did mention two that released earnings and are still looking ok ( low risk due to not being extended) as LGCY, FCEL, and HOS. I also bought and am still holding WTI – it did not POP after earnings, it dropped a bit and recovered Friday, so I am holding it and hopeful that the drop was a fake.
And correct OAS & WLL were mentioned in earlier reports and the progress shown was to give confidence in the set ups that are appearing in this sector ( And those 2 were not the obnly 2 with follow through – there are many others).
GST , WG, DNR and a few others release earnings next week, so I will likely mention a few more in the next report, although DNR looks very good right now ( WG is not looking so good) Pre -earnings.
I ALMOST bought DNR last week at $1.15 area breaking above a downtrend & 10sma, and it is already $1.30 – I didnt buy because earnings is Nov 7.
BTSC – I was watching that and BITCF at the same time, and BTSC looks better and could be bought as a risky investment. I say that only because it is a penny stock and needs to be watched regularly. Bit coin is at new all time highs and these aren’t – so something else is driving them at a slower rate too.
Thanks for the thoughtful response! I also started a position in ERX, so LGCY would be a nice add to the energy portfolio. I don’t want to get too heavy in energy.
Excellent charts..Excellent analysis …
Verrry Exciting…
#BeautifulMind https://uploads.disquscdn.com/images/922ebf1549bcdebf5934b9a0d6b3c8493a6cb468a44871d570ecbe9bf36fd71f.png
Thx Maria – I appreciate it
OMG
lmao….i callzUM az i seezUm
#HFT
MEOW
Bill wants a ‘Meet & Greet’ at the Treehouse
no bill just has …
o nevermind.
yes.. lets do it .. …
a good friend of mine is a big Bruins fan.. i was thinking of looking into getting tickets to a game sometime & hanging out for a day or two….
#Meow
damn natty…..
Hi Alex. many thanks for your comprehensive and early report.
I am also watching BTE, CRMD and INFI as possible buys for Monday, do you agree that they warrant buying
Thx Eifion – These are tough, because you would be entering after a bit of a move higher from support areas on some, so there could be a little more consolidation or even a dip after you get in. If you understand that, I would say that they can be bought, because they also may have more upside left in them.
I did like the set ups for CRMD & INFI last week, I mentioned INFI in the comments last week, but if you buy them you would need to keep an eye on them. It would not surprise me if they still want to POP & drop back into consolidation, because they did already have that pop & run and a short consolidation- to see what I mean by this – look at INFI , and then look at ECYT. Sometimes after a strong run, they consolidate for many weeks, and will occasionally POP above that consolidation, but it does not lead to another ‘run’, they drop & keep consolidating. So look at a 3 or 6 month chart of the INFI POP now vs ECYT Oct 16-23. It Popped & dropped because it needs more time. This is also why I didnt rebuy VSTM right away after selling out of each of those strong runs ( See VSTM on a 6 month chart). Once I get the strong run, I often leave it behind & move on.
BTE released earnings on Nov 2, it may move higher and continue, but it is a bit extended too. It has run from $2.30 to $3.05- that is a good gain already.
IT broke above the 50sma last week, and is now breaking above the 200sma, so yes It could run, but it might also do the crawl that we often see around the 200sma- so it is a bit of a tough call.
I like to recommend low risk, where a stock sits on support, in a base and is ready to run. BTE has run, and can continue higher, or pull back
Get report as always!! Thanks Alex. I think I’ll add to my OIH and take a stab at FCEL. I l already have a half position in LGCY. Also, I’m still holding NAK, IPI, OGRMF and MBOT.
Hey 50
‘Take a stab at ‘ FCEL’ – I Do like that weekly set up very much, I own it, and 1 concern is the 50sma is down at that gap. If it was a clean break away gap, it doesn’t have to fill, but that weekly chart is very bullish if it is 4 weeks tight pattern, so I like it and that is why I bought it.
LGCY has that 200sma right overhead, but I like that reversal Friday. I’d like to see it just break through.
I still own all of the ones that you mentioned ( I dont own OIH, but I’ve traded GUSH).
Hi Alex,
thanks for the great report,
but something I really like about you as well is your follow up on our questions on the blog – they are great as well
so a double thanks today !!
Hi Alex, just curious, why don’t you trade inverse ETFs when the miners complete a run and start dropping? The drops can be quicker and more profitable than the rallys. IMHO! Maybe its not how your wired. Just curious, I do trade JDST on occasion.
Hi Bill,
I have and I have mentioned it here. I traded JDST in the past. This time, I have better long trades in Energy than waiting for a drop with possible bullish pops. I use discernment and my own best judgement. There are times when Miners drop very quickly into dcl / ICL- Bear markets are great for that. During more bullish set ups, like we just had with triangles- you get less drop right away and more whipsaw/ sideways action.
In a 4th daily cycle, I might try it, not sure if I will openly recommend it though.
I didn’t take a JDST trade this last time, not sure why? It seemed obvious at the time we we sold our JNUG positions. No brainer in the rear view mirror. When you meeting me at Tree House?
We should have met up this summer or Fall, I’d just take a long ride and wouldn’t mind waiting in line.
I’m not sure if I want to do the wait in the Winter? It’s coming quick. They’re talking about 70 degree highs today, and 39 degree highs on Saturday. That’s a quick change. 🙂
I agree, wait for the spring. The new brewery is much larger and they make a lot more beer now, BUT, the lines are still there. The only good thing is you can get a lot more beers when you get to the end of the line.
You said they used to run out too. Maybe that prevents that. I’ll look it up on line, I didn’t know they added on or built a new facility. They should open a small restaurant too- lunch & beer to go. 🙂
They never run out of beer now. They may run out of some of the beer, but you will have some others available when you get to the end of the line. They usually let you buy three or four different ones each day, one of them may sell out but you’ll get something. They have a brand new facility in Charlton, MA. Food trucks usually there if you get hungry.
http://treehousebrew.com/
Check out the line on the left side of the cars? Average
Thats a nice piece of land they bought with your beer money – Nice shot of the foliage.
You guys gotta export that stuff to Hawaii!
Part of my reason for not taking a short when I cut my JNUG is because I expected a possible peak on that day 9, but I’m surprised that you dont remember me buying JDST the last time I expected a peak and we got a sideways chop & a ‘double top’ right here shown on this chart attached. It doesnt look bad on a chart, but in real time, people followed me on that trade and it took weeks , and bounced higher & looked like a rally ( at the double top). SO I was going to wait this time
https://uploads.disquscdn.com/images/5d84c4d96ce160ae84314d61784d41f599bcbe085c8c4404117d19f2f9ba1b3a.jpg
If Miners bounce here on the chart above( DCL) to the moving averages, that may be a good short
I don’t remember because I forget everything. Part of getting older. I forgot my thermos of coffee at home this morning. Argggh.
LOL! I know ALL about this!
I forget what we’re talking about
LOL…but you are too young for this!
Anyone experience the standing in a room you just went into, wondering what you went there for?!
🙂
Yes, it was to get the scissors, so go get your scissors
NOOOOOOOOOOOOOOOOO! Coffee is a must for me. I hope you hit a shop along the way 🙂
I have been stalking it but miners are actually oversold right now and were grossly oversold at the sight of that possible DCL on Day 18 (from report). If we get a bounce I’d take a JDST there into the ICL for sure but don’t feel as comfortable shorting starting from oversold as these guys have actually been in a fairly tight range if you look at a longer term chart.
CASON, I agree, no way I take a short position here, BUT when I sold my JNUG 10 days into the cycle I should have
Alex, what do you think of the turn in CATB? Change of direction or can’t tell until it breaks above the 10sma on the daily chart? The hourly chart looks like a turn.
Can’t tell from one day. We had one 5 days ago, maybe 12 days ago and 17 & 19 days ago. They often trick people into jumping in and then the consolidation just continues. I’m not saying that this one won’t get follow through, just pointing out that we’ve seen them before and they amounted to 1 or 2 day pops, and then the drop continued.
I am watching GNE, but that chart is a bit crazy. They released earnings last week and on a 1 year chart it may be a double bottom.
On a 3 month chart, it looks like a possible reversal last Thursday & Friday. It is quite oversold.
Konnichiwa from Japan!! It’s 11 PM on Monday night here. Let’s see if I can get some good trading in this week or not! GL all!
hey case…. thats nuts.. u really ‘get around’ dont u… 😉
I sure do. Oh hey wait…
You’re going to be trading in your sleep? 🙂
Hmm…well it sounded good at first but now that you put it that way…
I stayed up half hour to see what’s happening. How about that nat gas trying again?! 😛
Wow! Nice place to be.
Just a few days for business then back home! Not much time for recreation though.
Stay away from the blow fish
Refresh –
Guess what….AMD did follow that bullish pattern- it is up over $1 pre-market with a new deal to work with Intel , and these were the lows. That is crazy stuff.
https://uploads.disquscdn.com/images/6e326d087ca4a74788374b0d9aa5582f98fc6001f6aaa9d691980715d881408e.jpg
And I think Bay Trader re-entered it 🙂
Hi Alex,
Based on your earlier reports i was watching quite some time to enter into AMD. Just entered last week @10.80 for 200 shares. Nice to hear the good news. Also entered DDD @9.00 for 200 shares (fingers crossed).
$10.80 – that’ll probably look like the bottom soon 🙂
250 shares… Starter… Reallllllly wishing it was bigger lol just been burned on AMD i was trying to play smarter… Oh well… lmfao
Hi Alex,
Earlier i entered RIOT @6.60 last week based last week reports. Looks like it is up. Like you said quite difficult to ride. The moment i entered up..down.,..up. Any way just a 100 shares i want to leave to some time to ride.
I don’t think I put any of my block chains as a recommendation in the reports.
I hope you didnt ‘Buy it based on the reports”, because I was not going to give a buy recommendation on those. I just mentioned in the comments that I have been trading them as a fast trader, experiment, gain experience, etc personally, but they are not easy to ride. Peter sent me an email weeks ago, and I mentioned them to him as my Block Chain / Bitcoin type trades, but they are fast and tricky… I’m glad it is just 100 shares 🙂
Yes Alex, you din’t recommend but you just mentioned.in earlier reports. I was looking to invest little money for a try. I will follow up and exit with good gains (hopefully).
It is a bumpy ride, especially if it needs to tag that 50sma before moving higher. SO far, it is sideways drifting, but each day is a pretty big move . I hope you lock in some gains too. 🙂
Yeah PRELF took a nose dive. I still got out with a nice gain. I’m also holding BTLLF which is super volatile, but I’m looking to add another small position.
TOPS? anyone in shipping?
We discussed them in the comments last week. DCIX, TOPS, GLBS, and DRYS were busting higher, but some of them have had reverse splits every month for 4 months. Thats crazy.
DCIX has legal issues.
Is anyone using stockcharts and having trouble today? I keep having it crash on me
yep more people having problems with stockcharts
The APHQF trade is working out well. I’m not sure if any read when I said I bought APHQF and OGRMF as Canadian MJ trades with promise as they try to pass the legalization use of Medical MJ
Not aware of it.
Yeah, I mentioned those in the comments here as the news was discussing Canada working toward legalization and how big of a market it would be.
I mentioned that similar to Precious Metal Miners, it appears that the stocks rise & do not seem to pull back as much as the ones in the US.
Thanks for repeating. 🙂
I bought OGRMF.
Yes, I still own that one too. Look at a 2 or 3 year weekly chart and it is a largely bullish set up. A strong consolidation after a strong run up, and it looks to have broken the down trend .
Todays chart looks like OGRMF is going to start making a move to ‘attack’ those highs. If it breaks from this consolidation, it could be a nice move, so I’d hold on. I’m not selling mine. The current volume after 1 hr is the same as fridays total day volume. I look for that to see an increase in buying interest.
MTBC down 20% on earnings while revenue up.
NOG & EVEP ( And I’ll throw CRK & BTE in there) showing what the buying interest can do, or showing what the short covering can do, but either way- their rally continues onward and upward
Anyone in LGCY – It hit the 200sma overhead, but it does have good volume in the 1st hr , and that usually means that with earnings out and that strong reversal last week at the 50sma, sellers are done & Buyers should continue to like it.
BAS & CHK = Honorable mention 🙂
Right behind you in LGCY.
DNR not too shabby either… but im waitn on the ‘2’….
3 month chart, the ‘2’ is in, right?
The only reason I didnt take DNR is that their earnings are Nov 7th, but I like the chart
damn i did it again.. sorry… like this .. since i missed too much already .. id rather wait
https://www.tradingview.com/x/BhOauU8t/
Oh, you were discussing 2 of 2
2 of 2 MIGHT have been that back test of the 50sma ( Subtle). It probably depends on earnings Nov 7
actually … 1, 2 – are in like u say … now im waiting for 1, 2 (of 3) to complete so i hop aboard the ‘3’ or C whichever the case may be 😉
#Shhwwwwwinnng
Thx Dr. Seuss
… WOULD YOU? COULD YOU? IN A CAR?
EAT THEM! EAT THEM! HERE THEY ARE.
refresh for my view
https://uploads.disquscdn.com/images/e35043d407b24f3bee4b5b6e18b29a98828e08d2558143643d84516b0bcae7ea.jpg
thank u .. Elliott .. ;o)
*i swear when im not this flighty .. ;o) just trying to work & trade I rush too much = errors ;o)
No, ur fine – earnings are coming out tomorrow anyway, you may get the ‘2’ then
LOL … i cant even type… i swear im not this flighty…. 😉
If natgas is bottoming, XCO & CHK could be 2 semi lagging energy plays that perk up
Is there a way we can tell if nat gas is bottoming? I know it’s so choppy..so….was wondering…? I know that probably sounds like a stupid question 🙂
No question is stupid, we’re all here to learn 🙂
Now for a stupid answer… It has been so choppy that I’ve lost track of the timing on it. I thought the lows were in, and with the huge short count & smart money long, I feel that it is just a matter of time ( And this could be it) when a short covering rally takes over.
So here is a chart. I thought that the last break out was good & it rolled over. This new rally lloks good, but they all have. I have personally decided to invest elsewhere and I’m making good gains there , rather than ride that Natgas rollercoaster. When it starts trending, I may show interest. Even after this rally- UGAZ is a bit below where I sold it , so it is a tricky bottoming process.
I think CHK & XCO do look good.
https://uploads.disquscdn.com/images/8fbc0b3dd27204e9048c90c86bc68ebd09928c26a2140aef3aeb5a56404b1341.jpg
This is good news …I have had XCO for awhile and am finally green today..I almost dumped but maybe will wait a bit. I think they had earnings today but have not gotten to read up.
hey NTA 🙂
I am assuming those are my initials and not some stock ticker I should check out?
Hi to you too.
NAK — close
refresh for last weeks chart & todays chart
https://uploads.disquscdn.com/images/ab38685fc893628b8073496d98695e137a6ea414e0dee948d939a9327a95ae4f.jpg https://uploads.disquscdn.com/images/b45625df76b5b3fe0444d378a8098bf5d5ca28b3597d72b20e47d9e62fece5ba.jpg
GDX / GDXJ both breaking above the 10sma. If I were short, I would close the short . We may or may not be putting in a dcl, but we are in the timing area that one could develop.
Alex…what is your take on GLNNF? When they break out and have air above….what usually happens? Fall? Big run? Consolidate? All of the above are possible I guess…..?
Either, sometimes they just continue higher with no resistance, until they get extended, and other times they pause, stall , allow the 10sma to catch back up if they are already extended.
Look at GLNNF on the Sept 25th break out. It had air overhead, but stalled and dropped to the 10sma, and then took off. So it can be either.
Thanks, Alex, for the NAK update
HTGM is one discussed here – currently it’s above the 10d and 50d with what seems to be good volume. Someone mentioned that earnings are tomorrow
Sometimes you prefer exiting ahead of earnings – think that’s a good idea for HTGM?
It is a 50 – 50 situation. Biotechs can be boom or bust.
Thanks for your thoughts, Alex
Picked up some HOS this morning. Thank you CF:)
Nice – this one really moves well when it gets going Kathleen, let’s hope it get going ! 🙂
Anyone who fancies tracking sexy SXE.. i think it may just be putting in a final 5 of a 5 of a c.
seems to be about 2months behind the other nrgs… so not only has it not runaway, its not even got off the ground yet (which means i got in too early and had to ride it down a wee drop)
vroooom vroom … BBG…
WLL .. what a performer…. 😉
Well I didnt get to catch BBG on the way up cuz im an idiot, but Im shorting it right now from .76… Just hoping that i dont get screwed lol. Im hoping to close this out tomorrow for a quick 100-200$ perhaps. well see
good … i ended up flipping into nog .. and a few others… GL 😉
what cha got up your sleeve mama?
i pretty much mentioned all im in…no?
CNBX, GRPN, OPGN, RIOT, NOG, VSLR, ITUS, HTGM, HPJ…
(sold BBG and WLL today)
FYI: I work full time…and just post when i can… i dont like to post my actual trades as I dont have time & ACTUALLY shouldn’t even be online 😡 i work in Systems&Networking besides 😡 YIKES
I try and post quickly when i see something that LOOKS like it might breakout …. as in “check this one out … It might ….. ……………………………
**i think WLL might be in ‘4’ tomoro…will try&jump back in after correction
Whats your target? 😉
no laughing …. LOL
https://www.tradingview.com/x/PcVOd9Lt/
on the LONG term chart .. I cannot tell if it is ABC down and done (now in wave 1 impulse up) ORRR
1,2,3,…now in 4 up … with 5 to come…
what do u think …
https://www.tradingview.com/x/pwdEjk5P/
u no i wear rose colored glasses…. so like 9.40 for the full wave.
please show me if i am way off….
very nice.. And im sure u have, I skim the comments.. OAS and SWN saved my ass this qtr so far… Looking fto close this year out strong. GL to u too!
ps. i generally trade the same stocks that CF mentions… which is how i bumped into him at the watering hole many moons ago…. 😉
Im in SWN and OAS and still feel like I missed the energy run… UWT, GUSH, CHK, LGCY, BBG, BAS, NOG**** ESV, etc… sheesh
OAS is up 7%
you spoiled brat ; lol
After the losses Ive taken this qtr… Thats just helping LOL… Im being greedy yes, but man… Some of these moves are like playing Lev. positions in miners lol
yes they are
You can always sell what you have and jump in one that is just getting started
what do u think about CHK here for an add… breaking ut yes, but not like the others.. yet… Im looking at that and XCO
?what do u think about CHK here for an add… breaking ut yes, but not like the others.. yet… Im looking at that and XCO
They look good, have they released earnings ? You may want to check that first
and I take offense to the brat part.. Spoiled yes, by you. Brat, no. More like spoiled….. ok brat works. lol
🙂
I become a spoiled brat too, when things are running like this and my GRPN was red this morning.
sooooo.. to late to add to energy now.. I did grab WTI at the open so not too sad… But Man.. Im really wishing i went heavier in OAS and SWN and grabbed BBG and GUSH… even NOG….
I second the motion
#Spoiledbrat
lol
*KneeSlapper ;o)
ha ha ha he opened the door … I just walked thru …………..
https://uploads.disquscdn.com/images/d4d70782a67571a4c085cafbc51bd368a625defb02684c713f682e86a23d35b0.gif
Sold OAS on first tiny pop. HATING that!!! Darnit!!!!!
Is MBOT a sell below 1?
I was JUST thinking of how I just wanted to sell MBOT and put it in LGCY or NAK or something about to run a bit, but then I looked at the chart and (refresh) it looks like it did last time it dropped toward the $1 area. It formed a tight trading range that formed a descending wedge and then POPPED. Being this oversold, I decided against selling, but it is pretty tiring waiting while all the other areas are running .
The answer to your question is that my stop was under $1. It may depend on where someone bought it too.
https://uploads.disquscdn.com/images/9c18d503648afb5e88137d6ce6f051d898540bf97204bce16f0c5dd497fc0210.jpg
Hi Alex,
As you mentioned below NAK close to breaking downtrend line.(depending if you are using a pencil or crayon)
RGLD, FNV seem to have broken out
GFI, AUY very close if not above their downtrend lines.
Wow, FNV almost at new yearly highs.
Alex, can you comment when you expect the next DCL to come for oil? I want to add to my ERX position, but oil stocks are drunk right now.
It could be a while Peter, I mentioned the cycle timing in recent past reports.
Sorry I can readdress it all right now, but I have to go to lunch now – I am expected somewhere.
Thanks, Alex. I meant to write in “perhaps in your next report.” I know it’s not the type of response you can just fire off quickly. I found in your previous reports info. on cycle timing etc. but I wasn’t sure if your opinion changed at all given today’s price.
For those who like natural gas and income, you might want to check out SJT (San Juan Basin Trust). Monthly income, high yield, constructive chart. I’ve been a unit holder since Jan/Feb and am looking to add. https://uploads.disquscdn.com/images/a26e727c0d3b1bf8a8e81ab43dad579c706ce9d2d64e9c2c48b5d8abdbf4592d.png
Thanks Mark.. I likeit!
Thanks, Mark.
nice… what do you see for a target…? something at all like this?
https://www.tradingview.com/x/UQqlOPqv/
Maria, I actually purchased SJT for the dividend, now at 11%. If it treads water, I’m fine with it as an income vehicle. https://uploads.disquscdn.com/images/8335d20393f25fbfd30dcb095983e6b3b7f65c3a5f1c82eca82bdc1bf9e5ceca.png However, based on the your weekly charts, I think your target is achievable. If NGas enters a bull market, there are much higher, long term targets. You can see all the Volume by Price resistance running between $10 and $18 and the all time highs in the mid-20s ten years ago when NGas was pushing on double-digits.
nice
Thanks – That’s a good way to get into NG without the aggravation of BOIL or UGAZ. Plus 10%+ dividend. Just got some. Appreciate it.
Looks way better than UGAZ & BOIL!
I actually have a $9 target, but it could do more and it is a nice set up, especially off of that 50sma
I´m tempted to add to my silver futures, but on CF´s prognostication, I will wait for silver and miners to pull back between now an the end of the year. I would think the miners would have some tax loss selling again this year.
Added to my bond futures short, this is just a swing trade.
Anyone else tempted to pick up some JDST or DUST?
I would advice Not yet , this looks like the DCL , This can run for 11 days to a peak
Thanks, Alex.
Not me, I’m makin too much $$ being long.
Not yet
ITUS…..
XXII :o)
So- I just got back from Lunch and immediately added to LGCY at $1.72.
This is why- see the charts in the report too. The long term is chart is what I would consider important too–
refresh for this chart- this will be in the next report.
1. We already had the strong reversal after earnings to the 50sma.
2. It pushed THROUGH that 200sma with BIG volume
3. The fact that it sold off is just profit taking, it will get back above
4. I point out how it did that at the 50sma too – a quick fake break higher, dip for a day, break back through.
I like the set up
https://uploads.disquscdn.com/images/7e6a2acd037e0a08dd1513a6291c37da2a546025101d981c59607209185700d2.jpg
DNR….. the sky is cryin ….;) i mean mommys cryn
There are a few that are really doing well without me, and I liked the set up, but having earnings being released later this week – I just had to hold off.
I am not looking for some with earnings out that may just be starting to play catch up, and I think LGCY is a good candidate. I’m still thinking that WTI keeps moving higher too.
yeahhhhh… cant complain .. i did pick up NOG early and some VSLR… Riot finally getn off its dead……….. 😉
NAK DID BREAK THE TRENDLINE. Will it close there?
I Dont know, but NAK had a strong reversal and a day of follow through too. I think NAK is finally ready to start another leg higher. I posted a chart below earlier this morning.
SA, EGI, FNV , GSS , a few others – there are definitely some Miners resisting the selling for weks, while others are getting crushed.
Today looks like confirmation of a dcl in Miners, so we could have some upside over the next week or two. It may be upside or weaker up & down action, I will cover more in the next report.
cray cray …. has it been this bifurcated in the past……….?
Nice vocabulary, miss Etymologist
I have seen this division how up in Bull markets, not so much in bear markets, where they usually just have a race to the bottom.
Now we’re seeing strength among the selling. Seems quite bullish
I just barely stopped out Fri morning, would have been up as of today If I had been able to stay in the trade. Was just a bit too early!
FNV new all time high in Canadian $ and almost a new top in US $
Look at charts of OIH & XLE – they still do not look toppy
I went in light and was to add on pullback. Doesn’t look like that will end up happening, but at least I got some starters in!
Kicking myself for selling TMWJF a few days ago, but enough biostock plays have taught me NOT to get too greedy. My other positions in MJ doing very well. (ACBFF, OGRMF). Added APHQF today [possible cup and handle?]
MJ stocks doing well across the board.
Wow , I wasnt watching that one daily ( TWMJF), but I remember you mentioning it a week or so ago. Big gains.
I’m in APHQF and OGRMF , Was in ACBFF for a small trade, but really sold it too soon, it was just making small gains until that sweet break out today. I’m expecting similar moves in the 2 that I have been holding, as they form a cup and hopefully break out. So far so good on APHQF, good volume on OGRMF.
Just scoured & scanned 400 energy stocks for bases that havent popped yet.. ended up with about 30 odd.
Havent checked them in detail, only a quick glance.. some look better than others, but i’ll stick them out here sharpish, so you can check em for yourself before they have a chance to go to the moon.
https://uploads.disquscdn.com/images/7245175149d1091e0a85eadfdcdc0938afb39c7bc85ff52bede49a4ca3b7759f.jpg
https://uploads.disquscdn.com/images/210dbfba98806362492c8b7520c446dac3cdfe9f6251ebd73986c9ba6c557343.jpg
Hey Sog,
I was just running through my list over the last 1/2 hr and I just looked at REXX, BXE, PQ, CHK, and a few others on my list, ( they are also on this lis above) t, but when I look at them, I do think that they have ‘popped’.
What do you mean, havent popped yet? Do you mean that they haven’t left their bases in a run higher? – Thx
hi Alex.. i was viewing them quickly in succession on a 4h chart, looking at the price relative to 300ema & 400sma (=150ema/200sma daily).. the ones i listed were below those MAs, still lingering around the 65ema/100sma base area.. or still down at the lows.
so yep… basically i meant in their bases only having done wave 1-2, and maybe start of 3
HK did pop off the bottom about 4months ago..now above 200s daily again.. but all MAs are pretty tight together still, so i counted that one as a yet-to-pop
Gotcha, possibly just starting wave 3 ( the good one ) 😉 thanks
I ALLLLMOST bought REXX today… chickened out….
that B*** cut my fingers off couple yrs ago… i want them back…. ive been patiently stalking my prey…. 😉
feel free to wave the checkered flag in case i miss it….
pounce… pounce .. pounce…
Thanks, SOG!!
The way WLL is running, this might be a mistake, it was up ANOTHER 10% today – but when I first posted it as a buy, I did say that I expect it to run to the 200sma before running into resistance, SO I SOLD 1/2 AT the 200sma. It could just power right through it, like BTE did, so that is why I only sold, 1/2, but discipline-wise, I need to stick to my plan.
The money from that trade may go to WG – which is falling toward the 50sma in a nice steady consolidation. Earnings for WG is after Hrs Wednesday, so I will try to be patient and wait.
WG will be in the next report.
OIH drillers acting like the miners in 2016!
yessir! and like then, I wish i had WAY more exposure off the lows.
Hope all is well with you Ralph!
luvn it … right? build up the stash for miners …. on deck …possibly in the hole… lol
USAU – Boom out of the lows
i also sold AKG this MORNING … (dork) and now i want it back.. ha ha
even as just a corrective retrace… it looks like a nice trade… no?
yes
BUTT …. then againnnnn … there is UGAZ … hopefully comes back down for a sit on that trendline….
UGAZ has rallied nicely , and…
Is just about where I sold it, so that just shows how deep it went
and… DNR … feedback please
https://www.tradingview.com/x/Acx2kQcZ/
TUESDAYS REPORT HAS BEEN RELEASED