
Sept 10 – Is It A Melt Up?
SPX– I will repeat, I never called the recent dip an ICL. It lacks the characteristics of one, but what I did say is that we have been overdue for one for a while. So we have a dcl, and similar to the last couple of dcls, the move higher has been a bit choppy, but we have higher lows and higher highs, so an uptrend continues.
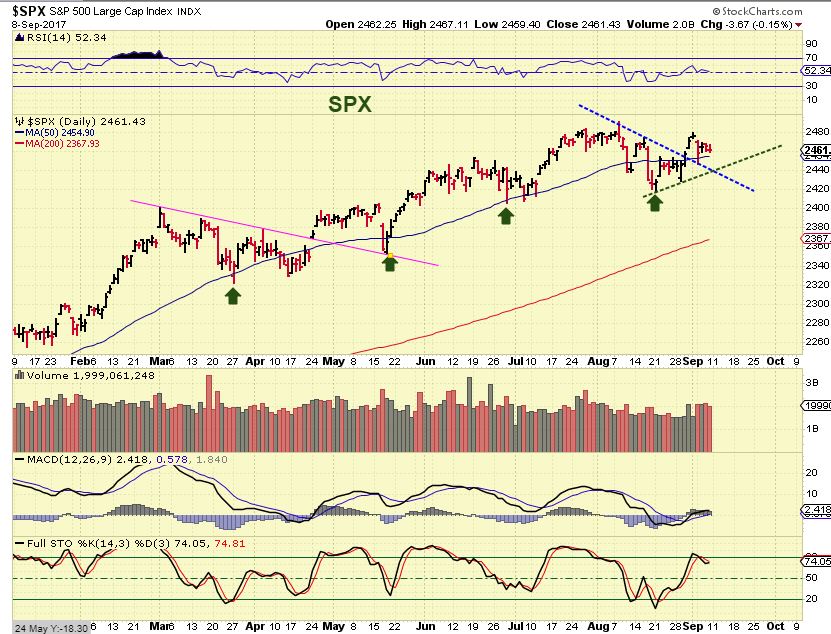
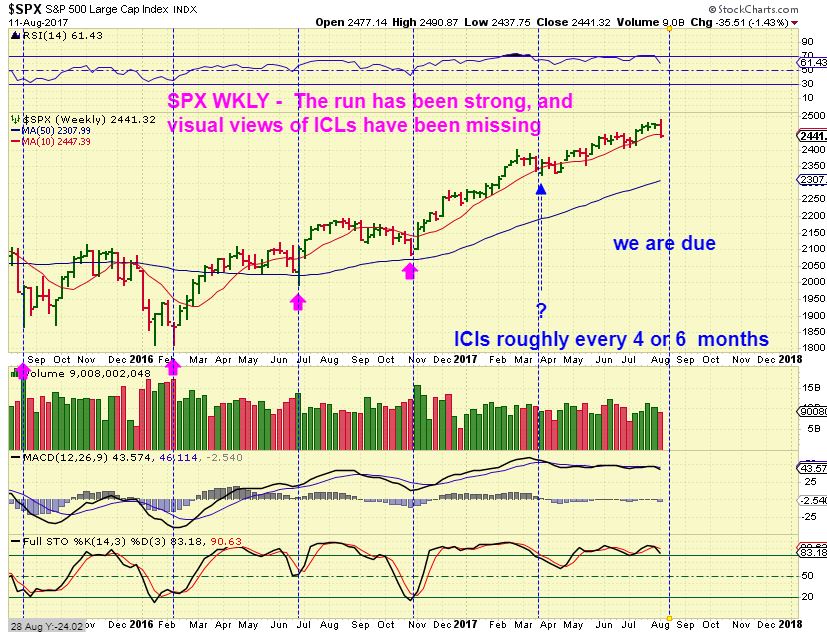
SPX – In August I reminded readers that we were due for an ICL, but visually, I still do not clearly see one.
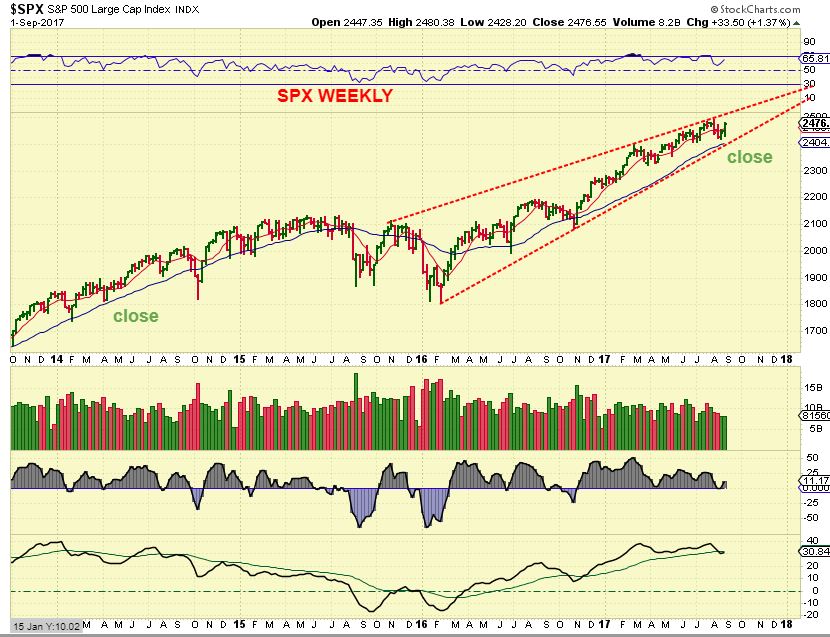
SPX – Then on Sept 1st, I posted this as a cautionary note of a possible rising wedge and mentioned that OCTOBER can be tough for the markets, historically speaking. We have seen some pretty big crashes in October. Will we get the ICL then? We’ll have to be alert going forward to any signs of weakness as this unfolds. So some are long from the recent dcl, I am just helping my readers to see a reason to stay alert, and I will monitor it along the way.
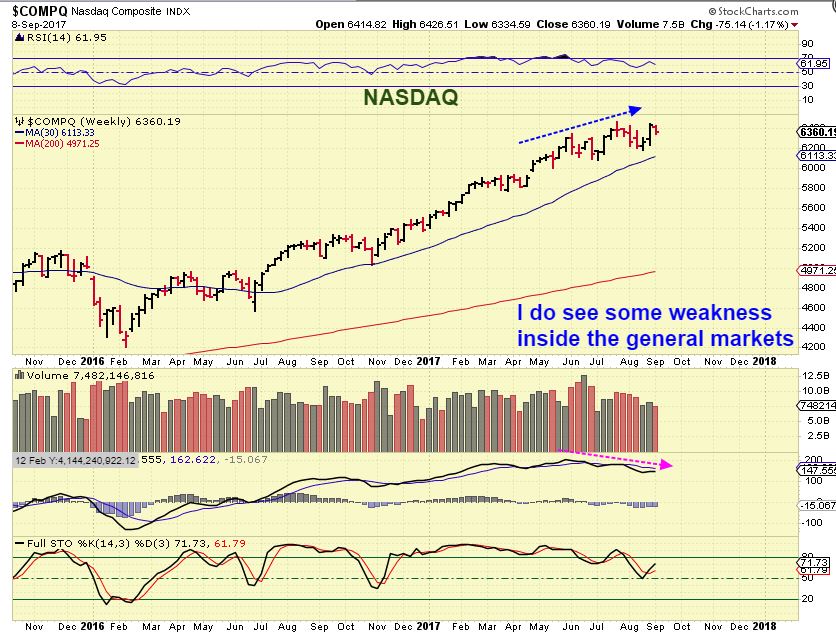
NASDAQ– I Do also see weakness internally in my Nasdaq Wkly Charts, as the Nasdaq attempted to push to new highs again. This looks a bit similar to Oct 2016, when the markets pulled back ( into U.S. elections) but then it took off higher.
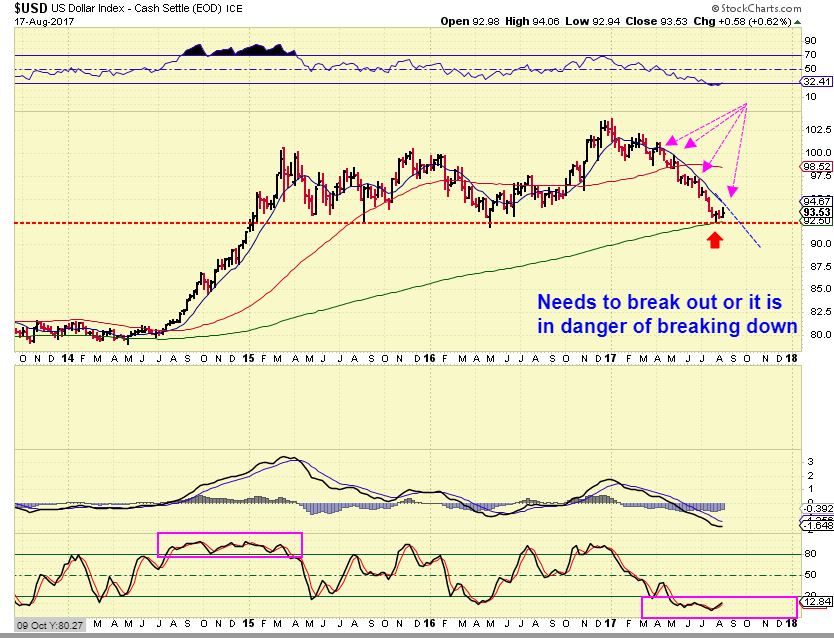
USD – In August, I noted that the USD was at a support area, but in danger of breaking down. Watch this area & blue line, because in the last 3 years, there is not a lot of support below this area.
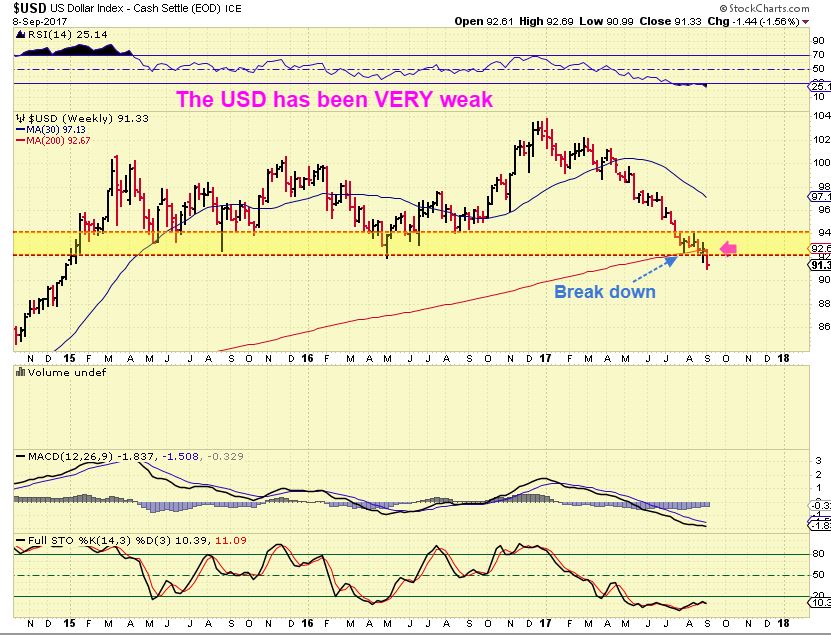
USD– And the USD broke down this week. If this drops further, Gold could get to that $1375 area that I have been thinking it should reach.
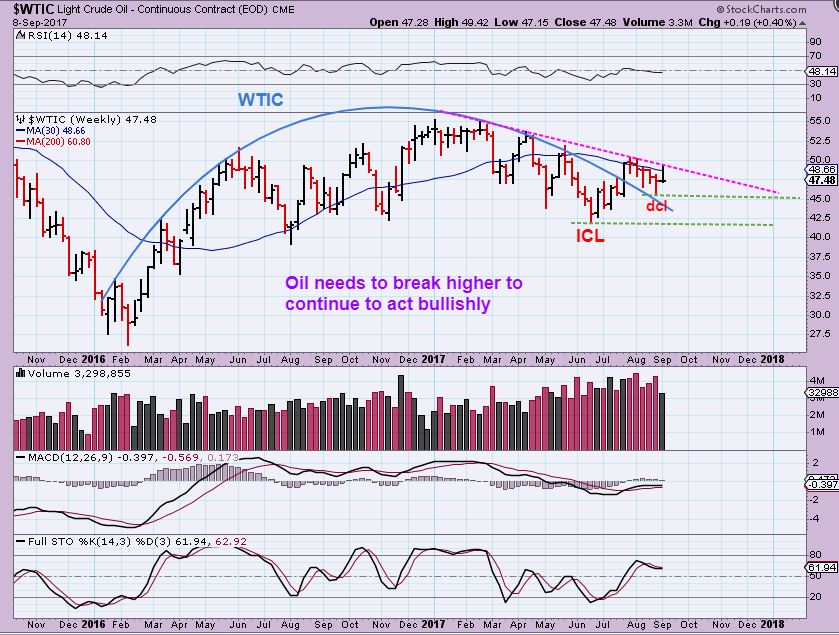
WTIC- Oil looked very good, but it is stalling here and needs to push higher above that Magenta line. I would have a stop under the dcl green line if i was long Oil.
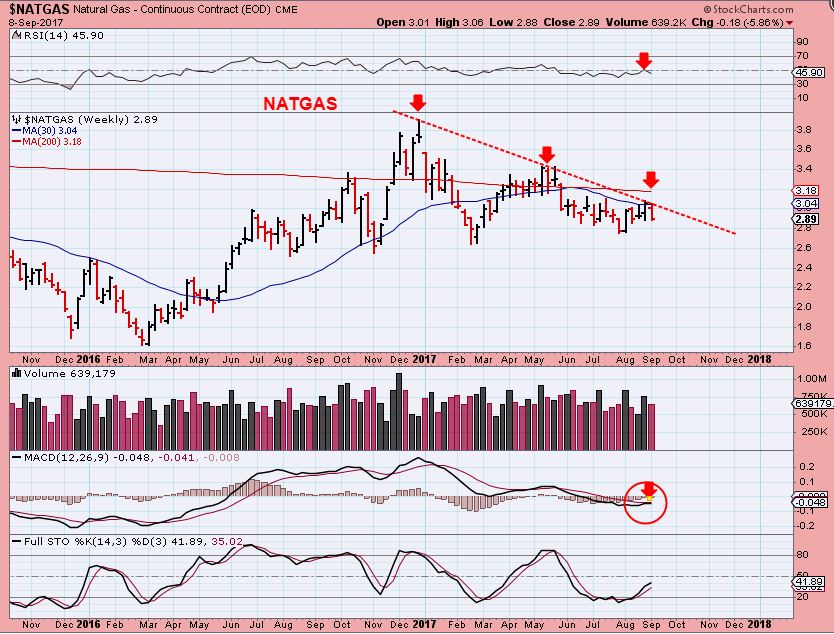
NATGAS- Natgas has been choppy and too hard to trade long & short recently. There is a lower trend line ( not drawn) and an upper one. A break of either line may start a more sustainable directional move.
GOLD, SILVER, MINERS
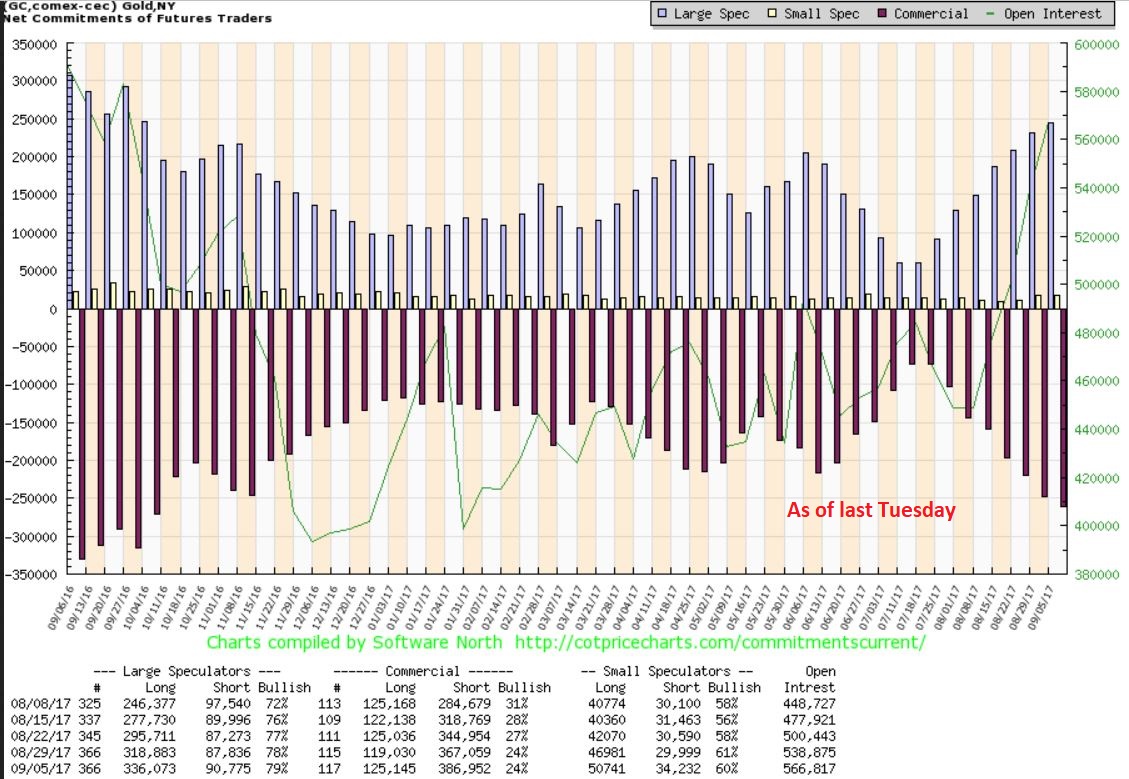
COT– This reading is as of last Tuesday, and as you can see, smart money shorts continue to grow. That said, being scared out of long positions 4 weeks ago when someone wrote a bearish Gold article based on the COT Smart shorts growing, would have been a losing emotion.
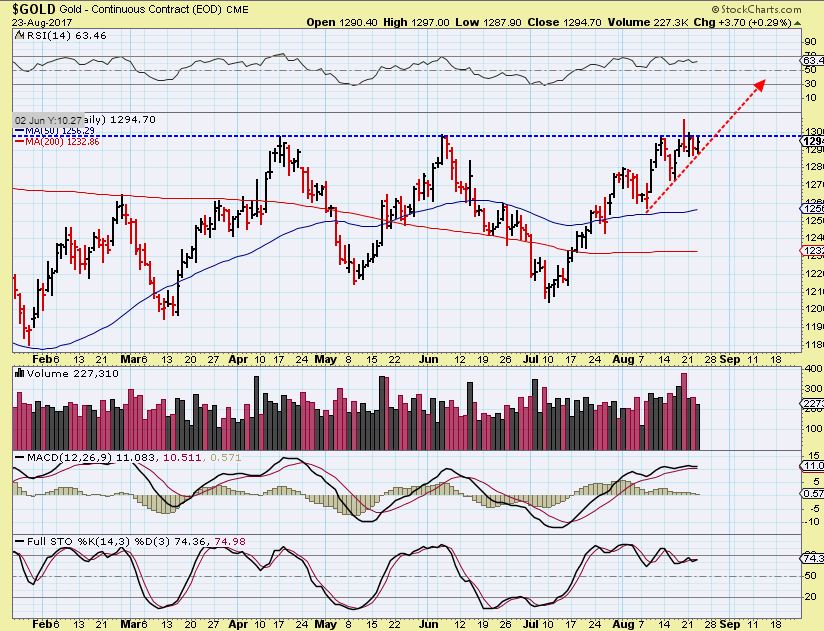
GOLD– August 23rd, we still had further to run, and I felt that we should break above 1300.
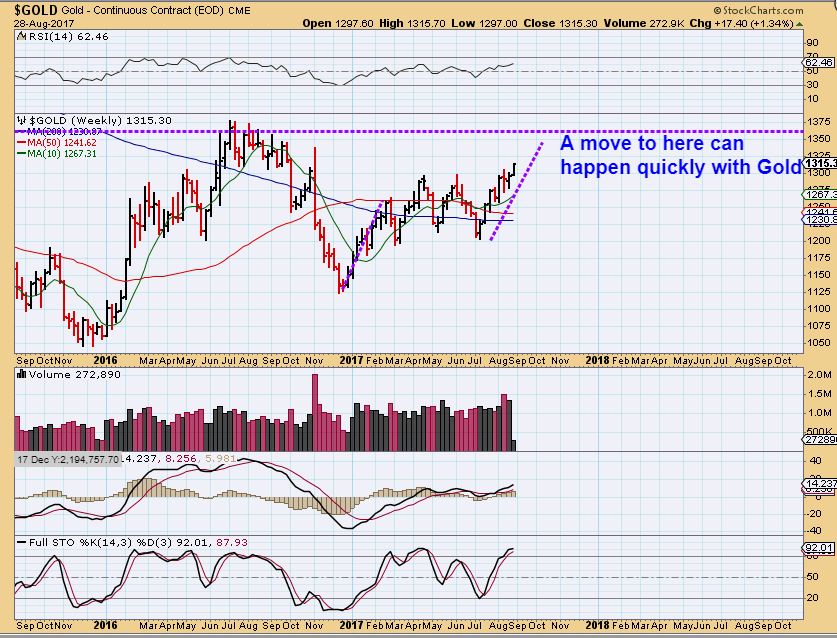
GOLD– August 28 & now above 1300- Gold could move quickly to the area of the former highs. I had roughly 1360-1375 in mind, where congestion at the highs formed in 2016.
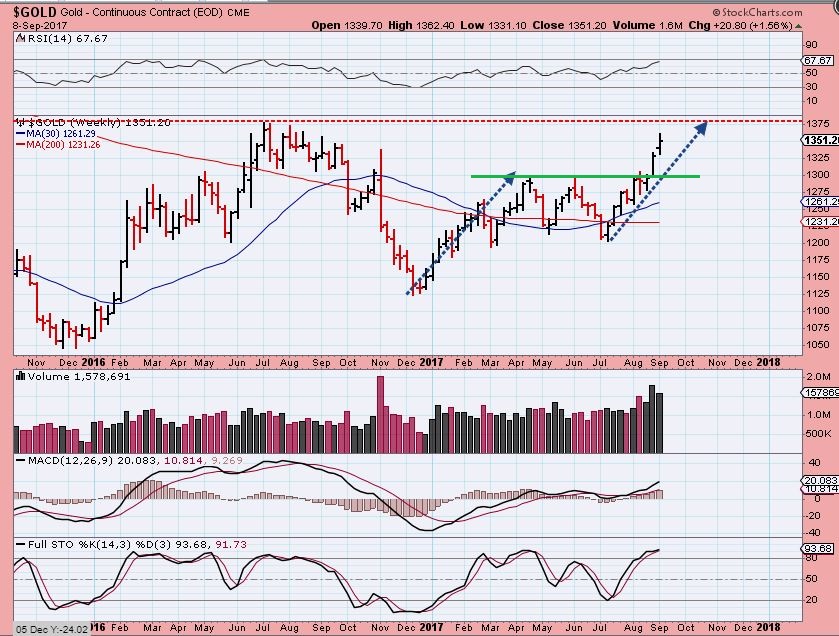
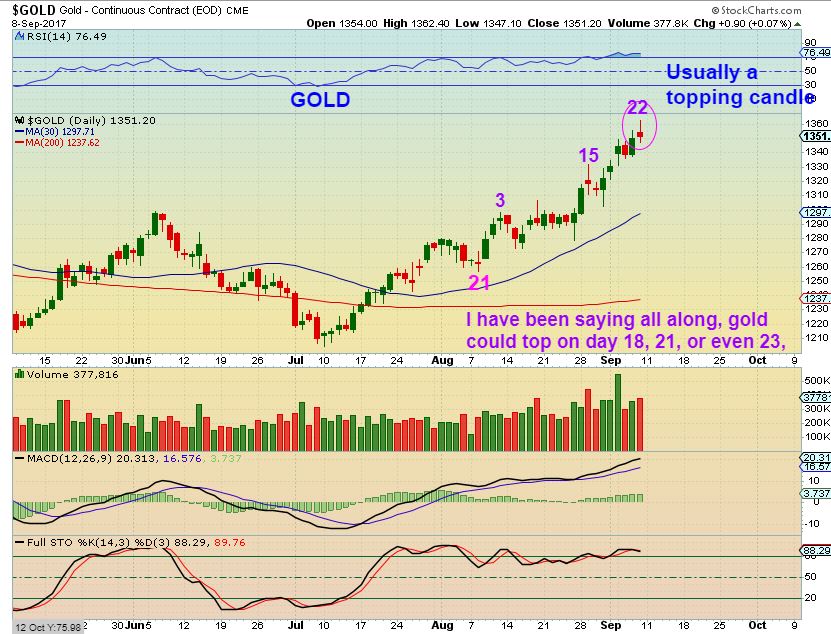
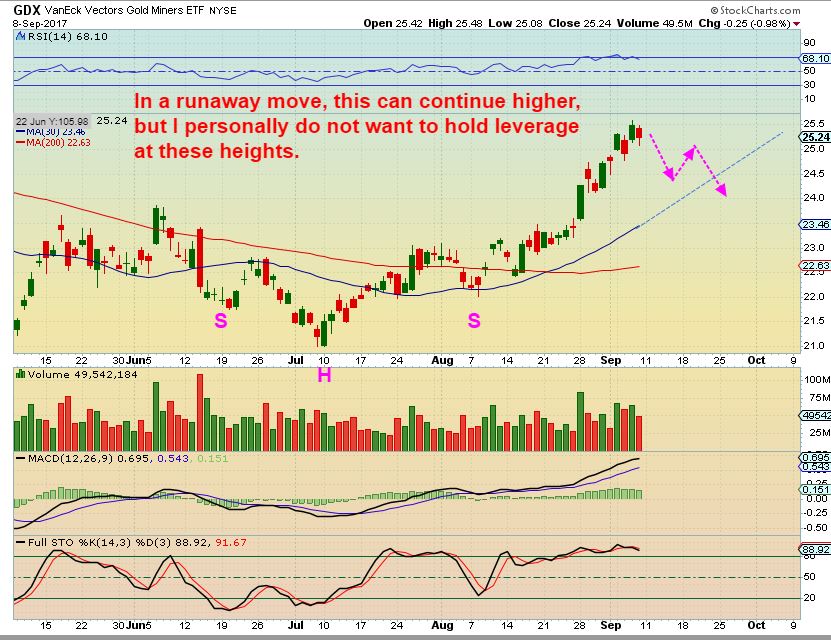
GOLD– Today, Gold has been moving right along. I do think that it could go a bit higher, but we may be nearing our temporary peak. I sold my Leverage Friday and still own my Miners in case of any upside surprise.
GOLD DAILY – I have been saying all along that this could top in the early 20’s of the daily cycle count, so this was a good enough place for me to let go of my leverage, even if we do have a run away move or melt up from here.
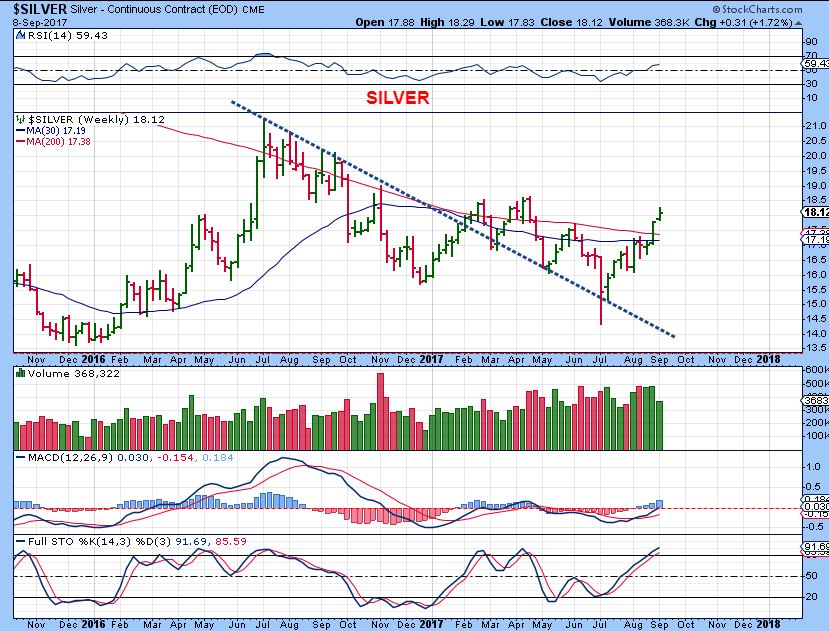
SILVER- A weekly chart where Silver is above important Moving Averages.
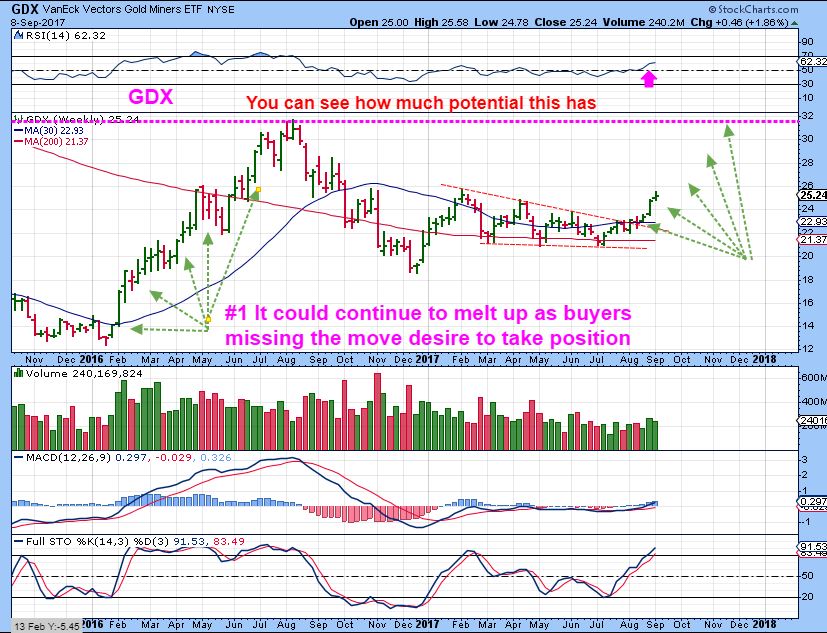
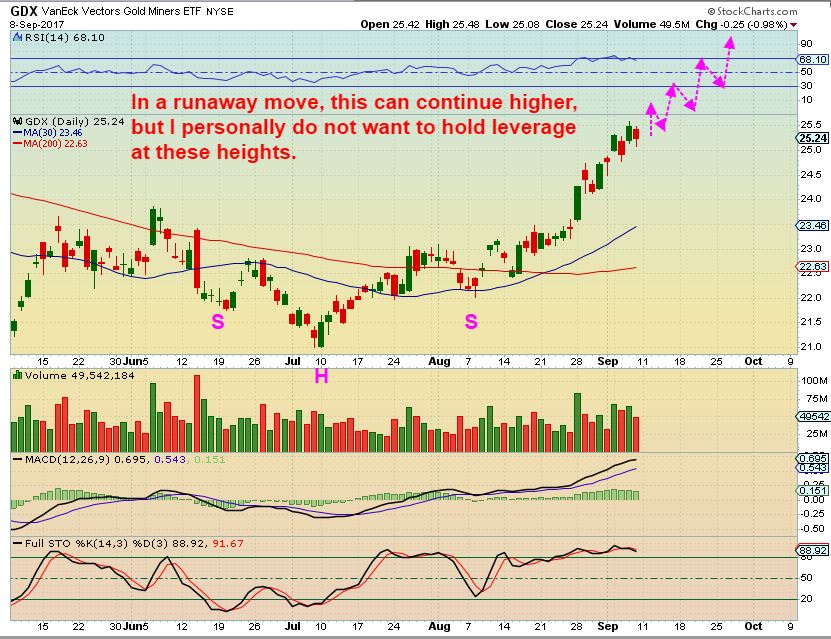
GDX- If GDX runs to former highs (and I believe that it will over time) the potential is great.
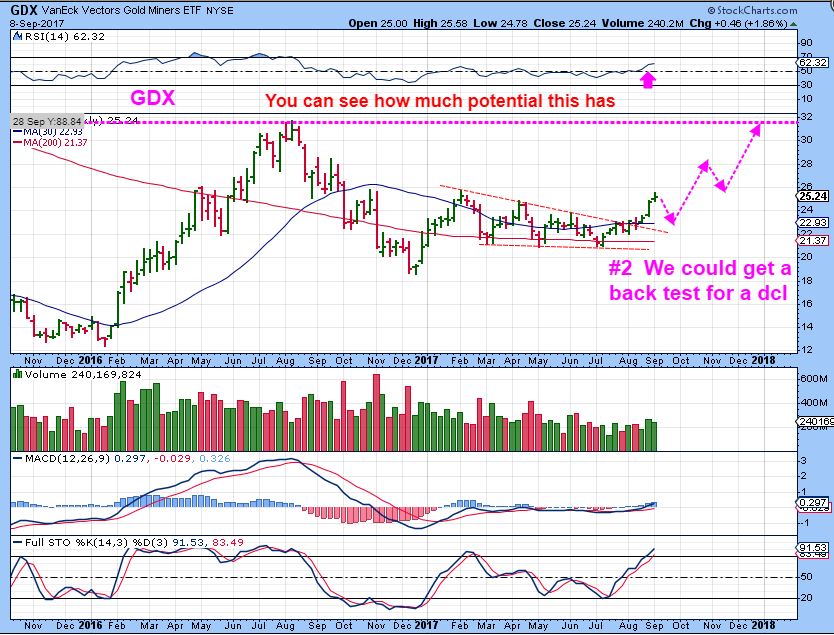
GDX- A back test and stair-step higher is possible, as shown here, but…
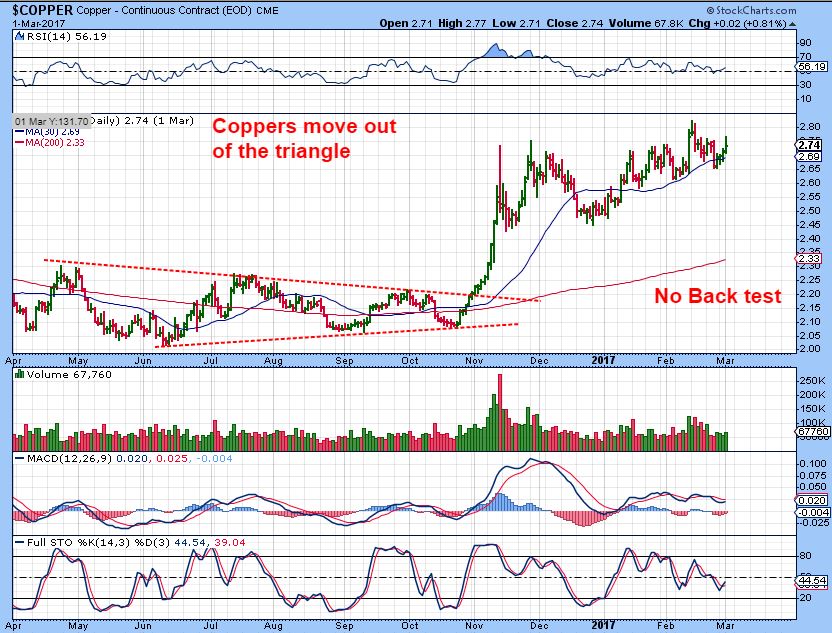
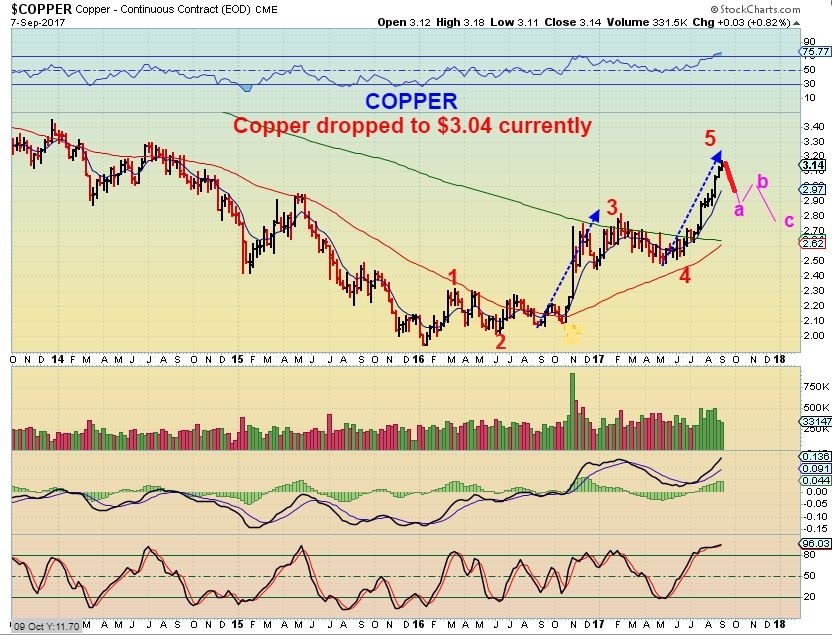
Example from COPPER- When Triangles break, they often are fueled by short covering, smart buyers, and then the chasers taking positions that missed the move out of the lows. Copper is an example of a ‘melt up’ or ‘runaway move’ out of a triangle break out. Notice that there was NO BACK TEST. Wow.
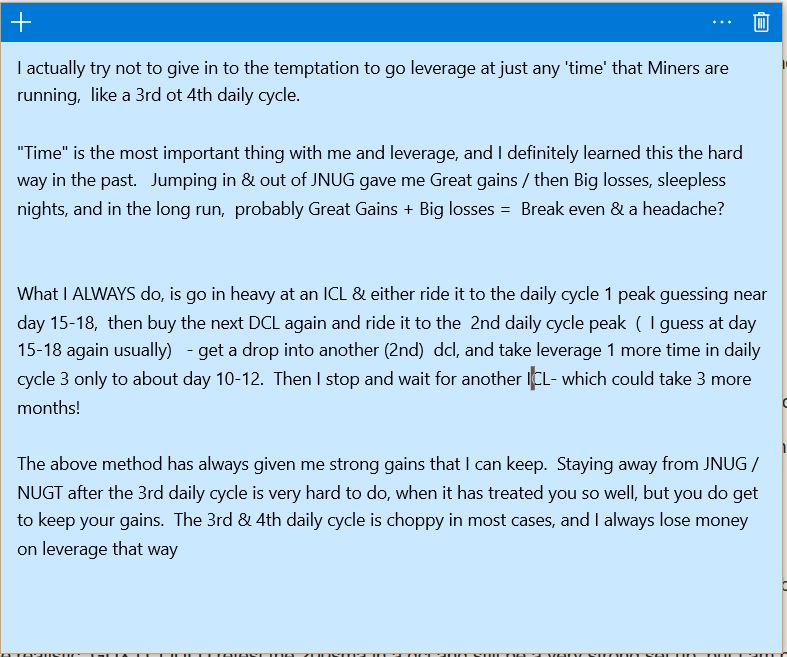
I was asked about re-entering my LEVERAGE- I do not always enter leverage again & again. I dont like to jump into Leverage in the middle of a move unless I am just scalping trades using 15, 30 minute, and 60 minute charts. So below is a method that I have used that has helped me to catch some great gains, and then keep them. It is a safer way to use 3X ETFS. Click to enlarge.
In Feb of 2017, I got stopped out a few times, because Miners peaked early. I usually get a nice run to new highs in a 3rd daily cycle, but Miners peaked in Feb. I couldn’t understand it , with Gold running to new highs. Eventually, it became clear that Miners were forming a long triangle. So no method is fool proof, but the above method has helped me in the past to make and hold on to gains.
—–
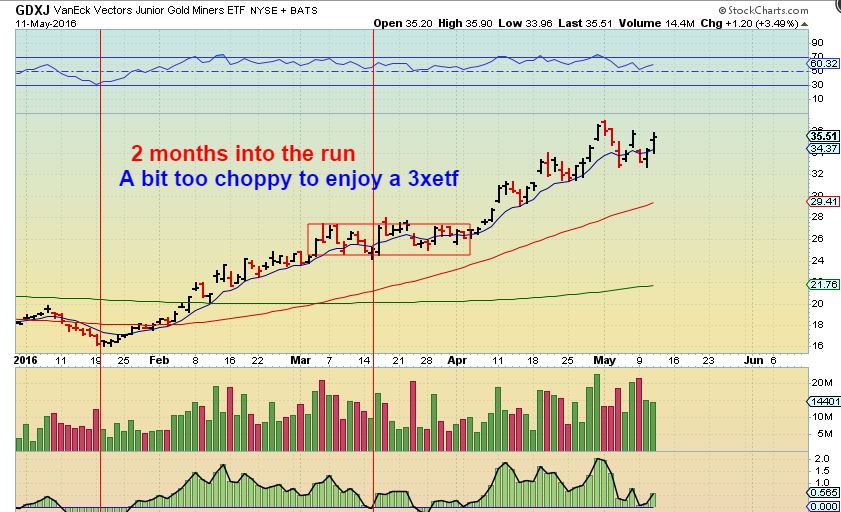
This year Golds ICL came about in July 2017, so it has been moving off of the lows for 2 months. In the strong run out of the Jan 2016 lows, Miners paused after 2 months as seen in GDXJ below. There was NOT a huge pull back, but price stalled and went sideways for a month. Due to fear & human nature, I find that People in a 3x ETF like JNUG & NUGT tend to question everything on each 1 down day of these sideways moves. That is why many should not be over leveraged in 3x etfs after many days of rising prices.
GDXJ 2016 – We could be due for a pullback, but even if we just get a sideways move, this choppy action was difficult for leverage. People lose sleep on 1 or 2 down days, even holding leverage in a sideways move like this.
So currently we are at the point of this run where it could pull back like a normal run in this sector, or it could continue to melt higher.
I cannot guarantee that GDX & GDXJ are about to pull back, that is why I am holding some Miners.
If it does pull back however, I do not want to hold leverage.
So pretty much all of the market sectors, The SPX, NASDAQ, OIL, NATGAS, Miners, etc are in the middle of a move, not the end of a daily cycle and not the start of one. This is when it gets tricky for shorter term holders, since the price could continue higher or begin to drop into the next low. Oil needs to break out higher soon or it is in danger of breaking below the recent dcl. Miners look bullish and longer term positions can be held through the wiggles. Some of my recent positions I’ve been holding for quite a while , like IPI, TGB, JNUG, Miners, etc, but it just felt like it was time to start to lighten up and see which way these markets want to move. If we start to get a pull back on the precious Metals, we can look for an entry for the next move higher. The set up still looks bullish in the precious Metals sector.
I want to give my usual sign off – that I hope everyone had a restful weekend, but I know that I have several readers located in Florida, and I also have readers in Houston Texas, both enduring the results of natural disasters. Mexico had an earthquake this weekend, Asia is being threatened by Typhoons too, and honestly, many are dealing with anxieties, enduring unforeseen hardships, etc, globally, not just locally. My thoughts and well wishes are with the many going through hard times and enduring trials at this time.
~ALEX
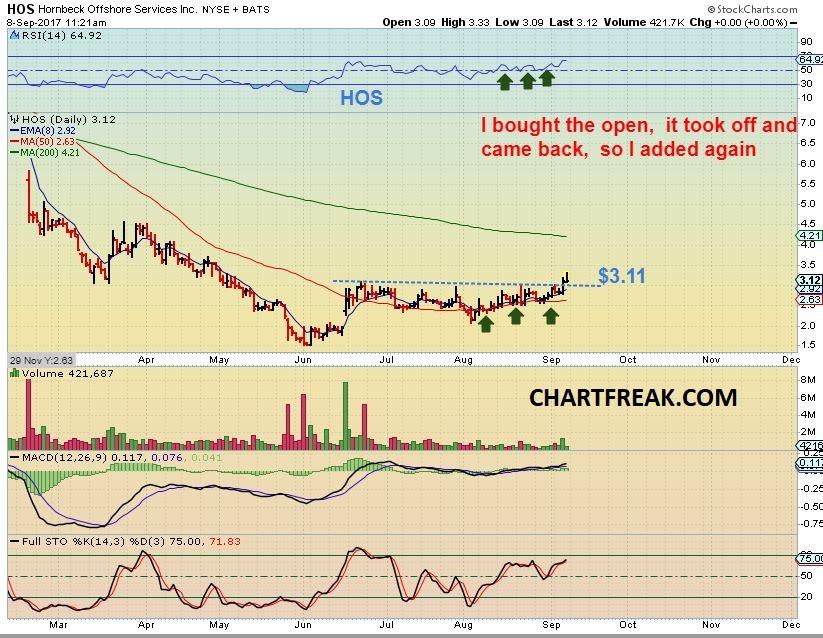
HOS #1 – Hos popped and dropped on Friday, after I mentioned that I liked this set up. I actually still like the set up. The whole time that HOS was climbing during August, the XLE & OIH was dropping rapidly.
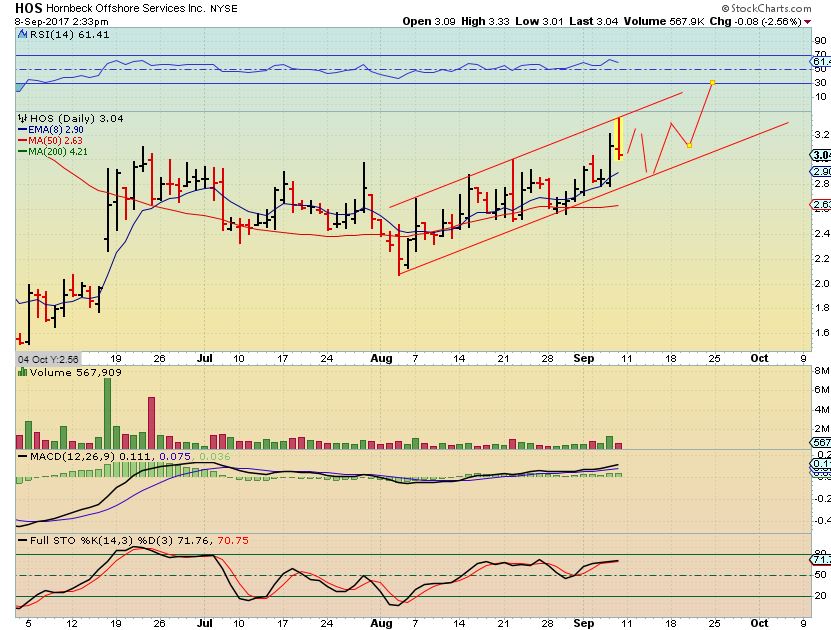
HOS #2 – This channel upward developed as the XLE & OIH were selling off sharply in August. fridays reversal could just be price holding to this channel.
COPPER too a sharp drop Friday too, after a nice long multi week ( month) run higher out of it’s base.
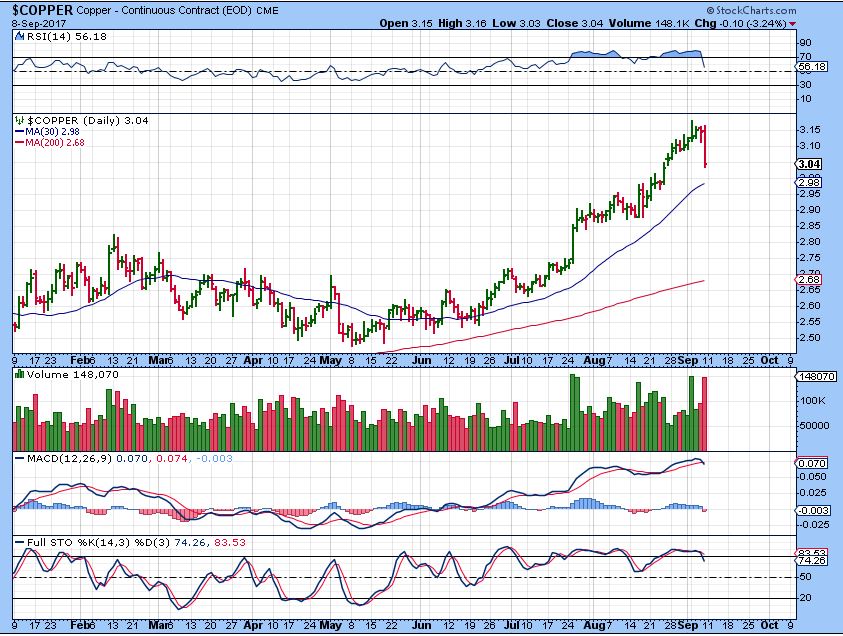
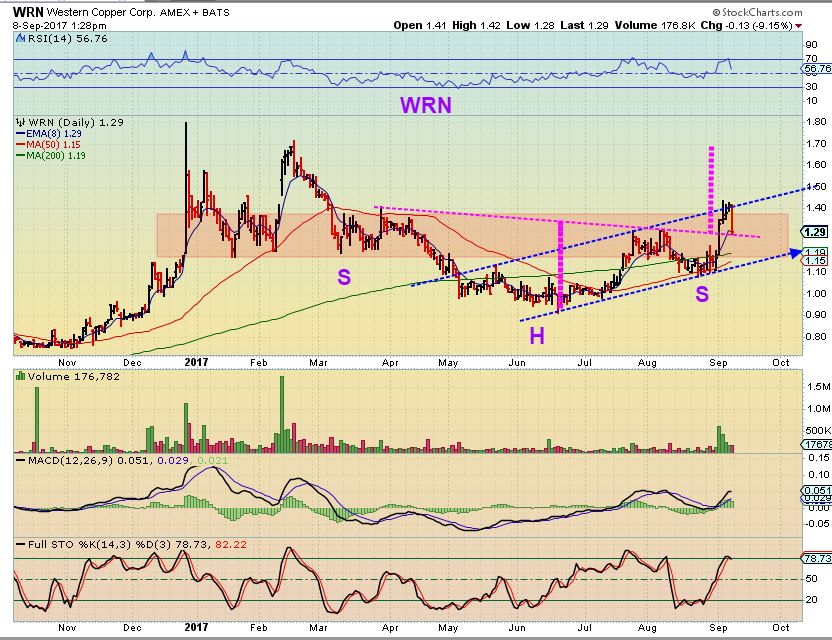
I drew this on Friday as a possible 1-2-3-4-5 complete, showing that copper could be starting a short pullback. TGB sold off and actually partially recovered, but I sold my TGB & locked in gains for now. I did NOT sell my WRN, but it also had a sharp drop, so anyone that dumped it- that would be understandable. Lets discuss WRN.
WRN #1 – As a result of Coppers drop, WRN also took a sharp dive off of the highs. This raised questions about the possible path going forward. I’m thinking that the selling in Copper slows down, and I think that WRN could bull flag and still eventually break out, crawling along this trend line.
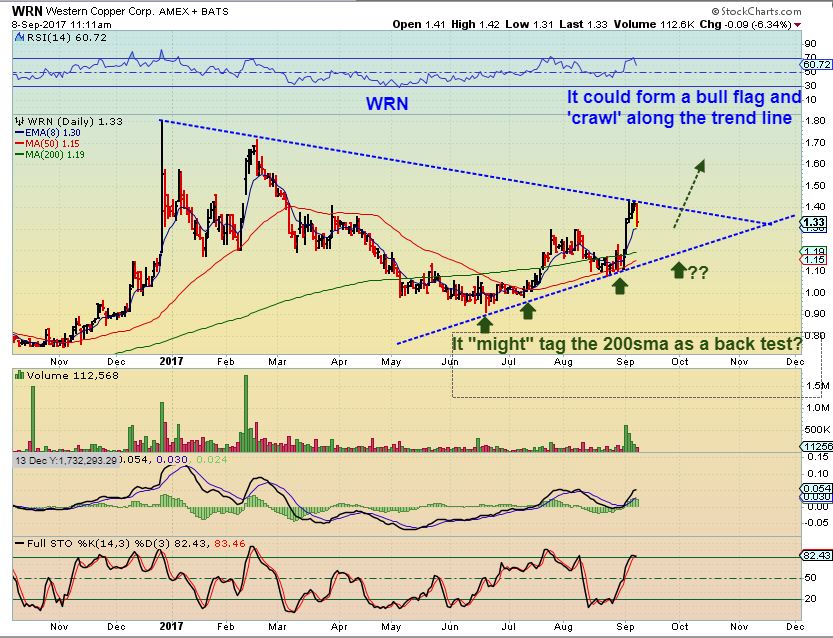
WRN#2 – The bull flag formation could look like this, Or price could drop & tag that 200sma or even the 50sma again.
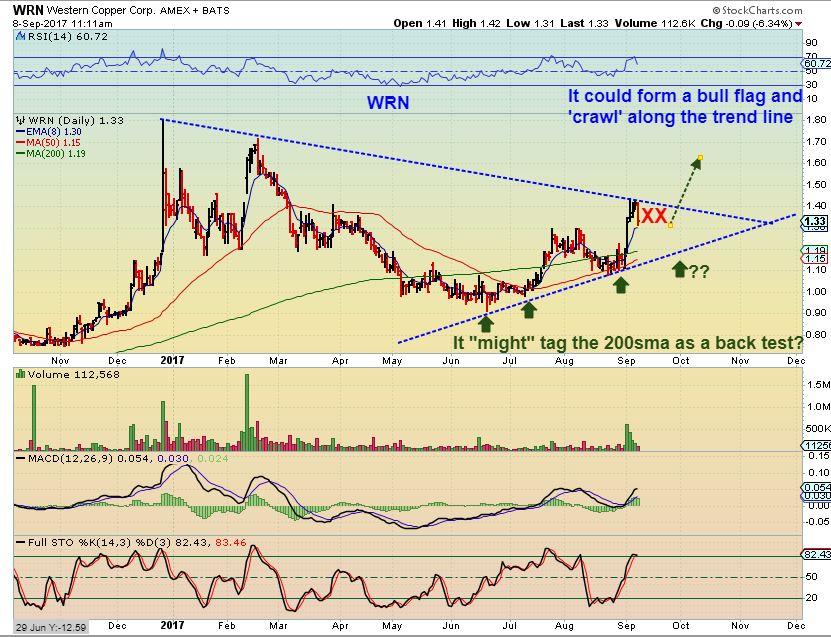
WRN #3 – I thought about that deeper drop to ‘back test’ the 200sma as also being possible, when I noticed how similar the price action was inside the green circles. If my position was very heavy, I would have sold some on Friday.
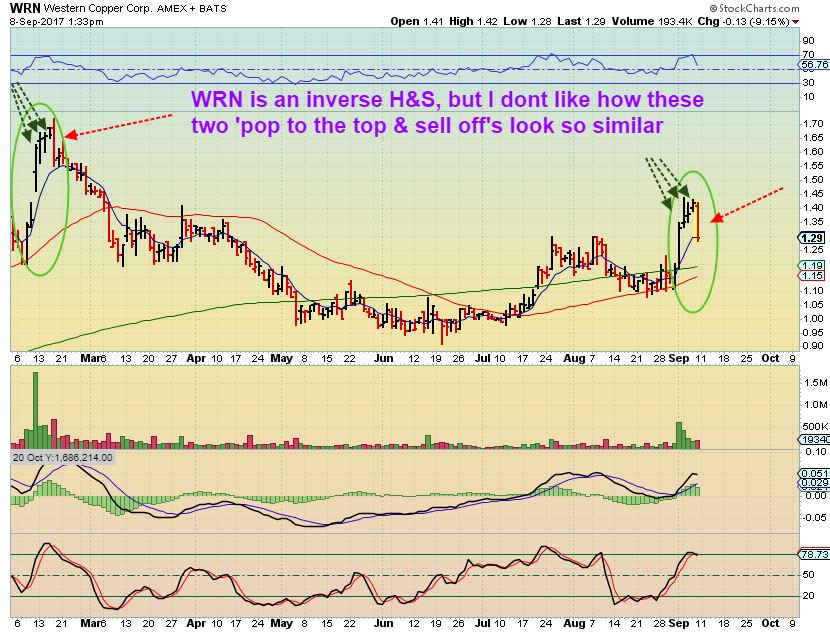
WRN #4 – I bought my position in WRN as it crawled along the 50sma down near $1.10-$1.15- so I am holding on for now. I still like the big picture set up, and want to see how this plays out. It should remain bullish unless something bad happens to Copper itself.


..
Test? 🙂
I was trying to post an Irma-impact picture of 5th Avenue, Naples – 3 blocks from my house – but “file size to large” or something like that; also THANKING YOU, Alex – and to all here in CF – for your concern for us on the Florida coastline
God is good!
At times I need to shrink a pic down, so you can try that, or If you want to email me the pic, I could shrink it down & post it for you?
I am in & out today ( away from screen at times).
Very nice CF. will be on guard this week with Gold taking a little bath down to the 30s tonight. Hoping that HOS is also channeling and not topping/trend changing with that shooting star candle on the daily and doji ish on the weekly. Went a little heavy on HOS, wasn’t too pleased with the Friday follow thru.
At any rate –
Happy trading to all this week and prayers to those in the areas getting hit by Harvey and Irma.
HOS has had a nice consolidation for months now, and looks like an inverse H&S.
It has been trying to ride the 50sma ever since it broke above it in June, so basically I am watching
that area. I like the set up, and I do own it.
It appears that a pullback has finally arrived in miners, I will use it to get the last 24% of my funds invested and bring me up to 100%, maybe even a little margin but not more than to 125% total. Having no idea how deep this correction can go, I wil just use the stochastics (set on 5) pulling back half way on the daily chart to do my buying, it´s good enough if this is a bull market, which I am betting it is.
If I am wrong about the bull, I have total risk of 7% from my average purchase prices, which are 8.6% below current prices, so I have about 16% total risk from current prices. To me, anything between my stop out levels and going higher is just noise, and I don´t expect more than a few days lower before miners stabilize and turn higher again. Four days lower would be the max if this is a bull market, in my opinion. Friday was day one, and today is second day down, so I hope to be add today and Tuesday.
Makes sense Ralph if today is day 23. This could be very R/T.
Do you plan to stay invested, or take profits? I see many around the newsletter circle have moved to the sidelines, while Bob Moriarty at 321gold thinks we have lots more to go on the upside. I have no clue short term so have no opinion and will just stick with my long term positioning.
RIC getting bought out by Alamos.
by who?
Alamos
AGI getting a spanking
There goes TAHO up 44% in the pre. The March 6’s might just pay off after all.
Sweet! I do not own it, but happy for anyone that does.
Guatemalan Supreme Court Reinstates Escobal License
Bullish news and surprise to the upside 🙂
Me too, good to see the laggards out there turning around.
CDE bought a private silver mining company and Mine in Canada too – News sounds good.
Significant, high-quality near-term production growth –Expected
average annual silver equivalent
[1]
production from Silvertip
of approximately ten million ounces represents a significant potential
increase to Coeur’s overall production profile compared to Coeur’s
2017 production guidance range of 38 – 41 million silver equivalent
ounces.
IDRA is moving huge too
https://finance.yahoo.com/news/idera-pharmaceuticals-presents-positive-phase-111500317.html
It will be interesting to see how copper acts today after the good sized decline on Friday. So far there is no follow through, but we have barely begun the week.
JASO Looking amazing on the daily … MRNS news out as well, up 50% PM. This pre market has some spikers
I see, today it’s the never ending rotation – now into industrial metals. I wish I could figure this out.
Its easy, hold 3 Metals, 3 Miners 🙂
I’m going to print that out and tape it to the middle of my monitor 🙂
Well, I own NAK and thats not helping all that much, print this one
“Own the right Miners, like TAHO today that you bought last week, and the right Metals…like SID ( Beautiful chart)” 🙂
TGB just doesnt want to give it up.. its Reanimator
That long red tail on 9/5…….? Makes me think it will revisit there sometime….perhaps? Possibly?
possibility i s’pose.. how long those spike-prophesies of SteveT usually take to play out?
I think if it doesn’t happen within about 10 days or so then it might be invalidated but not sure…..
So I bought AKS last week……it’s in the red today….SID is nicely up…..both steel……..geez. #hookedmycarttothewronghorse #maybeitsjustflagging
TRXC going like a rocket since i bot it.. up +65% and counting.
tis a while since i had a giraffe
GDXJ is hardly down now, let´s see how the day plays out, but so far the decline is negligible. I have not been able to buy anything at a discount today so far.
SIL also barely down, so silver miners holding up better than usual.
they are holdin up.. i was hoping to buy some VGZ & TRX at lower prices but no can do
We might get our chance later today. 🙂 I have several orders in below the lows of the open, hoping to see at least a few filled today or tomorrow.
AUY, FSM – both down some – I own both..
AUMN is making a move up 5.71%. Is it time to add? No love for oil today that’s for sure
Where’s Mawea?
;o)
https://uploads.disquscdn.com/images/9312c095e56f58bc5664dfc9796428cd2fab506390f2f8e52279e1ebd2936035.jpg
ahhh ha, there she is
Any idea why GV is coming in this morning?
I do not understand this question?
dropping – after Mathew it was quite steady
Now I see – they reported Q2 this morning and the market did not like it. We were asleep at the switch on this one
This is the third consecutive earnings report where they have been smacked.
if the DC decline in gold is happening, it could take 2-3 weeks to play out. Gold could find a bottom near the end of the month. Now is not the time to be searching for a DC bottom. Just my 2 cents.
What if it is seriously right translated and on a 30 day schedule?
If the DC is extremely right translated then the drop will be short and most likely very steep. I have been watching Alex trade DC’s and IC’s well before he started this service. He knows his stuff – that’s why I am paying now. He sold leverage last week so something is up. Be patient here. There COULD be a nasty short-term correction. I go back and look at his charts often and they are very accurate predictors. Be steady and dont throw $$ away. I speak from experience.
TANH breaking out on the daily
That one always baffled me “manufacturer of briquettes and clean air products” huh??
Me too – charcoal products.
Maybe they do charcoal filters needed in storm clean up? and a lot more than we think? It has been a really good trade for me in the past, but ‘charcoal products?” –
Its a mystery to me too 🙂
So far I have only added to IPI this morning.
Twice – once at $3.73 and then at $3.76 – volume is swelling near this break out area
Getting filled on some MUX buy orders now.
I got back into ARWR this morning…so far so good…hopefully it will head to the $4 area that Alex mentioned last week 🙂
Any thoughts on GWW?
MNKD looks to be breaking out as well
Checked out POT and AGU too – IPI is not the only fertilizer stock breaking out today .
SO I tweeted this chart
https://uploads.disquscdn.com/images/d90d02fa24d27e0bfb713790529837ed77e9f3898745263e4296b98572f53a11.jpg
This may be the 3rd time that VRX has made a pop and run over the last 4 months. I’ve traded in and out with gains. Time will tell if this 3rd time rings up as a winner. Good support underneath, 50 day ma another dollar+ higher, positive divergences in the RSI and STO. https://uploads.disquscdn.com/images/3dfc3bd5ab6828a4156cff6fb7d4efab350019ae6818e0608ce4157cbe83a929.png
If you draw a downtrend line from the July highs, AUG highs and next Aug highs, it could be breaking that down trend today ( if it closes above).
SINO is flying now
Any thoughts on OAS?
I think he mentioned last week hed be out as of now – it wasnt acting correctly.
I did say that about SPWR & another one, Maybe it was OAS.
It’s tricky because they arent acting as expected – they are failing at the 50sma.
OAS looks to be basing, Friday had a strong drop. A bit of a recovery today, the MACD was climbing & does look good, but it may just base out near the lows for a while. Kind of neutral
Thanks
Neutral – maybe basing out– I put my comment in the wrong place, check a little below this comment
return of the MACK …. has certainly taken off since that rs last week
double bottom base- interesting 🙂
not in it at moment, but am looking at the price to hit 1.60 and buy when it drops back to around 1.35 (wave 2 pullback), and hopefully start of a giraffe wave 3
HIMX
Tingalayo! run little donkey, run.
Kudos to Alex (and others) for alerting everyone that they were lightening up on miners last week, hopefully most avoided the big drop in JNUG/NUGT today. I sold the last of my NUGT this morning to lock in a 30% profit and I’m now 100% cash waiting for the next buying opp. I had very nice gains in my accounts and I didn’t want to give any more of it back. Currently, miners (GDX/GDXJ) are in a DOWN trend on my charts, so I expect more downside ahead.
But what do I know? Good trading to all!
Strange, hardly any talk of miners here today! No mention of buying, selling, not even prognostications. 🙂
Fall is busy busy time for me (at work) … on a deadline…today ….
Thanks for not forgetting me. 🙂
😉
That’s because I can’t talk while I’m holding my breath.
LOL- I was holding mine this morning hen DRD was down 21 cents, then when it started to come back it was looking more like buyers stepping in.
Now it’ll drop into the close and I’ll still be ok with it , since I got to see that it can be bought back 🙂
PVG – I dont see any news, but that is a lagger trying to make up for lost time.
Good volume, too.
Alex…what do you think of FSM? I had a gain until today….now I could get out at break even……I walked away from computer for a few minutes and it tanked even more than what I had been seeing earlier – just wondering if I should wait it out or sell and get back in after things are more clear….feel like I’ll be selling at the bottom if I jump out now…but….if I hold it could keep falling…hahaha…..yes, I just need a crystal ball
I need one too.
FSM on a 1 year chart shows that it is forming a good base. It had a nice run higher, so It is tough short term to know if it is just still building that base or readying to break out?
I would say that it had a nice little run recently, and it could be back testing the 50sma. I hate when they have such a large candle on the first point of selling ( Like WRN did Friday) , because it makes the selling look so real, but at this point, I think that the whole sector being bullish is a good thing and the Volume is rather light too, so it probably just lacks buyers at this point.
How’s that for a whole lot of neutral at this point? : – )
LOL….thanks for the feedback, lots to think about!
…whats MNGA tryn to do there…… hmmm….
Whenever I look at MNGA, I look at PLUG, BLDP, FCEL too, so I just did that. ( 2 or 3 of them often run together).
BLDP kind of got away from me , PLUG has a long consolidation. hmm.
SA is consistent with delivering ugly red candles over the past couple of months.
MUX looks horrible here. yikes.
Ugly day, but the 6 month chart looks good- break out, back test possible
hmmph .. look at the way DSX is hugging that 200.day…….. arms wrapped around hanging on for the ride….
Yeah, another ‘shipper’ basing out. hen they run, they can really get going.
Nudge me when it breaks out 🙂
my pleasure….
#Meowwwwwwwwwww
your MBOT is lookin like it wants to make a move
Yes, it was down earlier and I am still in it, smallish position, and I was thinking that I wanted to add just in case it pops. I really like that base on a 6 month chart, but sometimes they just keep on basing out.
I gotta go flip a coin 🙂
its breakin out on my indis going back 3months, but has overhead obstacles, no doubt
….not that they counted for much back in august2016
Heads – I had to add another 1000 shares 🙂
I’m looking for it to break above the 20 EMA
good drive that price up 🙂
I just looked on a 15 minute 1 day chart and it did have a burst of volume in the last hour.
Someone likes it, lets hope its insiders that know ‘something good’.
Volume is piling in in the last 45 minutes
AAAAAAAAAAAAAAAAAAND she broke above the 20 ema 🙂
Run MBOT run!
is this just a speculation play or a Hold, CF?
It is a chart set up, and looks set up to pop.
We are only a couple of months into gold’s IC. We have a long way to go until it tops sometime in Dec.? Gold and miners are fine…for now. 🙂
Well this is the time period where the last ICL Jan-Feb topped out! Need to stay frosty.
Sure does, I bought heavy today, getting filled on all my outstanding buy orders. it looks so bad I´m not even sure I want it!
Here’s a chart, it isn’t as bad as it looks AT THIS POINT, but it could drop further.
What I see here is a break out and it is dropping to the 50sma. it COULD drop down and back test that break out if buyers dont step in, but that is still considered normal. Todays drop is similar to my WRN drop last Friday, but so far that turned out to be a 1 day drop, maybe Mux holds at the 50sma.
https://uploads.disquscdn.com/images/348dfb4a6e66ed6cfdc0411522a54ad46d16a7de3a9bbf830ecb8ff46951b7cd.jpg
Sweet chart.
I know but that was a HUGE one day drop. So much for MUX melting up. Many other miners held up much better today. At least gold got clobbered today. Better than gold doing ok Fri and miners selling off anyway!!
Everybody with me now…
MUX SUX!!!
Hi everyone! Got my power back….Yay! How I love AC! All OK here in Vero Beach… but not happy seeing what gold has done! Hurts worse than Irma. Ran away to Palm Harbor FL …2 hours after registering at the last motel…mandatory evac ordered! Had friend in GA offering a place since no hotels left anywhere but last minute just decided to run back home and hunker down there. So glad we did. Small damage, but safe.
Have we heard from Hawaiifive0?
hi Nancy.. good to have ya back
Glad your back and all is well!
Glad that you guys are all ok! We were thinking about you and wishing the best!
Seeing as I am square on the TAHO calls I thought to give a shot at calls for GV March $5 for $0.84
FFMGF hanging in there today, looks like they had some good drill results on one of there Canadian properties.
GSV doesn’t look too too bad on the 15 minute
It probably wont last, but I just looked up GDX & GDXJ, both were down exactly 2.98% 🙂
Sugar on the watch list. Initial purchase last week, with reasonable risk. Stop loss below the 20 day https://uploads.disquscdn.com/images/527f5894f4b64d081d68de74d3cb0cb8d49e28d6d158fa34edd2fa805f377e4b.png
Hey Alex,
I bought AG on breakout above 7.08 — is today’s drop below the 50day and the 10 day a pretty good stop-loss?
I’m thinking that the sector is bullish, so I am looking at AG like this.
If that is too much of a drop, you could just cut it loose and watch how it moves going forward.
The hard part is that it is hard to tell how these Miners are going to pull back as individuals, because in the past, they have just dont their own type of consolidations and some resist the selling, others do drop back to consolidation lows.
There is definitely no guarantee that this will drop to the lower line again
https://uploads.disquscdn.com/images/91a26556df15d811b0ce8524694718144fdd7342ef1a42ef304a9ac04e917c5e.jpg
I added a limit buy at the 20-day SMA, fwiw. Added a couple of cents to interpolate for the rising 20-day average.
nice backtest reversal (+5%) in THM..
Added back my miners right where I left them, saved 2 weeks of theta lol.
I studied closely the 2007 runup in gold (which I compare this 2017 runup to).
If we get an equivalent run in terms of retraces, we should see 1321 today and a continuance higher.
We got a 10 usd overshoot of the 1347.5 resistance (360 degrees from low). By taking 90 degree retrace from 1357.5 we end up at 1321. Prefer to not break the 1321, that may lead to extra churn.
RSI wise we are right at 2007 support range.
To summarize: We might have a run going all the way into first half of October if we don’t break down below 1321.
https://www.tradingview.com/chart/XAUUSD/DAJ8mZCu-1321-The-minimum-pullback-area/
Marked upside resistances on chart.
1420 ish should prove to be a tough one.
https://www.tradingview.com/chart/XAUUSD/zQceGvkC-Gold-Resistance-crusher/
USDJPY: This one should have a date with the lower trendline.
https://www.tradingview.com/chart/USDJPY/zmnGtMVt-109-9-and-reverse/
The new report is released