SEPTEMBER 3 – WEEKEND REPORT
NOTE: GAS PRICES HAVE SKYROCKETED IN THE U.S. THIS WEEK. We’ll keep that in mind as we discuss the Energy sector.
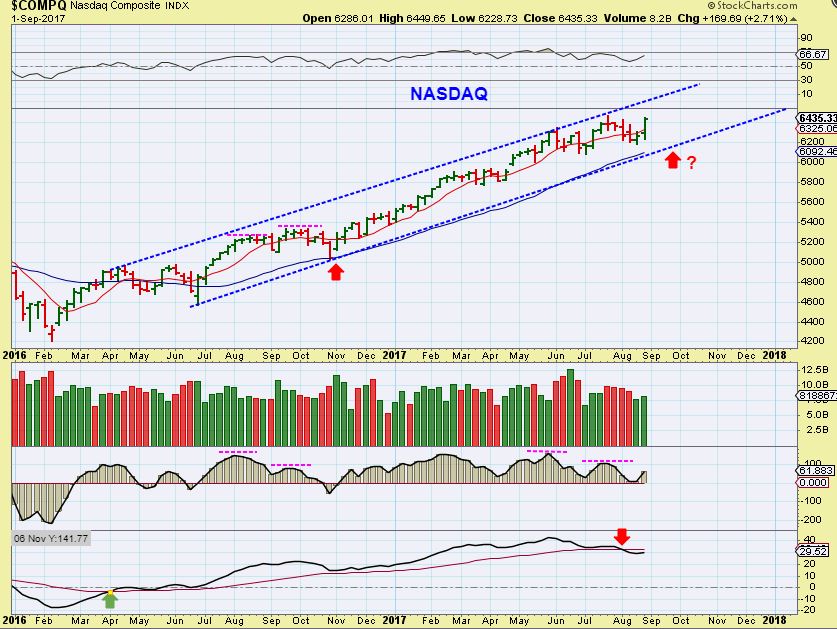
NASDAQ – We got the follow through to that daily cycle low that I was expecting, and now we also have a weekly swing low in place. Stay long and watch overhead resistance. I do see divergence, as shown on this chart.
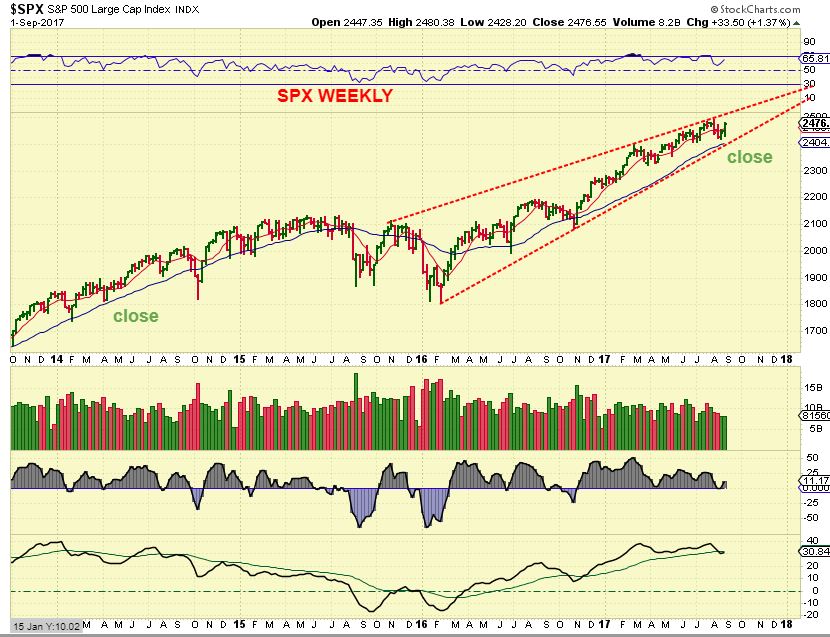
SPX – Same here, but I am watching a rising bearish wedge. October is known as a month that markets can run into trouble, I’m keeping that in the back of my mind.
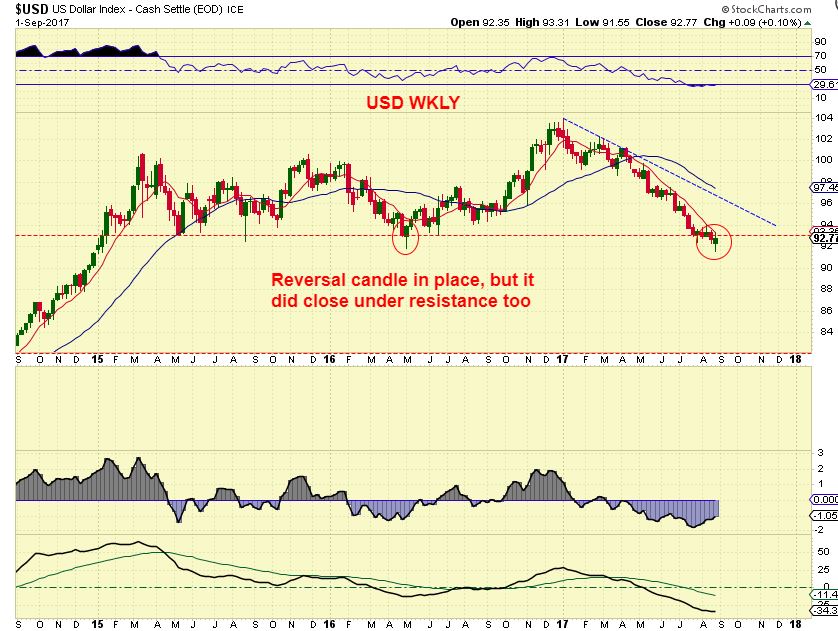
USD WKLY– We see a weekly reversal candle under support. The USD is overdue for an ICL, so was this a shake out? Will this now have a short term rally, and if so how will that affect Gold? Time will tell. The weekly low is 91.55. Watch that number.
* The Story in the U.S. to keep in mind is that an ‘event’ has occurred that could affect Oil & Gas. The timing is also right, since I called a possible DCL in Thursday & Fridays reports for oil timing wise. Texas was hit with a hurricane and flooding has continued to keep things in disarray , and refiners have shut down. Gas prices in my area went from $2.08 recently to $2.20 a week ago. This weekend I paid $2.60 and I see $2.80 at gas stations near the major highways. I avoid gas stations located beside major highways, they are opportunist.
.
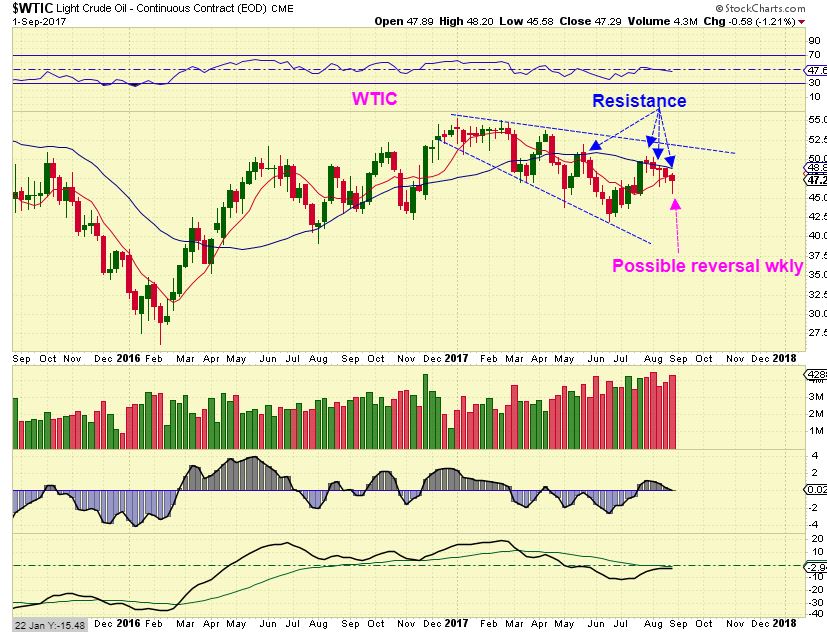
WTIC – In Fridays report I pointed out a possible DCL, and we see that reversal in Oil held here on the weekly chart. A 2nd daily cycle could take Oil to the upper trend line or even break through it.
Some Energy stocks are starting to look like long trades again, but I have avoided this sector personally, except for a few fast trades last week with 3x etfs ( I have pointed out set ups in GUSH and UGAZ & BOIL. Metals and Precious Metals and Biotech have been an area that I have been focusing on as bullishly favorable. We can take a look at a couple of ideas here ( there actually are many), for a watch list or short term traders.
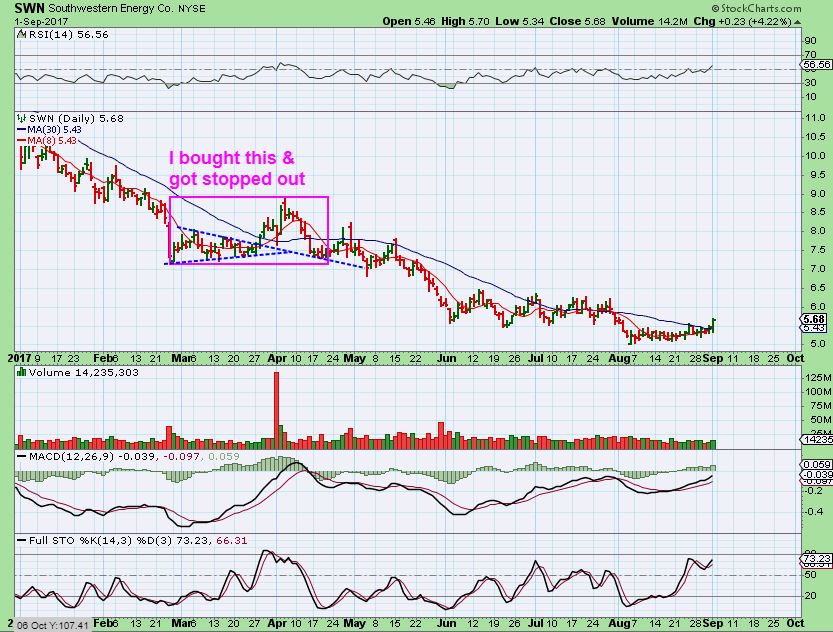
SWN – This does look like a bullish pop, but please read the chart and see March – April.
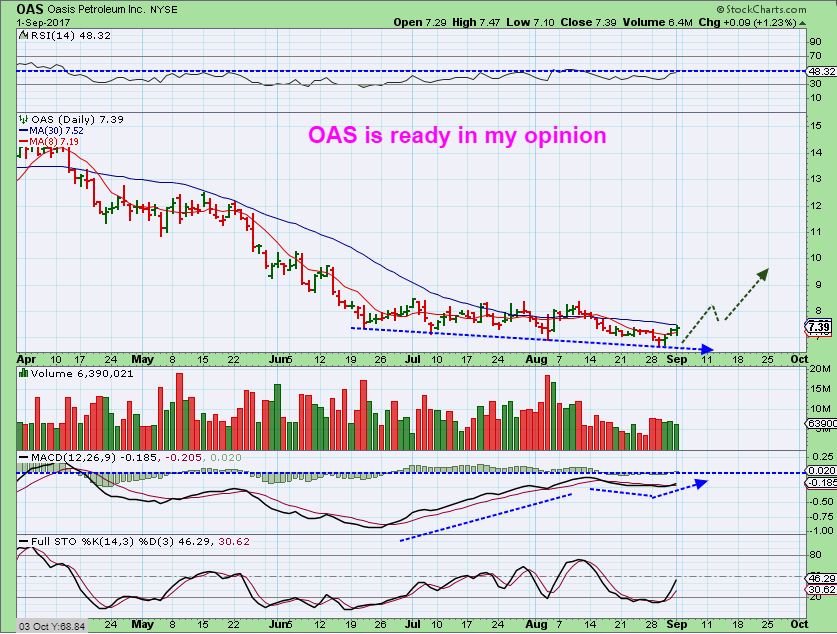
OAS – This also looks like it could be bottoming and ready to break out if Oil moves higher.
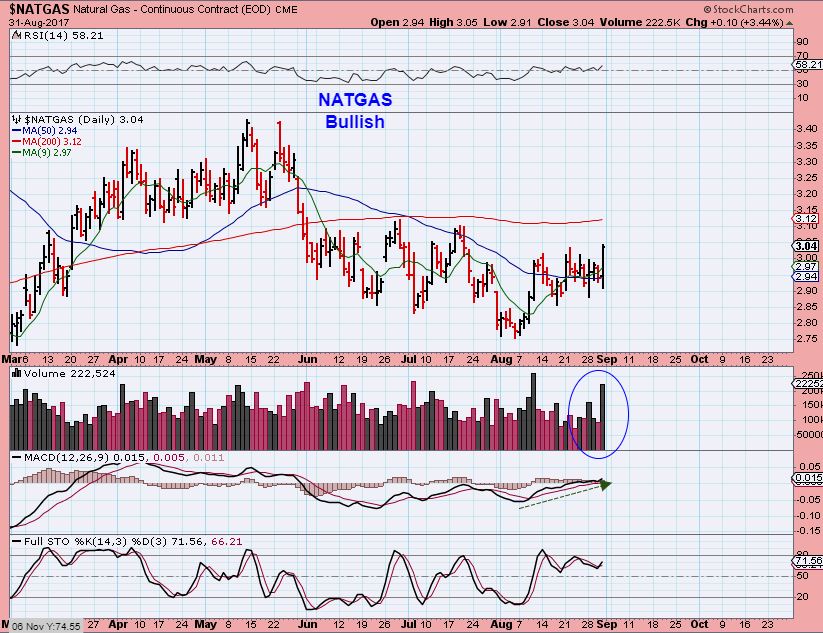
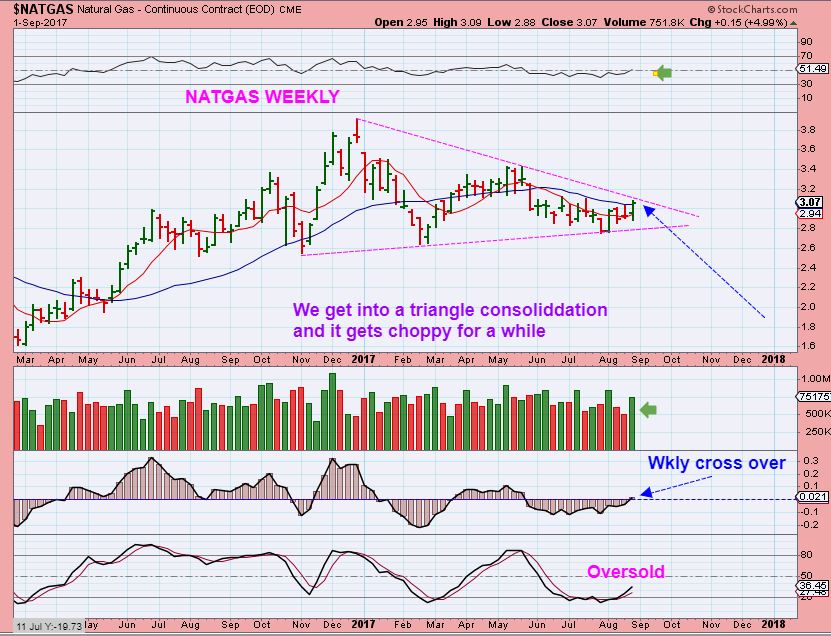
NATGAS From Thursday & Fridays report – Bullish
UGAZ – Bullish 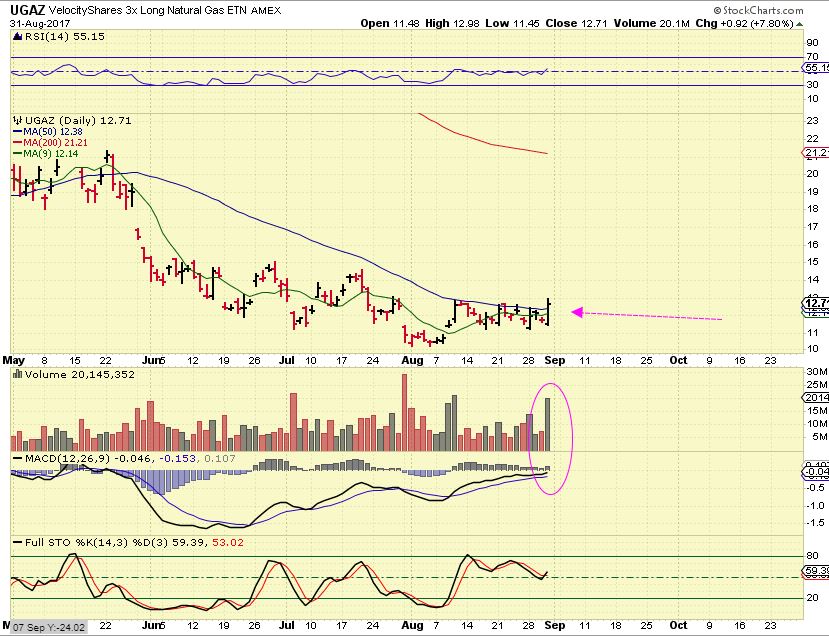
NATGAS – Look how close NATGAS is to a very Bullish break out, and has the technicals to boot. Do not be short NATGAS please.
Summary: The Energy sector may finally be ready to take off higher, and energy stocks could finally be at a bottom. I will monitor it going forward. I have traded UGAZ, GUSH for quick trades at lows from last weeks report, but I am really involved with what is happening in the Precious metals sector, and I am trying to stay more or less mainly focused there.
GOLD, SILVER, & MINERS
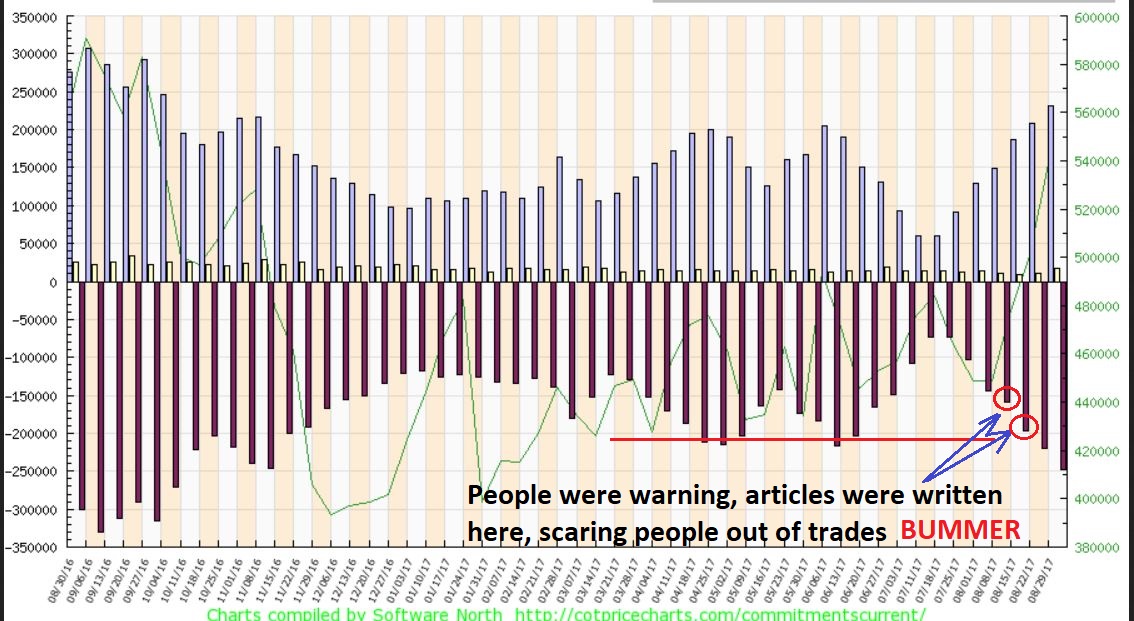
COT – Two & also Three weeks ago people were selling Miners, because an article was written about the dangerous COT smart money short levels (and people do fear the COT). I do not think that people understand the COT levels completely, and I said in my reports that it is not a good timing tool, and that Gold could climb higher, and I recommended buying, not selling 2 & 3 weeks ago.
Well, this is the COT as of TUESDAY, and now we may be getting closer to where I start to think about a possible drop into a dcl. Gold CAN still go higher & so can this COT ( just look at the left side of the chart, right? Was the COT level ever higher? ), so I am still holding my Miners positions.
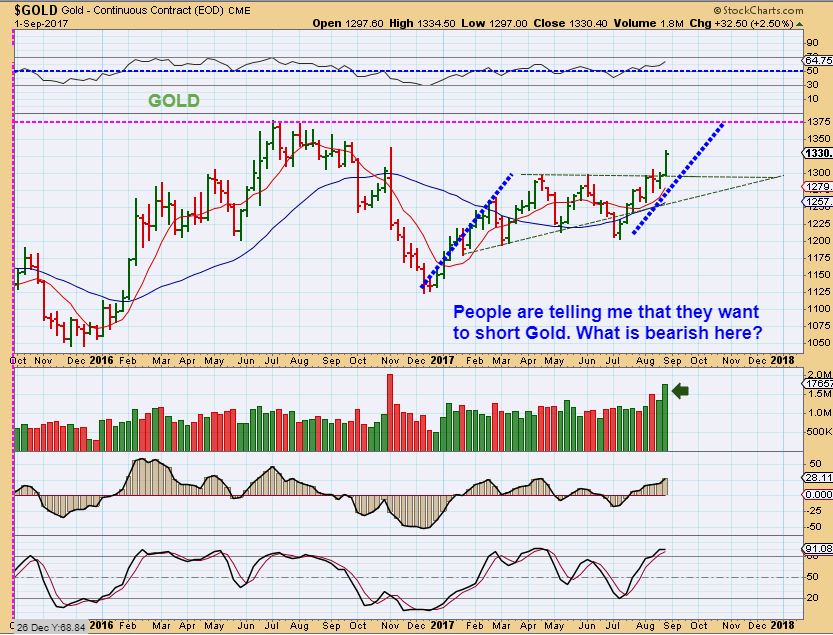
GOLD – Is my cycle count correct? I am actually MAINLY using a feel for the markets and Technical Analysis, with Cycles in the back ground. If I was considering this count correct, we would be forming a right translated 2nd daily cycle and it could top anytime. It is BULLISH, and the 3rd daily cycle should eventually break the 2nd daily cycle highs if this remains R.T.. A dcl could eventually come as a drop to the 50sma, BUT IT DOESN’T HAVE TO. Think about that 2016 run from Jan to May. It left many behind, but here at Chartfreak we rode some miners buy & hold style and also caught big trades all the way up. please read the chart about DC Peaks.
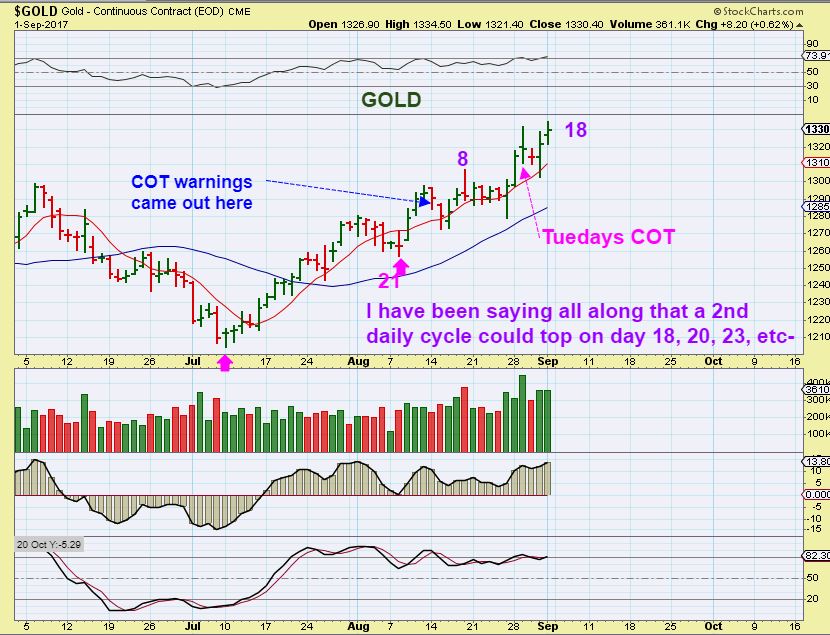
GOLD TECHNICAL ANALYSIS – This is what is expected. A DCL could back test the break out, but GOLD should run to $1375 in my opinion, and it could happen in 1 week. I do not know what a bullish run in the USD would do, but Gold should get to $1375 with this break.
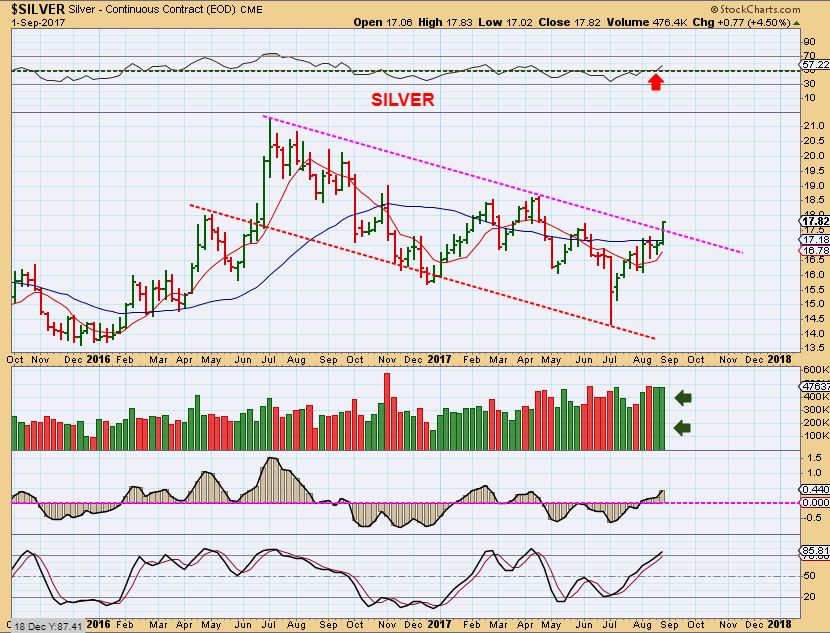
SILVER – In one of my last reports, I pointed out how quickly Silver rises on a weekly basis. Look at April & June 2016. We now have a Silver break out, this could lead to a sharp burst higher.
THIS IS WHERE THE REPORT GETS A LITTLE TOUGH
We are talking about a possible pullback for GOLD into a dcl. We are discussing how The USD has a reversal and is due for a rally ( overdue). We also looked at a COT that is getting a tad higher, etc… but when using tech Analysis, things look extremely bullish. This is how I felt during 2016 as Miners continued to climb that wall of worry. All I am going to say about that is that THIS IS A BULLISH SET UP and I do have reports everyday, so I just take it day by day. Lets continue…
For now, let’s say that GOLD moves higher into day 22 for a peak this week ( just as an example).
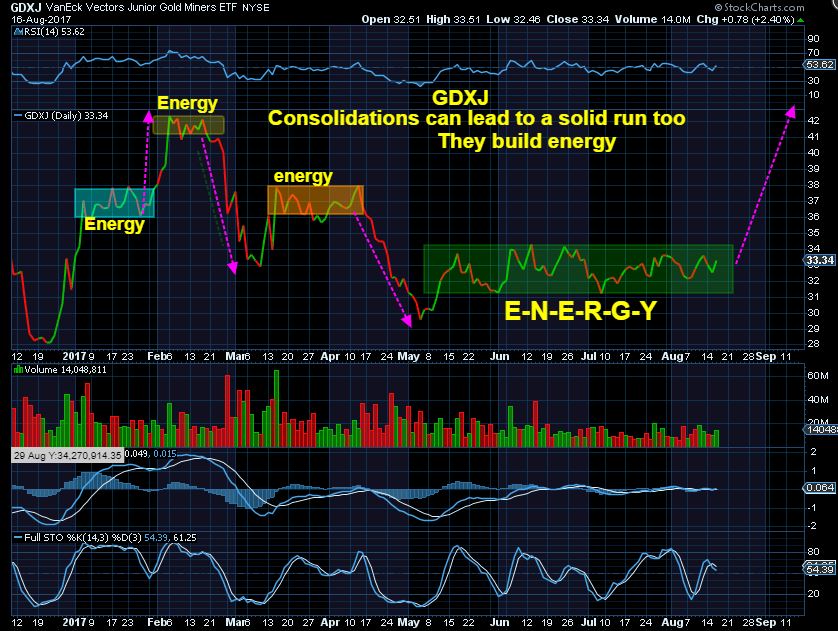
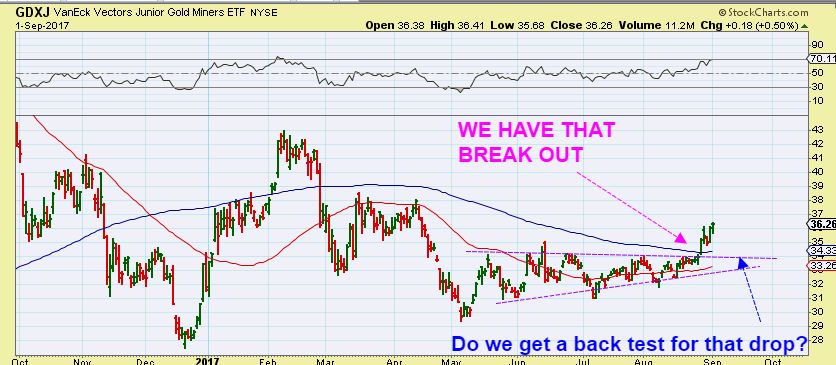
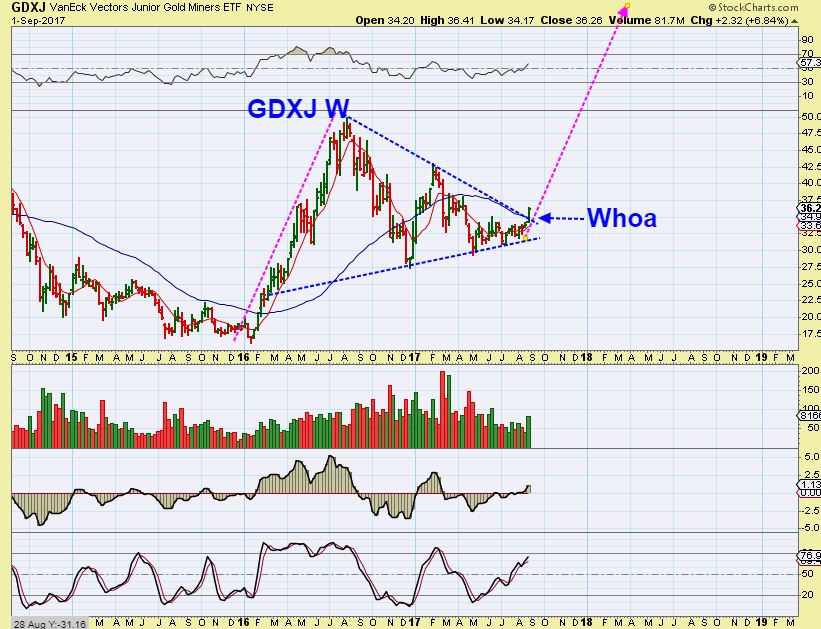
#1 GDXJ – On AUG 16 I said that a break from here should lead to much higher prices with energy built up, and I still believe that to be true.
#2 GDXJ AUG 21– And I mentioned that I (we) have been waiting for a bullish break out of this triangle for real bullish confirmation. Read the Aug 21 chart below.
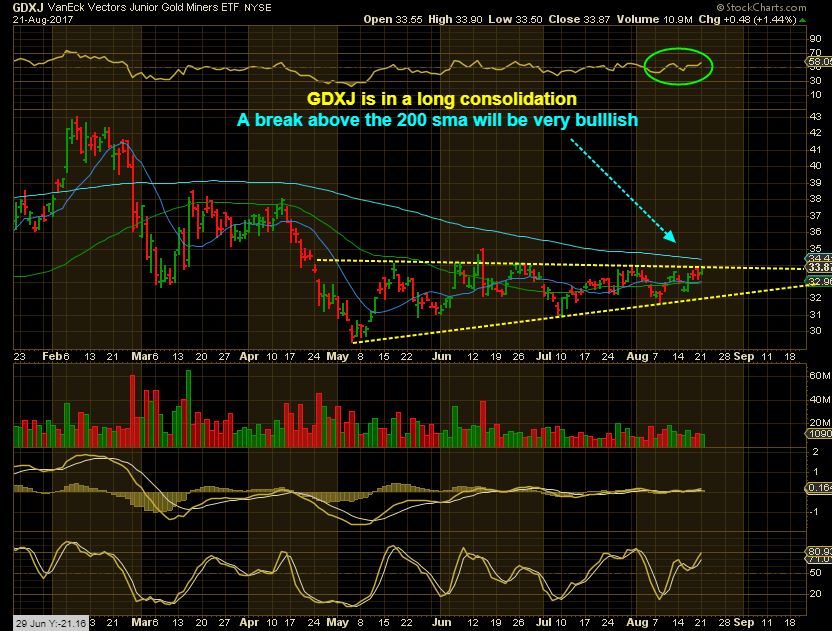
WELL, WE CLEARLY HAVE THAT BEAK OUT NOW.
#3 GDXJ – We certainly did get that break out, and that is what we have been waiting for, because it is a bullish sign. MAYBE we get a ‘back test’ for that dcl and then even higher prices? If so and you have cash on hand, be ready to act. I want you to also know that sometimes a bullish break like this does not back test. The energy, short covering, & buying frenzy pushes it higher. Of course, I cover this sector DAILY, so we’ll watch this play out & we will act accordingly. For now let’s just get back to big picture implications, because this break out is Bullish…
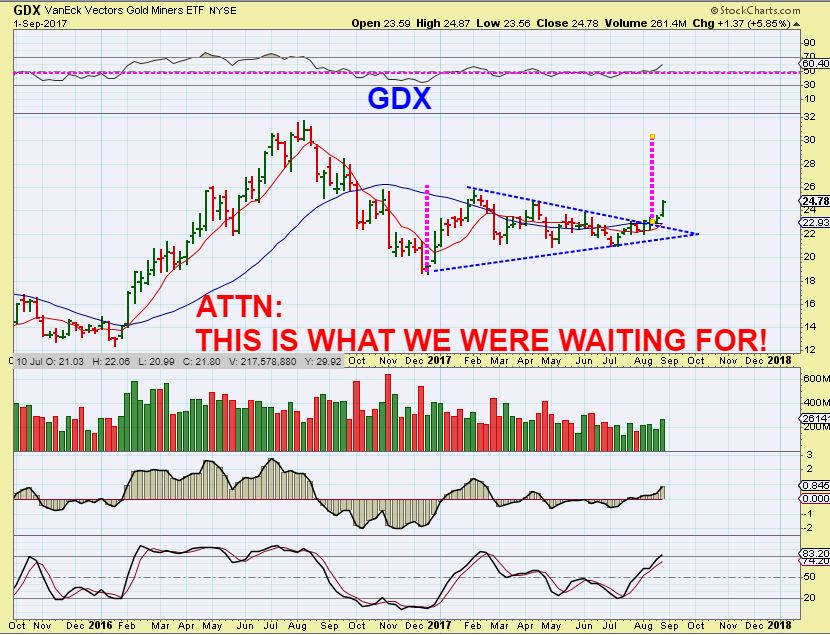
GDX WEEKLY – That is a bullish weekly beak out and we have been accumulating or buying Miners that set up properly for weeks, so you should own some by now. This run is at the starting point. Various Miners do run at different rates of gain, so some may be lagging, but I expect all ships to move higher in this rising tide eventually.
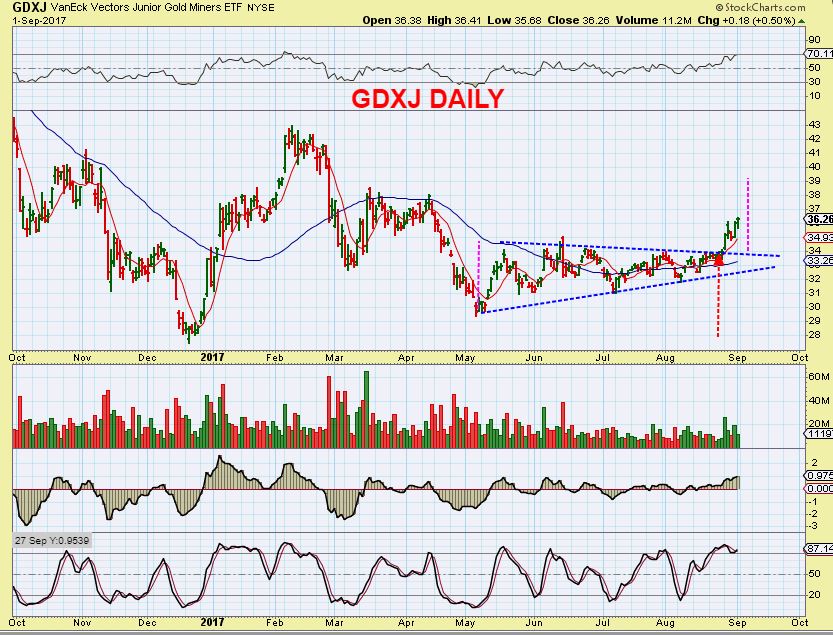
Let’s take another look at GDXJs BULLISH CHARTS.
CHART #1 – A bullish daily break out and run higher. Here is where ‘short covering & buying’ can push it even higher to a measured target near $39.
GDXJ WEEKLY — And a weekly break out is Bullish for that Daily break out. The weekly potential is very promising here.
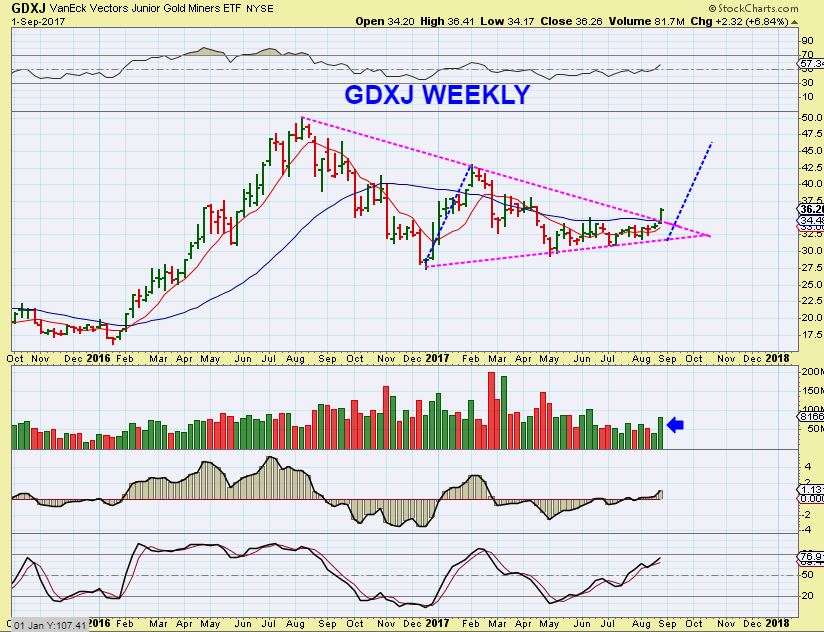
GDXJ – This chart really shows the potential if these Miner begin trending higher again. This can actually run to the 2016 highs ( over time) and it also can even break out from there. People that are still bearish Miners & claim that 2016 was a bounce may want to take a good look at what possibilities this chart is implying. I have people asking me to let them know when they can short this. I will not be telling anyone to short this. look at the 2016 run- ‘shorters’ got killed. This could repeat.
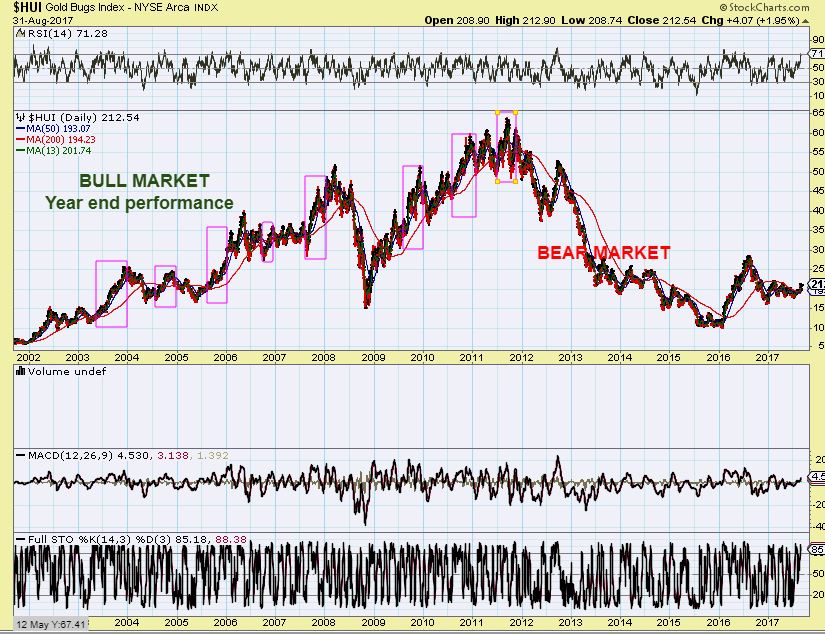
SEASONALITY- Bad for Precious Metals in SEPT -DEC?
An honest question. I was asked about this, and I know that some other ‘writers’ claim this is a seasonality wise bad time to be in Miners. They may use a 10 year seasonality chart. It is very important ( in my humble opinion) to pay attention to everything on your charts. I have made very good money in a precious metals run from Aug through March or even May in the past. I would hate for us to be sitting on the sidelines thinking that “An article on 10 yr seasonality shows that Gold is terrible during Sept – Dec.” So take a look at what I think needs to be injected in there – OF COURSE THAT WOULD BE MY CHART 🙂
I would say, “During the Bull Market in Precious Metals ( see 2002 – 2012) Miners have done excellent Sept to the end of the year (Magenta Boxes), right? Seeing is believing. Those Magenta Boxes are year end rallies. In that bear market from 2013-2016, Miners did not do as well. By the summer of 2017, also an election year, we saw Miners getting overbought, and they dropped and formed a base. So if someone shows you a 10 year seasonality chart, I think that it is BIASED to only give a bear market sentiment. 2002 to 2012 we saw Bullish rallies into year end often. Currently, we seem to be basing after the 2016 Bull run, and could be entering a bull market again. That base could lead to a July to Dec run higher, similar to prior Bull Market year end rallies.
That is the weekend report. It basically shows that our recent expectations continue to be fulfilled. I have pointed out recent bullishness in the General Markets, but resistance seems to be overhead.
Energy looks set to run higher, and MAYBE THIS TIME, Energy stocks will gain some traction. I still think that we saw an ICL & a YCL where I called for it in Oil this June. The XLE & OIH have not been joining that party however.
NATGAS looks bullish on the Weekly & ddaily charts, so maybe now all things energy will begin moving higher together. I will continue to monitor things going forward.
Precious Metals– What can I say? Those are really bullish looking break outs for future gains. We have been anticipating this for a long time, enduring Consolidation, Triangles, and other time consuming elements of this sector. Will there be pullbacks? Yes, usually you get pullbacks along the way, but in Bull markets, the surprises often come to the upside shortly after. Many stocks in this sector are already trending higher and I believe that there are great gains to be made in the future here.
In the US, the markets are closed on Monday, so enjoy the rest of your weekend and we will see what Tuesday trading has to bring our way. For those with open markets on Monday, enjoy your new week of trading. Thanks for being a Chartfreak!
~ALEX


Great report Alex as usual.COT comes out on Friday but the data is from the Tuesday before. COT numbers from commercilas for the last 3 days of the week are unknown. Also good to look at COt as percentage of open interest, it varies from the COT report. A little more accurate. Commercials are short but i feel the same as you. Would you take a position on OAs? Where would you put the stop in? Looks really good.
Hi David,
Thanks and Yes, I wrote in the report ( starting the 2nd paragraph above the COT chart), that this COT was as of Tuesday. I always look at open interest, but I dont go into detail with the COT reports, most people that I see using them do not understand them, and sadly some other writers wrote bearish reports about the COT level, and I saw some that were scared out of Gold & miners 3 weeks ago.
OAS – If I took a position, my stop would be below recent lows. It actually looks very good if you look at the MACD ( not in my chart in the report). I am not personally taking a position in individual energy stocks yet. I have too many open positions currently with MIners, Metals, IPI , & Biotech.
Awesome report, many questions answered for me.
What baffles me is paying under 3.00 for gas. Out here in CA, were accustomed to 3.00+ for regular
Thanks, glad it was helpful.
What baffles me is – why are you paying over $3. Ours just jumped 30 cents/gallon, and you can still find it in NH & Mass at $2.32 . We were paying under $2 for quite some time in my area. SPOILED!
They must be adding Gold dust to yours? 🙂
Enter a zip code here to check price anywhere, SAN DIEGO CA says $2.40 too
http://www.newhampshiregasprices.com/GasPriceSearch.aspx
Check out your taxes perhaps?
Hi all,
CF has emailed me this weekend so I thought I would give an update:
I have been by my 90 year old father’s side for the past several weeks due to his failing health, he passed away last Friday afternoon, a very slow death but with very little pain, which was a blessing. He is with Jesus Christ now ( not to offend but it is our belief ) a much better place. Life is fleeting hug your children and grandchildren, tell them family stories, Family is one of the most important assets in this world. I will be managing the Estate for several years moving forward, which leaves me even less “time” for giving my “opinions”. 😉
I will leave you an EW trade set up below. I will not be managing it or defending it, use your best judgment. It should now have 5 waves up in a wave 3 unless wave ii is broken to the downside. https://uploads.disquscdn.com/images/98c1456727b17e8d24c50b41e5e020d07cd12bce3229ea442924dcc4a5b66e08.png
Good Luck All………
Losing our loved ones is THE hardest part of our living. Thank God we have our memories to reflect upon all the wonderfull times that were shared with them.
Im certain all here join myself in thinking of you now and wish you our best.
Best Ken – looking forward to when you can get back in the saddle here.
Thank you Ron.
Thank you Craw.
Yes good memories and now a legacy to look after. 🙂
Amen brother.
So sorry Ken… I just lost my very special great auntie who was my last window to the past …
Been a tough few months.
Blessings,
M
Thank you Maria.
Very tough, makes your priorities change a bit ya know ? 🙂
https://uploads.disquscdn.com/images/03abb10b5cbf74b388f0958697d92426f465f8f8d1b67d0c0a9ecca6daa6c2f9.png
Ken, Thanks for dropping in. Like I said in the email, many were wondering how you were doing, and I wrote so that you would know that you were missed. I wasn’t aware of your fathers condition. I’m very sorry to hear of your loss. I still have both of my parents living within a 30 minute car ride, but even the loss of my grandparents was tough – so you have my deep sympathies. Your faith will get you through the toughest moments and memories can bring back some of the good times.
Hope you’ll still drop in from time to time, even just once a month or whatever works out just to say hello. Maybe throw up 1 chart like you did here. By the way, that is a pretty clear 1-2-3-4-5 to 1 , and I see an a-b-c down to 2 , so it should be about to give you a decent ride that doesnt need much monitoring, while you care for the Estate and family. Nice to hear from you again.
Thank you Alex.
So sorry for your loss Ken. I will follow your reminder and send love to all those close to me. And, I send a hug to you.
Thank you Nancy.
So sorry for your loss Ken – with my Mom passing away in April I can really feel what you are going through as we’ve been dealing with the same – but also comforted by our faith. Blessings to all of you as you deal with the feelings and everything going forward – this is the same reason I haven’t been around as much the past few months – although I’m slowly trying to get back to watching a few stocks. Take care and I’m sure we all here will be thinking of you. 🙂
Thank you Tammie…..
So sorry for your loss Ken. I too have lost my father so I know what you are going through. I love your thoughts on family stories – they deepen a sense of belonging in us, thanks for sharing that sentiment. Life is indeed fleeting. You and yours are in my prayers.
Thank you Evan.
I mentioned GURE a few weeks back when it was $1.75. Had a nice break out last week. Book value is around $7, still a lot of room to run. https://www.screencast.com/t/4LvkNjKxC
I do like the charts current set up.
Just a great company, so much going for it with a lot of cash on hand
Thanks for covering seasonality Alex – very helpful. I have a few junior miners at the moment, but will be looking to get back into GDX/J at the next DCL (unfortunately I sold at the last DCL!).
Ur welcome, I’m glad that you asked, it was a good reminder of what some might be seeing or thinking about. In the bull markets of the past, I have done well into year end, so I’m hoping that we see a repeat of Bull market activity here 🙂
I kind of wish the markets were open right now with Gold up $10ish
Kick ass report, Alex, and like ´dialogeuser´below, thank you for covering the seasonality issue as you clearly show the results to be opposite of what we often hear. I wonder how they can be so wrong, unless it´s outright lies to get people out of position? in any case, being long has been the call and you have been all over it thus far. I am also glad you told us you were not giving much weight to the COT a couple weeks ago. More of often than not, I don´t make any entry or exit decisions on them, so I wonder why I even read them being there are many times they could cause me to make errors had I followed them.
I am happy you are still seeing parallels to 2016, as am I, though I still find it hard to believe such a spectacular move will repeat so soon. It certainly could happen though, and even if it does not, I am sure we would all be happy with half that move as long as we traded it correctly, long and with big size. If it does repeat, we will be in position to get paid.
I am only interested in miners at this point and will continue to leave energy alone. The OIH etf not only hasn´t triggered a long term buy signal, it is not even close yet on my charts. Not that I don´t think it´s possible they go up from here, it´s just that miners have already confirmed they want to go higher by my charts, either right now or after a small pullback. I´m 66% invested now and looking to put the other 33% to work, nibbling with small orders on up days and prepared to go all in quickly, if we should get the test of the breakout.
You are unique among newsletter writers in that you give actionable ideas, and not only based on cycles as they are just one tool. Cycles are like anything else, I have seen them work wonders for stretches, and I have seen them out of sync for many months also. Good to have some chart patterns and technical analysis in there as well, proven by your results.
Lastly, how my long term charts are setting up, I will not be selling for at least several months. These miners are just triggering their buy signals after many months on sell or sideways, and the signals typically last 6-9 months. Being many started to flash buys in August, that puts us out to between March-June for me to expect a sell signal again. That isn´t a recommendation to others, it´s only how I will play it, and it worked really well in the 2016 bull, which lasted 8 or 9 months.
That turned out to be a longer post than I anticipated, good luck to everybody!
LOL – I love that last sentence. I seem to say that at the end of every report.
As for the seasonality stuff, maybe they just pull up a 10 year chart? If so, they are only looking at “What happened during the last 10 years , when Gold was mostly in a bear market”.
And yes, Daily charts have been on a buy for many Miners, and now Weekly charts are kicking in, and even Monthly on some Miners. The USD is that possible wild card short term negative reaction right now, but most things look bullish again (finally).
At-A-Boy Alex! ( Nuff said)
“At- A- Boy”!
Wow – nice , I haven’t received one of those since I worked for a small manufacturing company and the owner would give me one of those for problem solving some of the little set backs that would occur while he was out of the road. Good times! 🙂
Alex: Always remember it takes just one ‘ Ah-$hit ‘ to erase all at-a-boys.
I’m happy for the readers in countries that are trading today, seeing Gold pop up over the Sunday night- Mon trading. Maybe miners are doing well over there today.
As for me, time to get outdoors.
Enjoy everyone!!
Definitely a good weekend to get outside here. Went to Kailuha Saturday and up to North Shore today. Need these miners to keep rocking, b/c I’m now gonna need to make enough $$ to buy a kayak. I took my girls open ocean kayaking on Saturday, went to an island you can only get to by boat (or swim!), and now they’re hooked.
Here’s to another good week! https://uploads.disquscdn.com/images/00c17d3fae6bc48a76cf71ce5aa50727de833fa3f33362f1c9f48cf231b86d15.jpg
https://uploads.disquscdn.com/images/4545061837ed301f0a00a2697b64f746309d060dbd756b9cd0c45b0a8ed03a62.jpg
Very nice pics Cason – tropical!
Two great spots. I use to go to both when I lived there, before I ended up on the Big Island.
From the look of length of that freeboard on the kayak, especially in the stern, you are in definite need of a couple of kayaks, 🙂
*and a lifeJacket… 😉
https://uploads.disquscdn.com/images/dd055176da3e9be1c626fdab4d882ce378b4b3b96f1e87e2ffb3daa05562984a.png
😀
There are a few in my family that will agree with you!
Youre going to need a bigger boat!
I know. Mine is already full of miners. No room for people. HA!
Have always said I was jealous….now I have a CAT 5 hurricane coming at me! Bet you are glad you switched places with Hawaiifive0 and he isn’t!
You’ve got that right Nancy!
Get prepared H5. Cat 4 or 5 are no joke. This one is SO unpredictable! Wish it would pick a side already! Maybe it will just run straight up the middle.
OMG …. prayers it changes course…….
Thanks Maria, but the only good place is out in the Atlantic and it apparently is NOT going that way!
Stay safe, kinda crazy right on the heels of Harvey. We’ll be thinking of and praying for you guys!
Thanks Cason!
Alex – following your strategy I’m up over 10% overall, my stops are well positioned out of harms way, I would break even if they were all hit and I am more than ready to add more risk. Thankfully I only succumbed to the need to sell in early August and have been building since.
For those looking for long term ideas, commercials are more long sugar than they have been at any time in the last five years. See the Sugar futures chart. On the SGG daily, it could be back testing the 50 day or the recent bottoms. Worth having on the watch list https://uploads.disquscdn.com/images/3b51b65fb46a2218646e7a75903cd7a72e2bf163b7dc3db5d823708c4f5d2666.png https://uploads.disquscdn.com/images/fbfd307d9d91f14ba5692503e0ca96c75112f1bd885bc8951962773af40104b6.png
Thanks MM
I actually accidentally looked up SSG, and I saw a double bottom reversal candle that might not be saying good things for the semis. You pointed me to 2 possible trade ideas 🙂
Alex I lost you on that comment. Re: semis – did you mean semi conductors?
Yes, I looked up SSG
ahhha and MM was talking about SGG. So you are seeing questionable behaviour in Semi’s? Me too. Since SOXX peaked on June 9 I have been watching very close – and today is day 15 for it in this DC.
SSG has a pretty real looking reversal, and looks like it wants to go higher. That is a bearish semiconductor trade
Back from touring France… Finally summer trading is coming to an end. Ready for our stocks to start moving 😀 https://uploads.disquscdn.com/images/6351da46735ef9d2f7fa784a48cbe2cf57f7176623e164888cdc7f32e2c1b8f0.jpg https://uploads.disquscdn.com/images/ee1ee9b098b72ed8a45aaa3008e64c2c0a08c0129c8503f71bac28959edd4a1e.jpg
NIce pics , welcome back.
Putting that Vacation Fund money to good use!
Thanks Alex. Another great report as always. I may try to add some AG and EXK next.
I have both and they are doing well.
Boy, I wish someone would have let us know that Surprises are to the Upside!
/;^)
AKS..CLF.. X…..Steel still look very strong.
Kinda wished I had been up to sell that quick pop in CLF and could buy right back in here. :P. Missed it
Yup…that would have been a good move. I had to go out myself on errand..missed the move..still, I’m hanging in.
Yes, holding for now, but if we get a big pop I’ll move to take some off.
That’s my plan also. GL
dumped GSV. I’ll put the money to work in something more lively.
MCOA announced this morning it’s getting involved with a marijuana company in Canada….seems to be some buyers stepping in on the news….
Held a Starter in RIG at 7.50ish, added at 8.00 – Sold out half of position today at 8.80
The silver miners have been all over the place the last few months, with past reliable´s like AG and EXK getting smoked, while little names like AXU and EXLLF skyrocket. Then their is the TAHO fiasco in Guatemala, so I´ve decided with the portion of my miners going into silvers, I´m going to stick with SILJ etf, the Silver ¨junior¨etf, even though it has some bigger names in there like PAAS too. I like how volume is starting to come in, and will add to this one on the next pullback in miners, hopefully soon.
I normally don´t like etfs. but I see SILJ performed as good as my best stock in the 2016 run, MUX, both up around 380%, so not like the diversifying would have hurt, in fact with the same upside potential, I prefer to be diversified in something like SILJ.
CF – thanks for that call on SID before close on Friday!
What was the call before the close on Friday? Just to hang on?
If you caught it here, this was Wednesdays chart used in the Thursday report and a good trade 🙂 Ridem!
https://uploads.disquscdn.com/images/eea72467544adc7b846541f2b1e1f49893775d0adbdf7a13e5bf7c85e5da4cc2.jpg
Oh naw, I asked about Adding to that initial alert. U said add at the 200 and dont sell if it stalls like it did at the 50!
Oh, that sounds familiar – it didn’t bother playing around with that 200sma like it did the 50sma…just broke through . Nice.
Still holding Half of my HDSN swing… Looks like another mini C&H tryna form on the daily.
Sold Half at 3.10 well see what happens with the rest
DRD started a bit slowly after first being recommended, but seems like almost every day since then it is up a bit more, probably slowly heading to that 200sma
Last week i took positions in DRD, KLDX, GPL, USAU & GSV. Except GSV the rest of the miners are doing good.
Happy to have grabbed it.
Just wishing we added more in the 30s!
I wasn’t even alive in the 30’s 🙂
Hi Alex
Last week took a starter position in GUSH & GASL around 16.00 & 16.10
Acting correctly… I am looking to get in IPI now pullback can i add at 10sma?
You can add at the 10 & it has often held at the 10, but it could also drop to the 50sma.
Hi Alex,
Thanks a lot for sending the weekend report to me earlier today. I saw your report yesterday but i was busy at work also no markets. So thought of calling the support team. Just thought of informing you. You are so kind and sense the urgency of the readers heart-beat you replied promptly sending the report to my email. Special thanks for your service attitude. Later i follow up with support team.
I am from SIngapore, so i won’t able to monitor complete market due to time difference of 12 hours. For me exactly 09:30 pm markets starts.
But i never miss your report & all the comments, it is part of daily routine. Take Care…
Ur welcome, I had to help a couple of readers yesterday, they were also unable to log in, but that problem has been resolved today 🙂
I had the same issue, Alex. Thanks for sending the report through email and resolving the issue with urgency. Thanks again !
Ur welcome 🙂
Alex, what are your thoughts on FCX from the chart perspective? The company had some material contract changes in Grassberg with some unknown valuation factors re: disposals still unknown… Thank you!
FCX 9 at this point) is still fine, but it could drop to the 50 & 200sma area. It never really back tested that area. The 50sma crossed above the 200sma, so that is good and it is even still above the steeper trend line.
It may experience that back test though
I never regret selling NAK for profits as that little thing has been a hell of a ride, but congrats to those sticking it out again.. Chart looks great
Still holding, but I’m gonna sell partial soon, can’t ride her back in the red – no chance.
Took partial profits on IPI and GGB, raising a bit of cash. Nice run, thanks CF! Starter position in SGG, per earlier post
Mark – I like that chart!
Good sell on GGB, it hot the target that I had for it ( Former recent highs). It may form a handle and break out later, but for now I think the short term run is complete.
I dont know if anyone else took my solar trade that I mentioned I did take ( ENPH).
Just to let you know, I am thinking that I will probably sell it if it stalls at the 200sma.
It Could break right through, and volume does seem to be increasing today, but if the solar sector as a whole does not
look strong, I may take my profits. It is a rather small position anyway.
AAAHHHH, Actually, this thing now looks like it may want to break out & run. It just stretched out & is up 10%. Looking back at RUN, VSLR, WNDW, etc, maybe I’ll hang on a bit longer
Alex, thx for this idea. I have a small position. What is your target if it breaks thru 200dma??
OAS does look to be breaking out here, and the volume is strong at this point of the day
Especially with general markets in disarray this morning!
just fyi – JNUG is tapping on it’s 200 day SMA
It is interesting, even though JNUG is 3X GDXJ, GDXJ blew right through the 200 dsma.
GDXJ Outperforming GDX again, day after day lately 🙂
I have repeatedly been told that this cannot happen, but I didnt believe it based on what I was looking at.
Have you been told that?
https://uploads.disquscdn.com/images/5816c142fdeab6597674e751b3da646c273902f69fa30a881e1943105201166e.jpg
lmfao
Oh goodness, why don’t we let Nancy be the artist here- lol
Really really wishing I was still holding on to some JNUG in the 19s and NUGT in the 32s… Painful lol
I lowballed my JNUG bid 2 weeks ago so it never filled. If I had just gotten even a starter…
great job …..
No, that’s silly. I didn’t do GDXJ this time around but GDX. The rebalancing dilemma was not part of that decision, however.
SILJ has been outperforming both on most days of late.
Did someone accidentally try to buy TGB, but instead sell a 600,000 share chuck, and then try to buy it back? the 5 minute chart got crazy
Thats nutty – and the vix is running again… crazy times
Man DRD is a little monster.. None of my other miners wanna act like it.. Wishing they would, thats for sure.
Yeah, DRD is really stretching out here
Hey CF, do that thing you do when you buy something and it skyrockets.. Gi do that to GSV plz.. It doesnt wanna play with the rest of the class
That GSV chart looks very similar to DRD abck when I first recommended DRD.
Base, 50sma, etc. I think it’ll play catch up sooner or later
IDXG looking like it wants higher on the daily
Wooo go gold!
https://uploads.disquscdn.com/images/07f1119da7d7c3226efe4cf752b5927258b8511da6009b28a6772637be327767.gif
That was a pretty solid late day pop!!
Moving to sell another tranche of GDX Calls. Continuing to lighten leverage into strength as timing wise top of 2nd DCL comes into play here. Not selling individual names, but looking to assure profits in short-term trades where I can. Left with a runner only (GDX Calls) at this point.
Very well done brother.
Thanks, the sun shines on a dog’s @$$ every once in awhile.
AUY looked quite bearish in July, but has become a pretty chart on a 3 month daily.
HIMX and NQ 🙂 vroom vrooom ..
*and miners of course 😀
now i dont feel so bad booking that lonnnnnnnnnnnnnnnnnnnnnnnnnnnng trip… tehee
I missed HIMX today…
from last week or so ….
Take a look at IDXG
I have to admit, the 2 natgas charts in the report…Daily and weekly both looked bullish, but the weekly needed to prove itself. I see NATGAS down quite a bit today – as though that weekly chart is still in force. NATTY was right at that upper trendline.
Oil acting correctly
It’s like nat gas read your report and just wanted to spite us. It does that a lot. She’s an ugly fickle beast.
Back in GSV and left 2 cents on the table. Have to eat the humble pie once in a while.
LOL and I want out… I have a massive position in it, and it moves 1% lol. Im getting impatient as all hell with it.
I know I know and then I read CF’s post below. I’m giraffe hunting ya’know
so am I… and Id really like to start seeing some yellow and and a long neck or even some spots on this one… Like come on giraffe
It was a limit order and was hard to fill.
Took Half HMY off the table just now at 2.18 still letting the other half ride from 1.88 initial add. Not my best entry but gotta love the follow thru
Nice to see MUX finally join the party.
check that volume in KL =+596%
Holy smokes…
just saw a report KL is doubling their ownership in Novo Resources to 18% NSRPF or NVO.V. That is one honkin’ giraffe neck on that one. I hope KL can do the same.
absolutely love that 6 month chart
Aside from my miners, I added to HDSN today for the swing. Im still shooting for 10s.
Nancy…what area of Florida are you in? Wasn’t sure if you were as far south as the Keys where they are doing mandatory evacuations or not…I’m thinking you aren’t down there …?
Thanks for asking. I’m in Vero Beach, east coast, mid state-ish. This Cat 5 is looking really bad and if we run away from home..to where?! It is so unpredicted. I have one offer to stay at up in NW Georgia which may be our best bet. Have to see Dr. tomorrow to get stitches out where I had my tooth pulled so can’t escape till after that… Late wed night but more likely VERY early thurs morning. Hope the road won’t be a parking lot with all the people running from Miami!
Stockwise… Can’t believe I have waited all this time and FINALLY gold is getting exciting…and I can’t be here to watch and act! Damn!
Alex….have been holding ARWR for a few weeks….finally something I have a nice gain in 🙂 …..what do you think of the chart? I think it can keep going…..?
WOW – looks like it may be extended on a 3 month chart, but it looks like it is fine on a 1 yr chart, filling that gap. At times these run and bull flag ( see solars RUN & VSLR for example) and then they pull back. I’d trail a stop ( even a mental stop) and just hope that it doesnt gap down.
I usually sell some on the way up if the position is big- tough call when they run this much.
Well, it’s not a large position – I wish it was! Always afraid to put too much into one stock, then I get one like this and wish I’d put the whole account into it….:) I really want to get more when I look at the 1 year and 3 year chart….but…..like you said, the 3 month is extended…
So you could watch it and add on dips if it has dips that are not reckless. Dips or consolidations.
Yes, maybe I will do that, thanks 🙂
When I look at the 25+ year chart of the XAU, it seems we have so much room above to run. The XAU today is only at the same levels as the depths of the 2008-09 crash. We we actually quite a bit lower than 2008 levels, back at the end of 2016. Crazy! Whenever this bull re starts (maybe it already has), there could be shocking gains over a couple year period. We haven´t seen anything yet.
Anyone holding INSM? (I don’t have…) Biotech that had good trial results…..doubled in price today – just take a look at that gap!!
THE WEDNESDAY REPORT HAS BEEN RELEASED