As time moves forward, we are seeing progress in various areas of the market. Today at 2 p.m. Eastern Time, the Fed Minutes are released and that often can affect the markets too, so let’s take a look at where things stand…
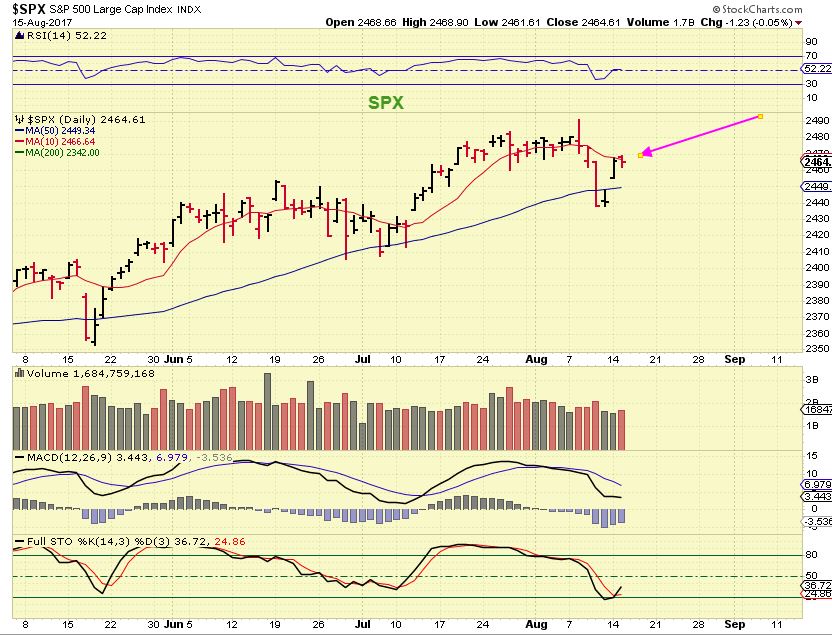
SPX – No change from yesterdays report & expectation at this point.
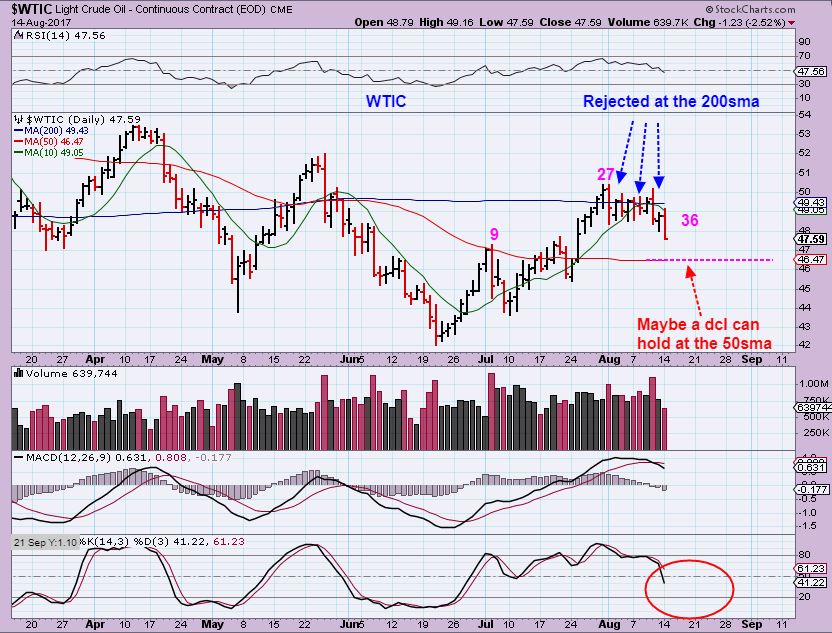
WTIC – Yesterday with this chart, I said that Oil is well along in the timing to seek out a dcl on day 36. We had a swing high in place with Mondays drop.
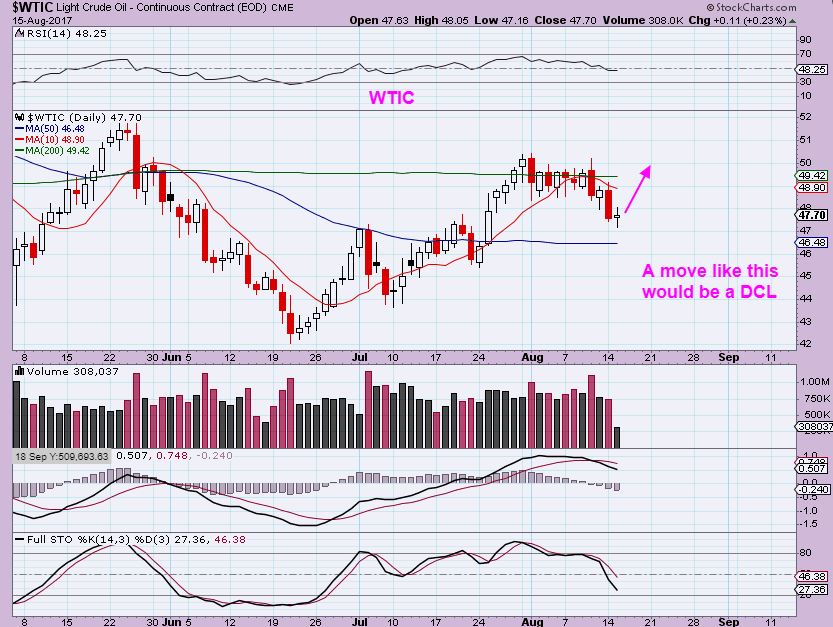
WTIC – Day 37. With a small trading range on Tuesday, it lowers the parameters for a dcl on Wednesday day 38 ( or day 1?), but I am thinking that we could still drop to the 50sma. oil is not exactly oversold yet. Wednesday is the OIL inventory report, and THAT may give us our next clue. Look for a possible Pop or Drop tomorrow. And…
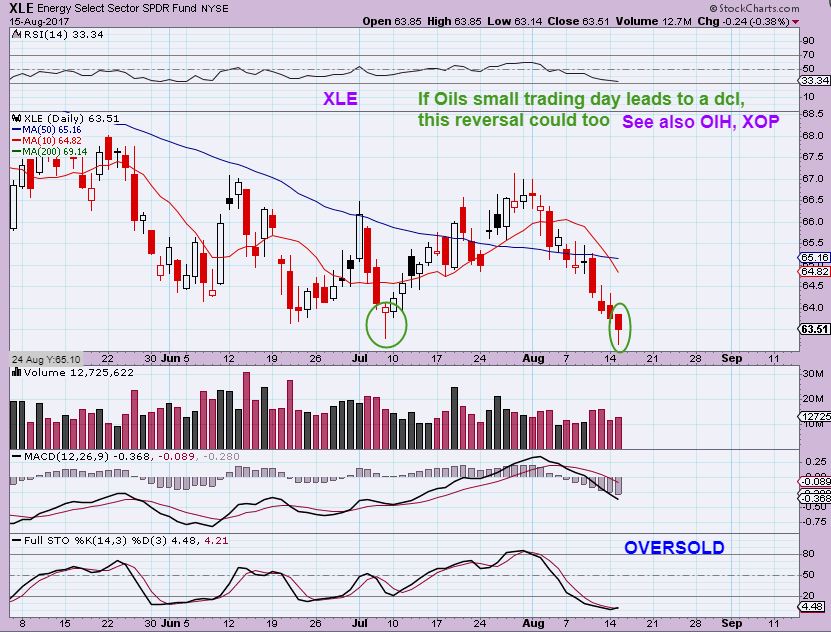
The XLE , OIH, XOP all looked like this on Tuesday too. This is a possible bottoming candle, so we’ll see what Wednesday brings. We may be seeing a dcl form in this OIL & ENERGY sector.
FED MINUTES ARE RELEASED AT 2 P.M. EASTERN TODAY – USUALLY GOLD REACTS ONE WAY OR THE OTHER
GOLD –
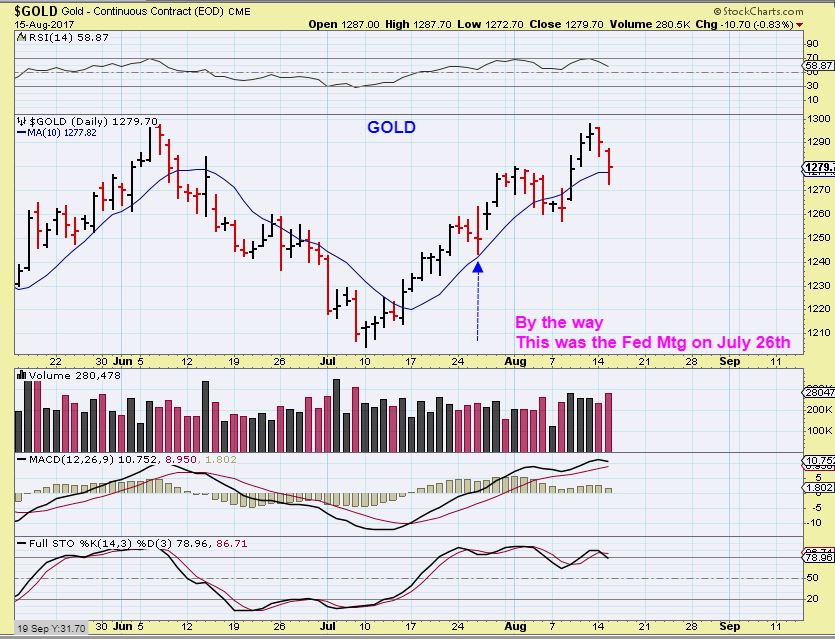
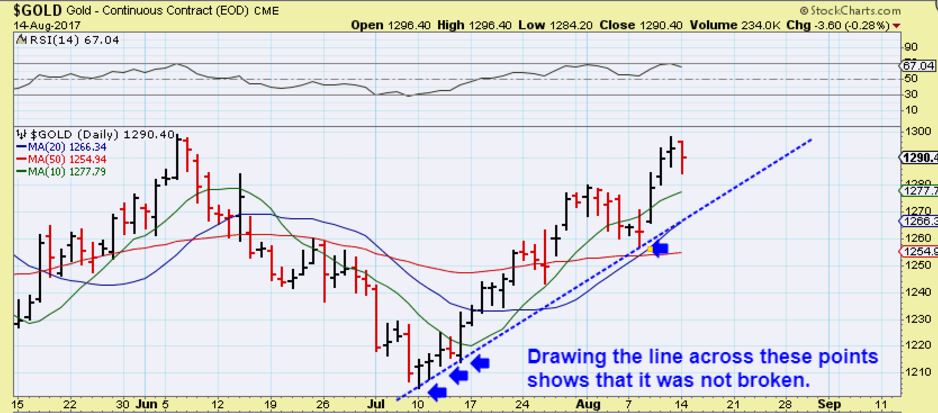
GOLD – I have already discussed different ways of drawing this trend line that makes me wonder whether or not we broke a trend line, to give us a dcl at day 21. This would be showing that we did not break the trend line and a DCL is ahead.
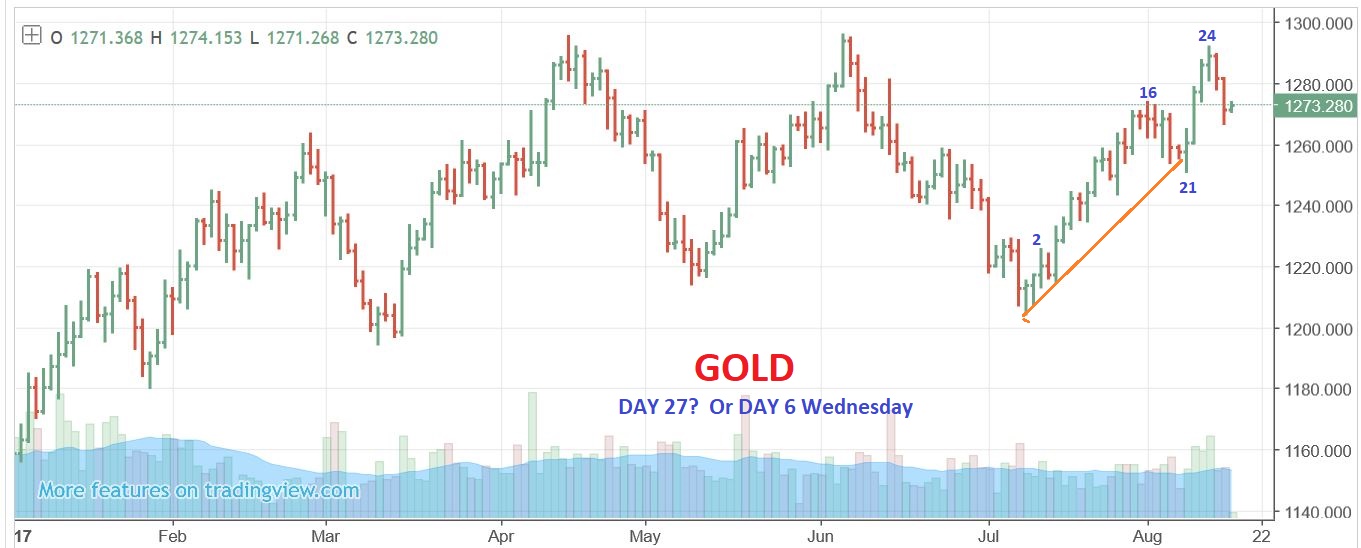
GOLD – This trend line shows a break and Possible DCL at day 21. It really doesn’t matter that much at this point, it remains bullish either way. The ICL really seems to have occurred in early July, and we are on either Day 27 heading into a dcl, or day 6 of a new daily cycle.
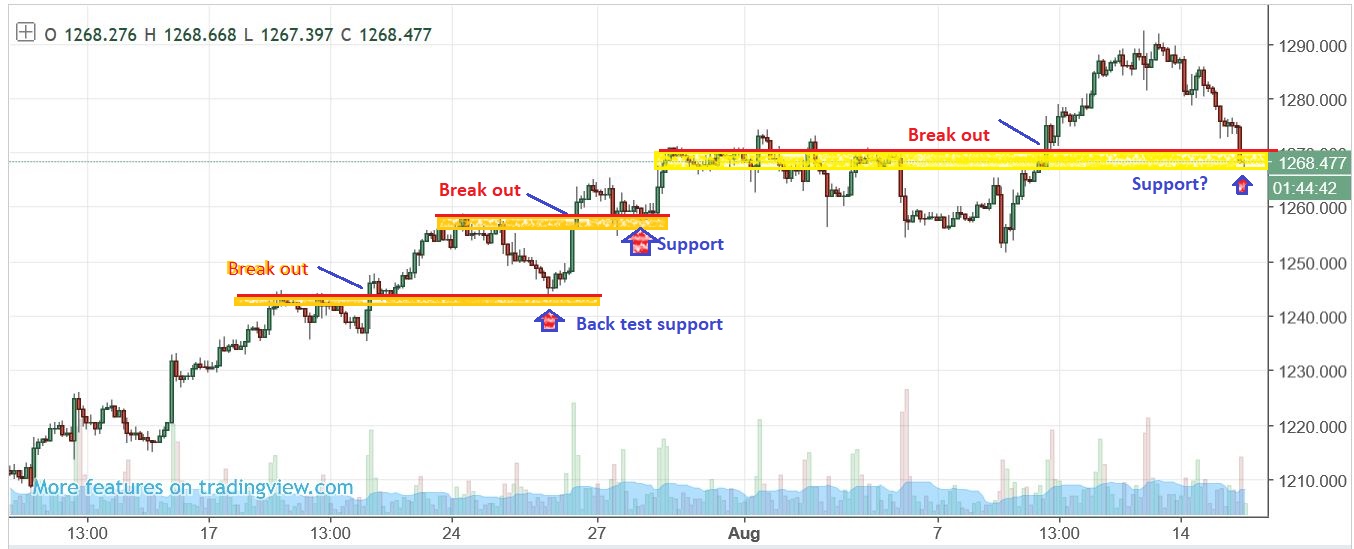
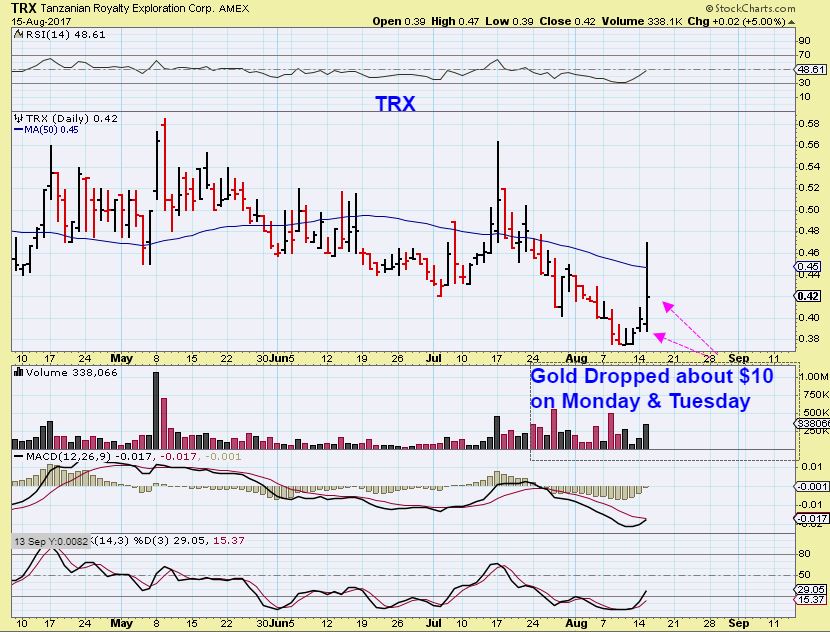
GOLD SUPPORT– Gold sold off roughly $10 on Monday & $10 on Tuesday, so are we in a support zone here? It appears that we are, we’ll see if Gold holds off from selling down another $10 on Wednesday, especially with the Fed minutes being released.
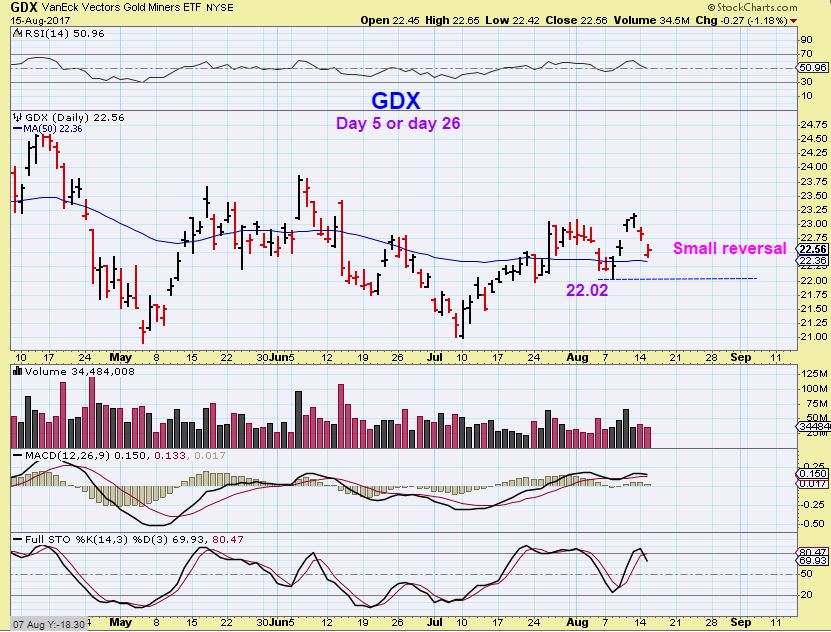
GDX – Possible reversal candle above the 50sma, we may be seeing the sellers drying up.
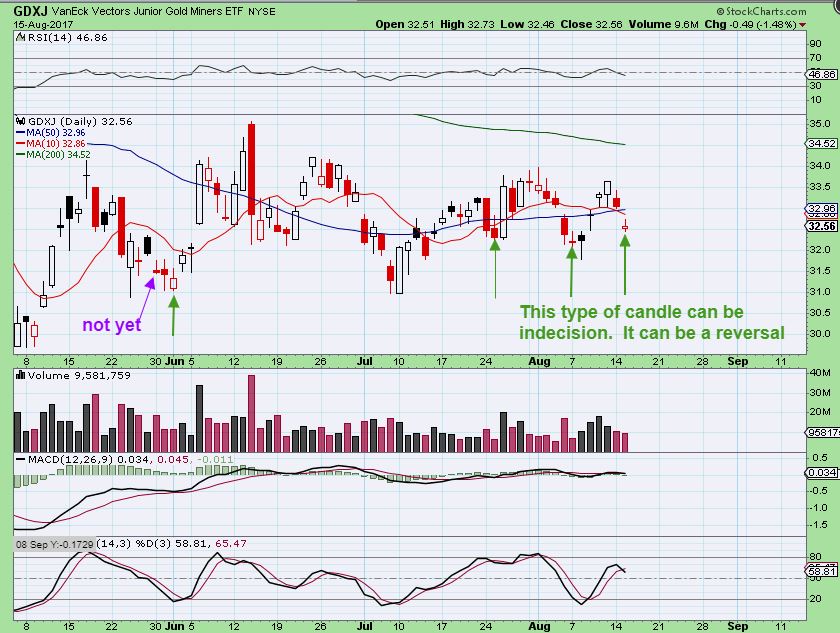
GDXJ – GDXJ had what could be a reversal candle too, a gravestone doji type of candle. They can appear when sellers & buyers struggle to gain control. That said, …
BASICALLY- We are still just inside of that triangle as time goes on.
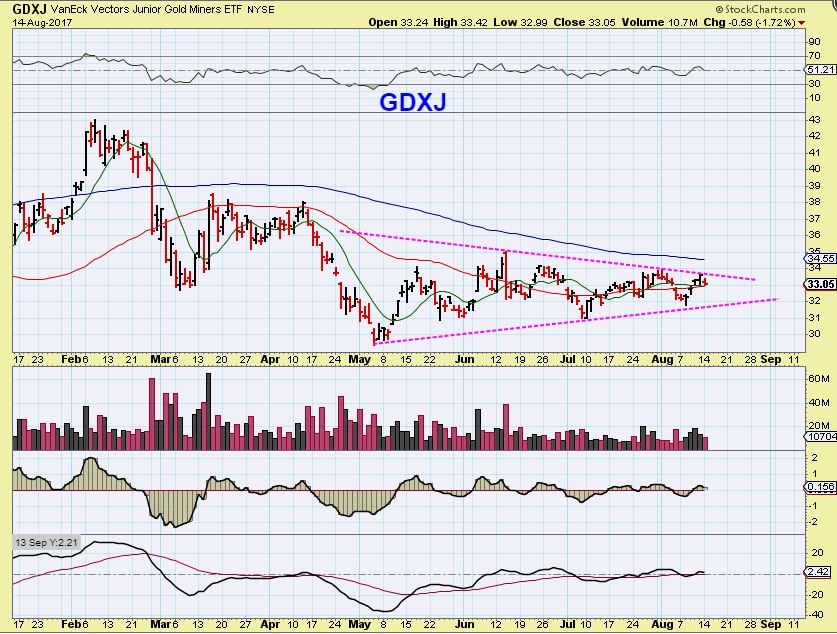
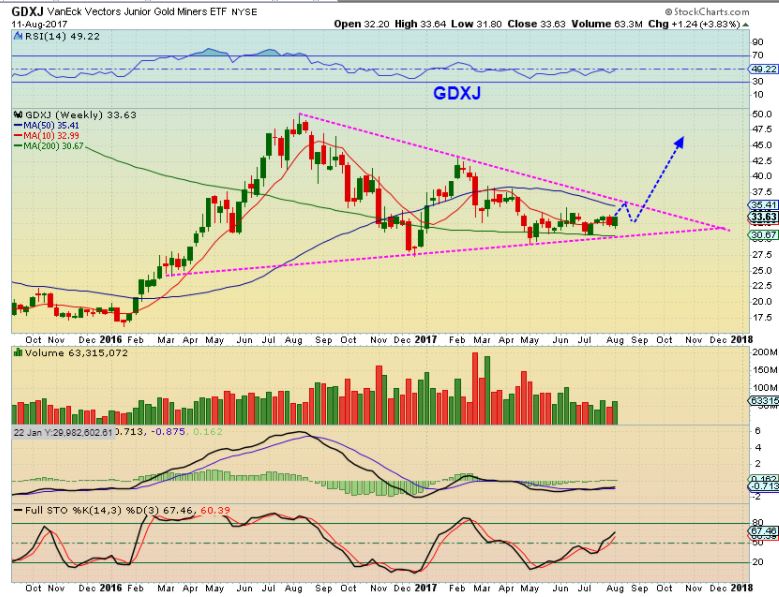
The Larger Triangle.
In yesterdays report I showed ‘Signs Of life’, where I pointed out that with Gold down $10 on Monday, it was encouraging to see different Miners resisting the selling. I want to do that again here. Why? Because this builds confidence in the readers that a bullishness is still in this sector, even with the selling off of Gold this week.
So, with Gold down $10 both Monday & $10 Tuesday, you would expect this to be a dismal start to the week in Miners.
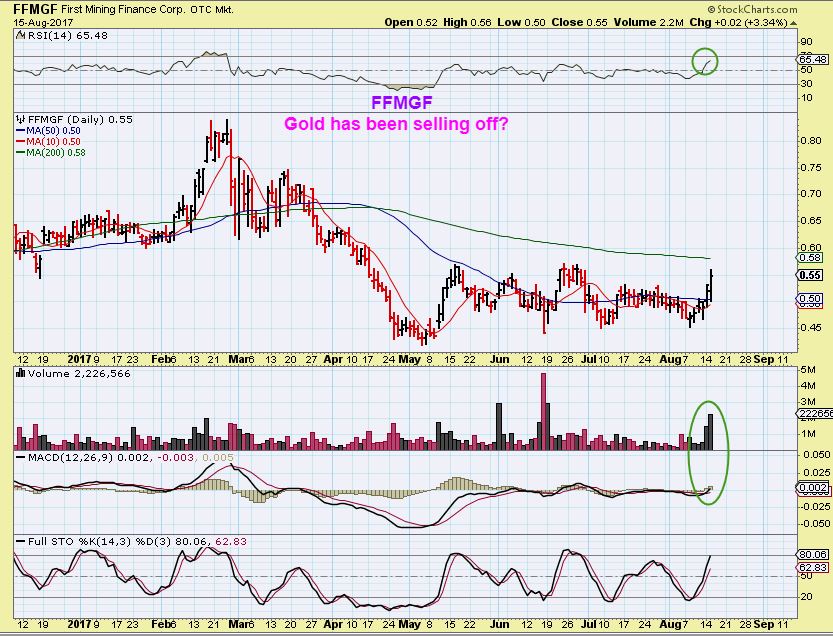
FFMGF – The 3 year chart for FFMGF is bullish and the last couple of days, with Gold selling off, has been bullish too. It seems that the lows are in place as of May, and this consolidation is probably going to break out upside very soon. You could start a position here and add on a drop or a break out above the 200sma.
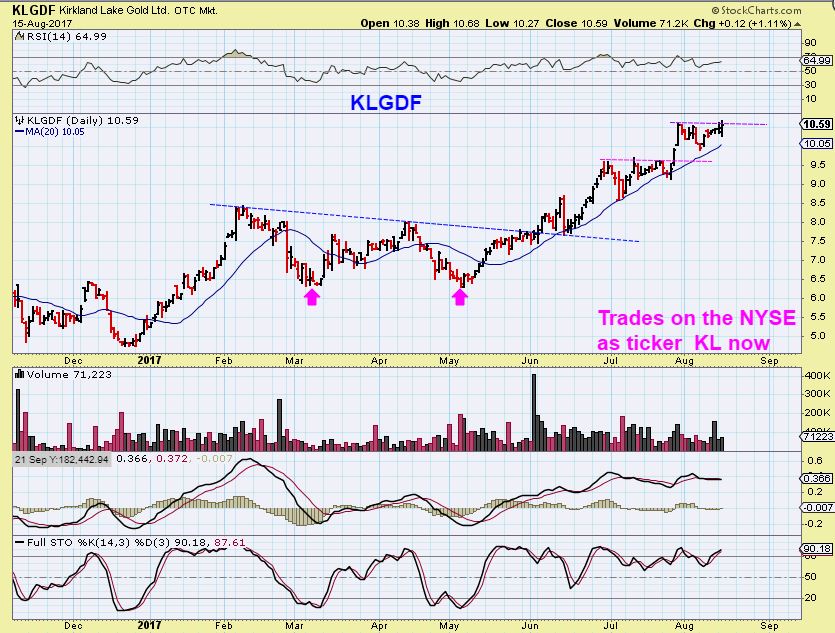
KLGDF – What a gorgeous, Bullish chart since May. This is actually switching to the NYSE today, and I would have to think that that move is Bullish. It exposes this company to investors that cannot buy OTC stocks. Funds and bigger money may keep this uptrend going. The new ticker will be KL.
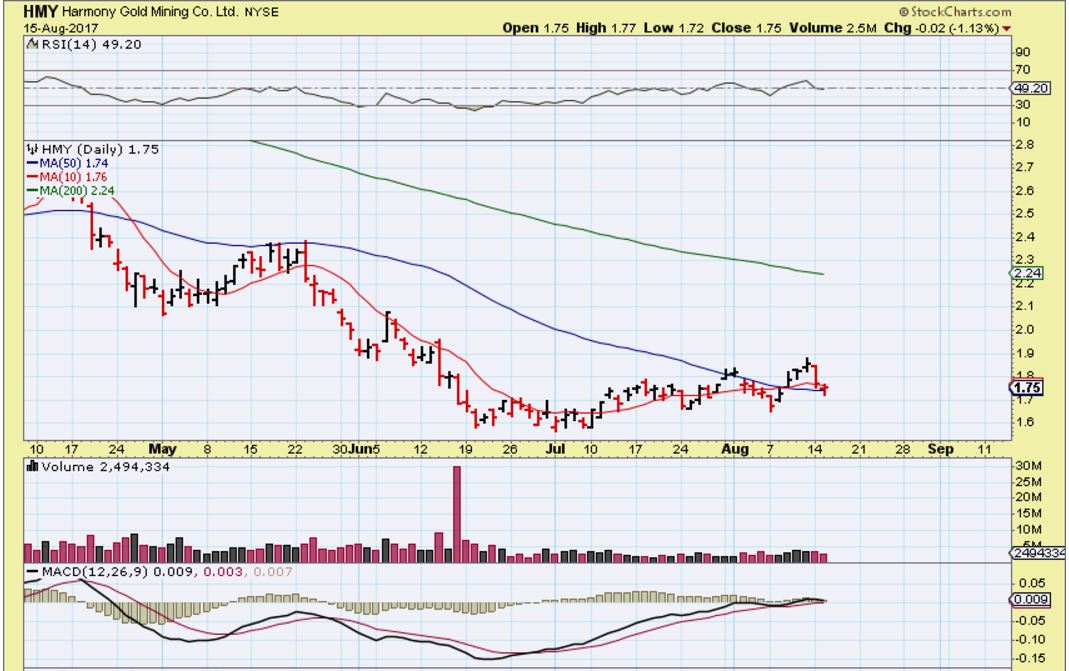
HMY – 2 steady days of selling in Gold did not crush this little miner. It reversed on the 50sma on Tuesday so far.
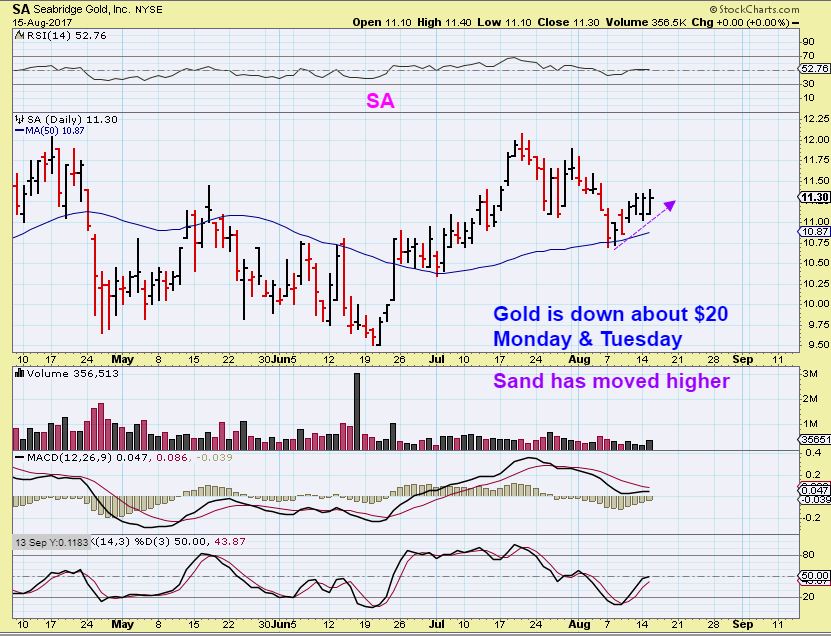
SA – 2 days of selling in Gold and SA has ignored it completely. These are the Miners that may be telling you something. Something like, ” They like me and Smart Money may be accumulating me during Golds sell off“. If these are rising during a Gold $10 drop each day, what will they do when Gold is rising $15 / day?
TRX – I couldn’t find any news, but TRX went higher on Mondays sell off, and also Popped around 18% at one point on Tuesday. Again, Gold was down Monday & Tuesday, so keep your eyes on this when Gold is rising, it might offer a nice ride higher then too.
So we have Fed Minutes today, and maybe we will get a reversal in Gold after seeing it sell off on Monday and Tuesday? Some Miners seem to be ignoring the selling anyway, and that is a positive sign in a rather negative environment. In my opinion, these can be ‘buy’ candidates, or at least positive signs that when the selling is down, we are going to have another leg higher. The Big Picture charts seem to indicate that after breaking from these triangles, Miners may trend higher for months. Good times seem to be just ahead. Enjoy your Wednesday trading.
~ALEX
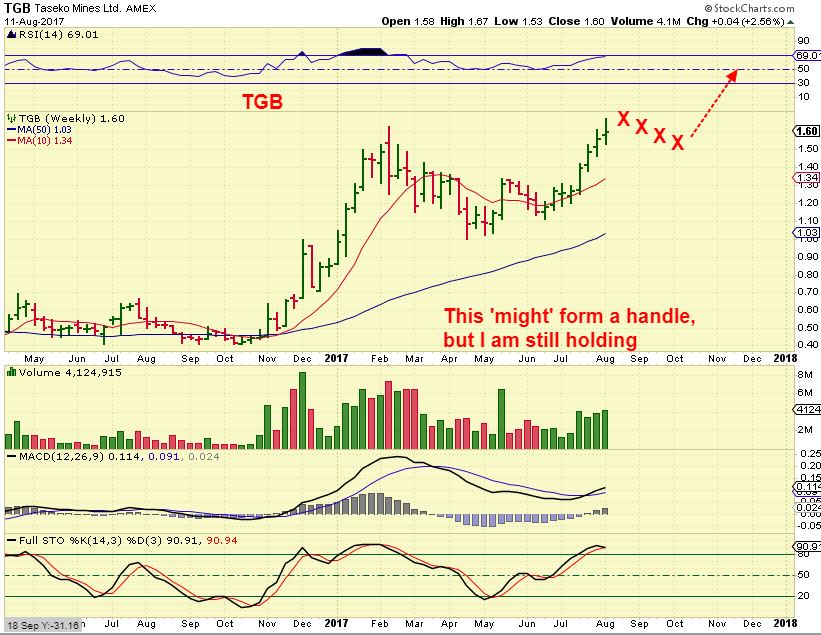
FYI- I still like TGB, and think that it is a very bullish set up, however…
TGB WEEKLY – I drew this for the weekend report, and wanted to point out that it is possible ( Not a guarantee obviously), that TGB could stall and form a handle that dips down here for weeks, before resuming its journey higher. I sold my TGB to collect a nice profit near $1.60. I pictured that it could drop to the $1.35 area. I still love this chart longer term and may re-enter, but for now I wanted to free up some more money for Miners, and lock in profits just in case this goes sideways for a few weeks. ( I am still holing my IPI)
Aug 15th – They’re Back… 
 Give Me A Break!
Scroll to top

thanks for a great report Alex. I’ve owned KL on a Canadian market since March of last year. Buy and hold and forget on that one. Did not know though that it was going NYSE today so that’s helpful. Besides all the great charts and trading ideas, I love the bits of info shared by you and the community here. I know someone mentioned Novo resources the other day (I think Maria), I bought this last month, strictly speculative as I started to hear rumours, and then added twice (again in Canada – NVO.V, in the US it’s OTC NSRPF I believe) and it’s taking a moonshot based on exploration in Australia. Really curious what your thoughts are on a chart that looks like that. Sorry on my phone so I can’t post the chart…
Hey Evan,
Well, that chart is obviously great & euphoric recently, and long term it is probably very bullish. It has been an awesome run for those owning it.
I hate to say it, but charts like that are usually unsustainable. It would be great if it just put on a bull flag and went sideways, but more often than not they run out of buyers when they get too overdone to the upside, and then when people start the profit taking, others start bailing out too, hoping to lock in gains before they shrink away. it can crash down rather quickly, but how far down is unknown.
It is not predictable as to how far it can go higher or when this future drop might happen, so there isnt much more that I can say about it. When I look at that chart, it is one of extreme proportions… I would expect a rather sharp reverse reaction at some time though.
#paypal
😀
Great thanks Alex. It is crazy. There’s a huge dynamic and driving it is the amount of speculation of future finds and it’s hard to tell how much more this is going to run on the well timed news releases and speculation. A couple of analysts are talking that it might be on the same sort of scale as the Wits in South Africa – biggest gold producing region historically apparently. So this one is really hard to figure. I’m up quite a bit on it on it so I’ll be employing a loose trailing stop and keep an eye on it.
If it was a huge position it would be easier to just lock in some gains ( like the original investment since it is up 100’s of %), and then just let the rest ride , set it & forget it. If it is a smaller position, it is much tougher to know how to get optimal returns. best wishes, it is a great trade at this point!
Good point. Thanks much Alex.
TRX, Good morning all. I read ( sorry can’t recall where ) that Jim Sinclair wrote that the Buckreef gold project is not effected by new Tanzanian laws. I took a full position on yesterdays dip.. Sinclair explained the situation very clearly..
Hi Crawdaddy,
Yes, I saw that news on Friday Aug 11th.
http://www.marketwatch.com/story/buckreef-gold-project-not-effected-by-new-laws-in-tanzania-2017-08-11?siteid=bigcharts&dist=bigcharts
TRX has a mighty short position against it and it has grown recently to 24.5 days.
Thanks Deary…
Happy Fed Day all — hoping for a jaw dropper and a raging spike to the upside for us…………….
https://uploads.disquscdn.com/images/6b2568b03495c571cb8dc75c52b58efe8e833d7d929d6c3917616b2bcc63e692.gif
Me too!
Me three! (GDX). 🙂
Should we be worried about Cason? He was supposed to be around all day yesterday, and never posted again, not even at night like he usually does. Cason, you around?
I closed my JNUG with prof, and raised my stop on NUGT with these mins today, you never know
I just added a new chart to the report for those that may not have read it yet, for those that have…the chart is below ( refresh)
https://uploads.disquscdn.com/images/dbb1fdb9588a9977dcdb9c1a8c57980080b022bb706239b7748dfdd35329e3b1.jpg
Whaaaaatttt … holy AG mimicking move from 1/2015 wow…. that looks pretty hot … think it continues????
https://www.tradingview.com/x/o3YvaCJp/
holy, those shake outs always look so bad when in reality it might be just what the dr. ordered
Are you in?
net yet…. it’s one on top of my list tho…i need confirmation b4 i go ….. 😉
pretty cool tho right?
What do you guess your batting average is with the comparison charts?
i dont keep records on those …sorry. I mean how often do measured moves work? – Some folks draw lines for measured moves – i just use the ACTUAL candles and watch in amazement. but, i do watch them because they do keep count of that previous ‘cycle’ / “measured move” if you will, If the pattern is a “1” it “might” equal a “5” move — but not necessarily — so i just watch for curiosity –
presumably we are at the precipice of a “3rd” wave in miners – which are GENERALLY 1.61% of wave 1 .. sooooo that move in AG … SHOULD be much larger -but it does not have to be – it can be shorter and fool everyone — as long as wave 5 is shorter than 3 it will work.
Confusing right … lol that’s why I don’t trust — or presume anything — i just watch … if they fail – i erase it quickly from the magic board in my mind ……. 😉
I dont want to jinx it 15 minutes into the day, but I am seeing a pattern on NAK that could become bullish if it breaks higher ( And it looks like it might). I would love to see NAK move above that 50sma.
niceee …. i like it…. I’ll take nak for 100 please Alex ….
https://www.tradingview.com/x/KulIHudB/
IDXG for a day trade, mentioned on yesterdays comments
Check out OXIS – a reader here emailed me that one, along with MRNS, BLRX, and a few others. NICE WEEKLY CHARTS
I play MRNS regularly lol but Ill check out the others
previous pattern … lol …
https://www.tradingview.com/x/82iVajT7/
HBM, FCX, TANH looking good here
SHLO may be coming off of the bottom now.
CENX clawing its way back.
JRJC & FENG looking good in TECK.
JRJC right off of the 50sma
Alex
….. do you know off the top of your ‘beautiful mind’ regarding the next leg/cycle/impulse …. in general would you say that the same miners that ran fist and fastest will again be the leaders in this next cycle/leg/impulse up??? lets say of the top 15 miners… give me a percentage.
Great question Maria. 🙂
:o)
Why would it change? Earnings………………
oh hello… i thought you would be otherwise engaged today…… 😉
off the top of my mind, I would say not necessarily, but maybe : )
https://uploads.disquscdn.com/images/1d5f6a60c1efe3a6f66af3b719125cb4710bb370e659d27d0267bc3c798c23a8.png
hi Evan / Canadian golddiggers : )
look at Capstone – CS seems to be broken and volume looks to be good so far
Sorry if this is a bit off base. Just curious: Is anyone in our community here into cryptocurrencies? I ask from a chart perspective, I’ve been looking at them since last week. Holy volatility.
I just want to pop in and say that TQQQ looks great. Kudos to those who bot last Friday when I pointed out that it was a “buy” on my 15 min chart. For me, as usual, I waited until Monday to confirm the up trend. As I have posted previously, I always miss buying the “bottom.” I bot heavy on Monday and Tuesday and even added a little more today. I’m very bullish on stocks and QQQ/TQQQ in particular over the medium to long term so I want to ride TQQQ as long as possible. As you have seen recently, those one day slam downs can be hard to handle, but you have to be ready to get back on the horse because the dips don’t last long in this bull market. Sorry I did not post my trades here in real time because I wanted to keep my promise of last week not to post too much in the comments section.
FYI I’m still holding some NUGT, but I scaled way back a couple days ago, currently holding only about 20% of the position I had at the end of last week.
Good trading to all!
Thanks for the update Steve. I think the USdollar DXY looks strong on the hourly chart. Gold and GDX looks to be starting to move to a buy.
FYI … I just saw this on SeekingAlpha.com:
“Risk appetite appears fully back on after a shaky few days as investors plowed $1.48B into the the $50B PowerShares QQQ Trust (NASDAQ:QQQ) yesterday – the fourth-largest daily inflow in the last five years.”
It would make me wonder ….if that was the 4th largest inflow in the last 5 years, why didn’t it really push the QQQ higher yesterday? Distribution?
Good point! I have a tight leash on TQQQ until it proves itself. Also, I don’t know where that number comes from since I don’t show unusual volume on my trading platform for QQQ. It shows yesterday was a below average volume day. Now I wish I had not cut back on my NUGT. LOL!
I think that a close over the over head trend line would be bullish, but I’m actually seeing more consolidation & even possible downside until that happens. A solid break out after the minutes would be encouraging, but there are a couple of things that I dont like about the charts at this point.
1 is the gap
I agree, that’s why I’m keeping a close eye on this. TQQQ could very well roll over and drop again like it did on June 26-27. On the other hand, the gap from July 11-12 never filled (so far). I will bail out around break-even if it does not go my way. Again, I probably should have maintained “radio silence” on here since my posts tend to generate a lot more questions and comments. LOL
Well, maybe it just feels that way? I think that everyones posts generate comments & questions when they are recommending a trade.
It’s just that you notice it more when you are recommending something & people want to know the details of & ask questions. 🙂
I certainly never said anything about your commenting or anyone elses
I just feel “responsible” if I mention TQQQ and people buy it because of my posts, so I am better off keeping quiet and let them follow YOU because you are “The Master.” I don’t want people to lose money base on my trades, so I will go back to my cave. 🙂
I honestly think that they appreciate your posts, because I only usually cover it in the report.
You cover it when you buy, and if someone follows, that is pretty much up to them to decide to do that or not. I would say that everyone here feels responsible for their own trades, and you have even said that in the past.
You’re Fine Steve. And I post trade ideas that get me stopped out too, it is impossible not to run into that from time to time, even in raging bull markets 😉
UPDATE: I have not been happy with TQQQ’s response to the Fed minutes today, I was expecting the up trend to continue. I will watch how it closes, but I may sell and/or stop out of half of my position by EOD. I coulda/shoulda bot the bounce last Friday when I posted my buy signal here so I’d have a lower avg cost, I like to buy BEFORE the gap up like I did last month. My experience is that if TQQQ is going to rally it gets going pretty quick. Trading sideways for a couple days after the big pop on Monday is a warning sign and I’m not willing to take a draw down. As I have posted previously, preservation of capital is very important to me. Avoiding losing money is the key to long term success, I don’t want to ride a losing trade down.
EOD Update: I decided to hold all of my TQQQ overnight. It is still bullish on my daily chart, I would have liked to see a stronger finish to the day, but will hold for now. I have a very tight stop so a gap down tomorrow could hurt, hope it does not break today’s LOD.
AH Update: I decided to sell some of my TQQQ in the AH to lighten up a little bit, since I’m kind of a chicken. That cost me in NUGT today … we’ll see what happens with TQQQ. https://uploads.disquscdn.com/images/5cc31c553b1cec5734b2e3be3b2b6bcfc32a653ca83593cd70da77025e808d31.gif
I agree, internals are getting weaker here, more new lows, less stocks advancing, less stocks above their 50 DAY MA. And we all now about retail, is it really AMZN killing them or is there more. Listen to DKS earnings call. They have pricing pressure, dare to say deflation. Stock was down 20% in one day.
TGB went beast recovery mode
Dang!
Its going STRONG
Thanks Bay…rub it in! Here’s hoping what I put those profits in do as well for me!
if it follows the same pattern as PKX steel, TGB is targeting around 2.30
….. annnd .. if wave 1 = wave 5 … maybe 3ish ….. aye??
https://www.tradingview.com/x/opnq0dQo/
maybe the end point of a wave 5.. buttttttttttttttttttt……….
….i was just looking at HSR on the other side as it dropped
Thanks SOG…will note that down. Do you have your crystal ball out to give an approx. of how far in the future you see that? I am still glad I sold as I wanted my profits so I could make another miner play.
well if symmetry is anything to go by, it took approx 56 days (6 x 8day candles) to impulse down that distance in price, from 2.30 to 1.65… other than that, i aint got no clue 🙂
It will be interesting to watch TGB . I picked up BTG today. [I just shuffled the letters around !]
Read their report and like that it is on schedule to open a new mine October. I did great with them last year,so decided to go again.
It is – I was tempted to jump back in, but for now I am not ( Bit FCX, HBM looked really good this morning, and Copper has been quite bullish).
tentative NAK 4H/daily indicator breakout signs……………… if it holds above 1.42
SOG, I see it, looks good.
https://www.tradingview.com/x/LXI7GFB2/
50sma lurking overhead at 1.46.. would be nice to close above, come eod
Yep – I added when I posted about a bullish pattern that I was seeing early this morning.
weeeeeeee
Go HBM!
Good call on WTIC – CF.
Has Primero Mining declared bankruptcy or something? There was so much promise when they went public a few years ago.
Primero sold off their good assets to MUX the other day, from what I understand.
wow. thanks. I know that Primero has been kicked out of NYSE, or wherever it was.
Delisted….no BK …yet.
Now PPPMF
Glad to see Alex covering FFMGF now too, it´s been kicking butt lately and about to challenge the 200 day MA to the upside again. This one just came out before the big 2016 miner rally and did well then, so it will be interesting to see what it can do next time the miners get into gear.
I have been adding to MUX holdings today, not going crazy but taking in some more for the long haul, 6-10 months hold at least.
I was looking at a junior miner etf to take the place of GDXJ now that it is no longer chock full o juniors, and GOEX caught my eye. If it could go back to the 2011 highs, it would be 7x my money (assuming my monthly chart is right, bc I don´t recall this fund being around back then), but it has volume that would make it difficult to trade in and out of large positions.
I just looked and there are only 9 stocks in GEOX.
GGB may be turning the corner. A close over $3.60, then $3.70 for confirmation. https://uploads.disquscdn.com/images/43ce99abca606f18759a30d87556700a4f67a996aae6f6a721f37192acaeb9fe.png
Nice!
And GDX GDXJ just started to take off before the minutes are released
NAK. Wow.. NUGT up nicely. SOld JNUG too early. Blah
🙂 shhsshh .. we dont want to alert the marketGods…. ha haa
I really like the look of KGC right now too. If Gold runs after the Minutes, this type of set up looks good too.
Trump’s disbanding his economic policy forum may have been the impetus for gold and relate to shoot up.
Or this 🙂 and cycle timing.
I mean, it has run up through July with his economic policy in tact 🙂
https://uploads.disquscdn.com/images/dbb1fdb9588a9977dcdb9c1a8c57980080b022bb706239b7748dfdd35329e3b1.jpg
No cycle timing with triangles!
Miners are in triangles smart alec 🙂 Gold really doesnt appear to be.
.. yeah… really Bill .. hmmmmFF (me standing behind chartfreak sticking out my tongue)
hahah
hahah
I kind of posted that chart below as a joke… like ‘it was in the chart’. I have to say that, because I am a chartfreak 🙂
Your comment could be true too, a catalyst or spark from uncertainty that causes fear , safe haven entry .
Now we have to see how things trade through the final hour too
mann… it would be soooo nice now … to just sit back and enjoy the show ……
Some follow through for a few days and start breaking out of these triangles to the upside would be all I want- the rest could be a bit more buy & hold. 🙂
warming up for one of those days where you get 200 comments – maybe tomorrow?
giggle… bet he’s THRILLED about that idea ….
Good point actually, that usually is the sign of a nice active run higher here 🙂
*or get some work done… giggle
AUY, JNUG, NUGT, IAG – Booooomies (but I sold JNUG too early…) whatevs…
I like it so far. IAG looks very pretty from Big pic to short term consolidation break out.
Even the uglier juniors seem to be responding well. EXK, AG, MUX, FSM moving off of their lows.
This could be what GDXJ needs, some Junior movement. I just hope it continues into the 4 o’clock hr
and through tomorrow 🙂
Can anyone see is KL actually trading on NYSE yet?
Yes. It’s trading.
Me too
Here it is RON, just another bad day kirkland lake.
https://uploads.disquscdn.com/images/b41973ebe76319c2e7b9ca4a8df2a1e91c9ff8efe7e406014fc0301adef1467c.jpg
Thank you
Alex. If we’re not in yet and thew DCL was on day 26. I’m trying to get in to NUGT or JNUG. What would you look for as an entry point? Or do we just have to chase.
It might depend on who you are, for some it is a buy here. We are talking about 3x Etfs, so THIS IS NOT FOR EVERYONE. : ) My disclaimer .
It is a high risk trade, but buying right before a break out of the triangle could also be buying the start of a nice run higher. In other words, it feels like chasing here, but today GDX is moving off of support at the 50sma. If it breaks this triangle, shorts could cover & Buyers seeing that break out may get a BUY signal. The swings in the 3x etf at this point are a bit tough though. If it fails to break out, it could drop sharply
I added yesterday and I even added at $16.90 today pre-minutes. It is now $18. Tomorrow it could be $20- $22 if the triangle breaks out or it could be $15- $16 if it just drops tomorrow into a dcl. . THAT is the risk of 3x etf.
Personally, I am looking at many individual Miners to help me gauge where we might be. I see many Miners breaking out and have put them in the reports to bolster confidence that Miners are acting correctly, even when Gold dropped $10 & $10 …so I went long & Added
GDX CHART RIGHT NOW – My heart is beating like a rabbits – lol
https://uploads.disquscdn.com/images/1ad8509157c65753c44e4cd11628205f200a8507502b69ef83a4bb750dee8350.jpg
Myself also!! I got in this morning in pre-market…come on GDX…breakthrough!!
That candle is the same size as the one on July 26 so I am trying to not get too giddy here
I agree, and cautiousness in this sector is prudent, BUT at the same time…. if we started a new Daily cycle on Golds day 21, it would be something like day 6 . Last time it was probably day 13 or so.
You have a valid point though, waiting for a nice break out can be rewarding too.
I almost bought late yesterday and then again this morning but didn’t. Was away all afternoon (stupid work) so didn’t have another chance to get in yet!
Never too late to get in…glad you checked in…you were on Alex’s MIA list!
I was? That sucks. Ok, I’ll update my charts tonight and circle that entry to be ready for tomorrow!
lol………………….
**and we all know what rabbits do ……………….
…… ha ha ha
hehe
Hide in magicians hats? Eat carrots and taunt Elmer Fudd ? Leave cute tracks in the snow?
.. close but no cigar ………………… https://uploads.disquscdn.com/images/c1cb8680c78fea7637c930edee6ffb276900ac3c0a5edc6d2a2c42b6c657a1e7.png
I know that Maria has a .gif for that…
he’s ALIVE … CF was afraid u went out surfing and got konked in the head w/ the board…
SHHHH … don’t give away secrets
**no he wasnt … I was .. 😉
I have a good load of miners, but I’m not watering down with add on buys here so as to protect if there is a pull-back. Been there done that way too many times. I was thinking of adding to NUGT but instead if it is looking good in the pre-market tomorrow I might take a position in JUNG and then watch it like a hawk
I like that approach sir.
Good plan in my opinion!
Could SA get a good squeeze tomorrow – still showing 17 days to cover
RENN is spunky….
TRX just took off again
Today was the exact anniversary date of the 2007 trend-change occured. We are also in the timing band of completing the 4 year consolidation cycle. I think this current structure has a lot in common with the 2007.
Timing of entries become of less importance early in the cycle since the goldbull makes up for wrong entries fast in the beginning, so worrying about gapfills etc is of less importance 🙂
Now, we need some continuation.
https://uploads.disquscdn.com/images/33bb8440fcd18caed58323a2c3274d8d807863867602206a7cc20a8845dc70f3.png
For people like me who were under-invested in the miners today (after I chickened out and sold most of my NUGT 2 days ago) the good news is that a big UP day like is typically followed by a down day the next day, or at least a quick dip and recovery. Usually price will fall to roughly the middle of the previous day’s candle. Some of you may recall that after the big pop in JNUG on July 26 I posted during the pre-market the next day (July 27) that miners looked like they were dropping and I put in a target buy price near the mid point of the previous day and it hit. So think about that for tomorrow.
Entry! Pullback – That could be a gift tomorrow morning!
Yeah, price has this tendency in many assets. Keeps fear and greed in check 😀
CF – any thoughts on SQQQ and TZA for tomorrow?
Possible- using th QQQ, there is a trend line overhead that rejected QQQ yesterday, that line can be drawn along the bottom of TZA or SQQQ & used as a stop. OR Use the trend line break overhead for QQQ as a stop for TZA SQQQ
Expect UJ to 106.5.
https://www.tradingview.com/chart/USDJPY/YlLAW5kC-UJ-Short-setup/
Copper short setup
https://www.tradingview.com/chart/XCUUSD/iiYWlz25-Copper-short/
Hi Nord, Just so you know, I am bullish on Copper and FCX, HBM, TGB ( Copper stocks) Seem to be set up bullishly too. I just wanted to let you know .
What ticker is that ?
Hoping for some good action today! I’ll be back near the closing bell. Pullback not shaping up yet but it’s still early!
CASON! I was a bit worried about you, nice to see you. I’ll be releasing the report in a few minutes.
The morning report has been released