If you need to know how I feel about Miners, check the reports from the last several weeks, but I will add one more thing to that discussion at the end of this report. 🙂 First let’s do a market review…
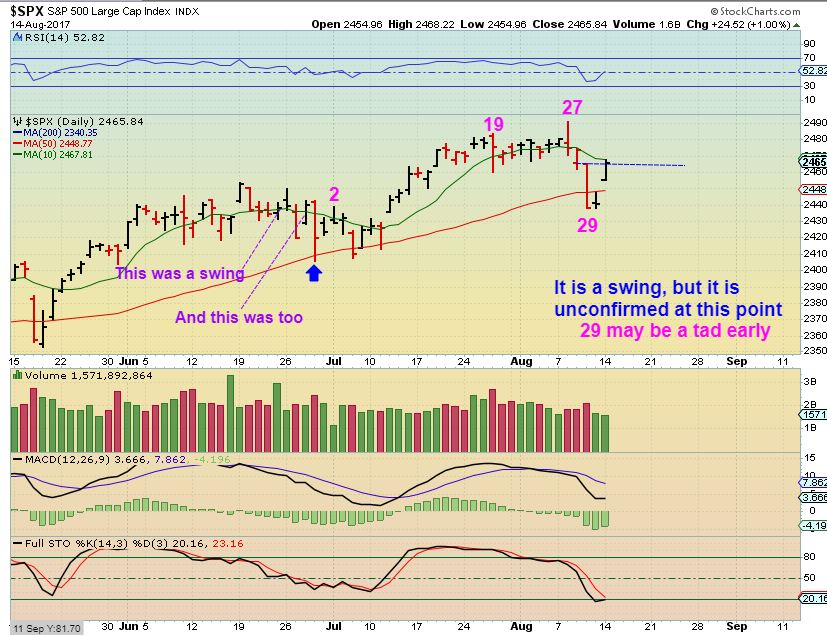
SPX – After breaking below the 50sma as expected, A gap open Monday has put a swing in place, but it is unconfirmed at this point. Another day of follow through may help to clarify this picture. Day 29 is on the early side in the daily cycle count, so let’s see what Tuesday brings. See the chart and we’ll look at the NASDAQ.
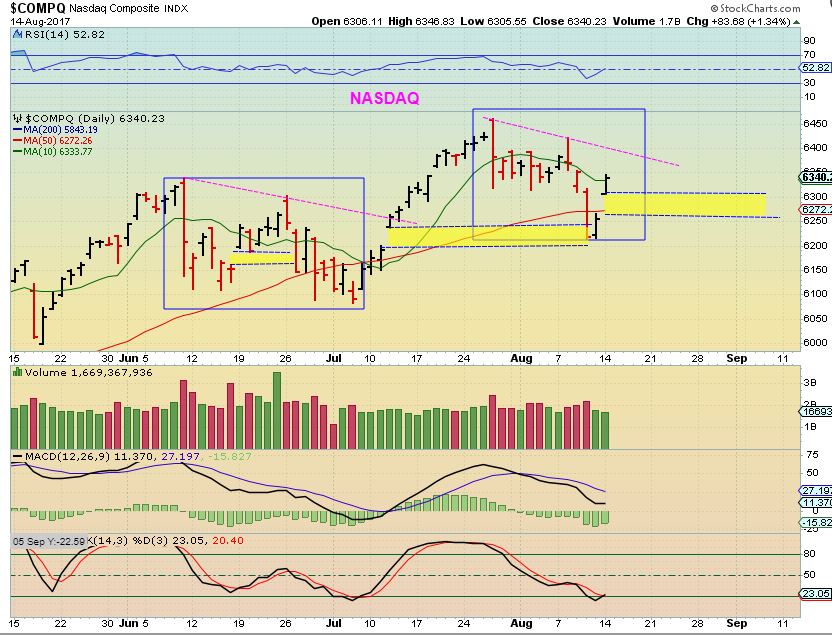
NASDAQ – I’m re-posting the Aug 1st chart to point out that back then I expected a drop to the 50sma area at least from what looked like a bear flag. In June when price dropped to the 50sma, it lagged in that area for a while.
NASDAQ – So now the NASDAQ has dropped below the 50sma and quickly put in a reversal Friday. Then we saw a strong Gap open on Monday that re-gained the 10sma. It could be a dcl as mentioned above with the SPX, but the timing seems early, so I am personally not taking the trade. Follow through higher Tuesday could indicate that an early DCL was put in with a break of the overhead trend line. I feel as though we will see sideways chop, but lets allow the market to explain this one on Tuesday.
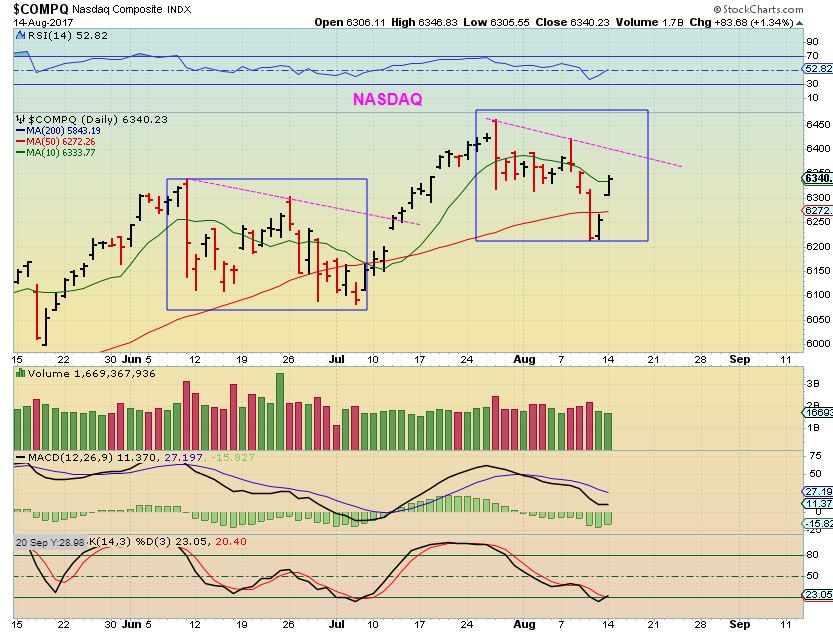
NASDAQ side point – In the June drop & July recovery, those gaps have filled and now we have another left behind.
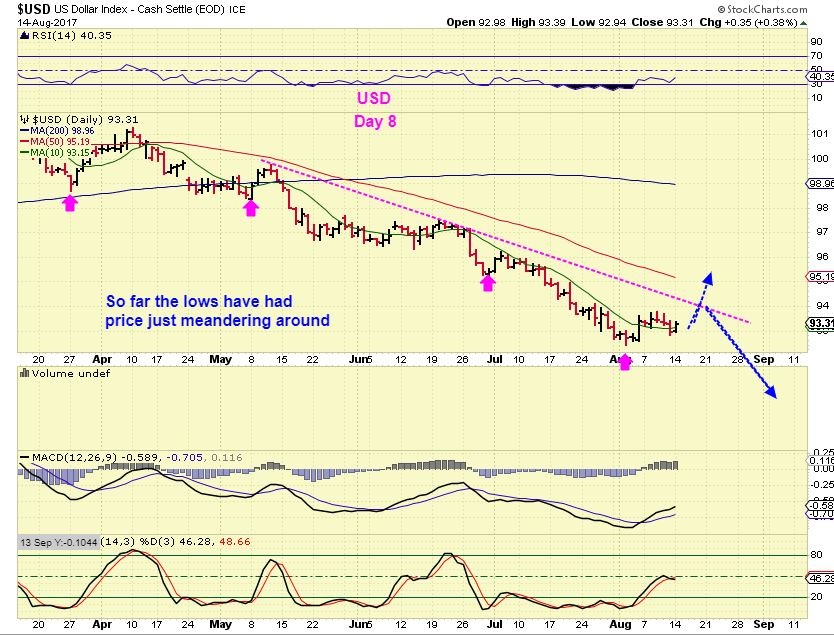
USD – Each low for the USD has been unable to get the follow though higher, they have basically meandered sideways. If this was an ICL, I would expect a stronger push higher soon. If it continues sideways, it threatens to drop again.
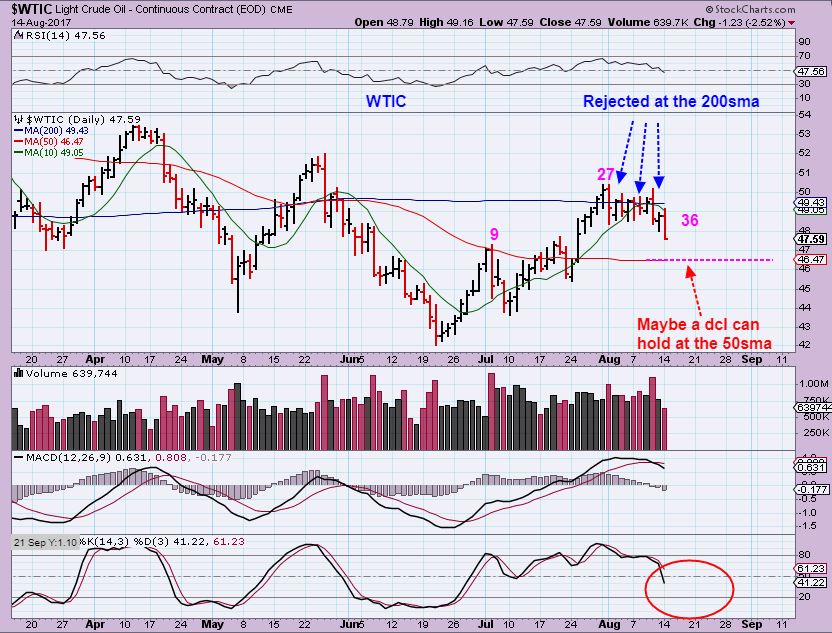
WTIC – OIL peaked on day 27 and looks to be dropping into a dcl. There is support possible at the 50 sma and if it holds in that area, this would likely be a right translated daily cycle.
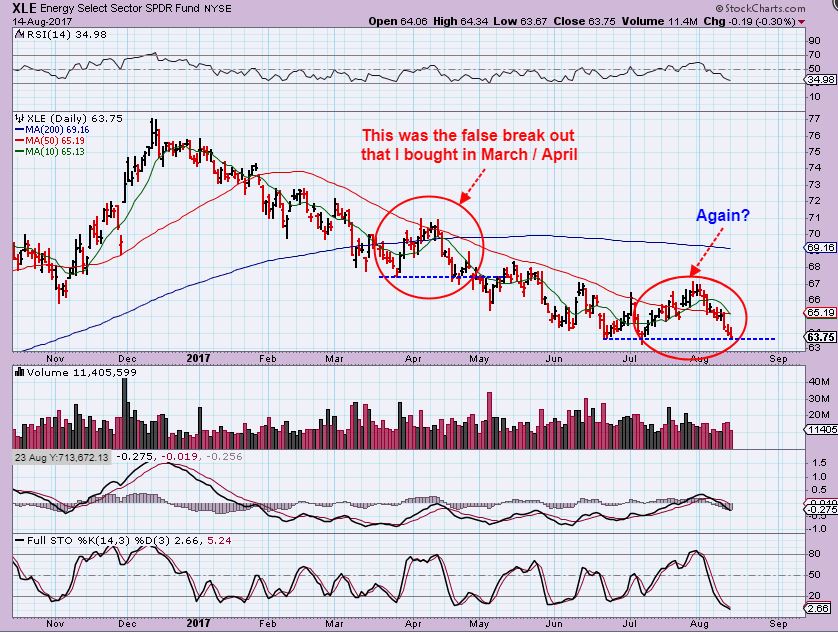
XLE – The XLE gave us a false break out in March & April that I bought and got stopped out of. In July it broke out convincingly again, but I have not bought into this sector again yet. Suddenly it broke down again last week. Many stocks did look promising, but now we see the XLE in a double bottom area, threatening to break down again unless it bounces immediately. If Oil drops further, I dont know how this will hold up.
GOLD & MINERS
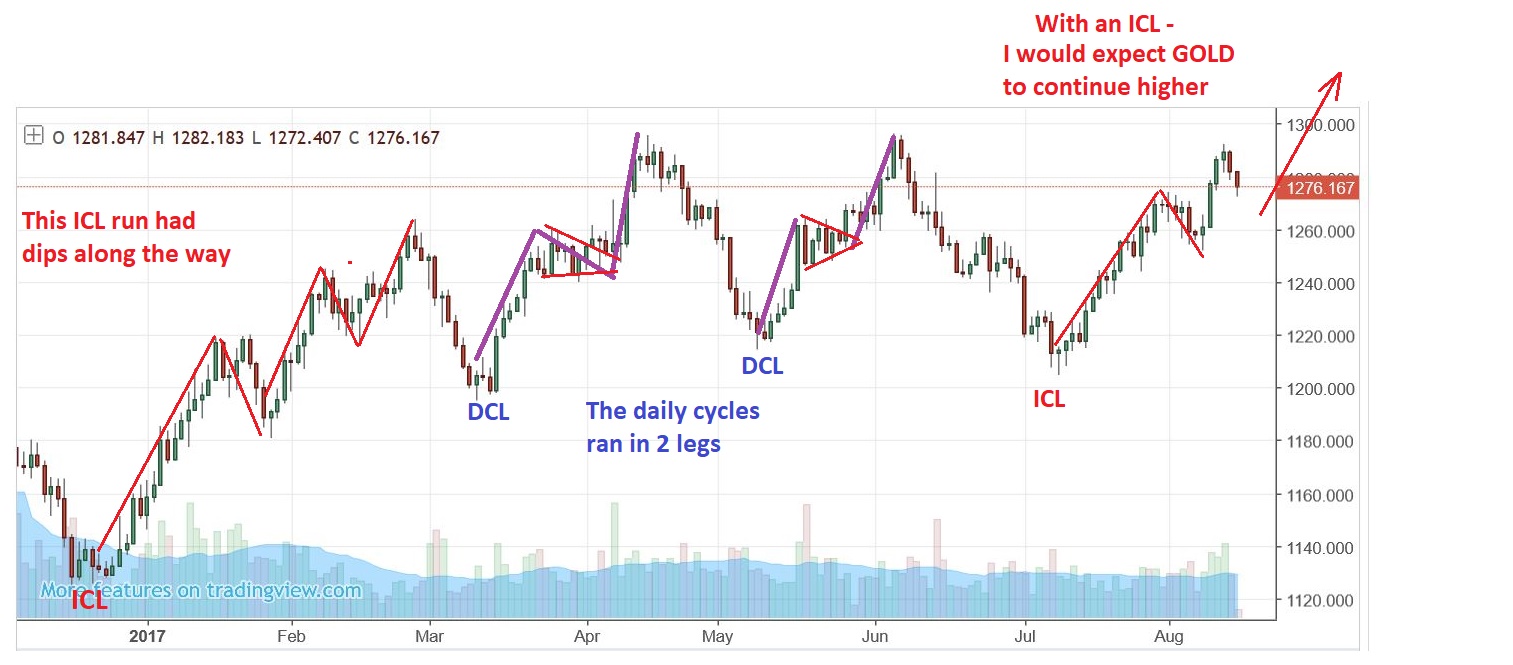
GOLD – From the weekend report, obviously this is a bullish chart. Notice that the run out of the ICL in Dec 2016 was longer than the other 2 daily cycles, and it had multiple pullbacks. The other daily cycles were basically 2 legs higher like a-b-c’s.
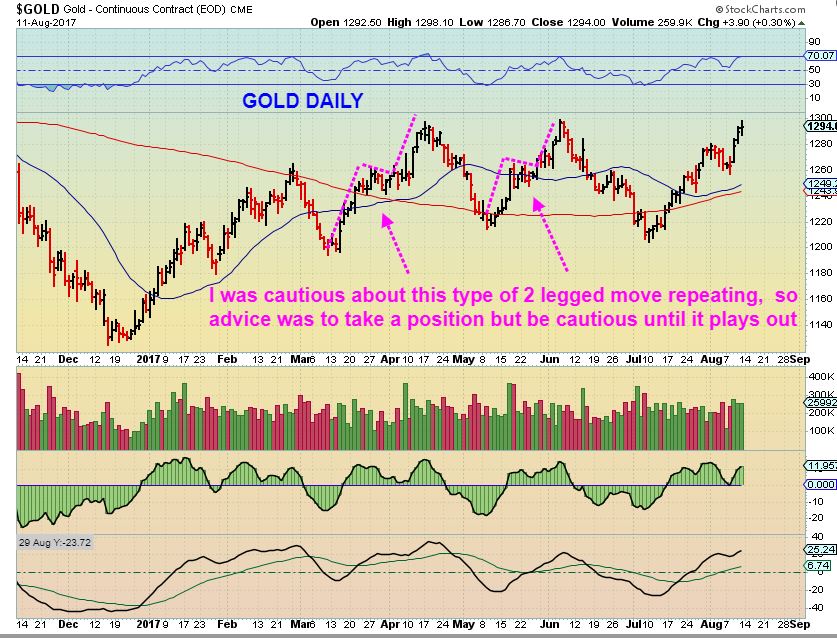
GOLD MONDAY – Again, You can see that the ICL run from Dec to March had a few pullbacks along the way, so that is likely what we are seeing now. I wondered if this would be another 2 legged daily cycle and then a drop into the DCL, but I believe that this could just run higher in a similar manner that the run out of the Dec ICL played out. We would see small dips along the way. A rally in the USD does seem to indicate that this would drop further.
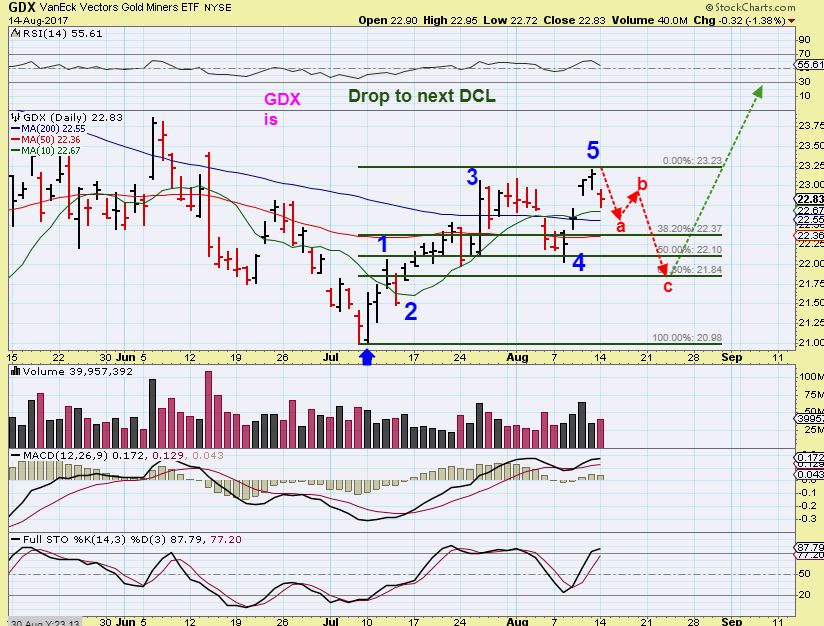
GDX from the weekend report– Last Tuesday saw a reversal at the 50sma, and then GDX gapped higher on Wednesday to put in a swing. We had another gap after that, so it is not unlikely that we would see a pullback to fill that gap and maybe even back test the break out. I pictured the 50sma holding as support if the DCL is in place. A break down below last weeks low would indicate that we still have work to do. My stop for GDX is below $22.
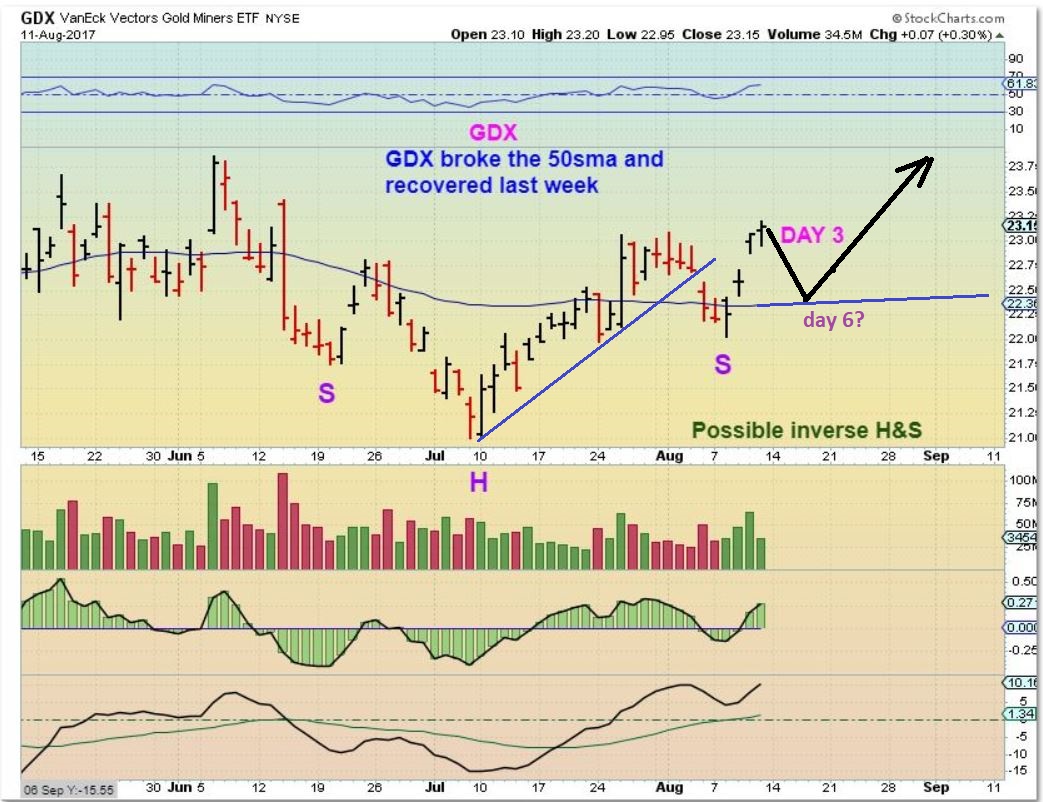
GDX CHART #1 – GDX dropped on Monday and so far it has not damaged the chart. It filled the gap and is still above support of the 50 & 200sma. Did you notice the quick 1 day dip in July out of the lows on day 3? It is not abnormal to see a quick drop at the start of a new daily cycle.
GDX CHART #2 –
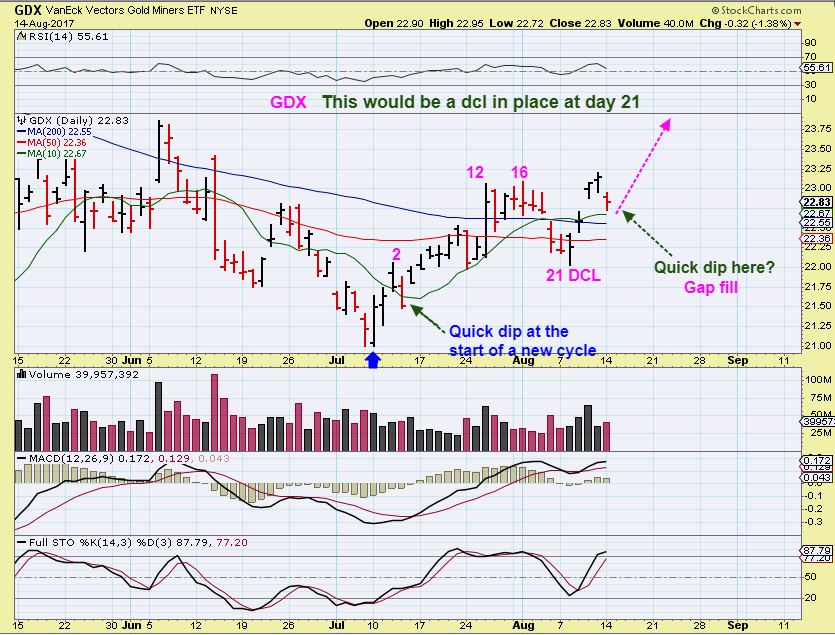
So the question is: was day 21 an early DCL? It is possible, but even if it isn’t a dcl, the set up is bullish either way. Let me explain. IF day 21 was NOT a dcl, Friday would have been a new high on day 24. That is bullish , but we would still have a dcl ahead around day 30 or so. Please read the chart.
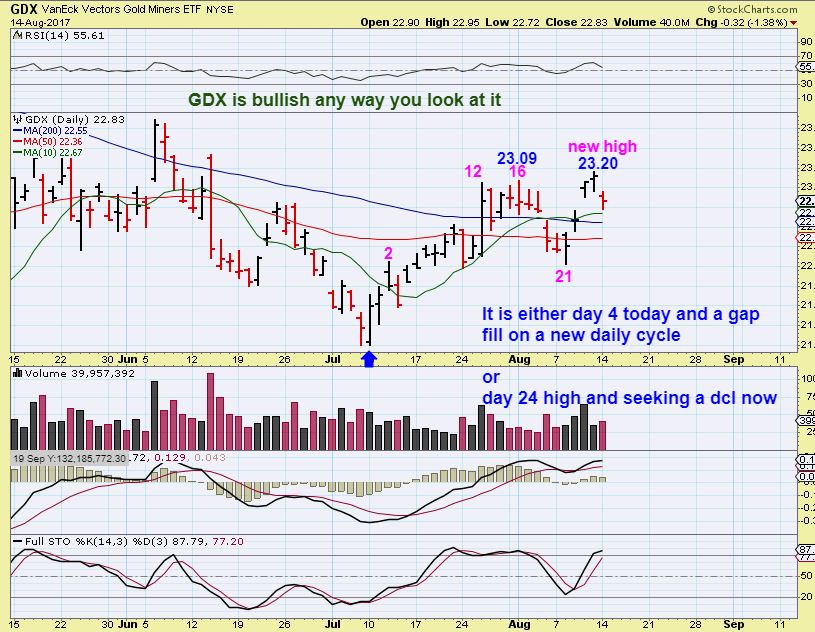
GDX CHART #3 – IF a DCL still lies ahead, we would have a peak on day 24 ( At 5) and then it could drop like this, breaking below 4 by day 30 or so. That low would be a strong buy. It may be too tricky to start a leveraged position for many unless that happens, but positions in a few individual Miners on this pull back could be entered, if you aren’t holding anything yet. I have pointed out a few Miners in past reports ( RGLD, IAG, FNV, etc).
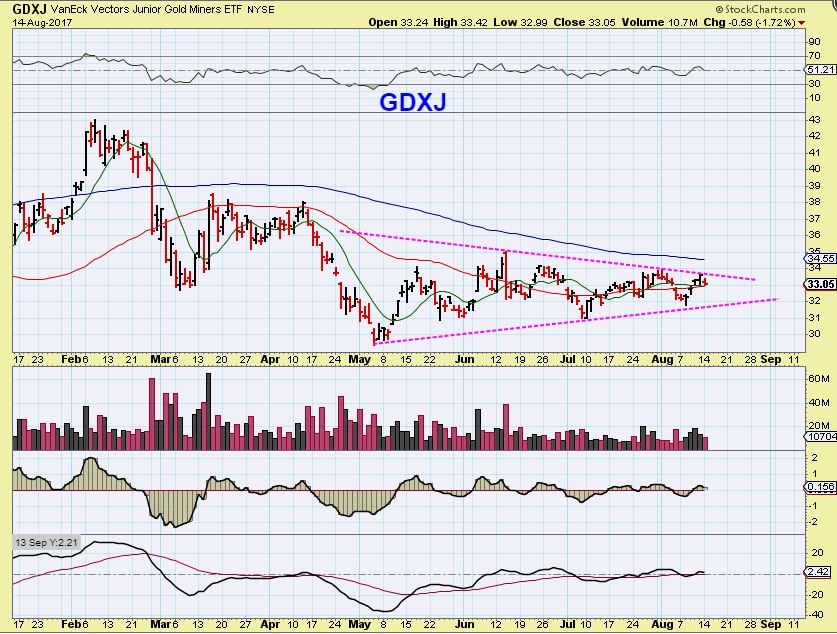
GDXJ – GDXJ is a long sideways triangle and I feel that this is going to break out & run higher very nicely when the time finally comes. 3 months sideways builds up steam, yet I hear many saying that GDXJ will not move higher with Gold now that a re balancing has taken place. I am betting that it does.
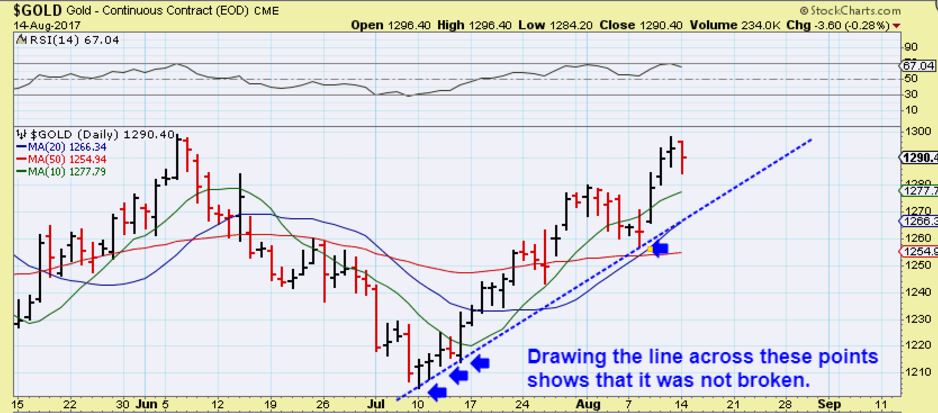
You can re-read the weekend report and Monday mornings report to refresh yourself of my overall thinking in this sector too. I still think that it is a tough call as to whether or not a DCL was just put in place, or just a minor dip. We should have a trend line break in Gold for a dcl to come about, and it is tough to say whether we had that or not. Notice the following 2 charts…
The trend line can be placed in 2 different areas. I drew this to show that it could have been broken on Aug 9th.
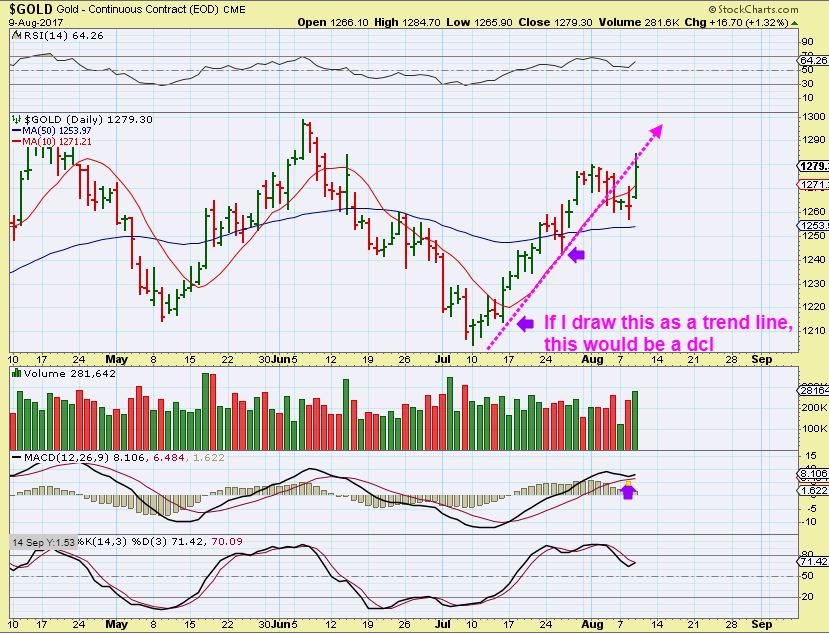
HOWEVER, if I draw the line along the first 5 days, it does not appear to have been broken, and a DCL would still be ahead with a break of this line. That makes it a bit tricky, but bullish both ways.
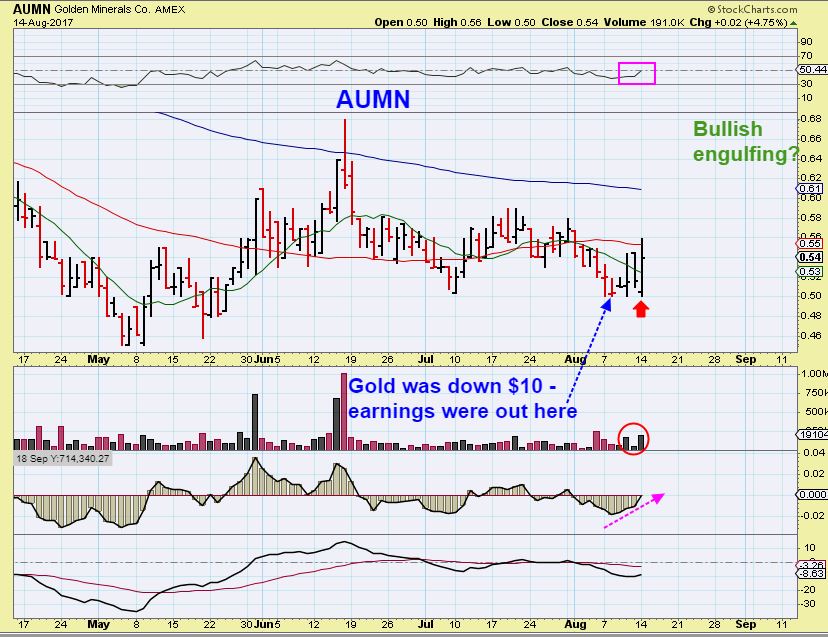
SIGNS OF LIFE – ENCOURAGING
GOLD was down $10 Monday and AUMN looks to have put in a bullish engulfing. Isn’t that impressive? It indicates that even these Juniors may be starting to get the ‘surprises to the upside’ that a bull market enjoys.
GORO – This also moved higher while Gold sold off $10. I am not saying that this is a buy here, I am saying that it is encouraging to see ‘surprises to the upside’ while Gold sells off.
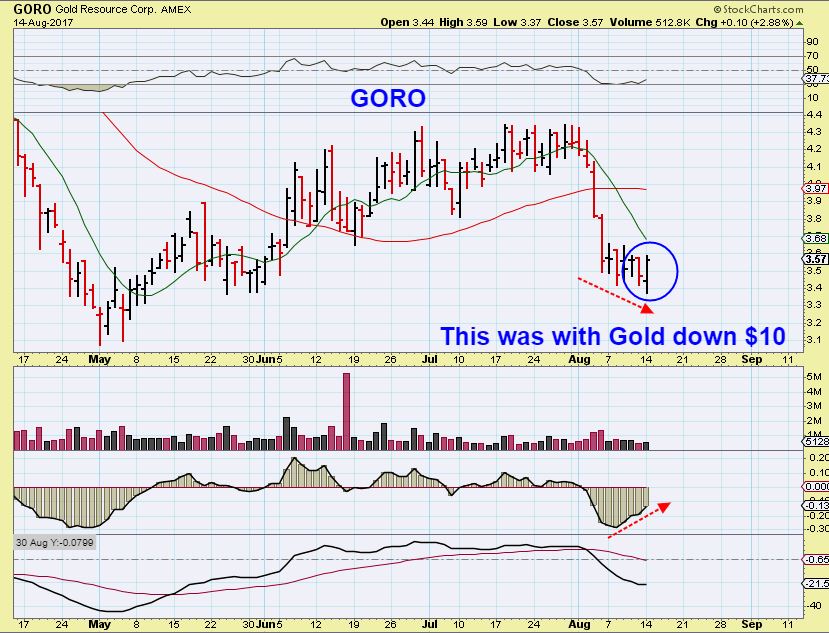
The 2 Junior Miners above may be indicating that GDXJ will begin to perform as expected in a Bull market after it breaks from the triangle, especially now that earnings are mostly behind us. Currently we are still dealing with the triangles and a possible run higher in the USD, but this is 1 more vote of confidence for buying the dips now that the ICL is behind us.
Enjoy your Tuesday trading day
~ALEX
Monday Morning Coffee 
 Wednesday Aug 16 – Progress
Scroll to top

It still looks like the DCL is ahead to me, but either way once we know for sure where we are the next run should be great! Also, if gold fall a little more today we could break the up trend line.
There is a small open gap at the $1260 area, above the 50sma. I’d like to see a tag of the 50sma area and fill that gap, break the trend line, etc.
On what day is that gap? I’m not seeing a gap. Probably bad eyesight.
Refresh: You’re probably using candlestick, and they only show gaps where price never traded, but to me, a gap can also be when price gaps open from the prior days close and does not trade in that area again.
So some do not call this a gap, but I have seen them back fill too.
https://uploads.disquscdn.com/images/c5804a4ea9c4b3dd8d7916a2a8e2725e1f0317f93b6f9827b295f28d6cf1c4d4.jpg
Thanks for the lesson. I hadn’t hear that.
Yep! This is exactly why I was only scaling in with a starter position and no leverage yesterday. When get a more clear, strong DCL in the charts in the next few days and I get a lower risk add. So for now, have a little skin in the game but positions are small so not to get damaged if we pullback first, which for now is the case!
Why you’re up early lol!
Surprise! I’m on the East Coast for business this week. Rise n’ Shine!
This must be a misprint, does anyone else see URA up $1 in pre-market?
That would be a huge gap.
And check out EXTR. Up nicely yesterday and up another $1 in pre-market
yes on one trade of 300 shares
I have it showing at 4:45 last night and no action in the other Uranium.
URA has a tiny Short Interest of 3.10 compared to some of the others
LOL- Probably tried to buy at $13.40 & put in $14.30. OOOPS!
i got it showing at 14.30 also
yeah… i *liked that chart… ;o)
quite a few trades in GDX and now it is down about 1.5%, GDXJ down about the same and GLD down about .88%
But that looks like a bear flag on the futures at 1273 down 1.3%, so maybe this has more to go.
The USD futures bear flagged and is moving higher.
Surprise! Guess who’s avail during regular trading hours? This guy!
https://uploads.disquscdn.com/images/ae39e5e89a421f5978f8f21d6c6b9e83f75ea7c4d9318e6e202c4a7c76e5ae5f.png
Like the shirt!
LOL this pic made my morning man
LOL
CGIX is down big .. down by 12%
Earnings was yesterday. They bought a company for 12 Million.
TRX, THM, AUMN….. hmmmmmmmmmmm innnterressssting…
volatile or what?.. TRX which i got stopped out of, was up +15%
THM which I bot instead, is now down 7.5%
c’est la vie
LoL.. and now wtf… TRX back down to 2.5%, and THM only -1.8%
I feel like I hit home runs and then get hit with so many strike outs on small plays that Im never going anywhere lol
i definitely hear yah…………… Bay ….
was never a home run hitter per say…. more of a line drive up the shoot … kinda gal .. ;o) ..but i also feel like ive his some silly little dribble grounders and pop flies these past few months…. can’t seem to bring my batting avg back up to where it was in February… ahhhhh … beautiful February… grrrr .. giggle …;o)
…. no fear… it’s getting to be that time again to make that pitcher DANCE !!!!! & JUMP ‘out the way’ ………… ;o)
yea… Last year and feb this year were glorious… Im catching the big runners during the day
but my swings (ie. NUGT) and others) are killing me, smalls
hahahah … you play balllll like a GIRLLLLLLLLLLLLL ……
Baby Ruthie
…the king of crash …. the sultan of swat……….
i took a starter position at $3.40 also Alex hope you remember i asked you about VJET sometime back today down by 11% took a starter position.
Are you saying that you took both positions today on the slam down?
Yes… looking for bounce.
goro is getting lots of support
Sold all of my TGB for now. Great profit, and I dont like the short term chart
I still love the long term chart
Thanks, Alex.
what about WRN? same copper play. Earlier missed when it was around 1.07
Today it dropped down toward the 50sma and then reversed higher again. That may be as low as it goes, it is hard to know when it is consolidating recent gains.
thanks Alex. Just want to build a starter position… and accumulate further drop if any
Wow, What happened to TGB after I sold? I was looking at it on a daily chart and saw the MACD about to cross down ( it was on the hrly) and I figured that this could eventually drop to the 50sma, and I would re-add there.
Now it just dropped 10 % after I sold.
I was really glad you posted…I sold too at 2 different prices [no I did NOT create that whole effect!]…but glad to take that long term profit. Thanks for the heads up. Could find no news.
I was looking at it this weekend and it is overbought, so I started thinking that it might build a handle and form sort of a cup & handle. I was deciding whether or not to sell or just hold through that process, but it could take weeks, so I will look to re-enter later if it drops further.
I even drew up this chart for Mondays report ( just an educated guess / possibility ) and never posted it, when I decided not to sell.
https://uploads.disquscdn.com/images/5d797efe3614e1dae625a2df2048446856e7a2ce4ca82c7011fffdf5325ccd5f.jpg
Keep us posted as to when it looks good for another ride please, though I bought that back in 2016 so I don’t know if it would be as good a play as picking some beaten down miner ready to go up.
OK, but just as a heads up on what I am watching…
I was actually thinking of selling at $1.60 and re-entering if it got to $1.35 ish , which is down at the 50sma on a daily chart. I drew that handle on the weekly kind of based on that too, the 10 ma on a weekly chart.
WIth todays drop, it MIGHT just go sideways and allow the 50sma to catch up, so an entry may be a tag of the 50sma wherever that is at the time. As the 50sma rises, it may be $1.40 or so too. We’ll see how it goes.
Thanks…I will watch, but probably will get an itchy finger to buy something else that looks more exciting and promising.
Got filled on an old starter size order that I forgot about with NUGT (brought my avg way down.) 3020 fill.. Overall down a tad
TRX heads up SI = 19.25. I can’t place the order electronically with TD so I am not playing.
Edit: And now just came right back in.
IPI still looking good
CF -U broke TGB
yeah.. by the time his cool mill shares go thru…. whatya expect… u no how he does…
*and moneybagsNancy .. oops i mean.. NancyTheArtist … ;o)
Yeah, It was Nancy – she sold her million shares 🙂
I WISH! ….[ But it was a good trade.] 🙂
Nancy did it 🙂
https://uploads.disquscdn.com/images/65beada9069bb3d480267bcb73dee9cde659650319b1f67ca9e5c982a7286319.gif
man.. he looks like he needs a dr. … breathing pretty hard…
That’s how I felt when my order finally went through! LOL
SA doesn’t care too much about the Gold pull back this week.
that’s becuz i stopped out last week… or so….
Maybe you should stop back in for a visit.
PAAS – Bull flag?
very nice…. i was looking at GRNH… i like PAAS better…
that 200day running to the rescue to provide a comfy seat… … so hot
HOS – still acting well after earnings, despite being energy
ur freekn me out chartboy…stop it now…
i was jusssssssssst looking at that and marveling how similar price is moving compared to the ‘flip’ of the leg down….
i originally thought it could run to the 200 … butt …………..
https://www.tradingview.com/x/yJF5LBIu/
kl.to breaking out today
they are going to be listed in NY tomorrow, so more exposure to them and probably people want to load up on a very good pm stocks
Marinho where did you see that info? I see it now on their website, but wonder if it is widely know.
I own it and TDAmeritrade shows news for all the symbols in my portfolio. I am sure lots of people know about it and plan to own it for more exposure than the OTC market.
This also came out Aug 11, good article. And SPROTT was buying too. ( Didnt you just ask me this yesterday – lol). Apparently, the shares trading as KLGDF will become shares on the NYSE
http://www.marketwatch.com/story/kirkland-lake-gold-to-list-common-shares-on-new-york-stock-exchange-2017-08-11?siteid=bigcharts&dist=bigcharts
yep I asked about this one a couple of times as I have not been on board a stock when it moves to the big board and was wondering what to expect.
I would expect it to get better exposure, especially for the fact that some institutional buyers or Fund will not buy an OTC stock.
I’m wondering if the are keeping the price the same, I didnt read of a split, so I would expect that they will.
Finally even on NUGT lol
Didn’t you sell HLX and then say ” Can I cry?” When it ran away?
Well, it broke the 50sma and recovered and I think it is back in the area where you sold it, JUST IN CASE you are interested. IT has done that break out & back test at the 50sma 🙂
I need to see better action in energy before I do much buying there personally.
LOL yes – thats me. Should be my name. Sellstofastrader
Well, in the long run, if you held it, you’d have the same funds.
I was thinking that it came back to get you
…. ha ha… well, that’s better than pre…
*nevermind
bahahah- u just made my tuesday a dfriday
seems like we have hammers in xle xop oih psce
bottom ?
I can’t believe that TGB is almost back to where I sold it, after a 10 % drop.
its a little monster – oh and remind me to stop taking starters on top of starters in JNUG and NUGT – thanks lol
If you are pretty much break even on your NUGT position, I wont tell you to stop adding to a starter.
As a collector, It might turn out to be worth something someday 🙂
My avg on NUGT is now 30.75 (Not too bad) and $JNUG avg 16.78 (again, not too bad) – Not large positions by any means.. and luckily I have a few more free trades to burn up… Just wish they’d kick it into gear already and move… UP
not too fast…. that’s gonna be me running my littleA$$ off to jump on that jnug train… giggle….
https://uploads.disquscdn.com/images/049f9d4362e5af990a2734a1b4ea4f4792ffbe608ab91c730f68c5906507abf7.jpg
lol yea. yea…. I just hate AVG down in my positions… I thought I had good entry in the mid 31s and mid 17s…
IDXG tomorrow
Great volume & everything
boooo hoooo….not really, still happy I took the profit.
I still didn’t see any news on TRX, but it is ignoring the sell off in Gold.
URBN spiking on ER
Cason said he’d be with us all day, and never came back?
That Jet Lag is a killer!
lol
A fellow insomniac? Welcome 🙂
You know it… Hey, are FOMC minutes tomorrow?
Yes sir, I believe that they are. I’m hoping for a Gold reversal with the minutes, wouldnt that be kind of the markets for a change 🙂
Yea.. I’d love for that to be the case..
Wait a minute- I just looked it up and saw Thursday August 17. Thats odd
Correction, Wednesday Aug 16. Whew.
WEDNESDAYS REPORT HAS BEEN RELEASED