FED WEDNESDAY JULY 26- Don’t Count Your…
Well, it doesn’t hurt to look for clues and be prepared, right? We will do that today…
Starting with OIL
WTIC – Oil looked Bullish last week after the inventory report, closing over the 50sma for 2 days. Then on Friday we saw it get slapped down. I drew that trend line as a needed support. 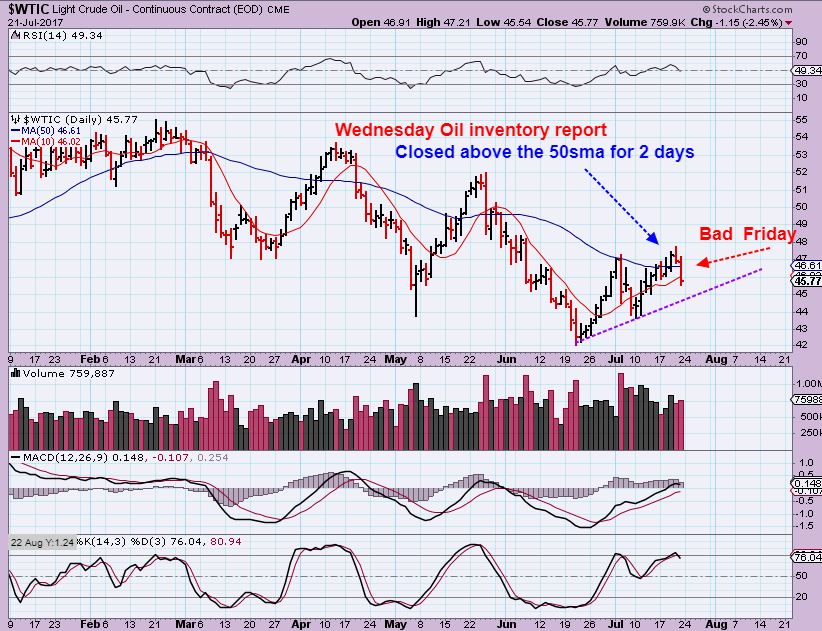
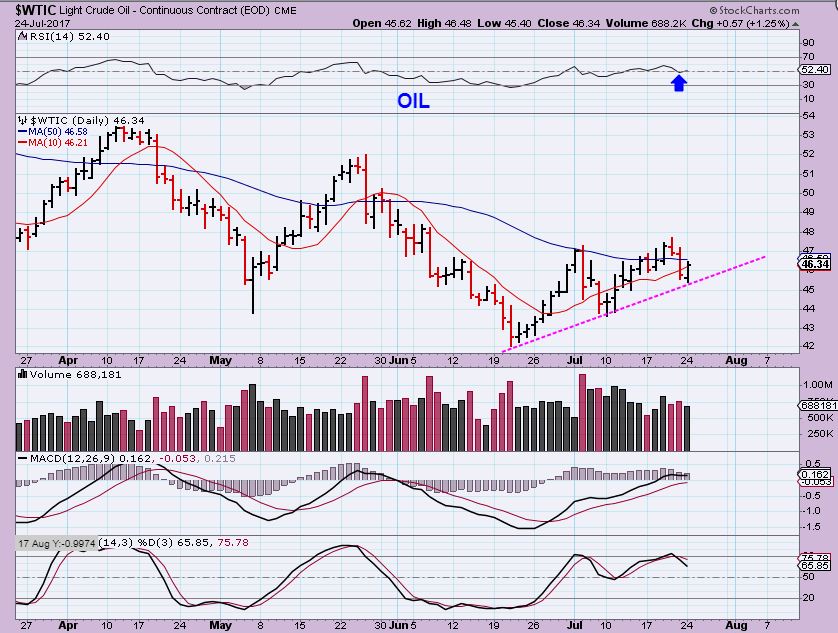
WTIC – Oil reversed on that trend line and looked bullish again.
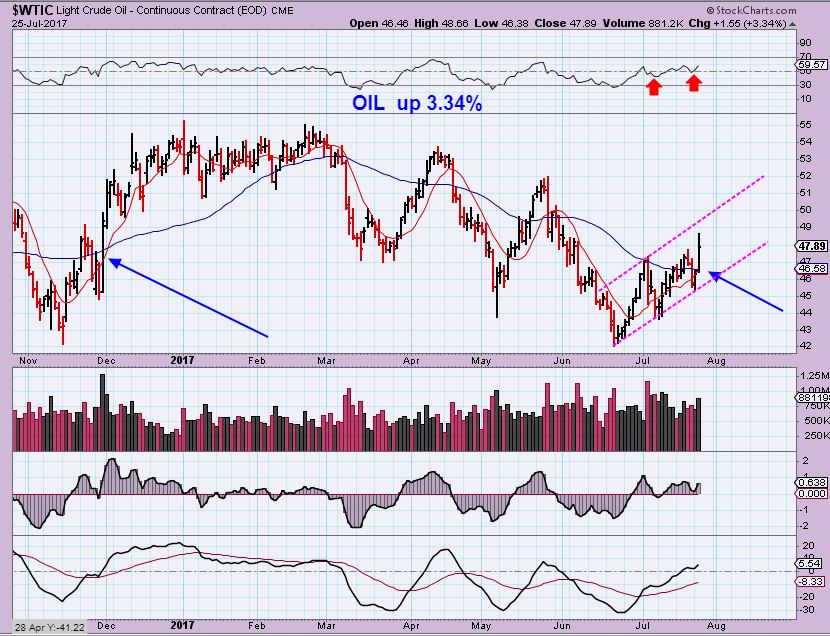
WTIC – Tuesday we saw Oil jump up over 3% , regaining that 50sma easily. This chart is Bullish and in the weekend report I will mention just how bullish this could get. For now I was a bit concerned about Oil/Energy stocks struggling at the 50sma too ( CLE, OIH) .
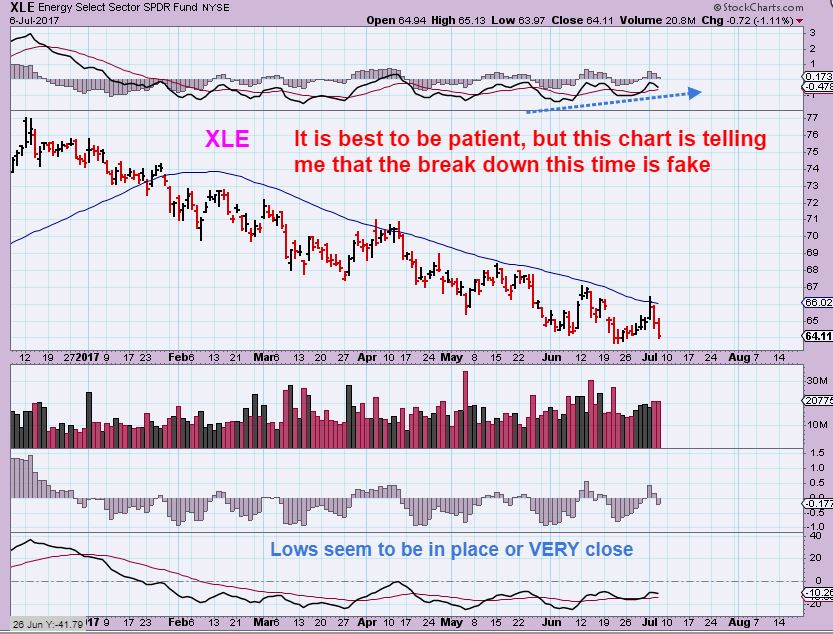
XLE on JULY 6th. This chart that I used with my special indicators was telling me that the lows were possibly being put in place, even as it dropped 2 sharp days in a row. PATIENCE was recommended, because bottoming can take time, become choppy, and frustrating. For example, to be safe, I wanted to see the XLE above the 50sma for starters. Please see the chart.
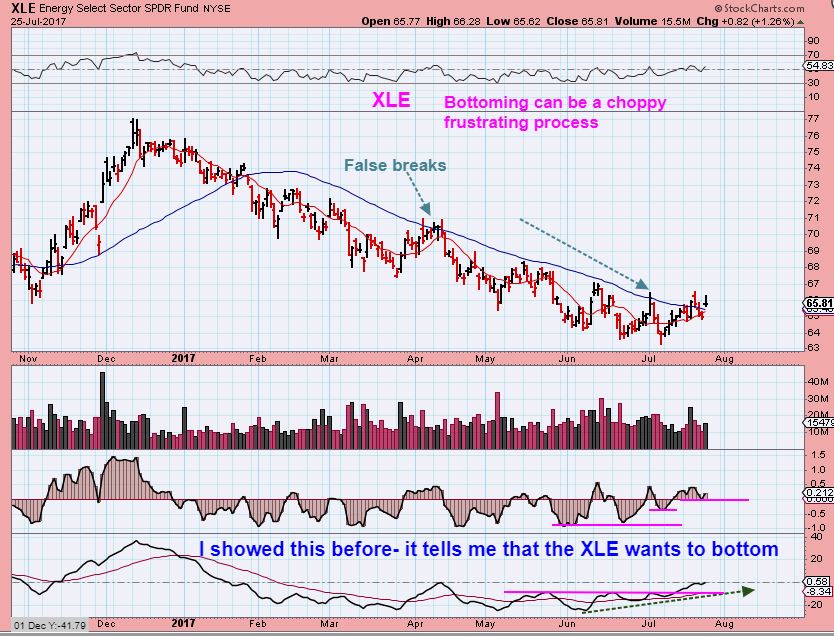
XLE – The next day the low was in place with an immediate breakdown & reversal. Now we see the XLE is battling back above the 50sma, so Oil & Energy stocks could be bottoming.
Along with the companies that I have repeatedly mentioned as seemingly bottoming ( RES, ERF, AREX, SPN, etc) I am now looking for other clues. Other companies that will start shaping up and look as though they have bottomed.
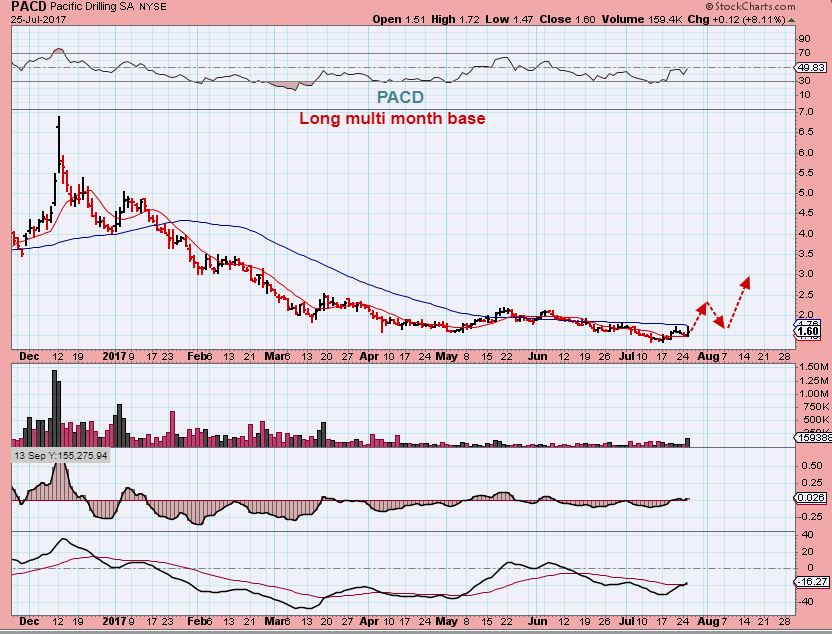
PACD – A nice long base and a 9% pop on Tuesday, PACD is repeatedly bouncing off of the 50sma. This may do quite well when it finally breaks free. AT $1.50 , a run to $3 on this chart is a 100% move.
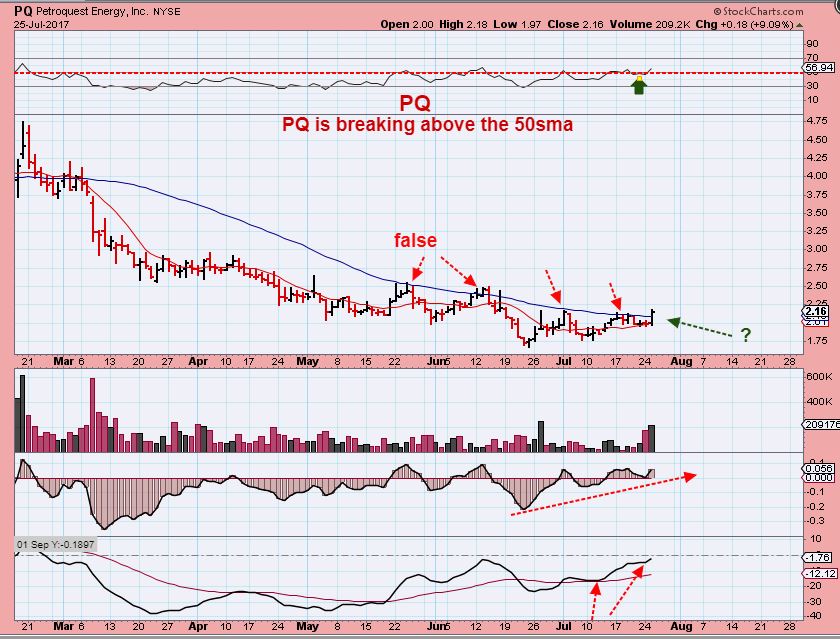
PQ – Above the 50sma after tagging it repeatedly, I like the chart set up.
SM – I am now finding more Oil & Energy stocks acting correctly above that 50sma
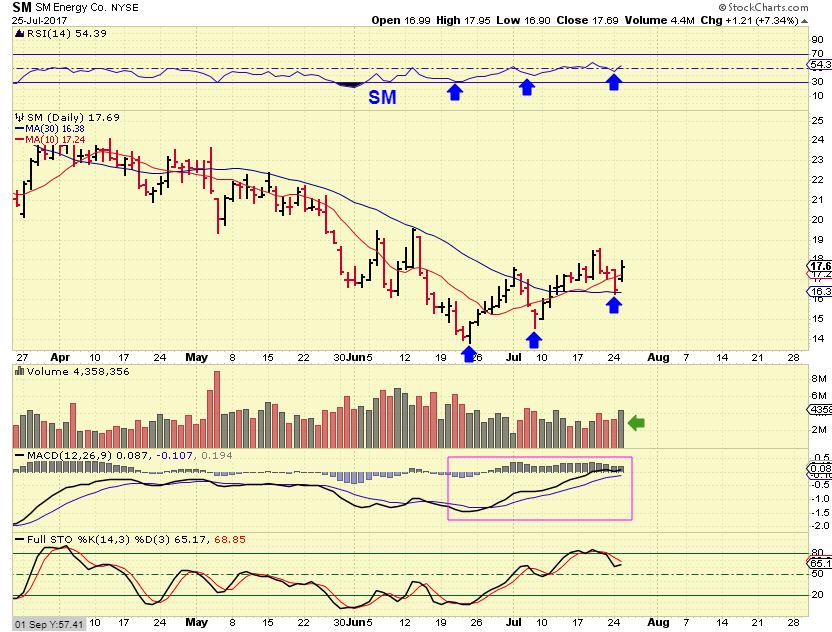
SO I AM NOW GOING TO WATCH ENERGY CLOSELY. IT IS IN A CHOPPY BOTTOMING PHASE, BUT THE LOWS COULD BE IN PLACE FOR MANY OF THESE.
.
IN A RECENT REPORT, I MENTIONED THAT I THOUGHT THAT COMMODITIES HAD BOTTOMED AND MAY BE THE SAFER TRADE FOR MEDIUM TERM OR BUY & HOLD.
We are seeing some earnings being released now, and so far surprises have been to the upside. Very encouraging. Let’s take a look…
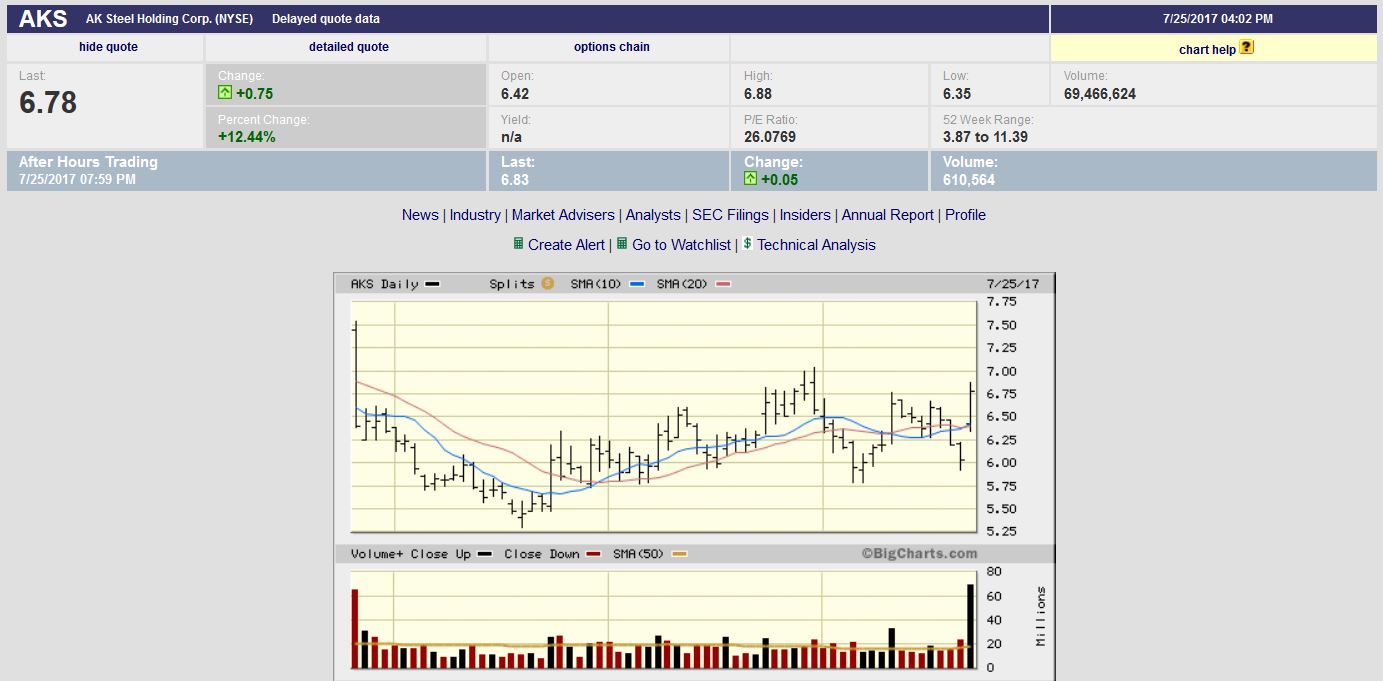
AKS released earnings a day after everyone seemed to bail out on it. AKS dropped hard on Monday, and then Tuesdays earnings pushed it right back up over the 50sma. AKS was up 12.44% on Tuesday with big volume. This should now continue to run higher out of this base.
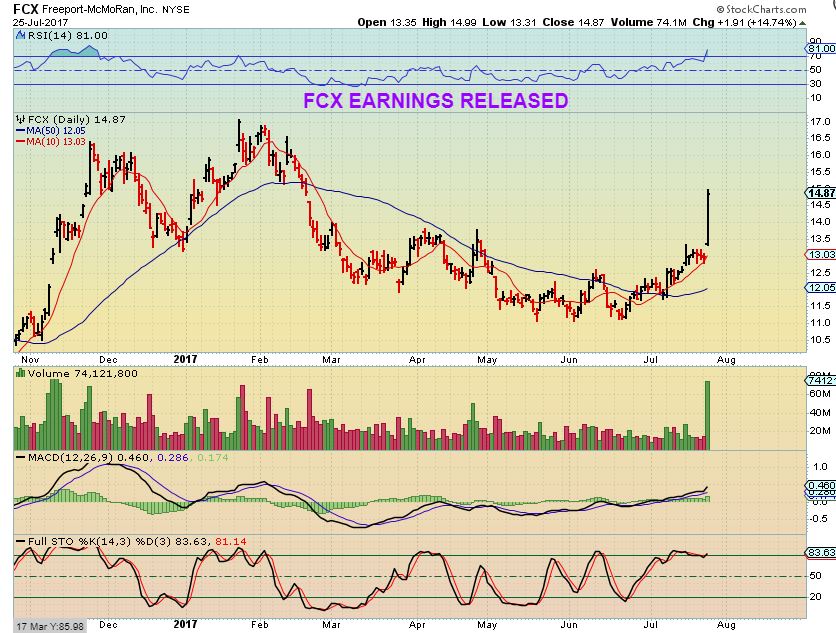
FCX – Earnings certainly didn’t hurt FCX, it was up 14.75% in addition to the recent run up from $11 to $13.
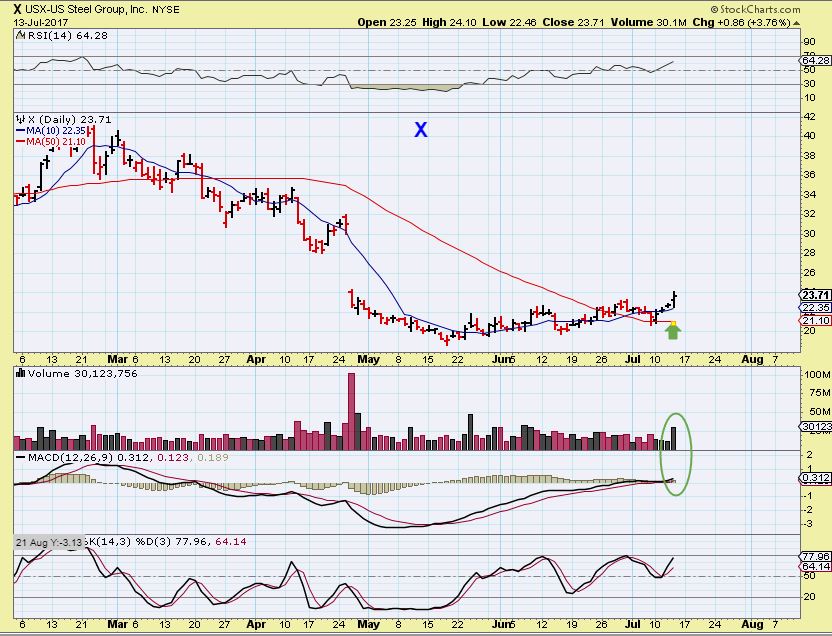
I recommended X in June, but here On JULY 10 ‘X‘ was a safer buy after breaking above the 50sma, falling back to back test it, and reversing higher.
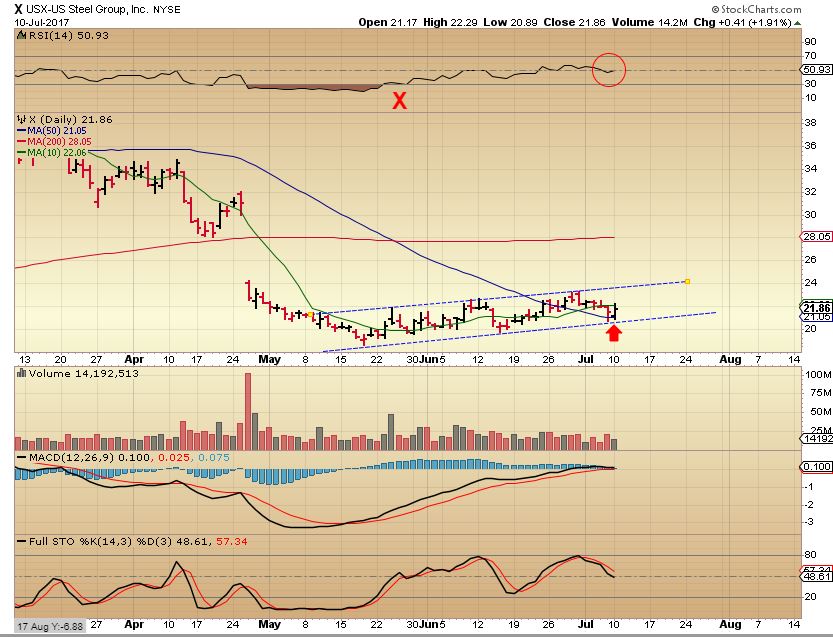
X started moving higher and that round bottom base looks solid. What about earnings season?
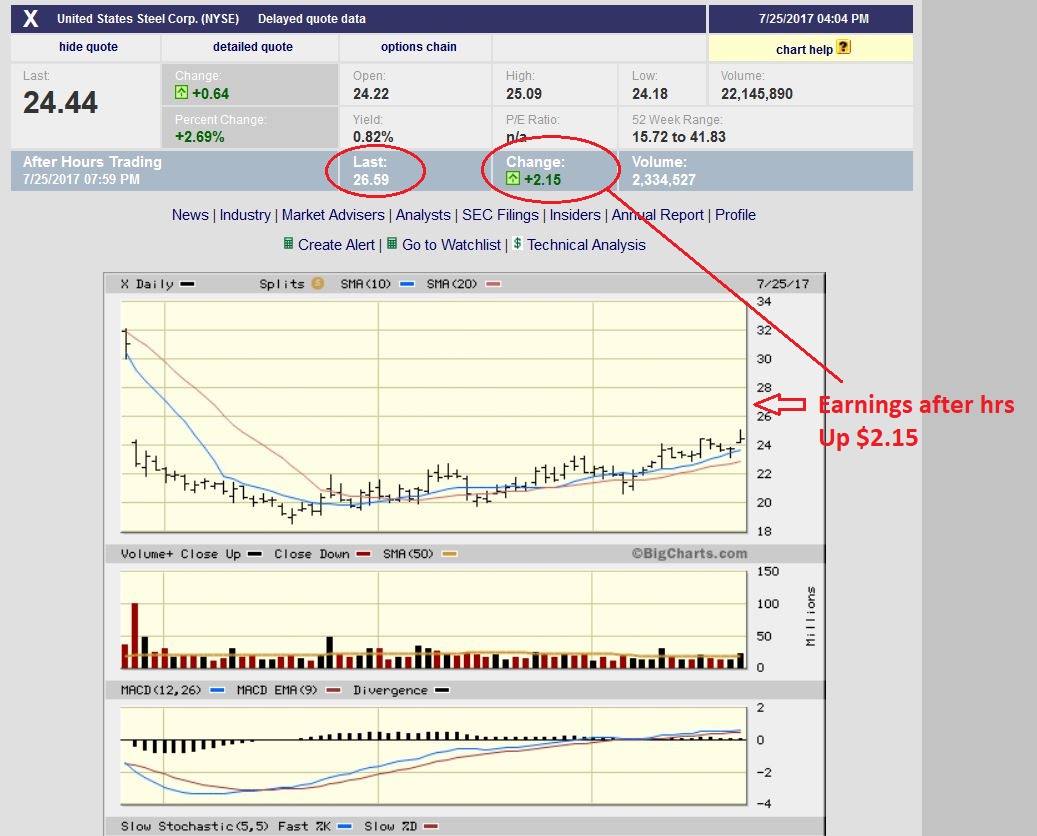
X released earnings after the bell last night, and this chart shows the after hr move. Up $2.15 and price would open at $26.59 Wednesday if this stays as is. These are becoming buy & hold candidates if you prefer that style. This could have been bought & held from May onward.
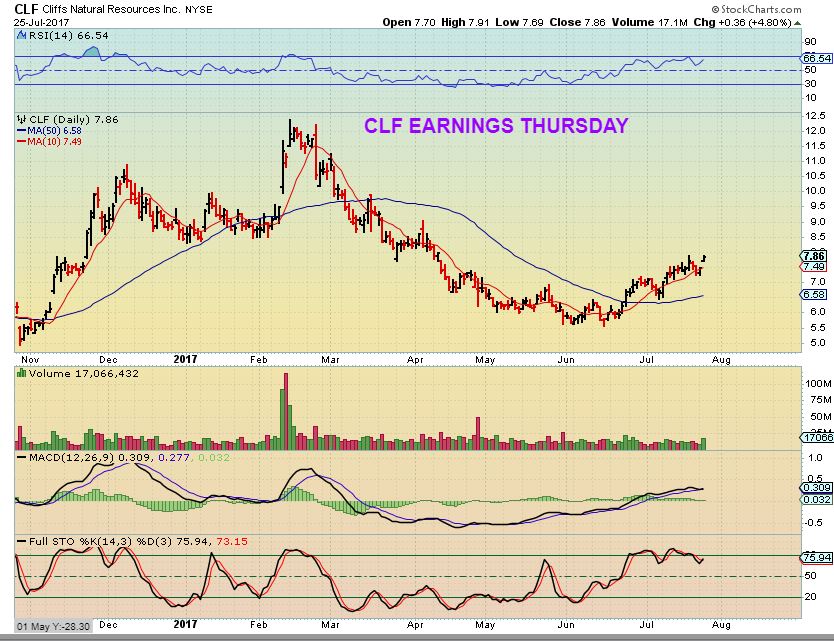
CLF – What will CLF DO THURSDAY?
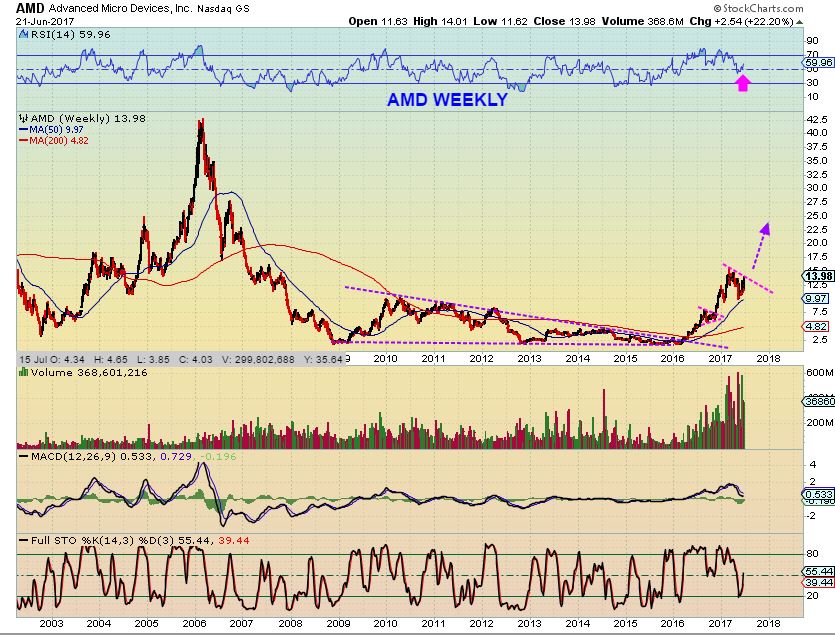
AMD – I have recommended AMD for Months now. I like the particular chart set up on AMD & CY. Here we see that AMD released earnings and was up $1.52 , ready to open at $15.63.
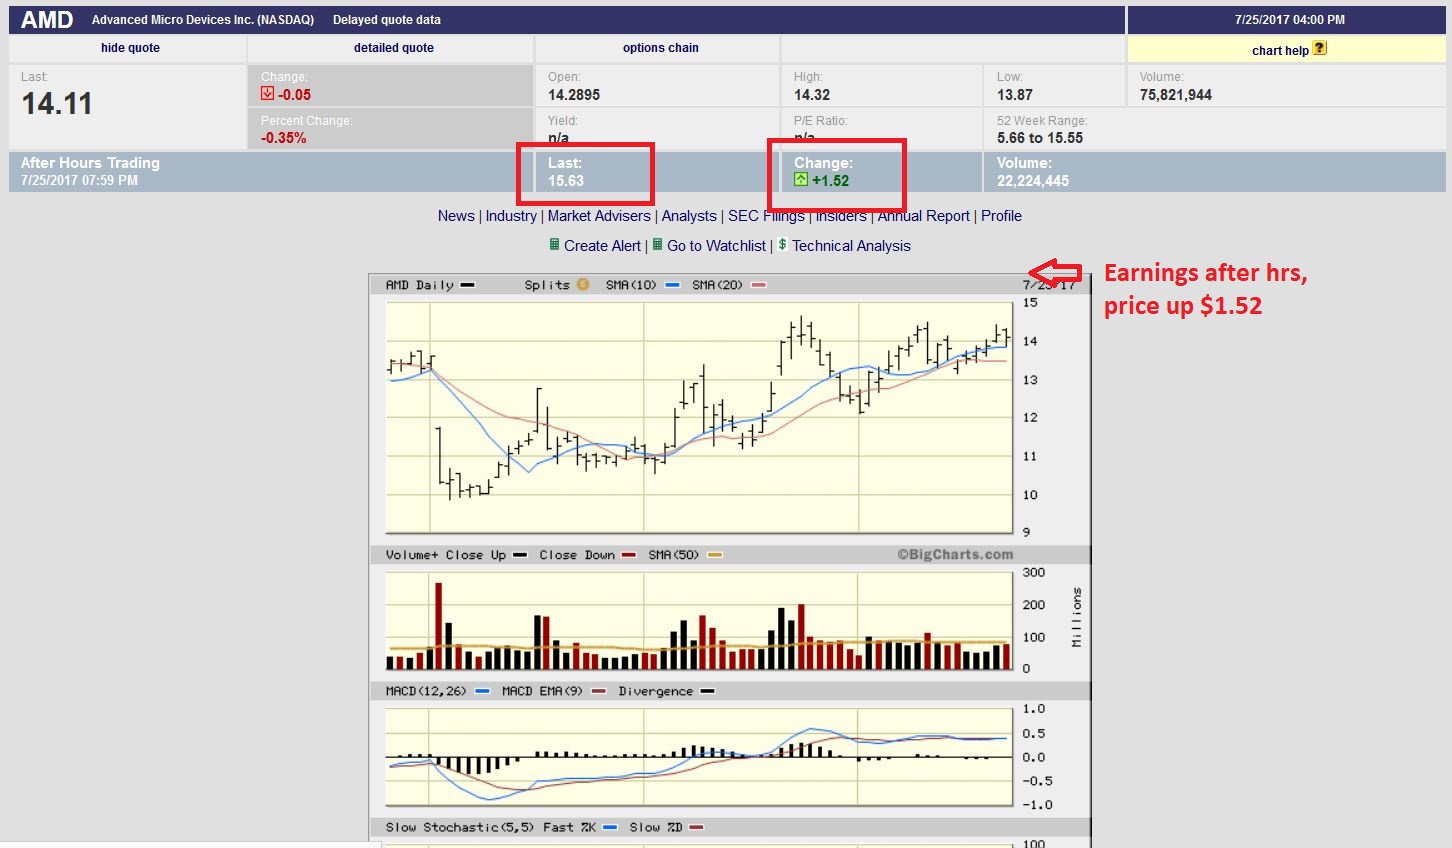
My June 21st chart helps you to see where $15.63 is in the big picture. It is a break out to new recent highs again.
So commodities are experiencing a bullish earnings period, guess what else happened?
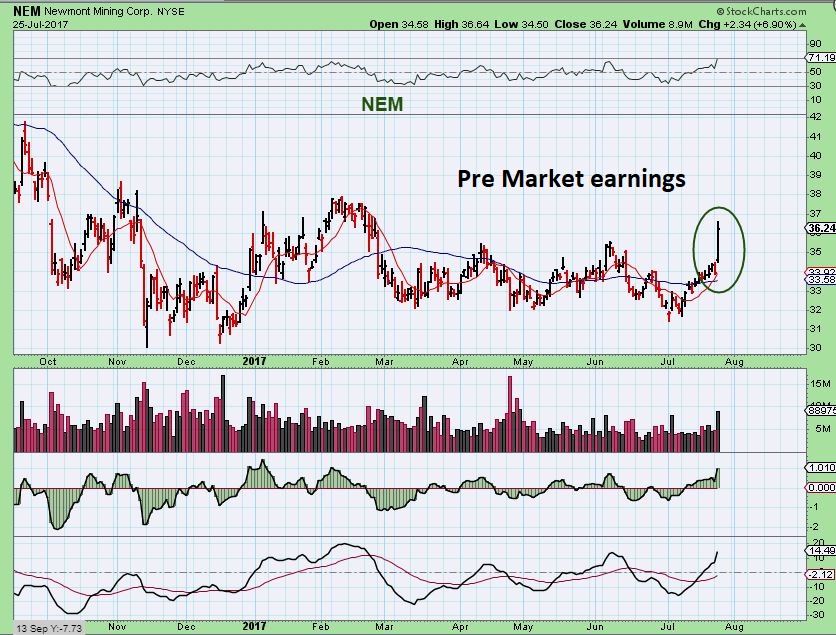
This is a good sign, NEM released earnings pre-market, and NEM is a big part of the GDX
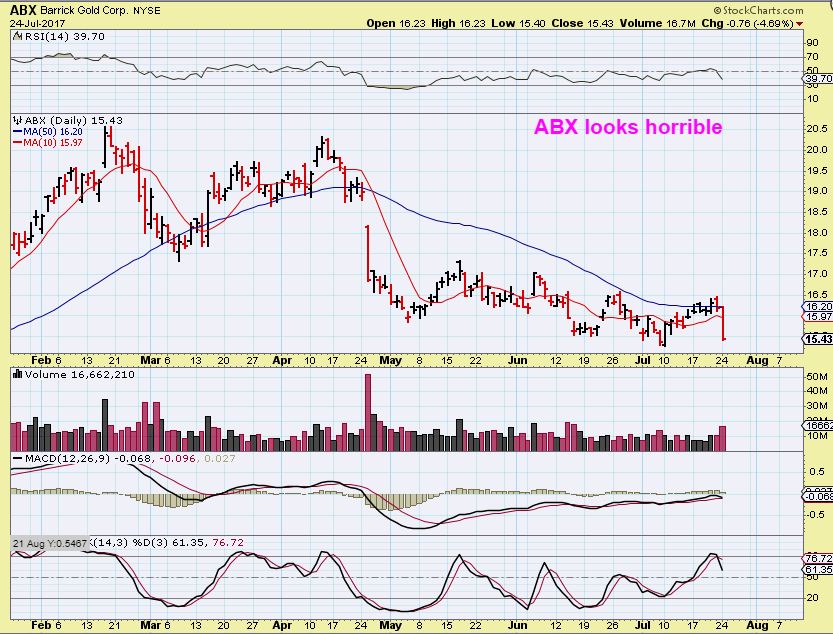
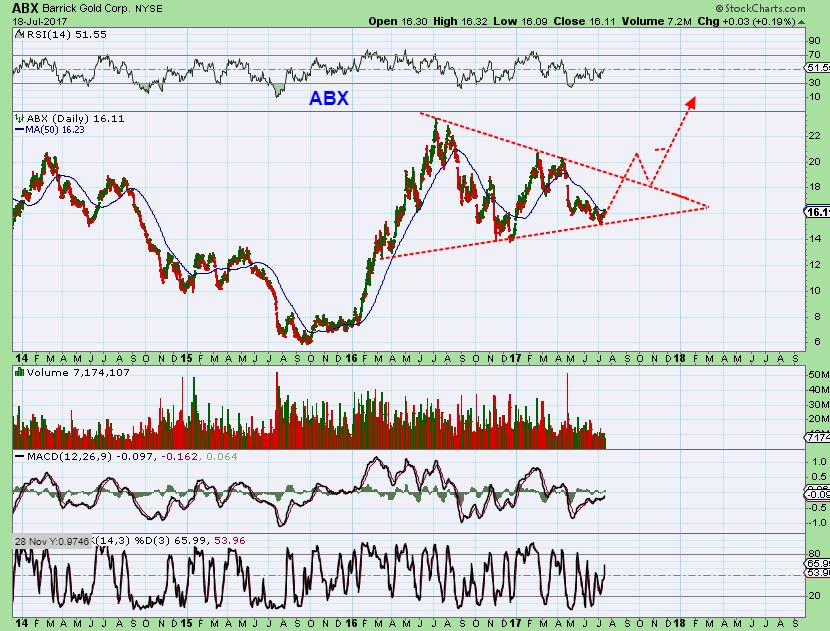
ABX – You may recall that on Monday I said I was examining components of GDX – GG and NEM looked good, but ABX was U-G-L-Y.
ABX quickly reversed that ugly down day yesterday, and this is usually a bullish occurrence. SO the day before the FOMC meeting, we see NEM breaking out higher on earnings, ABX turns bullish, and GG is still above the 50sma. That is encouraging.
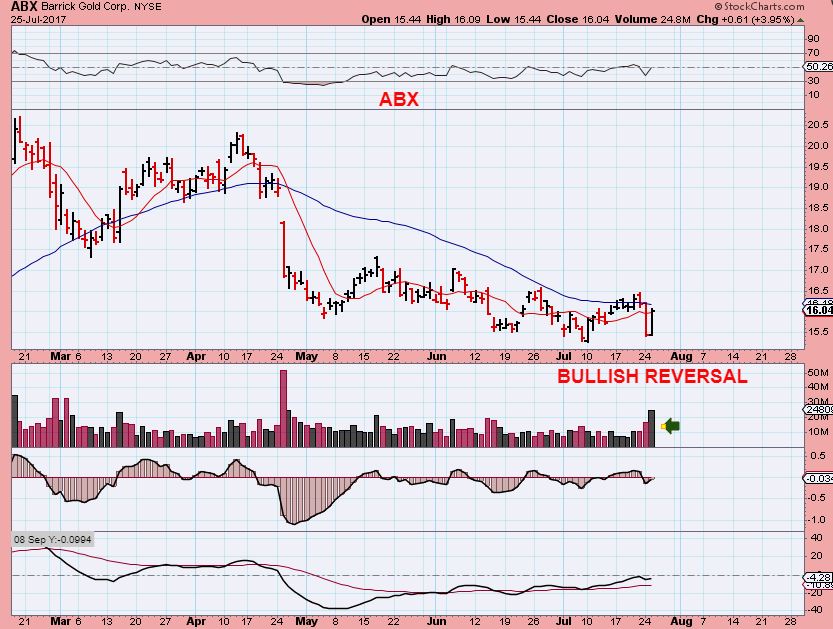
My ABX big picture chart from last week.
SO now let’s briefly discuss the Miners.
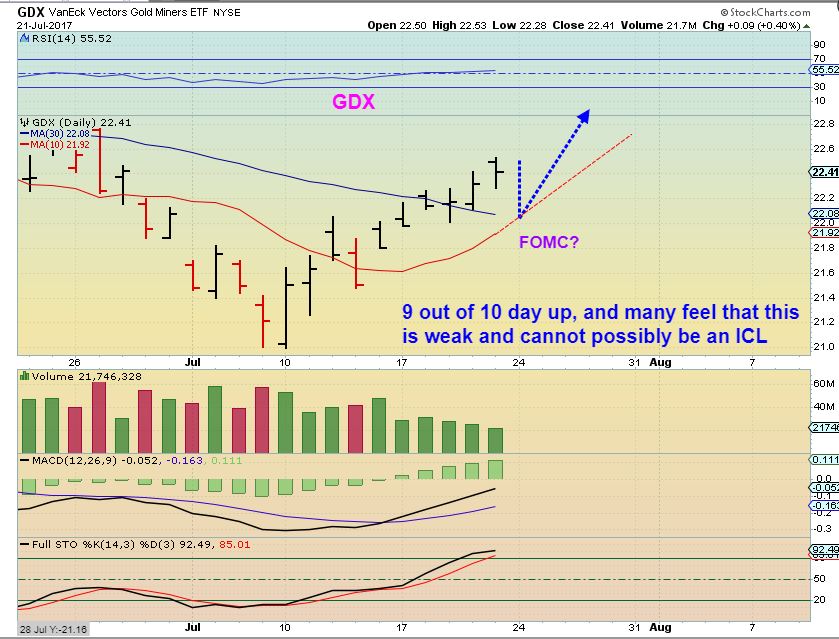
GDX JULY 21 – Many felt that GDX was acting “too weak” to have seen an ICL recently, and I was trying to point out here that it was not too weak. In a Monday report I mentioned how many Miners actually bottomed in May so far ( see GORO, RGLD, IAG, NGD, etc) . With 9 of 10 days being higher, I did think that the GDX could drop before the FOMC and then hopefully take off higher.
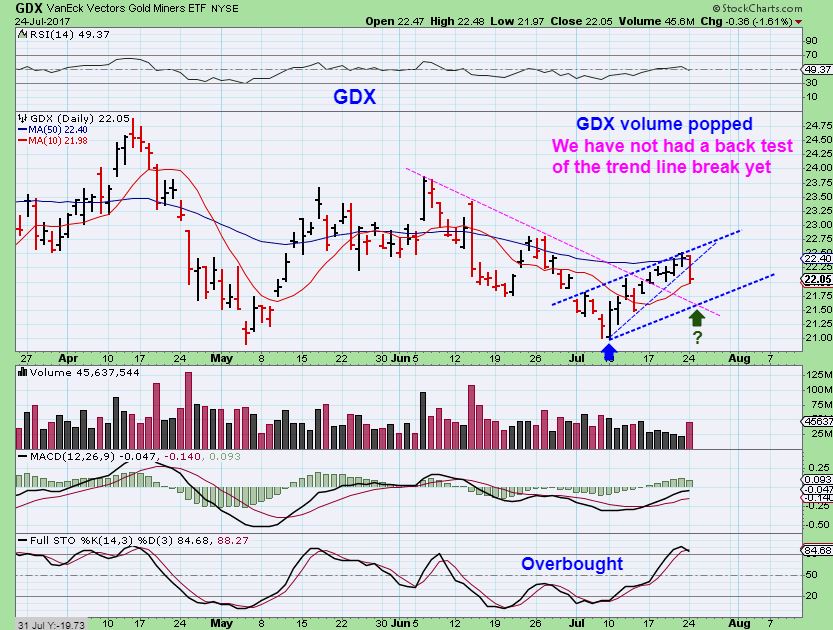
GDX – It dropped the next day, right to the 10sma. I had been pointing out a bearish wedge, and would rather have that drop before the FOMC & get it out of the way, not after. Now what? That trend line could be a target, but …
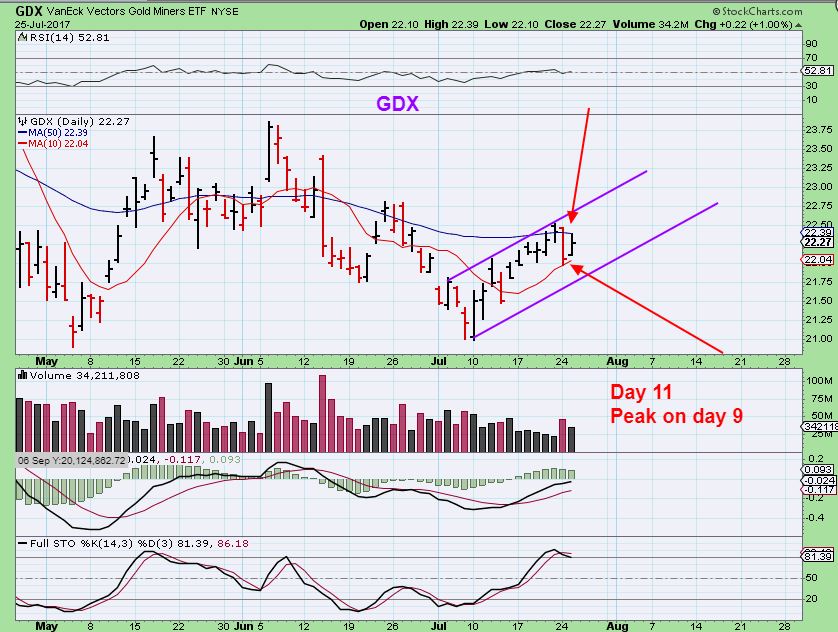
GDX – With NEM popping on Tuesday and ABX reversing higher too, GDX respected that 10sma, yet remains under the 50sma so far. Can this drop after the FOMC to the trend line? Yes. Can GDX POP & RUN after the FOMC meeting? Yes, we find ourselves right in the middle. GDX could run to day 20 if it wanted before dropping into a dcl, and this was day 11.
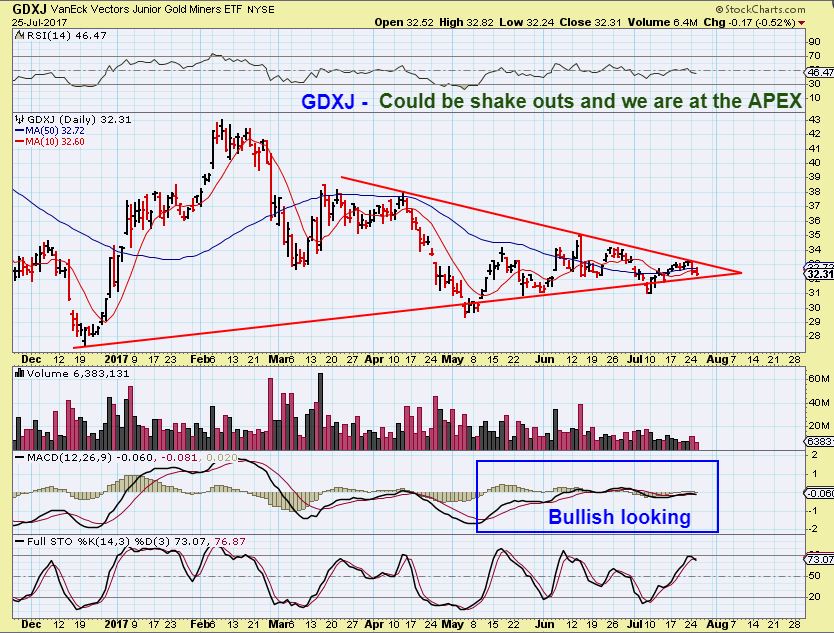
GDXJ – You cannot help but see that GDXJ actually bottomed in May. Triangles mess up cycle counts and I have been pointing out repeatedly that GOLD bottomed in July, but MINERS are in a triangle that look to have bottomed in May. The question is , ‘Is this the triangle for GDXJ?’ or…
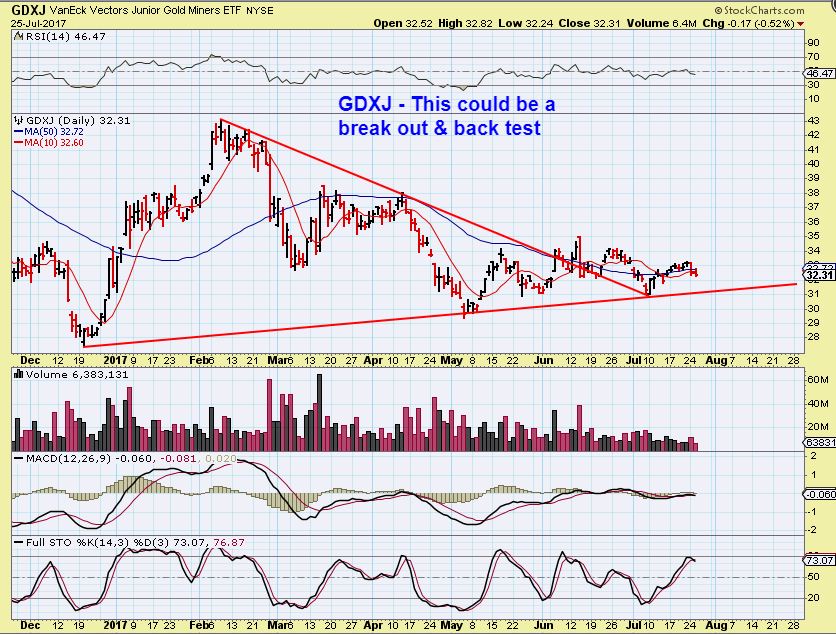
Or … ‘Is this the triangle for GDXJ?’ The answer is, It doesn’t matter 🙂 This is going to break one way or the other with this FOMC meeting, and I tend to think that like commodities, Miners are going higher. Let’s look at Gold.
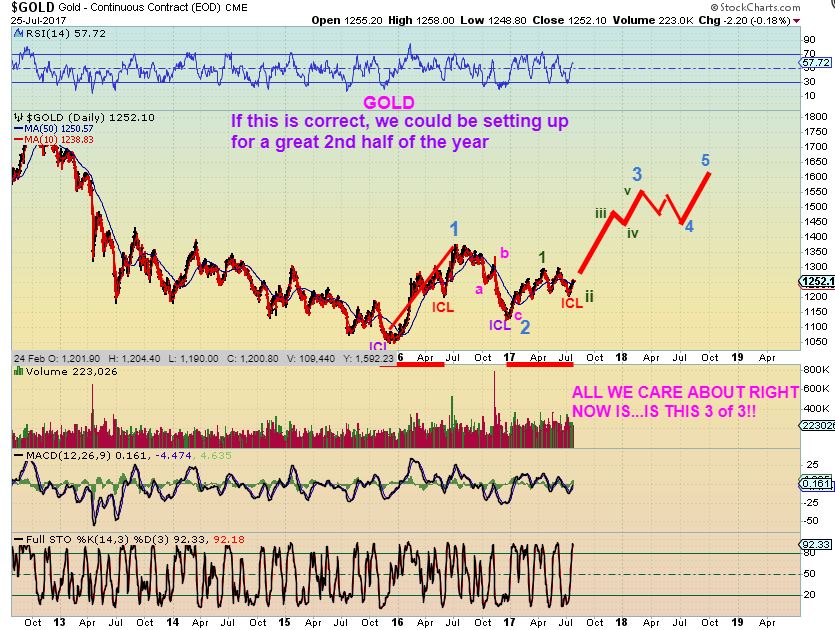
GOLD – We have been viewing the BIG RUN from the 2016 lows as a 1-2-3-4-5 move to ‘1’. Then an a-b-c possibly to ‘2’. That would have us in the big kahuna ‘3’, and we have seen 1-2 of ‘3’. So this would be 3 of 3 – the biggest piece of the pie. I seriously didn’t want to draw this at this point and get people overly bullish, because look at the move so far….CHOPPY & NOT EASY TO RIDE. It does show , however, that we could be looking at a huge move to $1500-1550 or so over time. Let me simplify this…
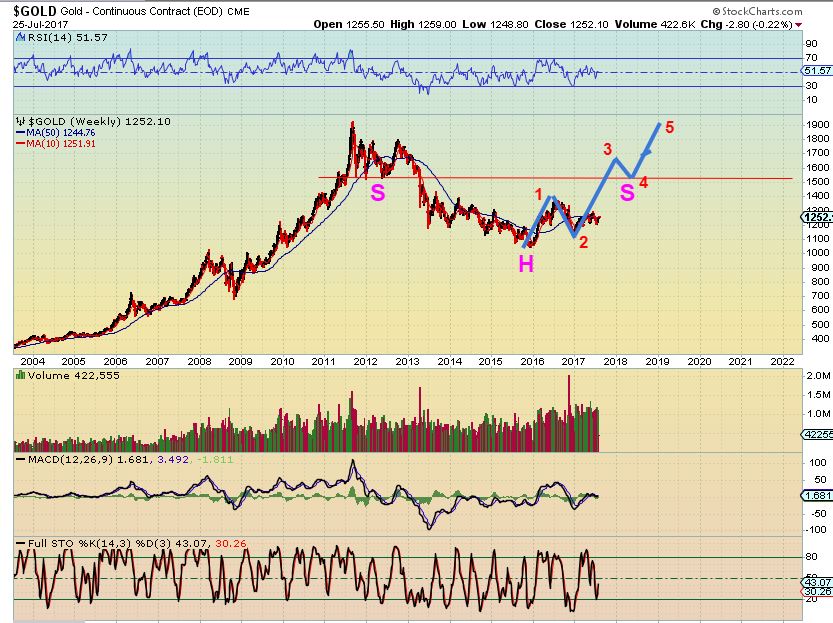
GOLD – I envision a giant inverse H&S could form with a 1-2-3-4-5 run out of this base. We have seen a possible move to 1 & 2 and 3 started in December with that higher low. Sideways chop causes fear and a hatred of Miners. We at Chartfreak are not that way at all, we look for clues along the way. The C.O.T. has dropped, time-wise an ICL could be in place, and when this move continues – we will make a ton of excellent trades and money. Miners should again be rising over 100%, 300%, etc. Can you see that BASE from 2013 to now? You have endured the worst part of this process, the sideways chop ,chop, chop. If this is 3 of 3, you will be riding the best part of this process, possibly for the rest of 2017. If the FOMC causes a little more base action, a little more Chop, chop, drop? Then I wanted you to see this chart anyway, because I believe that it is still coming your way.
Summary – As mentioned in prior reports, going into todays Fed Mtg, I want to mention that I am seeing Miners acting much more like they have starting a run higher, and not like they are weak & inside of a 4th or 5th daily cycle ready to roll over. Time will tell. The earnings Pop in NEM was encouraging.
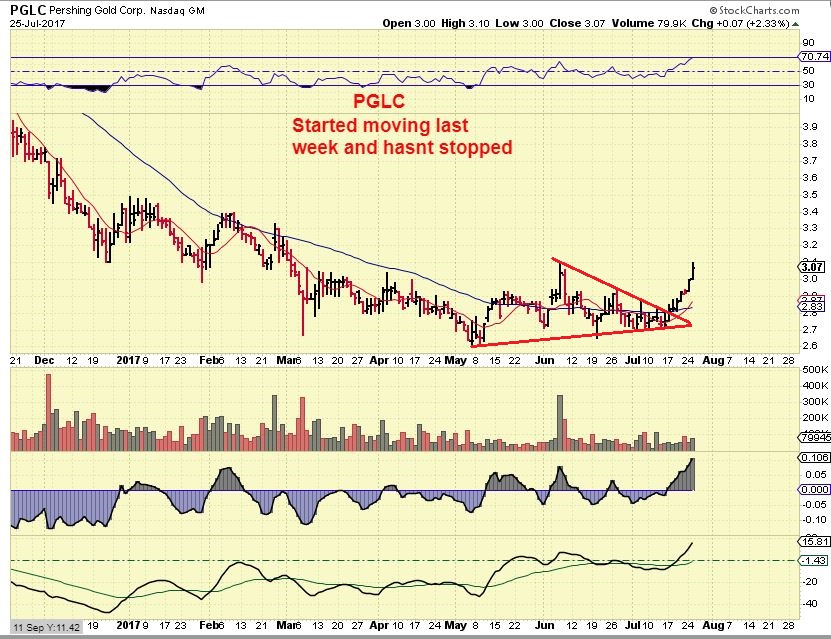
PGLC- Another Gold Miner breaking out & running.
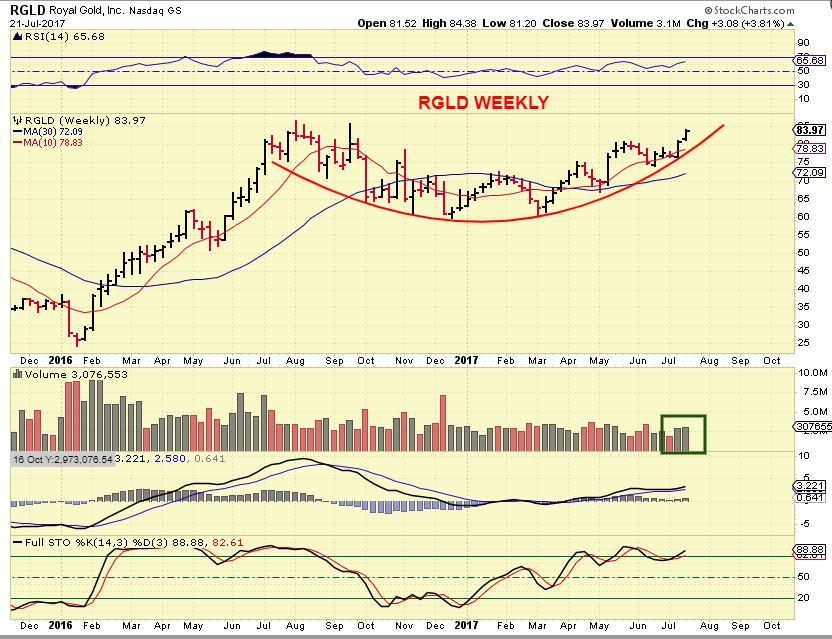
RGLD from July 21
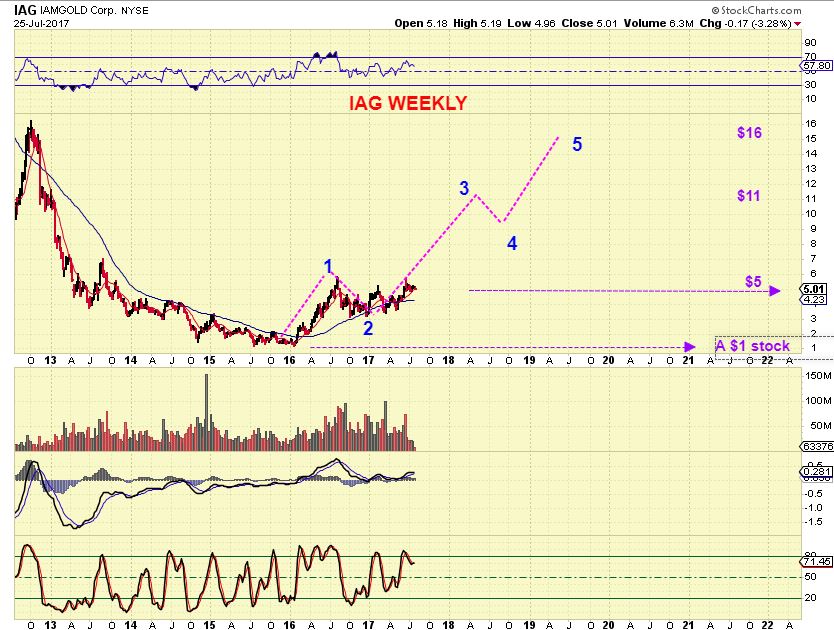
IAG WEEKLY – $1 to $6, and still at $5. DO you own this? “GOT IAG?”
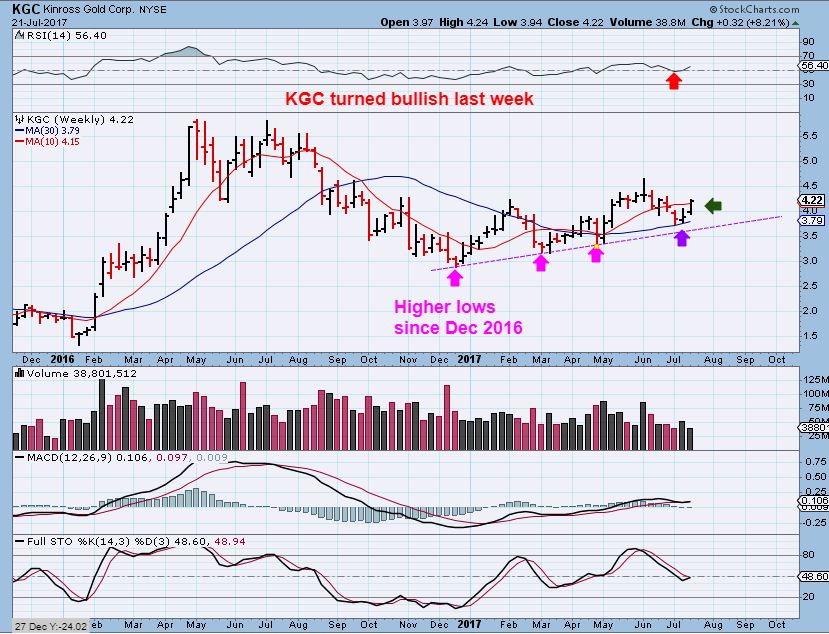
KGC – This was last week, but KGC remains well above that 30 ma on a wkly chart. We see Dec lows, march lows, May lows, July lows.
In Conclusion: Obviously my Thursday report will discuss what we have seen after the FOMC meeting, but I believe that what is to be done for the Fed today is already baked into the cake. There should be no surprises, so what you currently see could be what we get with Miners. Like I said in yesterdays report, I am seeing Gold up day after day, with only 2 down days out of 11. I have to ask myself…“Does that sound like a weak 5th daily cycle about to roll over? Or does that seem more like an ICL has occurred?”. I have DEFINITELY seen ICLs that slowly move higher & higher and do not just rip out higher and higher. I mentioned a few days ago that it is best to buy something, hold a few miners at least ( Skin in the game), and use stops.
.
~ALEX
.
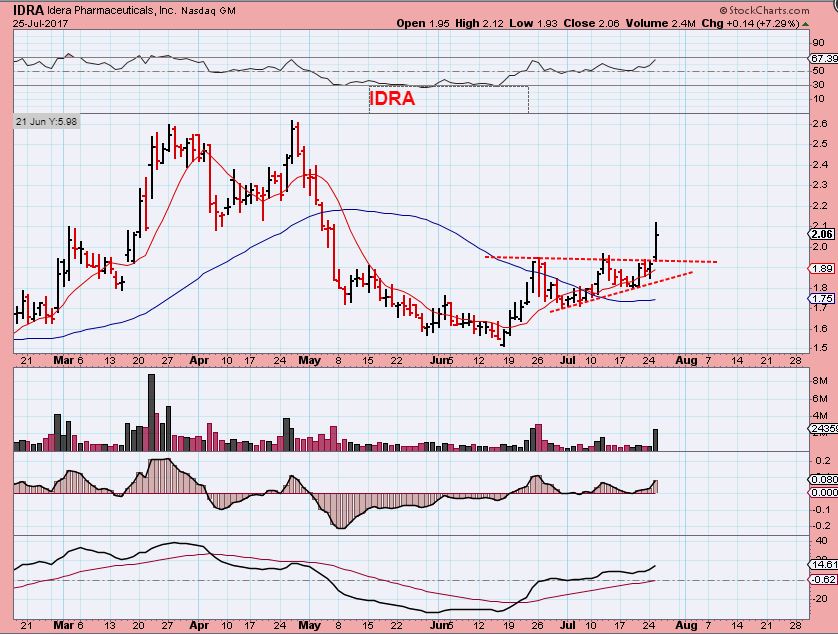
IDRA- The Idra buy in yesterdays report was an ascending wedge ready to break out.
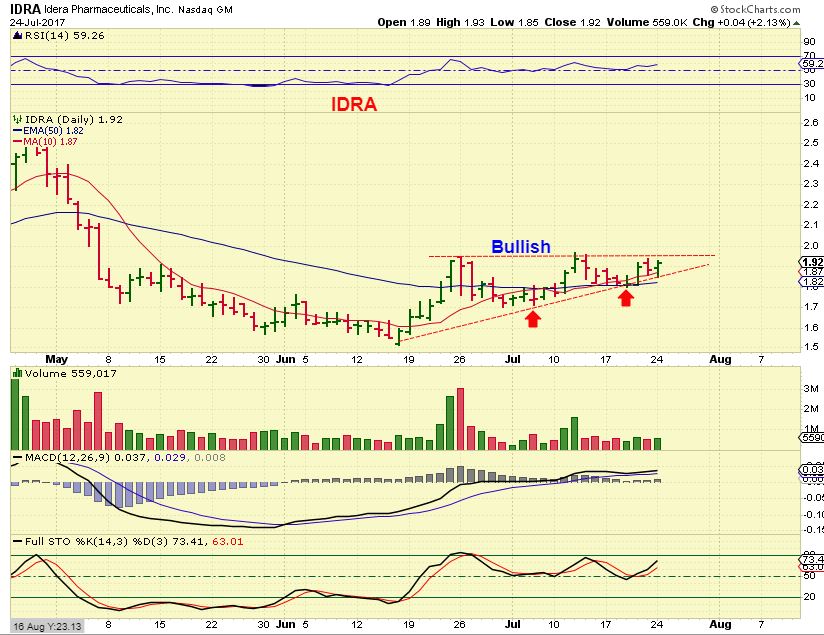
IDRA – I was asked where should I sell? Well, I dont think that your buy point will be broken, so sell when you want to lock in profits. I expect it to move to the April highs at least, so that would be $1.90 to $2.60. It could go a lot higher over time, if it forms a cup & handle here.
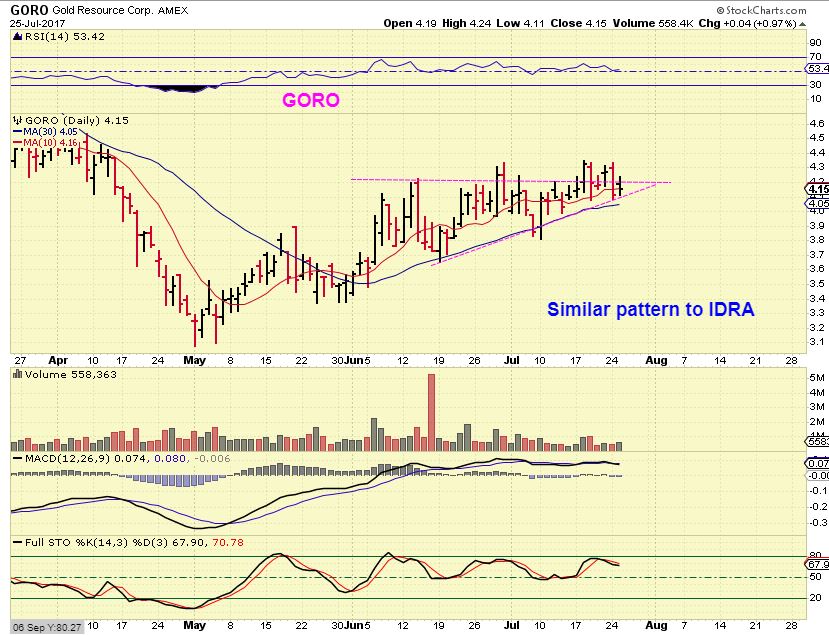
GORO – Encouraging to see this pattern could be forming in GORO too.
After the Fed Meeting, some may want to buy it if it holds above the 50sma.
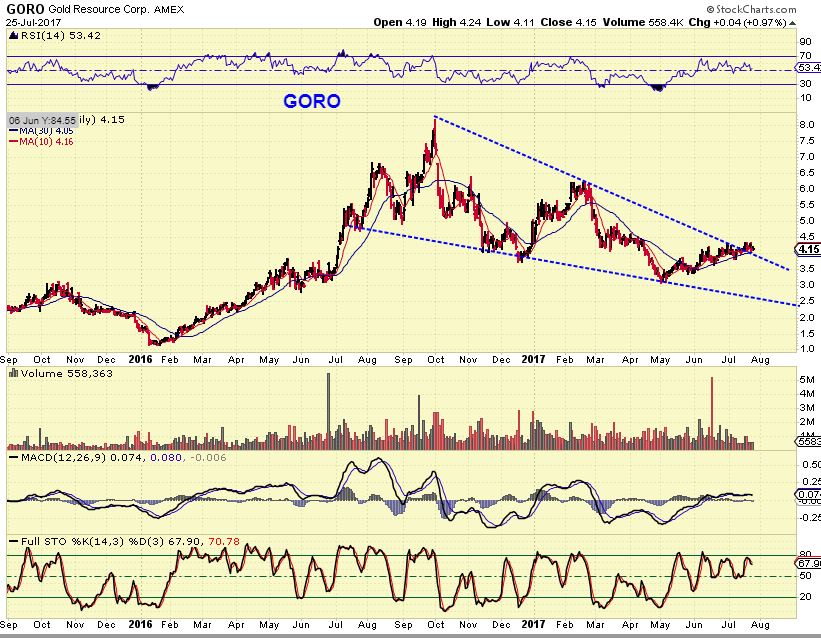
GORO BIG PICTURE – Goro actually may have broken above resistance recently. It can return to the 2016 highs over time, when Gold makes a solid run higher.


thank you Elliott …
#BigKahuna
😀
GidddddEEEEUpppp
Fed day – hopefully gidddeeeup for the rest of the week. 🙂
Been watching GURE for months. Looks to have finally broke above 50dma and holding. Looks safe to start scaling in. https://www.screencast.com/t/HNaJcjahMig
I like that it broke your trend line and one could use the 50sma as a stop
Weird, I just saw a $10 company DVAX up over $2 in premarket trading. I went to look up any news, and couldn’t see anything, and it is now down $1 premarket.
phew, that’s a lot to take in.
Just looking for reasons not to invest in some of these. I know that’s a negative slant, but I hate getting whollaped.
So pre-earnings production reports for Q2: Goro announced production and it is in line, IAG has not announced, MUX announced and they are down as is there chart.
Interesting tidbit with GORO – they pay a dividend and you can take it in physical gold or silver.
That is not a negative slant in my book, it is a cautious approach and I like it. It is best not to be a giddy little investor diving in to every good set up, but a cautious approach is good. “Why should I NOT invest in this here and now?” It could be something as simple as ” The FED ripples stopped me out last time, and then it went higher. I’ll wait until the end of the day to see what happens”…something like that
Plus I know you as one of the readers that does a little extra fundamental research & see how many shorts are shorting it, etc . That may help you to see 1 more reason why you dont want that one at this time. And by the way, I do appreciate when you mention ‘a thing or two’ that you have read about a miner ot other company.
Thanks Alex – actually my pre-purchase check list is long. I’m still very much in the learner stage of exactly when to take the dive, but I do take a good look at most of the companies either before, or right after I buy.
TANH…. nice call
yep, up again after that consolidation.
I’m out of it now, but it ended up being the gift that keeps on giving.
I held on to TGB expecting the same thing there, and I’m still hopeful 🙂 .
RES – outstanding volume so far
EA and TTWO trying to break out here
GPL is starting to move higher – right off of that 50sma ( earnings came out last week).
We havent been able to break that 1.30 mark yet…
I’m droooooling for DNR … c’mon baby show it to me …..
Mommy needs to secure funds for a LONNNG winter break….
DNR
https://uploads.disquscdn.com/images/20409a48d0f51af56f1cacdc6a21419f260c61f7c2840e9bc47082d238dbf1ea.jpg
https://uploads.disquscdn.com/images/601e243ec893f616458e94eb5f7d1c14a8544abe0764426c499fd97fd301faca.gif
you seem to be a bit younger in that picture 🙂
I’m magic …..;)
crazy things happen when I suit up and head to the batcave ….
Get some new Shtick
oh… go stand in line for beer somewhere…………. (me snapping a Z in the air)
Since you are so Interested, they opened their new brewery. Much bigger, unfortunately much bigger lines. #HFT, #HB
I added yesterday, not heavy this time. I hate what youve done to me with this one
… who meeeee? ;o)
https://uploads.disquscdn.com/images/d4d70782a67571a4c085cafbc51bd368a625defb02684c713f682e86a23d35b0.gif
that D bottom is nice
If we can close above 148 Ill be a happy camper
yeah baby…
AKS filling the gap or just changing it’s mind on going up???
On the upside I stopped out of 1/2 my shares much earlier. On the downside, I only stopped out on 1/2 my shares earlier :((
Wow! Never ceased to be amazed by the ‘rules’ of the game. IF AKS reverses here not only did it close the gap but also bounced right off the 50ma…all in one shot. Just amazing!!
how can BA be up 9%, these moves are getting crazy,
Great looking chart
that thing is sexy!
Giraffe
GDX chart looks okay, GDXJ doesn’t look bullish to me at all. Looking at the hourly
https://www.tradingview.com/x/fsb0zPJ8/
How quickly the FED can change the outlook, JNUG bullish
https://www.tradingview.com/x/8d5NTumG/
I was asked in an email if I still like UEC, and would I mention it in the comments here.
I own it, and actually it is up almost 60% since May, and is still near the recent highs.
Refresh- there is nothing that I do not like about it, it is consolidating gains. In the past I have mentioned the 50sma and the trend line as possible support too, so even if it drops it remains healthy.
https://uploads.disquscdn.com/images/44c2a6f6aa200064c8ad617f626c91cfde357c6139264c7eb719004a33e586f8.jpg
shoot … EGI continues on …
nice follow-thru w/ NEM …. so far
PGLC – In the report today, also just wont stop climbing ( I missed this one)
yes… i mentioned that the other day to Jime… his personal favorite ;o)
of course i didnt take it… jeepers…
I NEED MORE CASH.. 😀
im still sitting in MCOA TRTC GRNH … smallish … they need some luvn …
😀
MEOW
Wait…I do not on this at this point, but I do still like the set up
FCX – Wooohooo
TMQ – WOOOOO HOOOOO!
are you in it?
Unfortunately – Not anymore, but that looks a lot like TGB on a 3 yr chart, so I’ll try to hold on and ride that one 🙂
Hi Alex,
Can you comment on AKS behavior today…expected and still bullish? was hoping for follow through from yesterday especilly with X earnings.
thx
MAG seems to be warming up – bullish engulfing so far today.
That is a nice chart Ron
NSRPF ………………………….. w .. o .. w
Yeah……………….You Mean ……………W..O..W!
HBM …yum yum
…feeling some rummblings in my tummbling…
I made a note on the chart of CF’s comment on June 29 “if HBM cannot break above the 200 on this try it might drop back and test the 50 and TL. 5.14 to 5.44 would be an excellent entry”
And I ignored his advice 🙁
it’s ok… TAAT
*i ignore him most the time …. his lips r moving … but all i hear is blah blah blah….snoopyStyle
***TeeHee
Yeah, It tagged the 200, dropped to the 50sma, and then just continued higher.
I love it when a plan comes together. 🙂
One of my best performers lately.
Someone listened? : )
FED – FED – FED
T-minus 7 minutes
Bring it on!!!!!!!!!!
lol… look at AG go….
Volume increasing rapidly in GDX GDXJ – I love that
GDX breaking above the 200sma – I love that too (So far)
Did MUX bottom yesterday? : )
heheheheh.. i was jjjjjjjjjjjjjjjjjjjjjjjjust going to say … ohhh BAAYYY … mux is mad a u…
No – I broke even less fees yesterday and added heavily at 2.53 today. stepped away and came back to AG and MUX putting money BACK where it belongs
Yeah – what he said…. putting it back where it belongs!
https://youtu.be/GG_rdld6KCQ
I def didnt go 10k shares this time, but a smaller amount. Want to load load when she breaks the 50.
*DaddyWarbux
no thats CF and Steve lol.. My mony is tied up in AG and DNR and MUXXY – i feel like a giddy one rn
lol… 2 of my personal favs….
C.F. & Steve? lol
well … if we’re talking about men …………………………. have I got a story for you……
Tshhhhh … (catwoman snapping her … oh nevermind…)
Thats a game changer
IF I was counting cycles in GDX right now, we also have a new high on day 12 –
that is also very unlikely on a 5th daily cycle about to roll over.
soooooooooooooo …….
https://uploads.disquscdn.com/images/a25cc7314c60712be2e8d08cab7568bcb79e03c9ffcebfe74d94050c5715dd5e.jpg
that’s should have a ???
It must be and this is a tough one.
We get confirmation from an overhead trend line break, but the way Gold sold off, it was actually making higher peaks from daily cycle to daily cycle, instead of lower highs all the way down.
That means that we do not have a number of ‘peaks’ to draw a trend line on .
SO obviously we play things a bit safer around the FED MTG, but my reports have been pointing out that
1.GOLD looks more like an ICL than a weak 5th DCL
2. Many Miners bottomed in May
3. GDX / GDXJ in a triangle so I’m not counting cycles on Miners currently.
4. Pointed out many Miners that are bullishly set up.
5. C.O.T. became quite Bullish along with $BPGDM, ETC
6. Scroll up & you will see that the whole second 1/2 of this report is basically Gold & Miners Bullish charts.
That said, I still have to use caution for the readers here that are not in front of a screen all day, have trouble with stops, etc.
With the Fed behind us, we may just get higher price going forward. especially if some Miners have been going sideways and the crowd has been shorting them expecting a drop. We could get short covering & Buying., So…
I use stops and am in front of my screen all day, so I am leveraged and repeat …I’m using Stops.
Really strong move in miners since 2:30. I wasn’t buying the ICL before that, now I am. I entered into miners
Go Bill!
This is your POST FED update – 1/2 hour after the Fed
Refresh
https://uploads.disquscdn.com/images/f69874646f9f4ce4b292273b2d684fa8a6b0fd091fa33e59cd750e8f1c72c27b.jpg
USD dropping hard since 2:30
https://www.tradingview.com/x/JkLttxjE/
Yeah, a pretty moderate move in gold but miners are really popping!
Thanks. I’m now in GDX, GDXJ, GORO and IAG, and want to buy leverage, but am thinking the next DCL will be easier than now. What do you think?
I added after the Fed Decision, but the next DCL would probably be easier .
I’m just using todays lows as a mental stop
Thanks!
where were u able to snag some IAG if you dont mind me asking 5-O
Being a chicken type, I went leverage (NUGT) right after the decision and just took profit lol! Maybe I’ll try again tomorrow.
Good for you! I want to do that too, but I’m going to let it ride.
In the past, I have purchased right after the Fed decision, and held nice gains until 3:30 – 4 p.m when suddenly the selling picked up. 🙂 Not fun.
So far it seems like my sell working well for your hold lol! I’m cheering you on CF!
Yes, I just saw it pop again as I was writing. JNUG was up $1.30 and shot to up $2 pretty quickly
I’ve bought exactly the same as you over the last 45 minutes. Plan to add tomorrow depending on the close and overnight action, although I’ll probably focus on GDX and GDXJ for the top-ups.
UPDATE 1 hr after FED
https://uploads.disquscdn.com/images/afd7f76f91efe17aef3a4fb402bdb10db5c47ae82064124d7025b8913719982e.jpg
I still see some Miners gradually moving higher ( only up 3, 4 or 5%) and others only 1 or 2 %, I even see a few red ones.
but when I look at the charts, it feels like the stall or delay that we just had is a 1/2 cycle low, meaning from here we would continued higher. See GDX breaking above the 200 sma – this would be a move out of a 1/2 cycle low.
In the report today under GDX , I mentioned that this CAN continue higher for even day 20 or so, and then drop into a DCL. That is what I will be looking for going forward….
“Are we coming out of a 1/2 cycle low?” It looks that way and each day higher is more likely to make this Right Translated.
If you need a visual example, I’ll have one in the report tonight
NAK needs help getting that boat turned around……………… 😉
What do you see as a target for GDX at the top if this ICL?
The move in ASM looks pretty real
FWIW …. miners (GDX,GDXJ, etc) are a “buy” today on my daily charts using my own TA system. I like it when my signals match up with Alex’s analysis. Looks like we are both bullish on miners today and with the Fed news behind I bot some JNUG. I’m still very heavy in my old favorite TQQQ, but I’ve been saving money to buy miners when Alex gives the “go” signal. Good trading to all!
FYI … the reason I like JNUG is because I can get good exposure to miners while tying up only a small portion of my portfolio. I’m NOT going “heavy” in miners at this point.
Woah! What’s that. shorts covering?
I dont know if many here care, but Some of these ENERGY are taking off too ( NOG up 18% , BTE, DNR, FCEL)
I’m selling out of this pop, personally.
When I used to work doing sales for an Aerospace company, I visited IROBOT in Massachusetts and they had the coolest quality ‘stuff’. I KNEW that company would do very well, but then their stock was stuck at $30 for soooo long. It would have been very hard to ride this choppy sideways action.
Earnings yesterday and they are still doing excellent, no longer at $30
refresh
PATIENCE PAYS OFF WHEN A STOCK IS JUST BUILDING A LONG BASE,
BUT IT ISNT EASY BEING THIS PATIENT
https://uploads.disquscdn.com/images/59e2365e4ae0ed885253bd8c77028693a9da9a649a04306543193d3e5ad2873b.jpg
I saw some of there robotics. Pretty different thinking.
Yes, exactly.
If you think you missed the boat and want to buy a miner, take a look at NAK. It hasn’t made the move today. Yet
See BAA – but I dont really want it here ( Does look like a capitulation low, but there are better ones out there).
Im not really happy with NAK’s chart either, but that’s how I felt about GDXJ earlier. Now look. What to buy now, that hasn’t joined the party? or wait for the retest.
I was going to say AUY when it was red right into the fed mtg, but that changed quite a bit.
DRD, GSV, SSRI lagging today.
VGZ is up ovr 3%, but on the chart it is still at the lows, definitely not extended.
I’m not recommending these, just talking out loud.
BAA up 9% in the last 4 hrs.
Still down 8% for the day-
Nak moved up into the close – was that you Bill 🙂
Could be Cason??? Lol. 🙂
I feel like I only drag NAK down!
I missed the boat today!! I was gonna back my J-NUG but was on the move driving. Should pulled over and traded!
Got out of MUX at 2.70 – locking in my gains – I know some might say why… but thats becuz MUX is a dirty MOFO and I wanted revenge
lol
#RevengeTrade
Hashtag#
Oh I like that chart a lot : )
Nice base
Plus Cason called the low on it yesterday when he said it sux- you know it is going to double now 🙂
J/K CASON!!
hahahah……….. https://uploads.disquscdn.com/images/6595cf5e166a9604398b88dfcefbf13663308ee5185f7758592fcb84b60432d9.gif
remember couple yrs ago when i said REXX was a piece of #&^@*!) .. and SOMEONE (cough cough BILL) rode me for days on end .. weeks evennn … (omg I just felt like snagglepuss when i said that)
*i was exhaused
https://uploads.disquscdn.com/images/0aa1f284e33db96596ba5dd5b9df4580a403476e7e52f5974169195de05e666b.png
I may have some my JNUG (I was scared!). But I held ole MUXIE!
LOLOL
lol….hope that mofo doesn’t make you cry
I made out with a nice little amount. a few steak dinners – and Ill get back on that horse when it really sits on top of the 50 and doesnt crack it
Does it appear that GDX has broken above the trendline connecting the Aug ’16 high and Spring, 2017 highs?
But GDXJ has not?
..
Gold is at an interesting trendline – weekly chart: https://uploads.disquscdn.com/images/daac09f330fa7a3afd571f28373314101e262e7d5ed6decab5d1c0519d785743.png
That is the big one that everyone has been watching for the BIG move.
If that breaks (And I think it will) I do believe all kinds of technicians will be buying.
But will the Freaks be buying? 🙂
earnings tonight tomorrow?
Big shale oil producer WLL missed their numbers pretty badly and down 5% after hours.
Oh wow! I just dumped that one. Thank goodness. Energy has been nuts, I used the pop last 2 days to sell, not buy. Thanks for sharing.
hey……:)
https://uploads.disquscdn.com/images/35b79aa056bf3d7dda464964d709e10e4ece8fbe98ae88b7c3549988cfaabb12.png
Very Florida garb!…shirts like I wear….oops…ok, very Hawaiian too! LOL
so wrapped up in AG and SUX with an M that I forgot about IAG… I wanted to add 🙁
IAG news – 80% increase in reserves at Rosebel Mine
IAG – https://finance.yahoo.com/news/iamgold-reports-80-increase-reserves-210500101.html
coffee looks like it’s in 3 of 3 ….
CLF earnings coming up in just a few hours!