
Thursday July 20- ENERGY NOW PERKING UP TOO
Things are really stacking up for traders and investors now. As mentioned in prior reports, and proven true on a day to day basis, Metals, Energy, Solar stocks, Precious Metals, and more are all signaling good things to come. Let’s get right into it…
NASDAQ – The NASDAQ has moved higher for 9 straight days. It even gapped open on Wednesday. We got a ‘safer buy signal’ on the move out of the lows above the 50sma last week, so…
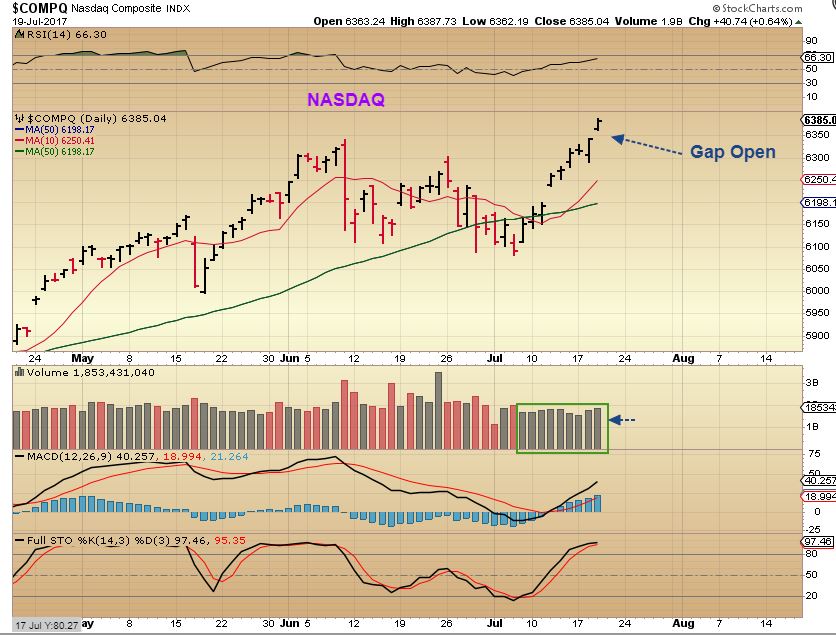
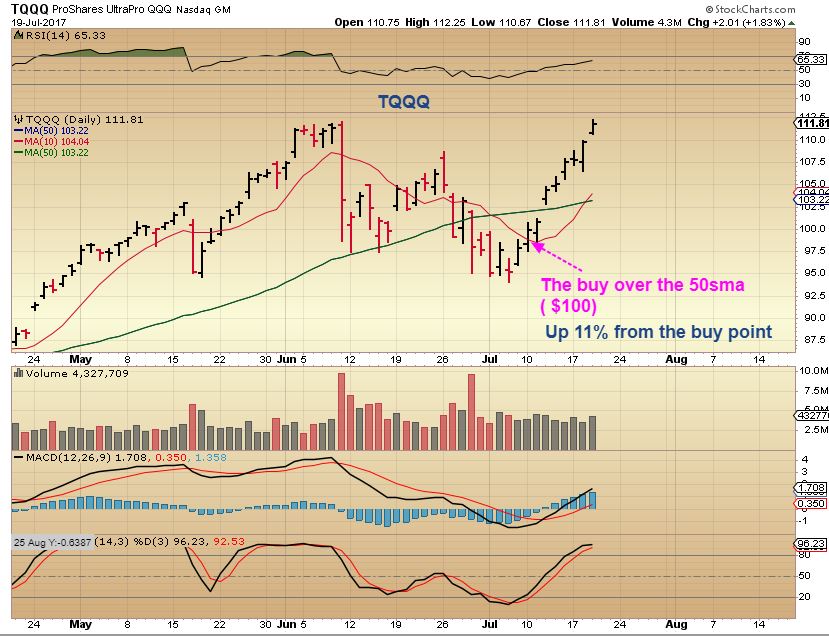
If you entered TQQQ you are up 11% in 8 days. Not bad for a fairly safer trade.
I do want to mention 1 thing though….
I am going to release this on Monday night, so I cannot tell what the futures will look like Thursday morning. If the NASDAQ gaps down Thursday, it could leave a topping candle, so you want to be alert to that. It’s not a big deal, it may just drop to back test the 50sma, so just be prepared for that.
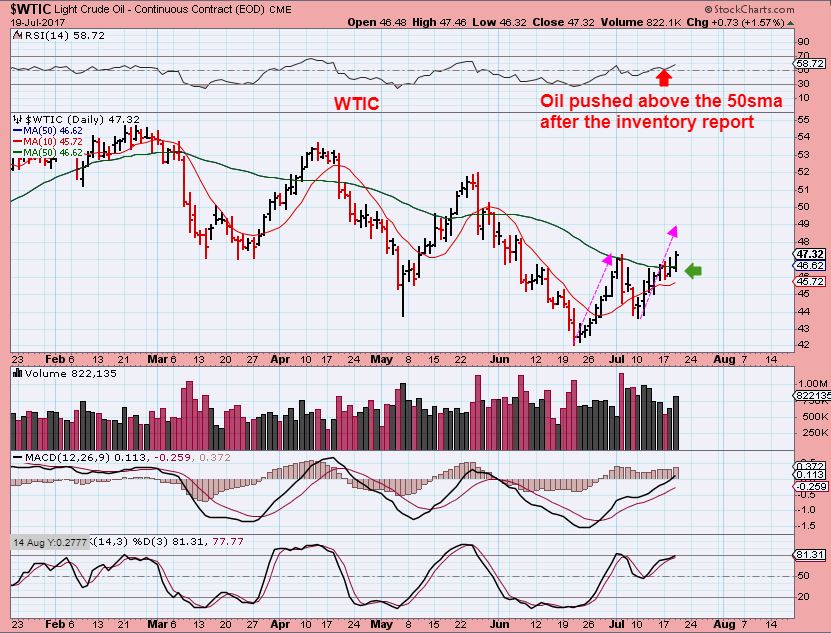
WTIC – This looked like a bullish set up and the inventory report for oil was bullish. OIL pushed through the 50sma with increasing volume and should continue higher.
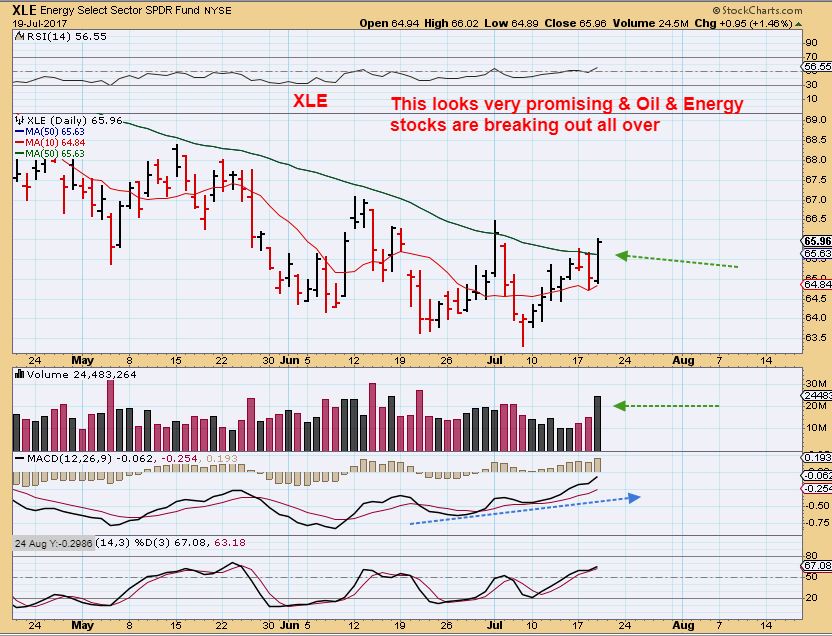
XLE TUESDAY – I knew that this MACD & RSI was telling us that this was sell off was possibly going to turn bullish soon. 🙂
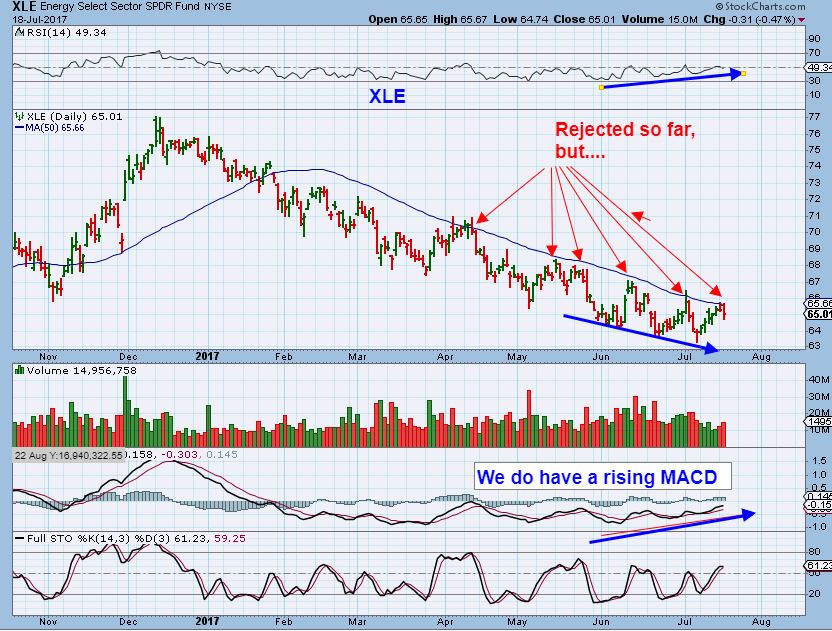
XLE – The XLE surged through that 50sma on Wednesday and I saw so many Energy stocks start to break out and surge higher yesterday too. This sector is joining the other bullish sectors discussed here recently. This is Bullish for Energy and the volume is convincing. Let’s look for follow through.
So I started posting these Energy / Oil stocks charts Wednesday morning in the comments section , so that we all could be watching for break outs. These charts were posted before noon time and looking ready to bullishly break out. ( I feel that these could be bought right here, but I also want to point out another buying strategy later in the report. I have used it as a more conservative way to buy set ups like what we are seeing now.
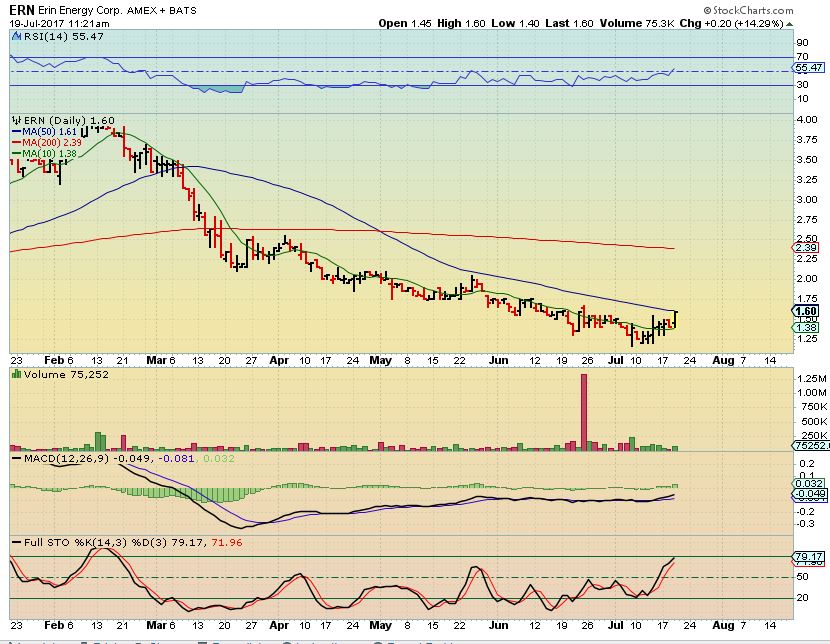
ERN– This one broke out later and then sold off a bit, closingon the line. It could be bought here in my opinion.
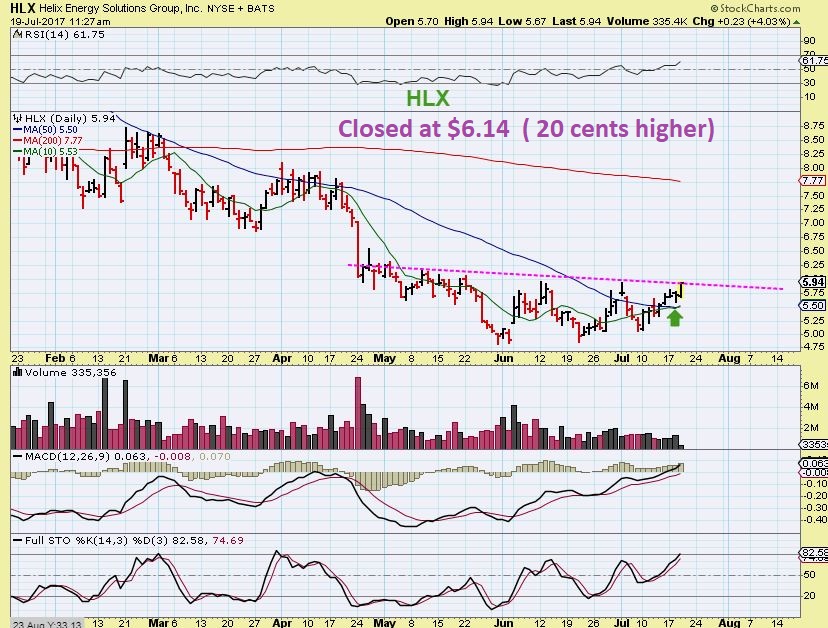
HLX – Closed at $6.14, up 7+%
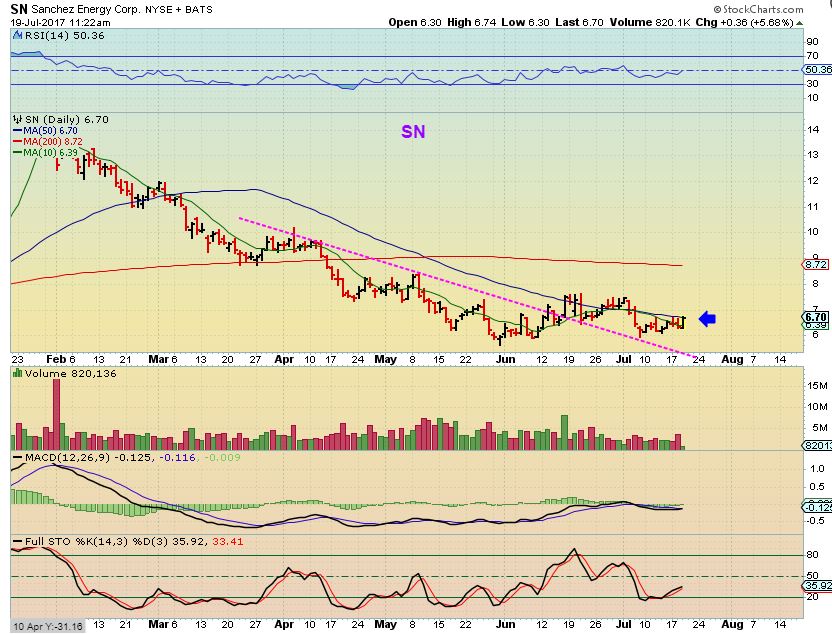
SN- This one broke out later and closed on the line too. This is a bullish looking base.
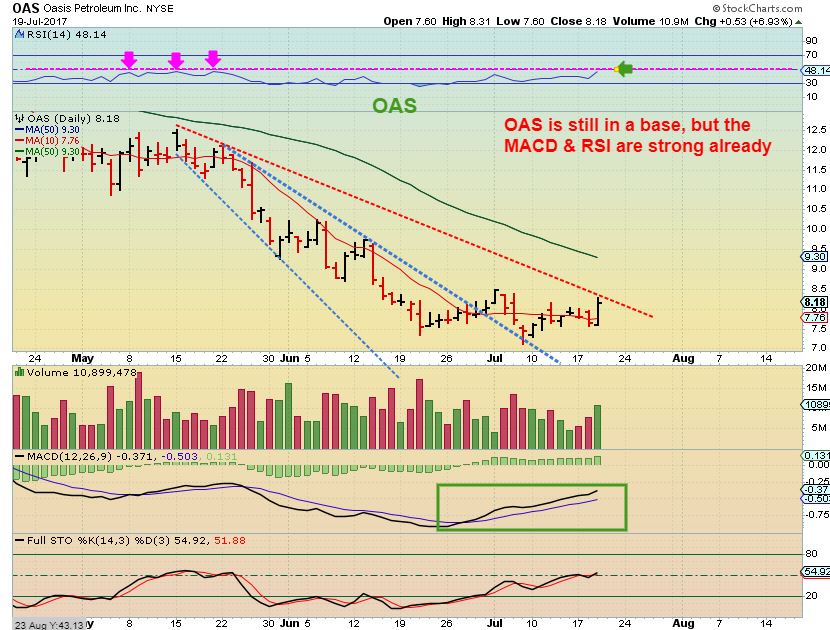
OAS – The initial blue sell off down trend was broken and back tested. This sideways base looks like it wants to break out.
You can look up these ones that I discussed too. Keep a checklist and look for the buying opportunity that I will discuss at the end of the report.

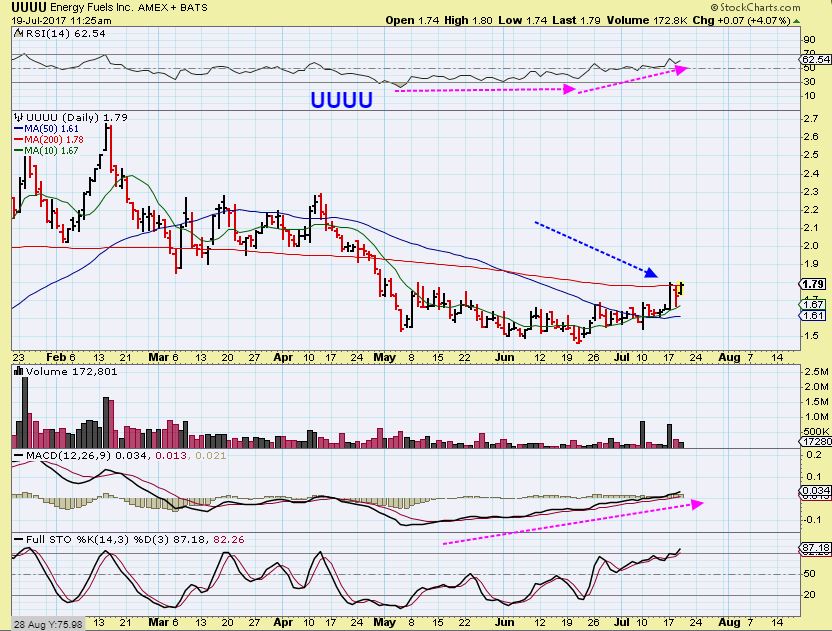
UUUU – I posted this one, simply because it has been in my reports and also looked ready to break out ( It did). I wouldn’t hesitate to buy this break out either, but like I said, I want to discuss a different method that I also use at the end of this report.
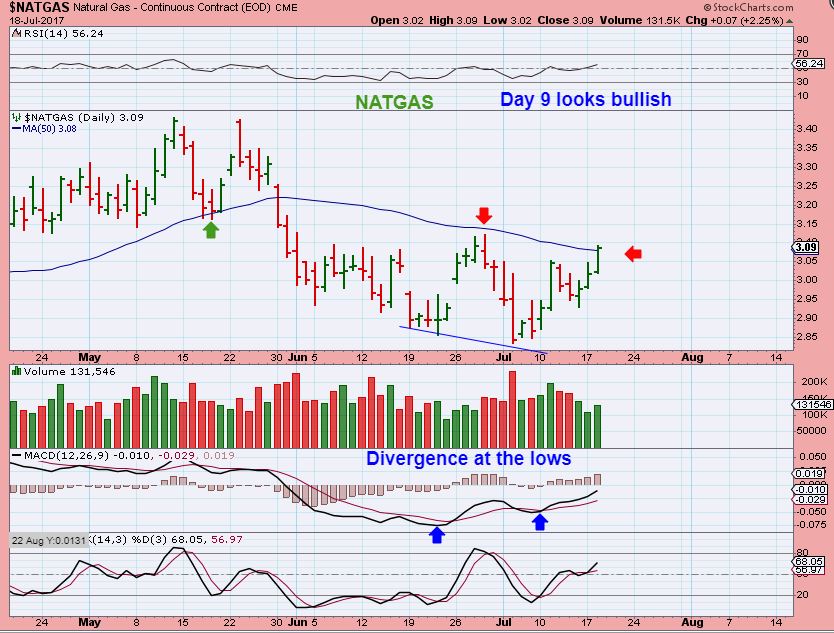
The NATGAS INVENTORY IS TODAY- AND NATGAS IS TRYING TO BREAK OUT TOO. This was yesterdays chart, today Natgas broke above and closed below. That is fine, it may succeed on the report today.
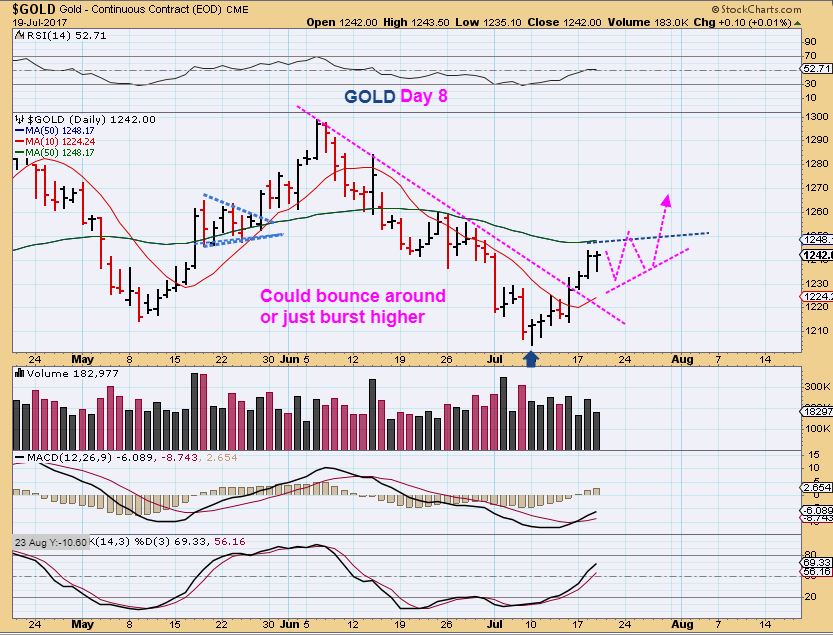
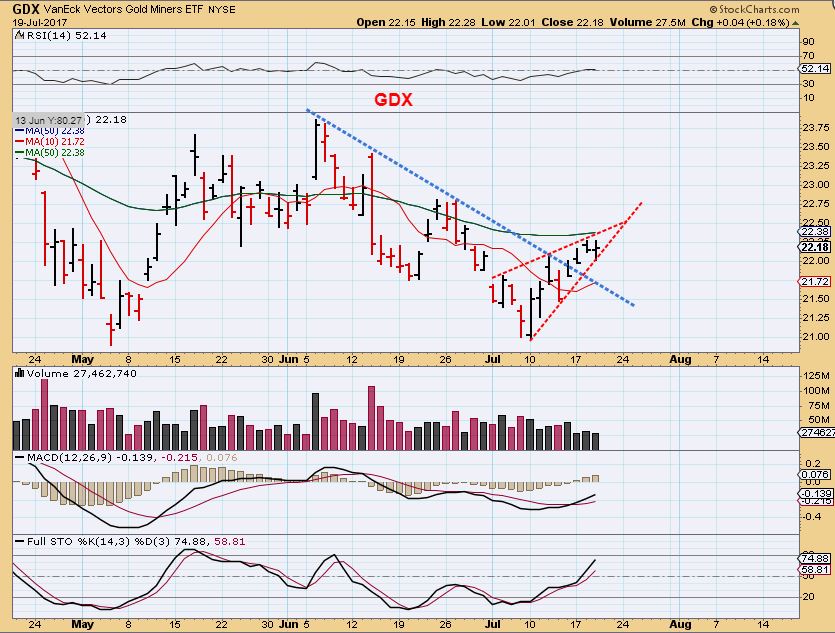
GOLD – This may just build up steam to break through the 50sma. I find the Miners are acting bullishly too, as mentioned in prior reports.
GDX – I do still see a rising wedge, so this is prone to a pullback. A POP above the 50 would change the picture, but for now this could drop , and possibly that would just be a drop to the 10sma, back test the trend line. I was holding a small leveraged position and sold it for this reason.
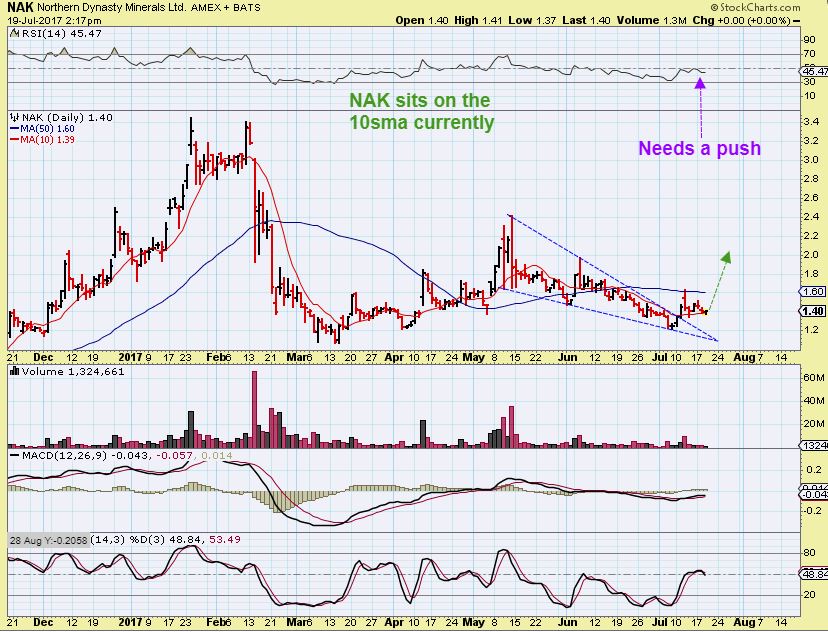
NAK – I dont want to get too excited, but NAK put in a reversal on the 10sma yesterday. With commodities running ( Steel, Copper, Aluminum) and Miners setting up, I can’t see how this wouldn’t run as speculators buy it up like they did in the past. There is more reason now to buy it than there was back then. Some may wait for it to trade above the 50sma again.
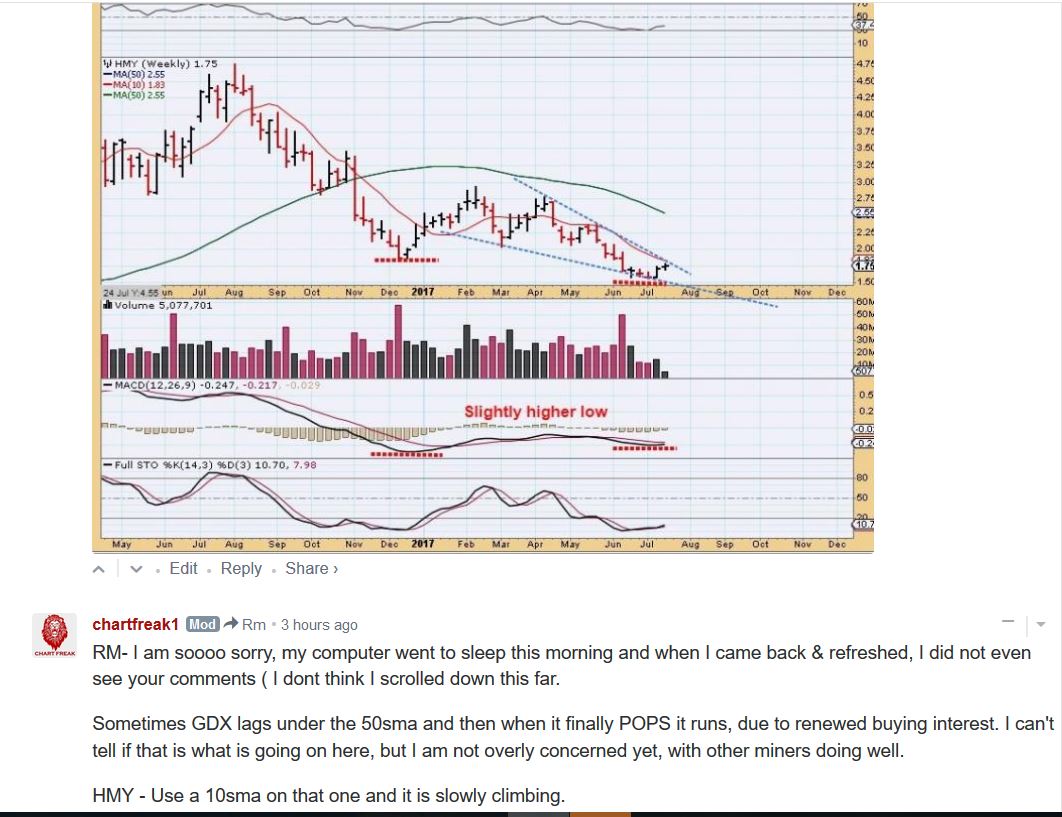
Finally a note to one of our commenters RM : I refreshed my comments page yesterday and I saw a question about HMY that was asked 10 hrs earlier. I am sorry RM, I didn’t mean to ignore it, I somehow missed it. I’m sure that I miss others, but he asked in pre-market and I was commenting all morning. So this was the reply to the question…
Summary:
So the General Markets gapped open and continue higher in bullish fashion. The NASDAQ has moved up for 9 straight days. If you own it, ride it with a stop. OIL put in a low in mid June and now we finally see many Oil & Energy stocks (XLE) breaking higher and perking up after being beaten down and gradually basing out. We have seen The Metals Sector bottom out a while ago and finding follow through, so we have traded CLF, X, VALE, CENX, AKS, HBM, TGB, WRN, ETC ( Steel, Copper, Aluminum, etc), and The Uraniums are now trending higher too. Solar stocks have been trending higher, and they seem to be in an uptrend. Please take a look at SPWR, FSLR, CSIQ, JKS. It has been a large variety of set ups finding follow through and now some are even beginning to trend. That offers trades to the more conservative! Wednesday saw Energy stocks trying to break out, and as discussed in a few recent reports, Miners could join the group.
This is great, because it gives us trades for all types of traders, higher risk and conservative. After signing off here, I will have a final lesson of sorts for trading this Energy sector. Today we can watch the NATGAS report and enjoy our Thursday trading!
~ALEX
.
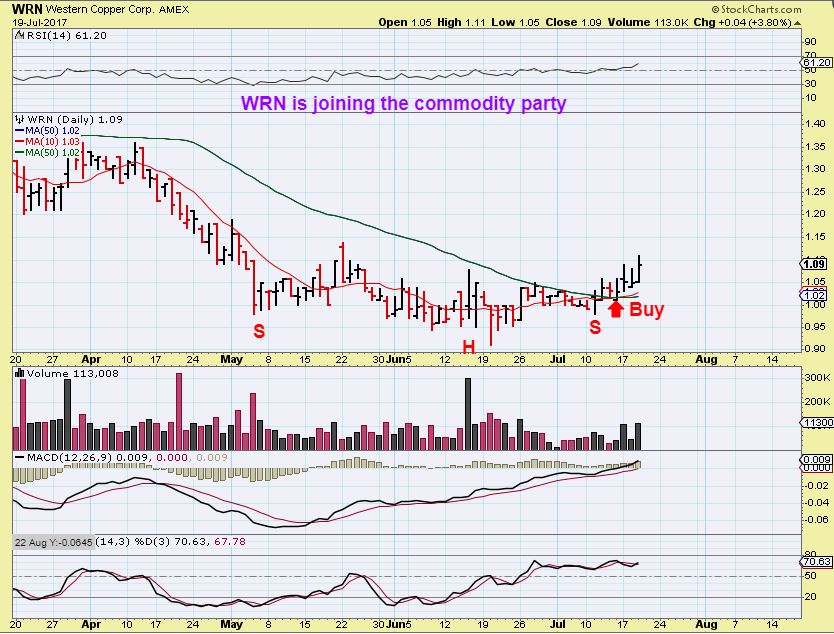
First I wish to report this series of events. I have been discussing WRN as a copper stock lagger. It is not exactly a lagger, it is consolidating prior gains and looks ready to run again. Lets look at the charts in recent reports…
WRN JULY 11 – Watch the 50sma
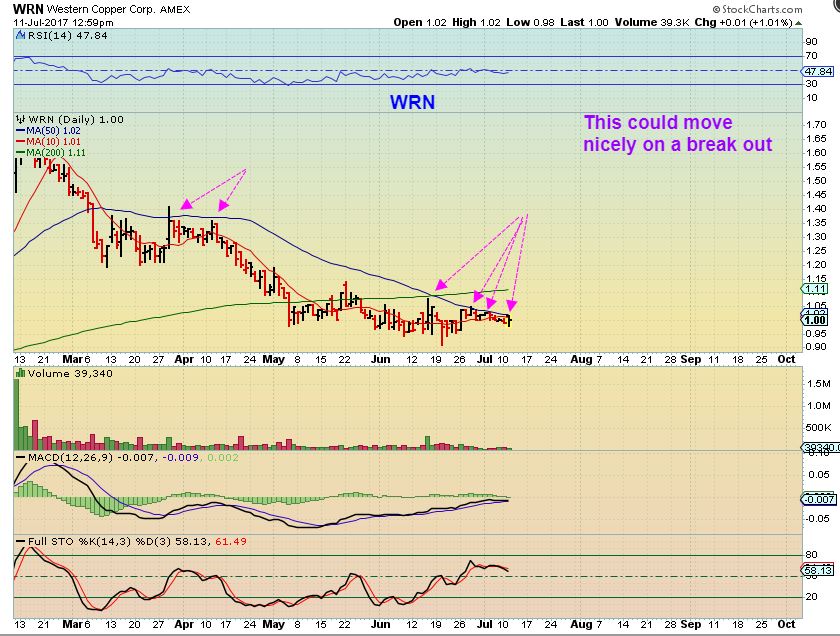
JULY 17 – Now above that 50sma – I pointed out that it is trying to move higher ( just a matter of time).
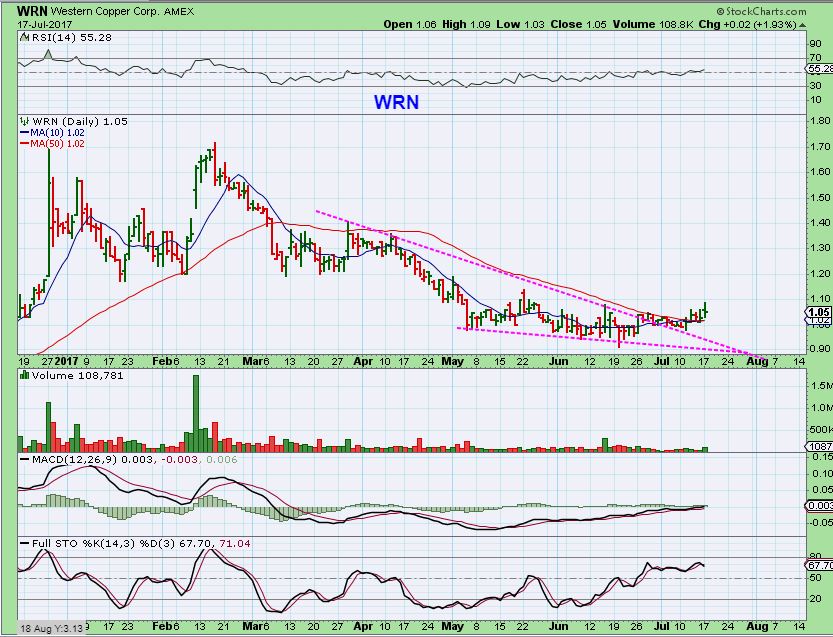
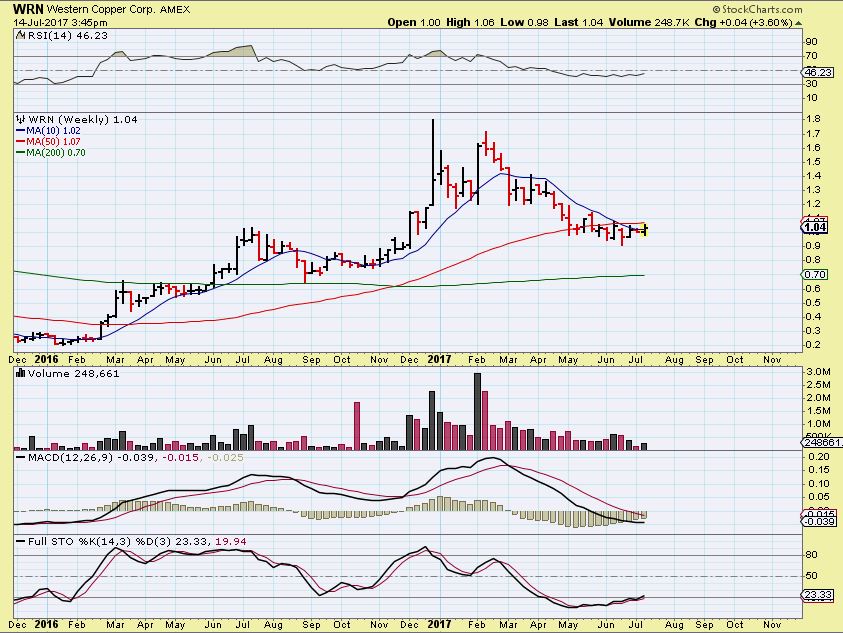
WRN – This was actually a weekly chart for July 14 ( weekend report) and a break above the RED LINE 50 weekly MA should be bullish. That is at $1.07
WRN – On Wednesday WRN broke above that $ 1.07 – volume is starting to swell ( you know I like that), so I say that WRN is a buy. It is moving a tad slowly out of this base, but when it runs, it can really run (look at the chart above. 20 cents to $1.80). TGB is in a similar situation, and I own it and added to it today.
………………………….
So we were discussing that many in the energy sector look to be ready to break out above the 50sma. That is usually viewed as BULLISH, and people buy that break out. I also will buy the break out or I even buy it before the break out if it is pushing on volume & has the right signs of bullishness. There is another way to take advantage of this sector, and it is for the more conservative. It takes patience, but that is what conservative traders posses. 🙂 let’s discuss that now and I will add a few more examples…
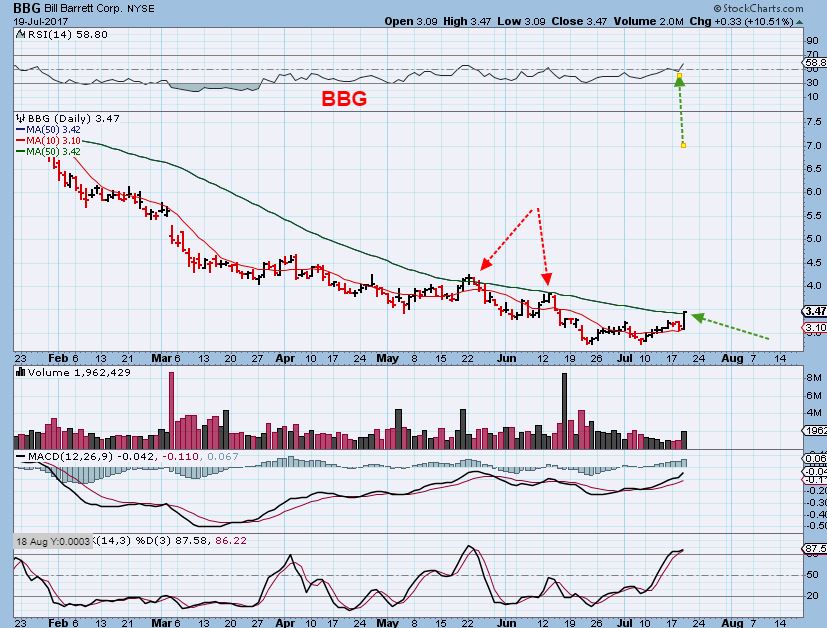
BBG – Ready to break out, and normally I would buy this here and add on the next pullback.
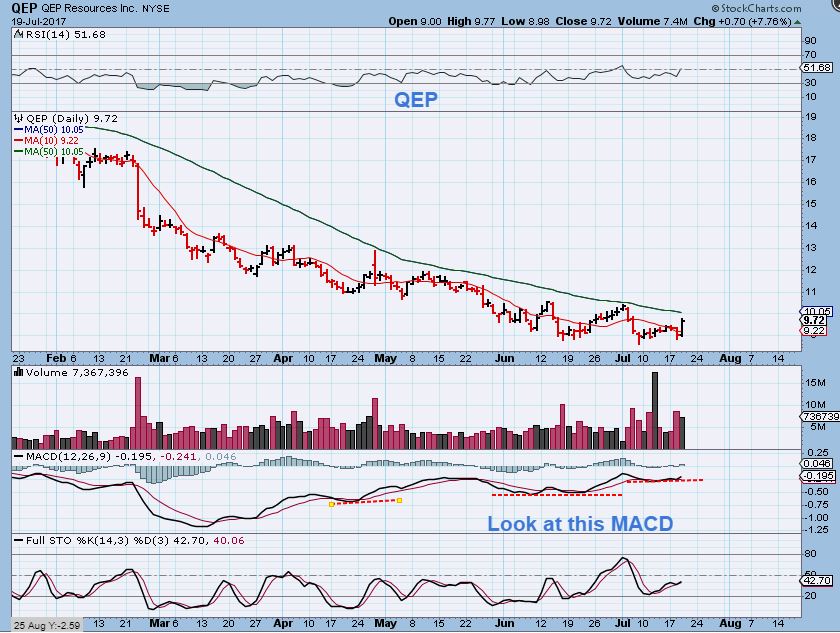
QEP – Just about ready to break out, and normally I might buy this here and add on the next pullback.
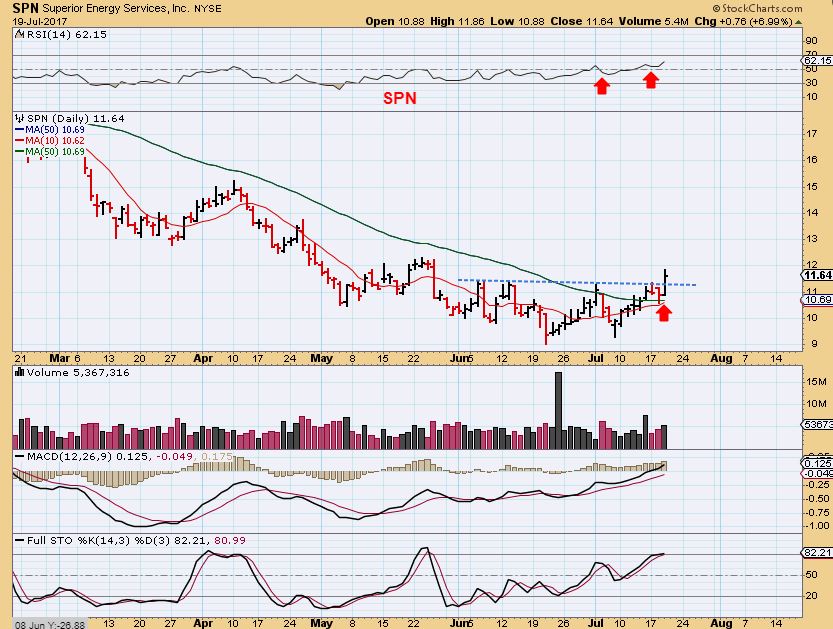
SPN – Breaking out, and normally I would buy this here and add on the next pullback.
SN – Ready to break out, and normally I would buy this here and add on the next pullback.
ERN – Ready to break out, and normally I would buy this here and add on the next pullback.
-THIS IS WHERE WE HELP THE CONSERVATIVE TRADERS-
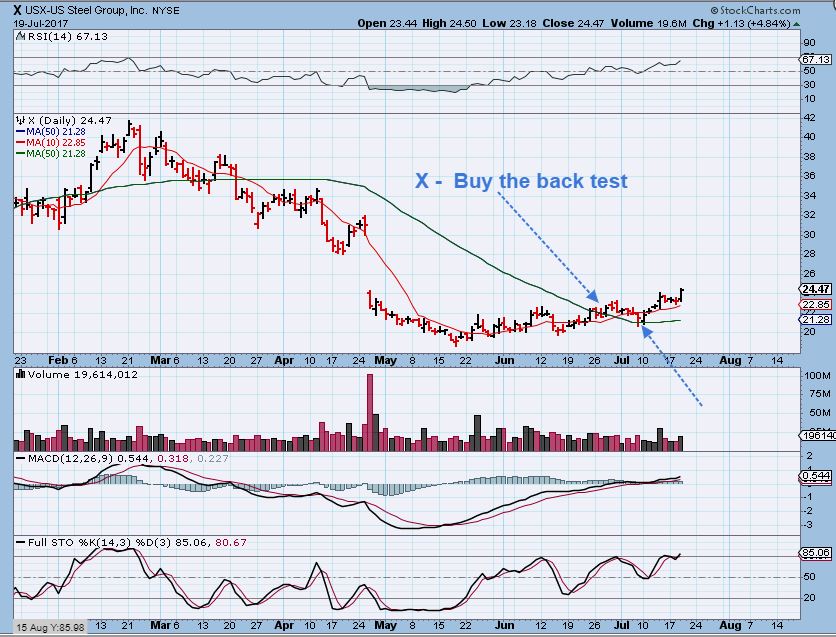
When a stock leaves it’s base and sets up to break above the 50sma, That is the buy for those that are a bit more risky. it has not proven itself yet though, and it can drop back under the 50sma and stop you out. To take less risk, we often ‘allow the stock to prove itself’, moving a bit higher, and then it VERY OFTEN drops back to back test the 50sma. THIS IS WHEN THE MORE CONSERVATIVE TRADER ENTERS THE TRADE. They buy the back test of the 50sma. Take a look…
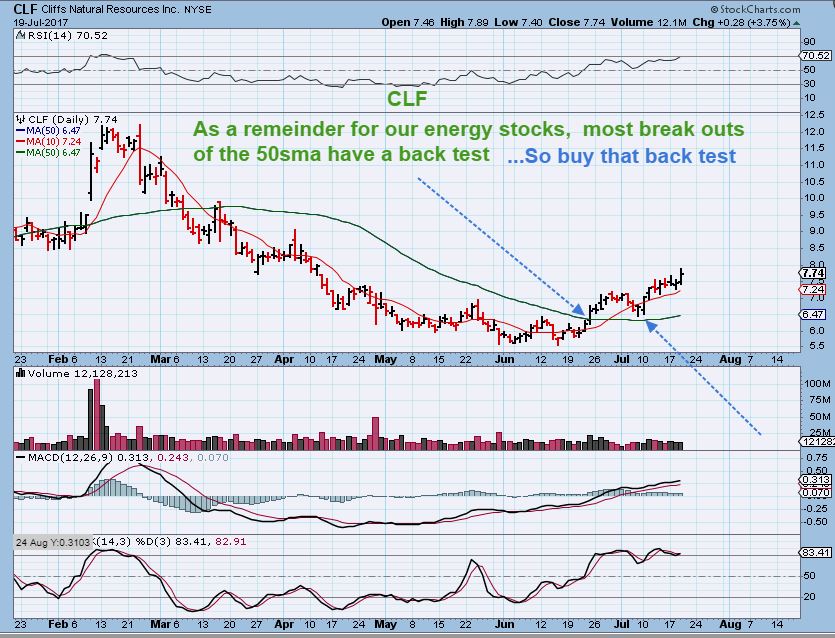
CLF – CLF broke out and ran for 2 weeks , eventually dropping back to back test the 50sma area. That reversal above the 50sma is a BUY for the more conservative trader watching a stock prove itself.
That 50sma area is also where I usually add to my 1st position.
HBM – Broke out & back tested the 50sma. That was a good buy for the conservative. This is also where I usually add to my 1st position.

X – US STEEL also broke out above the 50sma and dipped down to back test the 50sma area. The reversal at that area is a safer buy than the original break out. This is also where I usually add to my 1st position.
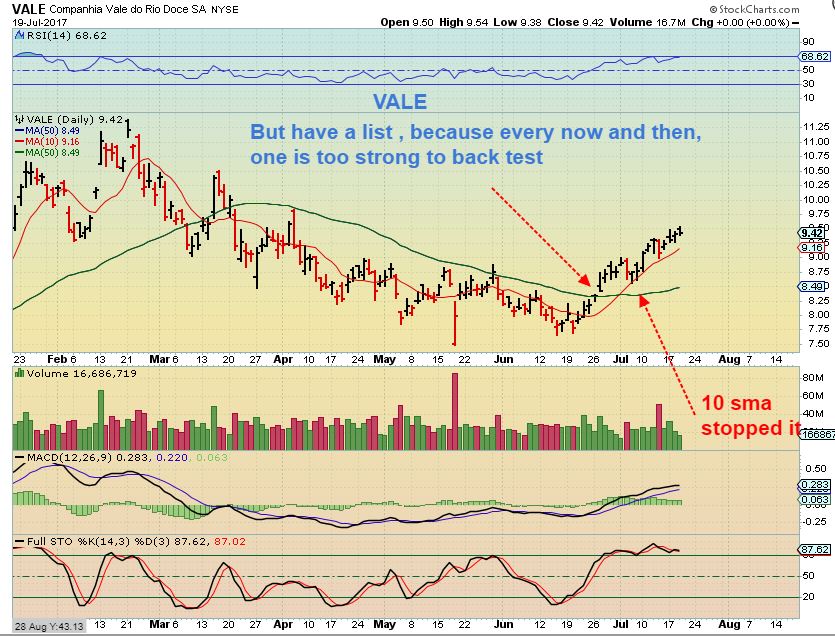
I DO KEEP A LIST OF STOCKS THAT ARE BREAKING OUT HOWEVER. The reason is that at times , the stronger ones may not come back to the 50sma. Vale is an example of that, it only dropped to the 10sma. In this case, you need to be watching several, and catch the ones that drop & tag their 50sma AND REVERSE HIGHER. It is a safer buy.


Thanks for the warning on TQQQ… I know I sound like a “permabull” sometimes, but trust me, I’m watching it like a hawk for signs of a rollover. As you pointed out, it can drop HARD and wipe out 1-2 week’s worth of gains in a day. So I’m always looking for signs of “topping.” Great report, as usual.
I haven’t even read Wed’s report yet. I gotta read 2 reports and sift through 157 comments. Gonna be a busy night!
Johnny, I’m trying to get me some TRCH now. Only got a partial fill earlier this week. Kinda speculative so keeping it small. $1.45-46 seems to be support and where I was trying to get filled.
Hi Cason, lately TRCH seems to sit on the 50 day sma. Lower volume stocks react slower to good news. It has been coming back to the $1.45ish area on a regular basis. Supposedly everyone is waiting on well results from this huge horizontal (8000 ft) high tech frac well they just completed. Also they have a lot of time and money invested in a giant lease in Orogrande. That said, since Feb. TRCH can’t seem to get past $1.60 for any length of time. Please do your dd.
I don’t want you drinking zombies at the beach bar because of TRCH! lol Have a good one!
I’m gonna be drinking zombies b/c TRCH paid for them! 50-day is rising, up to $1.48!
Go get’em Cason!
Ty Alex I actually did see it late last night when I had time to check the blog :).. still amazed by the pathetic lack of torque in gdx so hopefully that just ends soon in either direction ha.
Hi Alex. Very incisive and instructive report as always and always appreciate the lessons, especially for us more patient/conservative investors even when they are just great reminders. Started taking a look through a number of stocks you mentioned again today and maybe worth noting that quite a few seem to have earnings due in the very near future. I’m sure everyone does their own checks but just thought I’d mention it as something to be aware of given how some stocks move around earnings releases!!
True True
ALex, nice job. I appreciate the summary at the end and the trading lessons at the end.
Thx Bill
I have another method that is a bit of a hybrid: I am not always in front of a screen or am looking at a phone app so keeping track of the exact MA’s is not always possible. So I’ll start a position at your initial buy point and if/when it moves up, place a stop for half of my position (more or less depending on my “gut” .. which sounds vague but it comes into play)…. or sometimes I structure my stops in increments which prevents a total stop out and reverse…..
Then if I do get stopped out on that partial position, I get an alert and I then watch how what’s left plays out ….
I love a good plan
So Alex, based on your safe methods above, please let us know when you see the backtest.
I am only 1 man, but I’ll try 🙂
“If” I see them, I wont see them all, so keep a list and look for them too.
Thanks for the lesson CF.
Re: TGB, some good news, but pushback as well.:
Taseko Mines (TGB +2.2%) is up sharply after British Columbia’s provincial government issues a work permit authorizing exploration at the site of the proposed New Prosperity copper-gold mining project, which twice has failed to obtain necessary federal approvals to proceed.
First Nations leaders harshly criticized the permit, saying B.C. “disregarded the immense record showing the importance of this area for our culture and approved extensive ground disturbance for a mine that cannot lawfully be built.”
TGB claims New Prosperity will create $12.7B of provincial GDP and increase provincial revenues by more than $4B and federal revenues by at least $12B during its life.
Thanks for sharing that Nancy
UUUU is already running in the pre-market
2500 shares brother
So you are IN!
I got in 1.66 for round 2
Chant: giraffe neck, giraffe neck, giraffe neck….and we mean a TALL one! LOL
wow Mamia.. good choice on the HPJ
Thanks for the detailed report Alex. Do you expect a longer (ie weeks and month) term uptrend in energy given the energy stocks are just starting to break out? Or OIL touching the 200 SMA around $50 and turning back down? Thanks
I have been expecting a YRLY CYCLE LOW, so when we get that low, I do expect a good upside reaction for weeks / months with the normal pull backs along the way.
The energy stocks are pretty beaten down, so it might take some time to get them running.
FRTA – Keep on the back burner guys – explosive chart
I love what it did today BT
Keep it on the ‘front burner’
SOXX is starting to get a bit of that rounded toppy look to it on day 12
Welp – jumped the gun with MUX. Giving back the gains!
How tight are you keeping your stops?
Gnerally Im all mental stops unless Im going to be away for a while – problem was – I fat fingered my trade yesterday and was a market order… Filled and fell – HARD
Hopefully it doesn’t undercut – earnings Aug 4 btw
Thanks for the heads up
What I should have done was honor my stop fully from yesterday
That’s why I quit using mental stops.
bounced off the trendline and popped back to the 60s. All is not lost lol
While I 100% agree with Alex’s warning to be very cautious with TQQQ and the general markets because they can’t go straight up forever, I also want to mention that I’m still very bullish on TQQQ. The current P&F Chart for TQQQ has a bullish price target of $146! And it’s getting very close to another “double top breakout”
http://stockcharts.com/freecharts/pnf.php?c=TQQQ,PHTADANRBO%5BPA%5D%5BD%5D%5BF1!3!!!2!20]
I expect pullbacks along the way, probably down to the 5 EMA or 9 EMA on a daily chart, but I’m planning to stay long and ride them out (for the most part) because I think a strong QQQ/TQQQ rally is just getting started. As Henry Kissinger used to say, “Trust, but verify!” Even though I’m not a day trader, I check my short and long term charts every day looking for signs of “topping” and if I see warning signs I will try to post them here (if I’m available) .
FYI … TQQQ is currently a “sell” on my 15 min chart right now, so I expect it to drop today.
I will not hesitate to bail out of TQQQ and go to cash if/when my charts flip overall bearish, as I did last month when tech sold off hard.
The only reason I’m posting my bullish outlook is because I see so many traders (on other boards) losing money by shorting QQQ that I want to provide some “alternative facts” to consider. But what do I know? Check your charts and make your own trades. And keep following Alex’s excellent advice.
Good trading to all!
Thanks Steve. Currently a sell because its below the 9ema?
Bill, a very simple signal that I use for buy and sell on a 15 min chart is the 9 EMA and 10 SMA cross. When the 9 EMA crosses below the 10 SMA on a 15 min chart that is a “sell” and when it crosses above the 10 SMA that is a “buy.” I should probably rephrase that to “up trend” and “down tend” because that’s what I really mean. I have attached a screen capture of my trading platform so you can see exactly what I am looking at.
https://uploads.disquscdn.com/images/a2495d5f605cc881cd3092e8fbc5986341398f096d635cf81ec38b90c9f9ebdb.png
This is an intraday signal that gives me and idea of how price is moving during the during and it can flip back and forth when there is no clear trend during the day. As I posted above, I watch the 15 min chart every day to get a feel for the market, when I get a “sell” on the 15 min I look at longer charts. If they are still bullish I don’t worry. But if they start to get bearish, I start looking at cutting back my positions. I HOPE to hold for weeks at a time but that is not always possible in today’s markets, so I have to keep a close eye on it. I’ve been “all in” in TQQQ since July 10/11 and I hope to ride that for at least a month or more. But I will sell if/when the trend goes against me. I hope that makes some sense.
Thanks Steve
BTW, notice that the 15 min signal for TQQQ flipped to a “buy” as of about 11:45 AM (ET). That shows how fast the signal can change … and it also shows that this is a strong bull market with buyers stepping in on almost every dip.
WRN – No vol but making moves
Lighter than I like, but the set up & sector are good. I do like it –
I guess we can keep hoping for increased vol on the way up. 🙂
this is looking good. all the Silver miners are dropping in unison and could give that nice confirmation of a higher low and maybe the perfect buying opportunity in a few days. Too bad this moment in time is on a collision course with earnings releases.
The problem is that the $Dollar pretty much HAS to strike a low here shortly.
CF, is AKS still a buy on this pullback?
Yes, it looks good above the 50sma, bounces along the 10sma & MACD rising
Bull flag ?
Wheres Mama at? DNR… Reversal candle yesterday?
always watchn her…. 😉
I never played it till u mentioned it… Not the biggest one, but its been a mini ATM machine.. 20-50$ scalps… But i want that above the 50 for a nice long ride
Gold spiking
Euro is testing highs of 2015 & 2016
With US$ down so much today, it’s surprising Gold isn’t popping
Gold is popping – check chart 1247
Hi BayTrader,
Sorry, I wasn’t posting that in response to your post – I see it just happened to follow yours. I don’t follow all the comments very well when I’m busy.
% wise, it just seemed that the whole gold sector would normally be screaming higher when the dollar falls this much at one time. Currencies are supposed to be sleepy movers.
I agree with Cal. I’m in a bit but still under exposed PM miners bc of this.
ALEX….. YOU make my day! Excellent said, and it make sense.
I will try it out my teacher!
THANKS A LOT.
Thanks Geurt
FWIW … following this pattern in URRE… today would be D day… will see if it continues to follow down…
https://www.tradingview.com/x/rmNA3AY6/
it is taken from here…
https://www.tradingview.com/x/W4BzBh81/
I ain’t going down with this ship again, even if it does resurface later!
TWTR .. keeps on keepn on…. dang
I think my CY consolidation is just about ready toooooooo
WPM (old SLW) finally over $20 today.
Looking pretty good on the daily chart; hope the gains hold today.
AUY pushing on that 50
Looks like it has broken above the down trend line of the last 4 tops since mid April.
RIC definitely above its down trend line of the last 4 tops since mid-April.
wow some bios… labu… srpt .. maybe juno next?
hmm … flat top break in ESPR…?
AUMN wants a piece of that 200day…
If we could just figure out this rotation – today the hot money is slopping over into Bio’s and Silver Miners. Tomorrow it will do what????
Where’s Pecos???
LABU, getting with it!
Hey guys check out CHFS. I have been in this for the past month or so waiting for this to move out of base. It may be starting that move. It is a pharma, soooo be aware of that. May ad to your watch list. Alex, perhaps keep an eye on chart. Thanks all!
Interesting chart and company John.
She broke one of her TL’s up this morning……so maybe worth a shot, do not like the money flow though not to mention her net margins…..
Thanks…..
I agree – I like the way it is stretching out and staying above the 50sma after that strong break out.
Earnings soon for these [source Merrill and nasdaq list] : NGD July 26 after, VALE July 27 before, EGO 27 a , CLF 27 b, CDE 27 a, AUY 27 a, ALO 31
Lightening up on CLF b4 earnings? Last time it was spectacular. But that doesn’t mean it will happen again!
GPL sold ….. sad display of strength with Silver’s up wave. Broke even.
Ah yes, Great Disappointment Silver! But even is always better than…
I’m watching TRX real close – could this turn into a squeeze??
I joined arms with MAG – a silver mine getting ready for first production in 2018. Staying green on really low volume – what Livermore calls the path of least resistance. I figure this one might be a little safer to ride through earnings because it has none! Plus it has no need for a financing
ditto NAK
Rob McEwen at MUX very rarely does a financing, and when he did and I was a shareholder, it was a private placement and he gave shareholders first shot to participate. He also owns 25% of the company and doesn’t make a salary, so I feel he won’t dilute his own holdings.
Just pointing it out bc dilutions are something I am also very concerned about, that’s how I found MUX.
Hi, Alex
Do you have time to give an opinion on EUR/USD ?
A 1-hour chart looks like a bull flag, but it sure is hard to image adding another flag-pole length of 1-3/4 cents, especially when going into time that an ICL is due
Stopped out of SN for a loss. It started going down the minute I bought it.
looks like a crappy slamdown shakeout..
had a similar retest back in feb2016, though not quite as extreme.
not selling yet, but SN drop negated my WRN rise for the day though
https://uploads.disquscdn.com/images/78e307fb0b73db337ca87ba8d2b8efe4afee70552f037760c57c902d3faee227.jpg
WRN baffles me. No volume and the thing flies.
probably. tomorrow.. SN bounces back, and WRN drops like a stone… and i go nowhere fast once again
Ok, now THAT was an ugly candle! I know Alex and others are excited about the trading right now but I’m still keeping everything pretty small for the time being.
This may be a tad out of line but I was wondering if anyone would like to share what kind of position size they go in with? My starters vary from 100-1000 shares depending on the size of the stock. And positions vary between 500-10000.. I know these are huge differences but I feel depending on the type of stock and size of it, position size matters… I constantly see 10k order go through on certain plays as well as 50 shares or 75 shares… And it makes me wonder… Why would you buy 75 shares of a 6$ stock that moves less than 50 cents before you sell..Just seems like a lot of work for 25$ after fees…
Alex, do you still follow the Rare Earth metals group? http://www.zerohedge.com/news/2017-07-20/rare-earth-mania-and-chinaus-trade-spat-20
I follow a couple of the stocks, but they have been tame ( or lame) lately.
hi is an oil bottom close ? thank you
when is oil going to bottom so I can buy?