
Wed June 28th – Buy The Dip?
Buy the dip? I would say that one might want to be careful when choosing where or when to enter this time.
.
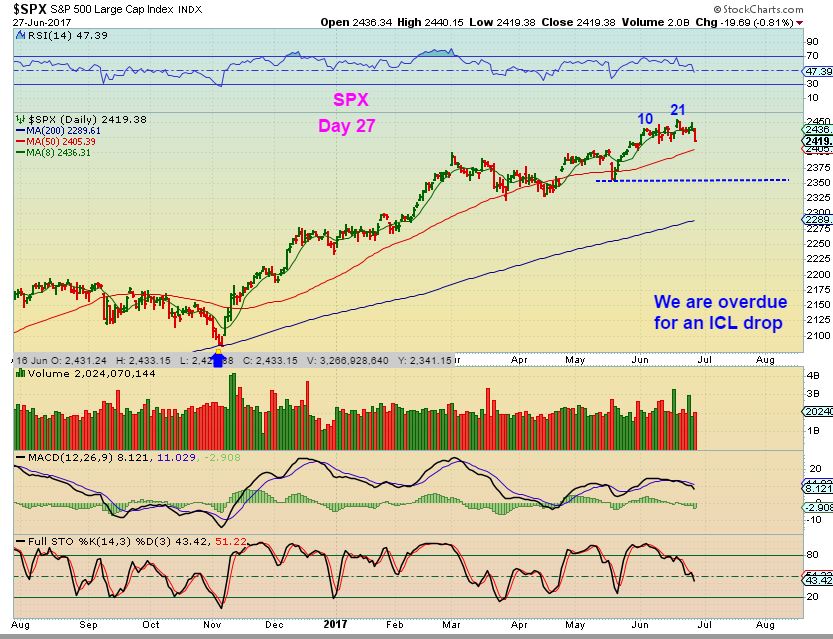
SPX – It is day 27 and there is time to drop further, but we are also due for an ICL (overdue), so this could drop even further than many expect in my opinion.
QQQ – Yesterday I pointed out the MACD on the QQQ ( Nasdaq too) . This looked ready to drop.
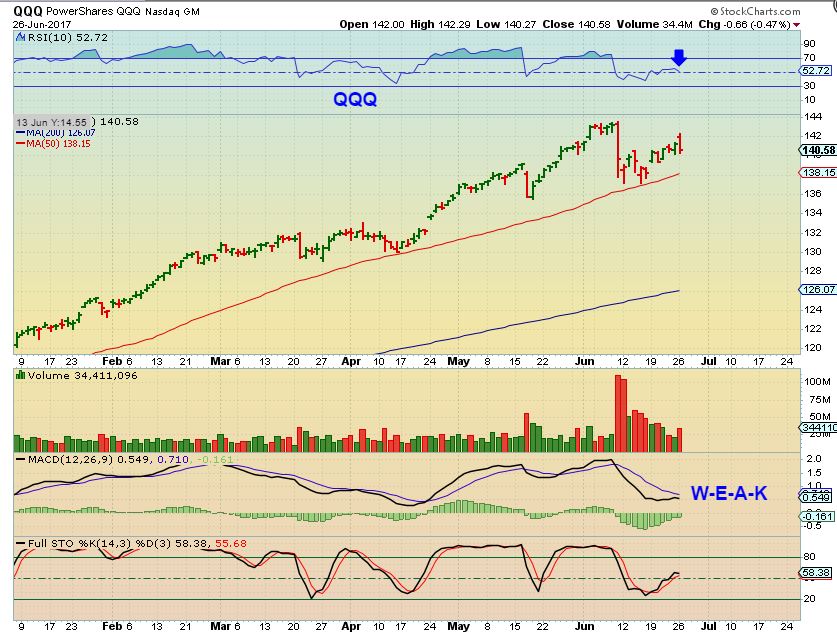
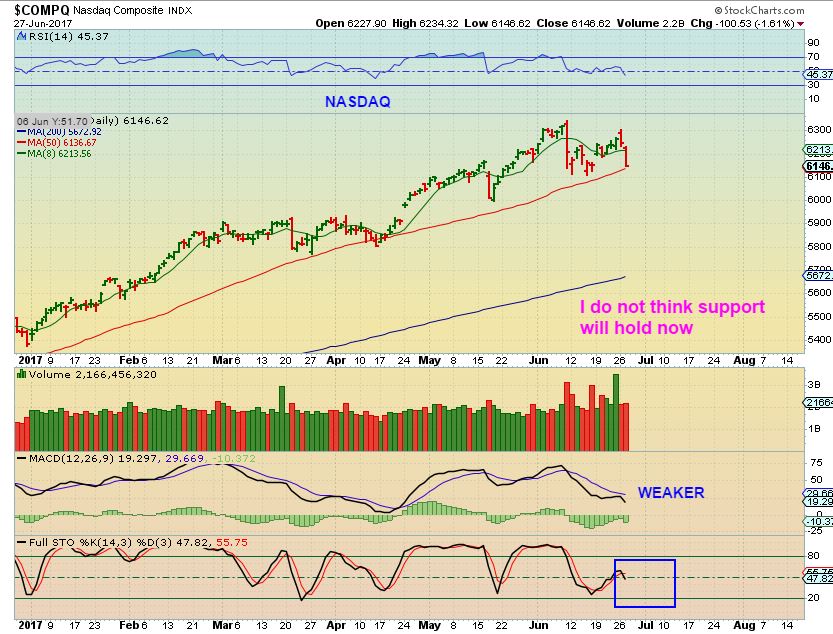
And drop it did. The NASDAQ actually dropped 100 points. I’m not thinking that support will hold for long, since we are due for a deeper drop and the stochastics is not even close to oversold. Many may buy the dip and that could cause a bounce here, but we are overdue for an ICL, so caution is warranted. Let’s look a bit further for an extra cautionary measure…
Some of the BIG TECHS that are the leaders are looking weak at the highs. Even AMAZON looks a little overdone. That double top high was not followed in the MACD or RSI. That’s a sign of Weakness and the stochastics is overbought..

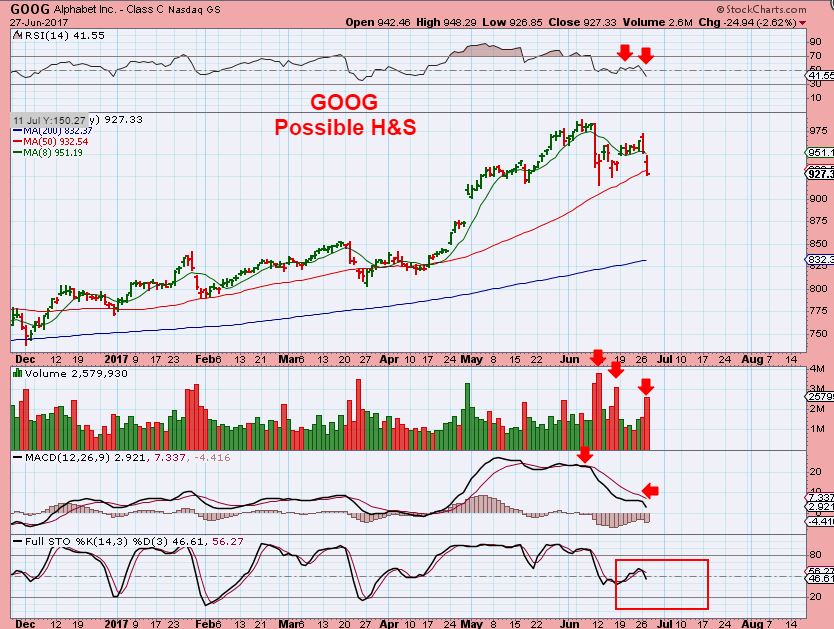
GOOG – Possible H&S , Notice on this chart that the MACD is weak , the RSI broke down, and there is room to drop in that staochastics.
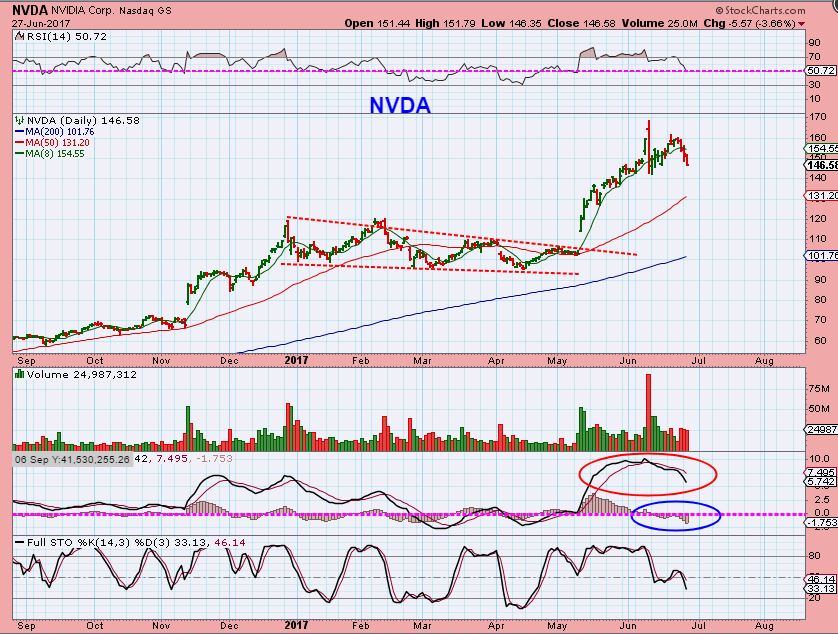
NVDA – Same here
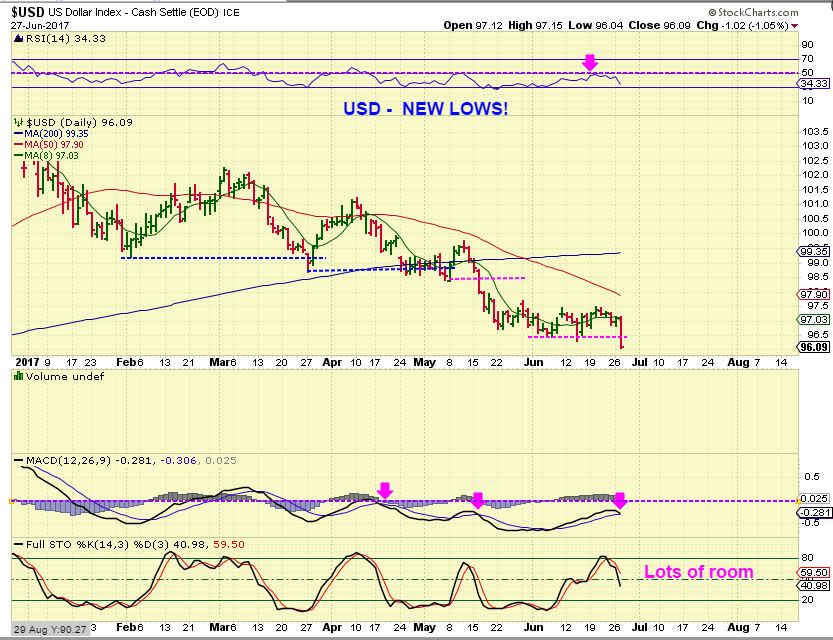
The USD plunged on Tuesday, making new lows. This has been very weak, and yet GOLD, Silver, & Especially the MINERS did not explode higher as one would have expected. With the USD dropping like this, GDX looked very weak , as you will see.
WTIC – We got our confirmed swing low and Oil inventories are released on Wednesday. OIL looks like it wants higher prices now. So I was surprised to see Oil stocks not really perking up…

OIH & XLE both looked surprisingly very lack luster. I will view this as a warning until I see this change.

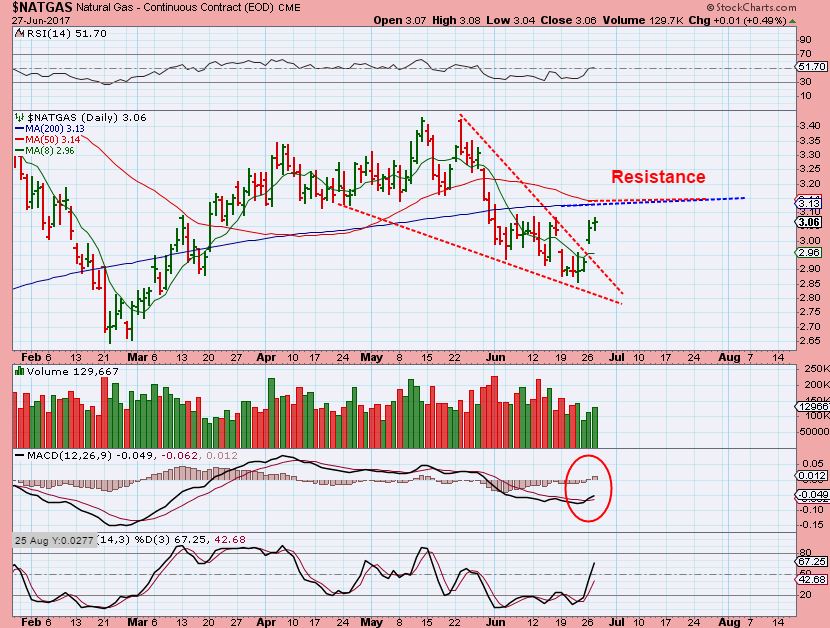
NATGAS – NATGAS is higher in premarket this morning. I called for a log at the recent lows, and I see this as day 4 today, but notice that we are now approaching resistance. Thursday is Natgas inventory, so by then, maybe we’ll get rejected at resistance or a burst higher. Time will tell, but I am thinking that Feb was the ICL and if this daily cycle meets resistance & rolls over to seek out the next icl…
BACK on and before June 9th, I was pointing out a possible H&S forming in NATGAS here on a weekly chart. Lets revisit this idea now, since we are at resistance this week…
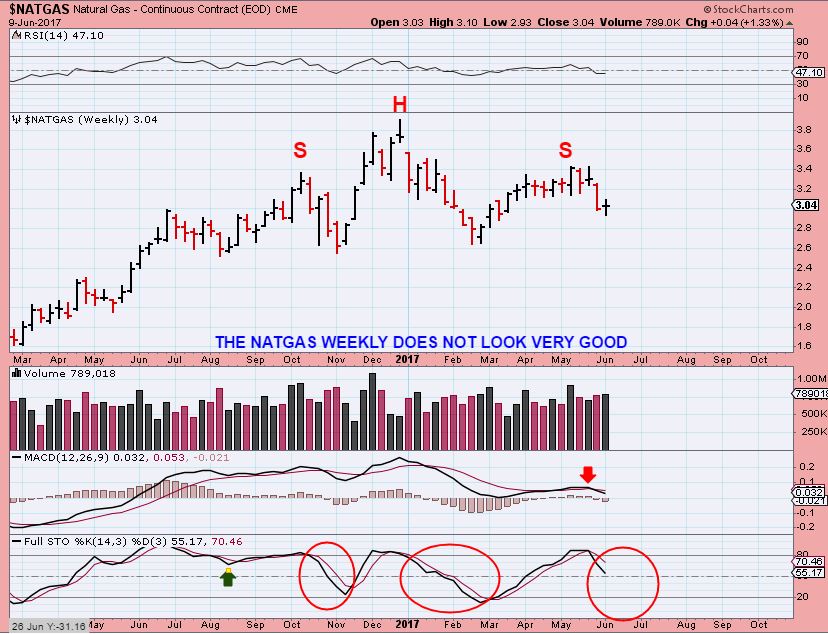
At times you do get 2 shoulders & symmetry in an extended consolidation, so this is something to keep in mind going forward during this newer daily cycle. Is it just another daily cycle ready to seek out an ICL? If it cannot break above resistance on that daily chart, it can roll over. The weekly chart has resistance too as seen here with the 200, and 50 ma. Natgas could have limited upside , we should know on Thursday.
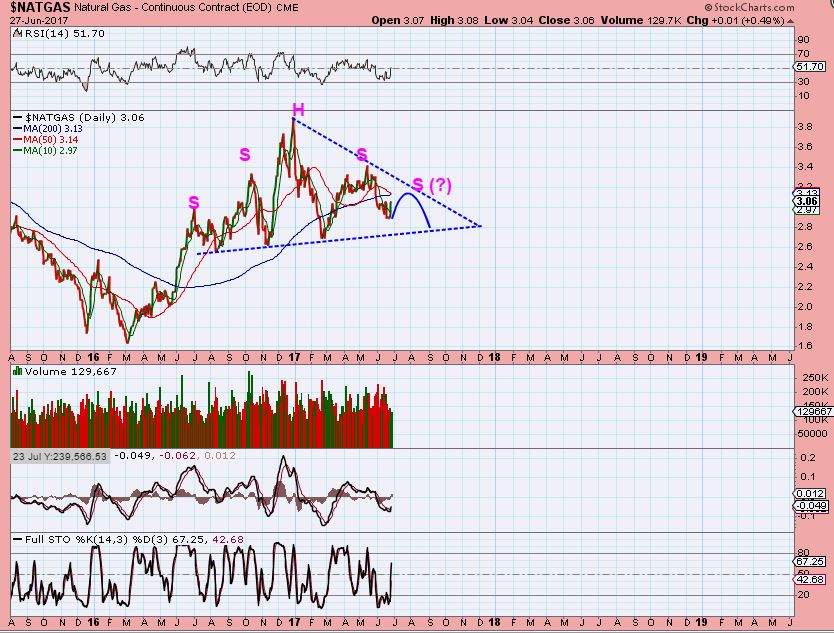
You may want to avoid being overly leveraged ( UGAS, BOIL) going into Thursdays inventory report.
GOLD – The chart says it all, please read the chart.

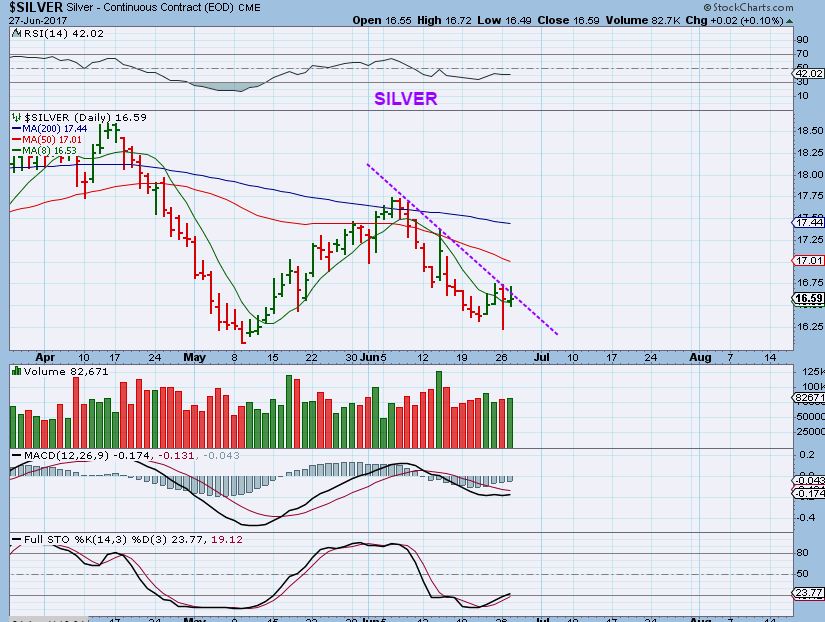
Silver – The same applies here
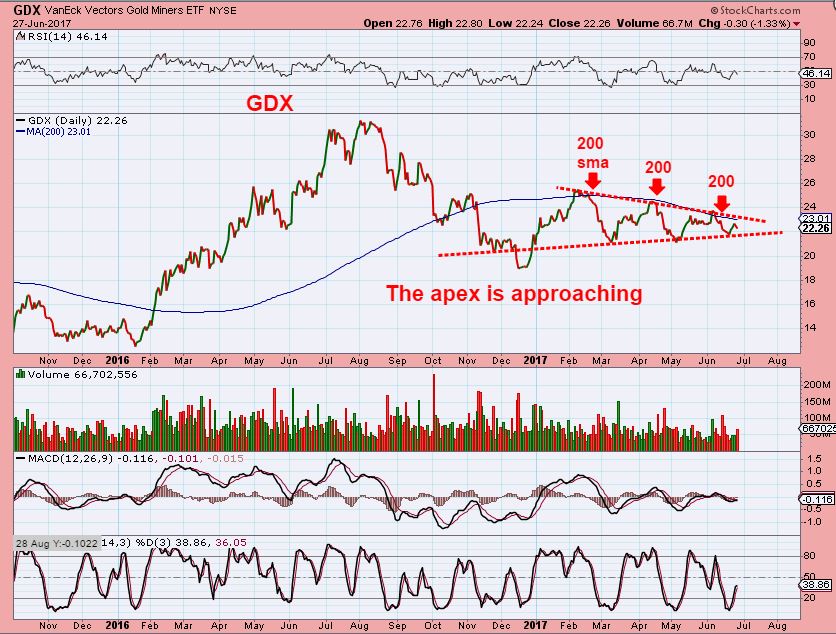
GDX – This was very surprising with the USD dropping to new lows. GDX has the appearance that it wants to break down. If this leads the way down to an ICL sell off, it may have peaked on day 3?

So I still like the looks of Commodity stocks and the Solars so far. The MJ stocks seem to be fine, each doing their own thing. I’m expecting the general markets to continue selling off or chopping around for now, and Tech stocks are showing signs as seen in the FANG stocks, so I’m staying out of that area and will look at set ups after a sell off.
When it comes to the the market action for Energy and Miners, it is not very clear. Oil looked good and XLE & OIH did Not. GOLD & SILVER had a little pop Tuesday as the USD got smashed down, but GDX sold off. I have not felt comfortable either being long & ‘loading up’ on miners, or ‘shorting’ them.
How can it be that Miners look really bullish 1 day and then bearish the next? Do I think that I know the reason? Yes, I think that I do. I have explained it in the final part of this report, and the good news is… that mystery will be resolved soon too. Enjoy your Wednesday Trading!
~ALEX
How can the MINERS look good one day and ugly the next? It seems to me that this is always what I see when something is trading inside of a triangle consolidation. There is no trending direction, so choppiness is the day to day action. Take a look at GDX again, the closer that price gets to the apex, the more confined it is. It does not have room to just take off until it breaks out.
GDX is running out of room and as it gets to the Apex, it will break out soon….
DILEMMA 🙂
Triangle patterns are known to be “Continuation Patterns’ – meaning that they will continue in the direction that preceded it. Read the chart…
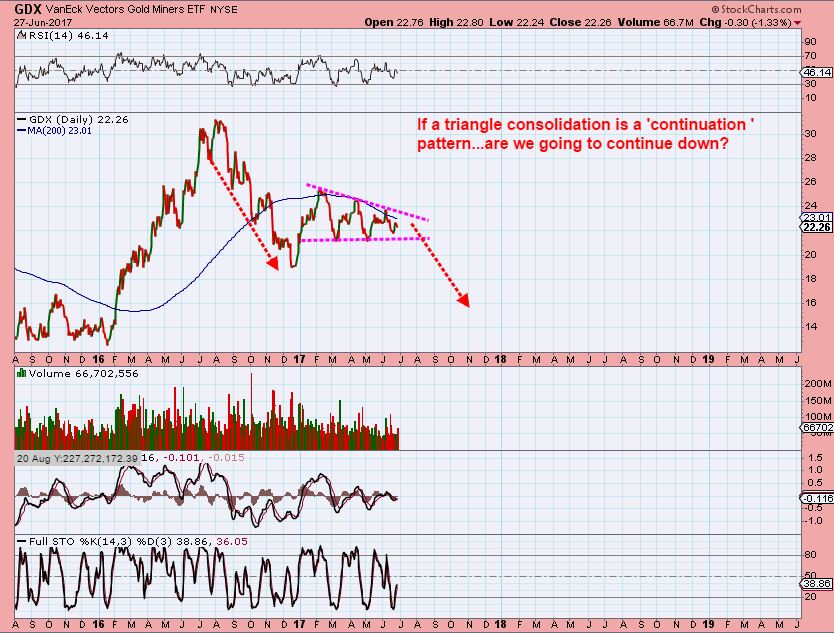
GDX – or … read this chart.
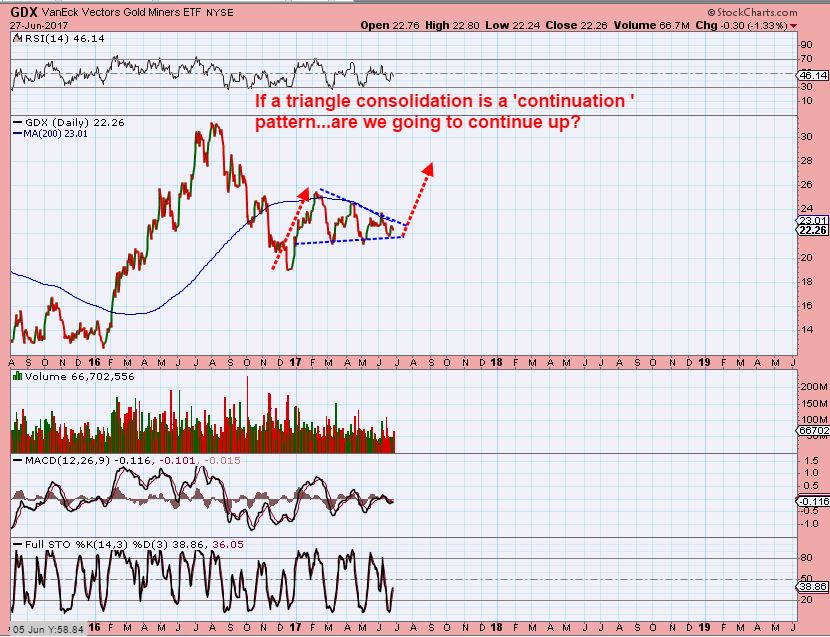
Stay tuned, when this breaks out, it should lead to a strong directional move.

OWCP – This looked ready to POP , so I reported it yesterday with 2 charts…
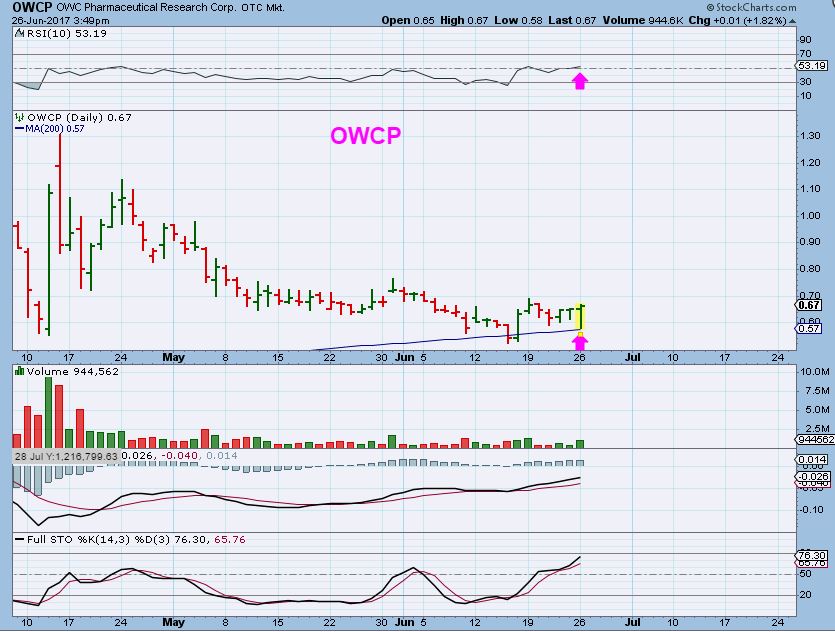
OWCP – Yesterday this stock rocketed higher in the morning, but in the past, it has also dropped back down, so I drew this at 10:30 a.m. when it was up 20%, and it went even higher, over 30%
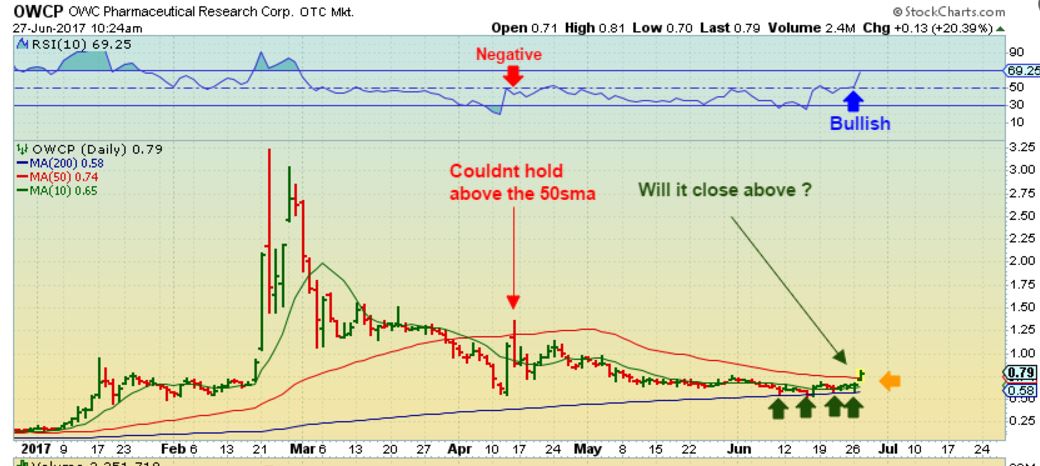
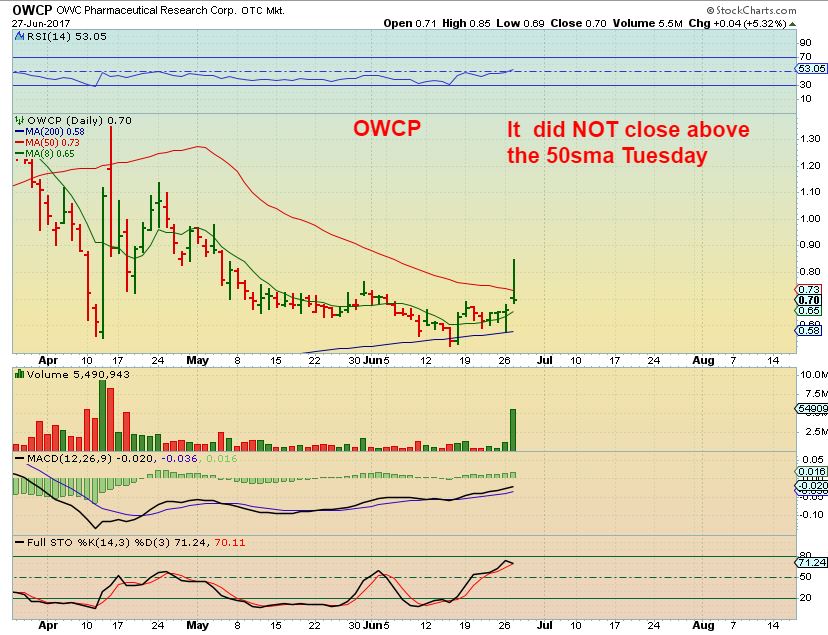
OWCP – I had to leave for a few hours and missed selling for a great gain, OWCP dropped back below that 50sma, as I was afraid of. We’ll see if it can close above the 50sma today or was that it for now? I am holding on for a bit longer
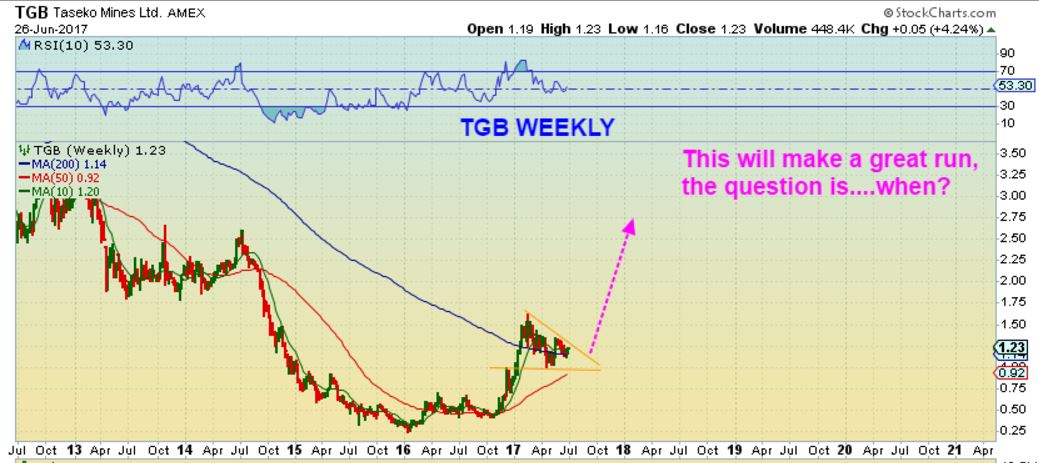
TGB has a nice weekly chart, keep an eye on this one when it decides to run. This is a weekly chart, so it could consolidate further, but this is quite bullish so far.


I agree with most of it, good job Alex, I think we are on day 3 of a new 5th DC in Gold, I expect a break lower soon, LT. NatGas is at resistance, we should know soon if it can continue higher. OIL, I think is breaking out and the rest of the sector will follow soon. Thanks for the report.
Thanks Bill
Bill, do you have a chart that shows your view on gold going lower that you could post?
I’m neither long nor short here, I have no dog in the fight. I believe we are starting a 5th DC day 3 or day 5. Should be LT and weak. AB=CD pattern (purple lines) with a bear flag consolidation. Gold actually hit my 78.6% target but things are so weak, I think we go lower. USD got crushed Yesterday and Gold did nothing. Nobody knows for sure, just a guess, my 2 cents.
https://www.tradingview.com/x/4M4tshqb/
Thank you so much for this chart. I have just been feeling this weakness and trying to understand it. I am reticent to do anything. This helps as I see your “count”. I do not know much about them but I find it helpful to see possible expected direction. Thanks for sharing this.
Alex a few weeks ago you wrote something I thought was so important I printed it out and kept it on my desk. It started like this “It’s funny, all of the times that I’ve expected sell offs into an ICL they all seem to differ a little bit, but they also feel the same. It feels like it just wont sell off right before the selling starts and then when it starts it feels like it is time to jump in almost all the way down then at the very lows, it actually becomes hard to buy because there is always the feeling that it could go lower one more time” and there was more, but maybe we are getting to that point??
Yes, I remember writing that, because it has been true. It feels like it just won’t drop and then the bottom falls out and the drop is scary deep at times.
OIL putting in a confirmed swing low usually indicates that the lows are in place for a while. I was surprised that XLE & OIH did not respond, so it is possible that this one rolls over too. I remain a bit cautious until we get Energy stocks to join the party.
Hi Alex! I came in late last night and saw your UCO chart and I decided to take the trade. I caught it at the low of day with a comfortable stop. So far so good! I appreciate it. I also am in TRCH, an E&P oil co. that’s not sinking in debt. They did well today too. Hello everyone! Thanks again….. Check you later.
ALEX, which way are you leaning for GDX? The timing suggests we are due for a little run up, given the last ICL in gold was in December 2016, but we never know. Keep positions light?
As I’ve been reporting, triangles keep things ambiguous. They obscur cycles, and I have seen this in the past, that is why I posted that lesson from the 2015 triangle in Gold, when Silver broke to new lows and Gold held higher lows, etc . Triangles are consolidations that alter cycle counts at times and cause different reactions that normal times.
Was that an ICL in May? Or is one just ahead? The triangle obscures that
In my reports I have been trying to relate that It is better not to lean TOO HEAVILY one way or another without the markets telling you the answer, and they do not speak very clearly inside of a triangle. I even said that I have not been comfortable long or short in Miners at this time.
Break outs can be bought with a tight stop, in case it is a trending move. The tight stop in case it becomes one of those throw over / false break outs in 1 direction and then a trending move in the other.
Took a half position in RAD (Rite Aid) at the bell… Holding nicely at the 50.. May just be a quick play for me today… But will def leave some on the table as the chart looks great
I looked at that when it scrolled by on the CNBC banner Monday due to the big POP.
I like that chart too, and it kind of looks like a back test of the 50sma. Even if it bull flags here, it should then move higher.
50sma*
Yes, I corrected it, but you might have to refresh to see it 🙂
RAD trhu 4$ wooohooo
i saw that yesterday… walgreens wants to buy it..for $7.50 or something cray cray….
nice……….
Looks like it wants to run to $6 over time. It is a good looking chart
‘ANY’ – a 3-D stock up 30%
NOTE:
I mentioned that sold my CSIQ & HELD ON SPWR – they both looked like BULL flags , but they also looked like they did last Feb. & price dropped again then. Noticing that , I sold CSIQ & HELD SPWR just to see if this was a bull flag & break out from that base? Or would they just break down like February.
SPWR is now breaking out from the bull flag and Base- this may have follow through to the upside….
SO I may re buy CSIQ if it starts to do this too, or add to SPWR.
Refresh
https://uploads.disquscdn.com/images/145b125b0774d247b6470a0b5ff4015c803d38ff85a6076ab1e166b1cb3e49b8.jpg
I ended up adding to my original purchase of SPWR so far at $9.65
JKS kind of looks special too. On a 3 month chart. Bull flag?
GMO looks goood
u rock charfreak…
ps. NAK is mad at u…. lol
I am mad at NAK too.
I still own some, but it can do better than this 🙂
URA and other uraniums are mini-bull-flagging under the 50sma on the daily. Their RSI(14) bounced off the 50 and is turning up. Just an observation.
https://uploads.disquscdn.com/images/e99c13ef8d91f8300652b24bbdf05791645e18fb15510cac75926284cfcfcde7.jpg
I like it , thanks!
I have mentioned it in reports, and I have been watching CY ( And AMD) for a long time.
I think CY is going to be a winner after this huge consolidation, and today the volume is really exceptional in just the 1st 1/2 hr.
I think this may finally break out
https://uploads.disquscdn.com/images/6bcf6404018ccae46d47f5f4daa4202dd2628180fd1a2e47e15ea612ca5408b3.jpg
oooooo very nice ……………
Its a good one for the longer term investor too.
For traders : Biotech – Check out TROV on a 10sma and 50sma.
That was only up under 10% when I was looking at it…its up 20% now.
These biotechs really move when they move.
I’m hating the action in gold today. If this is a new DC (2nd), gold/miners should be ripping today. How often does a 2nd DC linger like this??? Traders should be shooting themselves in the foot, at this point, for not loading up. As per Alex, things are very unclear.
what was that the just happened to crude?
Some report came out at the bottom of this hour. Forget which one, and too lazy to Google. 🙂
Here is is: https://www.investing.com/news/commodities-news/oil-prices-higher-after-supply-data-shows-drop-in-gas-stockpiles-500116
India new GST tax on gold officially starts implementation on July 1. Jewelers doing wait and see
for a few days then should start buying again in India. This has slowed gold down.
I highly doubt that….but whatever.
Are the royalty companies leading the miners out of this consolidation phase or is it just more of the same? Check out the daily charts of these 3 companies. FNV is similar. https://uploads.disquscdn.com/images/024f6d7e3fd9c6bb5ee3e29d5a72bb673ef86897b3d6976075e62e5728203ddc.png https://uploads.disquscdn.com/images/c47cb43a18b6ac9de54dacac0500fe73c4bc9a20073a116719b58abef14f371b.png https://uploads.disquscdn.com/images/ddca3448a99f296bc5e9ef984ccf9da67f210d737395c28223dd75a6f0561797.png
I don’t know if they are ‘leading’, but they could be out performing, although SAND isn’t really out performing.
RGLD & OR look good, but others , like IAG and KGC for example, seem to look as good with higher lows and higher highs too.
Seems that different Miners are all doing different things at this time.
TGB and GGB making me some money today
LABD big volume, bad sign for the pharma sector.
OWCP wow, anyone still in that one?
Little bit of an overreaction Bill? 🙂
It is down 7 % – we see that in Miners all the time.
This is an MJ stock, people investing in these have been warned and should be aware of how these move. This moves 10-15% on any given day
They can go up 20 – 50% in one day, they can drop the same .
Refresh for 2 chart
As explained in the report – this doubled in 2 days last april. Was up 30% yesterday at one point. This is not for the faint of heart, but it still remains above the 200sma in a long base.
https://uploads.disquscdn.com/images/ccc90221d70dee5be4c941d224ced52f53140f669473ec37533e9d32ab02bf83.jpg https://uploads.disquscdn.com/images/ba7b0830a3cf9aa242dbb8491c81025d4775045bb317a2776c421da26e3e0f4d.jpg
By the way, I am in it above the 200sma, but it is an MJ stock, ( not a big investment)
NAK is slowly making it’s way back to where I sold some on Friday.
And with that POP as I wrote this, NAK is back , a penny under where I sold it – lol
https://uploads.disquscdn.com/images/22d677643ea0178f75bd737767375597addd89c4fd20a676f91483f7aeb03736.gif
Believe it or not, I saw that someone was responding, and I thought,
” Probably Maria with a gif ” 🙂
Yen Count:
Correlation to Metals……fwiw https://uploads.disquscdn.com/images/98cf38bb751ff1a668fa11df86852cd6179832c3fe639d42aae5728384023554.png
CLf just made a nice slow move from $5.56 to $7.11
Did you say slow climb?
lol
on a 2 month chart, it’s straight up.
On a 9 month chart, I would say that it was a buy, and someone would tell me that it is a bear flag – lol
I am buying CRMD for an attempt at a POP & probably sell the pop, but I could be early on this entry.
The set up just sells off every morning and doesn’t stay down or drop too far.
Refresh for chart from the wkend report
https://uploads.disquscdn.com/images/73c1f0a2cfbf59dbf6fddb29a18e1164bf0578a33442ac17af7384076797ba66.jpg
yesss…. i think u oughtta tweet that chart… it’s special .. 😉
It is special looking, isn’t it?
The only thing is the timing. I do think that it is climbing, but it CAN go sideways for another week? 2 weeks?
I remember that happened in MACK, we went sideways for 2 weeks until it broke out higher.
I’m not sure on the timing, but I want to hold some lunch money as they say 🙂
indeed…. wishful thinking that it continues following this past pattern in step ?? ;o)
I’m luvin all the MAs that came in to save the day as well….
*giggle …
#PollyAnna
https://www.tradingview.com/x/3elrj88V/
I really like the Weekly…..
well then… hop aboard matey…..
Just a tad overbought on the Daily and 2 Hour …….. watching tho
If you guys are talking about CRMD – I just had a vision, it is going to POP 17% tomorrow 🙂
awesome… i have 19% … lol
Wel from the chart above from the weekend – 19%, but current price is a bit higher, 17 % from today
I hope other readers know that I am joking, how would I know, but it wouldn’t surprise me. 😉
well … we all know have a crystal balls and polish it daily….
meow….
😉
Some legal issue with this one. Take care.
What is MACK doing? Use the 10sma.
VSLR and RUN gonna run again? or get the Runs…
Run – that has been crazy good. It never stopped, right? Crazy .
I added to SPWR because it is leaving that base on a 1 yr chart, and that wide open gap on the left? I’m hiping that this just runs to $14 without any resistance.
That is the plan anyway.
Mama – are u still in DNR?
yes… starter… I’ll add if it makes it over the TL, 34 and the 50 …seems to be following this pattern…we shall see… 😉
https://www.tradingview.com/x/4RvpgNuj/
34 is brown…. 50 is pink…
sorry – i have no clue why those dont show up when I publish…..I’ll have to check on that…
I like your style. Ill play with you
needless to say i will bail if it gets a smack down at the TL … watch it….
Im running and gunning lately – boredom – waiting for this Gold ICL thingy were waiting for…
MYSZ……trying to find it’s bottom ?
fyi CSIQ needs cash badly.
Thanks –
I’m out- mainly because it has too much resistance on the left side of the chart,
but I made good play money on part of that recent $3 move.
I still like the chart.
I still have deep scar tissue from when GPL decided to do a public offering to cure their cash problems, and that chart looked pretty at the time too
Yeah, That happens ALL THE TIME with Miners after they do a solid run. I think the insiders start to sell a little on the run higher & then submit a public offering to raise cash ( And re buy cheaper). I’ve probably been through it 5 times , no joke,
The only time I owned a stock that had a public offering and the stock took off upside was NAK last year.
SCCO looking good ……
I like TSMT if it breaks that 200sma
Bad symbol…..TMST
TMST*
Wish I bought MBRX & SPEX a week ago 🙂
Ive been in since 2.60 this morning… lol. 1k shares but not complaining
One thing about scalping a trade like that….when do you sell? Intraday charts divergence?
I tried to get out a the 100 and failed. I sold all market order 3.15 and 3.09 fills
Check out MOSY CF… Added today at 2.10
Yeah, that could pop
Where is Nancy – her new Pura purchase is up another 8%
NXTD?
I saw that on the % gainer, but the volume on days other than today re very light
The commodities continue to SLOWLY climb, and I think many are missing that move.
If you go back and look at where we were pointing out the lows – they have made decent moves.
CLF, X, HBM, ( I like TGB here) VALE, GGB, TMST, etc
Me, Im missing it.
TGB might be just starting.
I was going to put in in tonights report- inverse H&S
Hello CF! If it wouldn’t be too much trouble, could you throw an old favorite of yours in with this group? I bought some ZEUS on Friday at 18.44. Thank you for all that you do for us!
You don’t have to be. You can be the hero!!
My CLF add yesterday working out so far!
Interesting piece on cobalt that mentions HBM – interesting!http://www.prnewswire.com/news-releases/why-apple-tesla-and-google-are-fighting-for-this-rare-metal-626486951.html
Added another Tranche to UEC here. Figure the 618 bounce with sitting on the 50 fib wasnt to bad…
Added MOSY at 2.10 – loving this chart pattern alot
Monitoring my TGB and GGB positions
URG looks good too, except for todays volume
I own TGB too
I added TGB at 1.18…. Wishing I went heavier …
I also feel I may have added UEC too early but Oh well. Payschunnz
I think UEC is fine. It had a nice high volume break there & this is just a light volume dip to the 10sma probably.
I know its only AH, but I didnt think UEC would get do to the 10sma so quickly esp after the fight at 151 it had today….
I added today at 1.25 and think it is setting up to go higher.
Was putting it in tonights report
RGSE – off of the 10sma. Not my favorite solar stock, but it is acting correctly at this point.
Use a 3 month chart with a 50sma and a 10 sma.
STRONG rebound in TQQQ today.
This is exactly what I feared.
Not the first time I tightened stops to lock in profits and then saw TQQQ bound back without me. 🙁
I keep hoping for a DEEP drop but TQQQ rarely drops for more than two days in a row.
This is why I’m very bullish on stocks long term, this is a very strong BULL market.
You just can not Short this Market in todays world.
Yeah, I kinda stopped trying finally!
MJ STOCKS
AERO, MSRT, CANN, PRU look pretty good
EDXC – fell out of bed below that 200sma
VAPE – ugly downtrend
OWCP – Down 7 % , still above the 200sma
Yeah, EDXC has been for the dogs recently. Literally and figuratively!
Yen finding it’s bottom which will be positive for Metals once it does…….
GMO …Again
Studied NVDA closer.
https://uploads.disquscdn.com/images/25bba554a6325c5da31aa4249b4b5d878b9ef4da9a21bc3e0b0b1767280425ae.png
Let’s see if it re-test high or not.
2465 has been on my radar for some weeks. 720 degrees of price since election night bottom. Expect it to be seen this week and impose heavy resistance within 10 points above. https://uploads.disquscdn.com/images/76f86acea7868c47543c7df4b49ddfc7f85328f845a5980a3faa46cd52be8b3c.png
The report will be a little late this morning…had a little trouble putting it together. Still working on it , so I may make it a brief one
Thanks
I also didnt choose a picture yet, no real theme—anyone want to recommend a picture : )
Maria riding a bull? Just kidding ………..have a great day!
LOL – I’ve seen that one too 🙂
How about a clock, tick tock waiting for a breakout one way or the other!
referring to the triangle pattern in pm’s, looks like AKS and some of the metals actually have already broken out to the upside.
I’ll take the first idea – so a clock it is.
Report will be out in 10 minutes
Ouch…RAD no buyout deal!! I have no position..info only.
ouch is right….down 20%
THE REPORT HAS BEEN RELEASED –