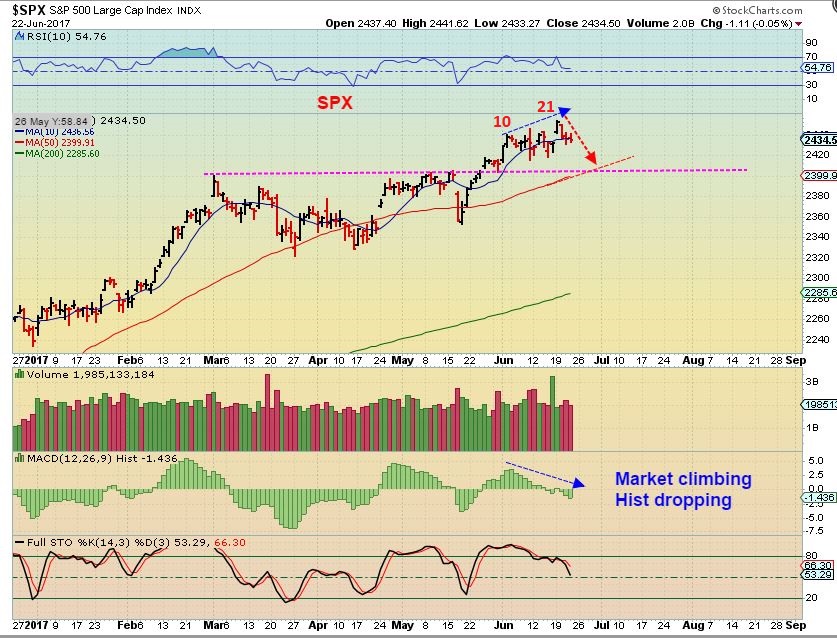
SPX – We are really well along in the entire intermediate cycle, so I would expect this daily to top and become L.T. and begin to drop. We are overdue for an ICL, but these markets have just been pure bullish.
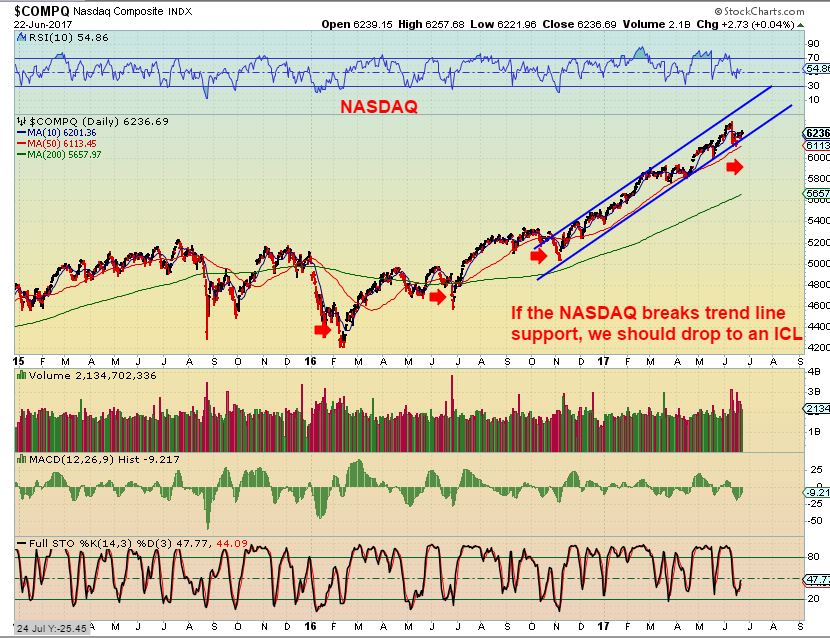
NASDAQ – You can clearly see many of the ICls in this chart, but recently the bulls have been in complete control and a recent ICL is not there. We are at the lower trend line, so even though it is a ‘buy the dip’ area, a break down could begin the drop into an overdue ICL.
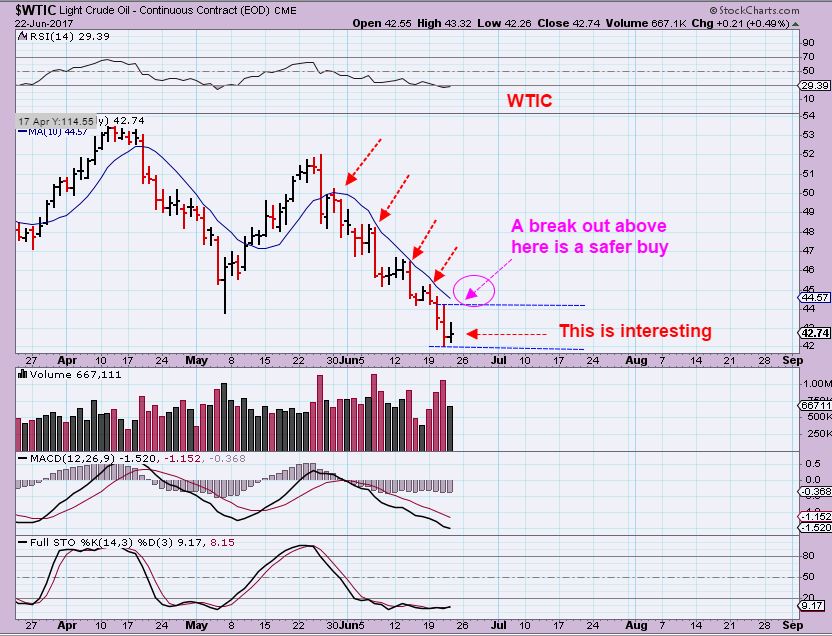
WTIC – Thursday was interesting, because Oil has a somewhat bullish set up forming here. The trading range for Thursday was held within the Wednesday range, and this can lead to reversals. A BREAK ABOVE THE 10 SMA is a safer place to enter, this could still fail. A small sideways move at the lows similar to the one in May also allows the 10sma to drop lower, so the BUY could become lower. Still using patience here, I am not jumping the gun.
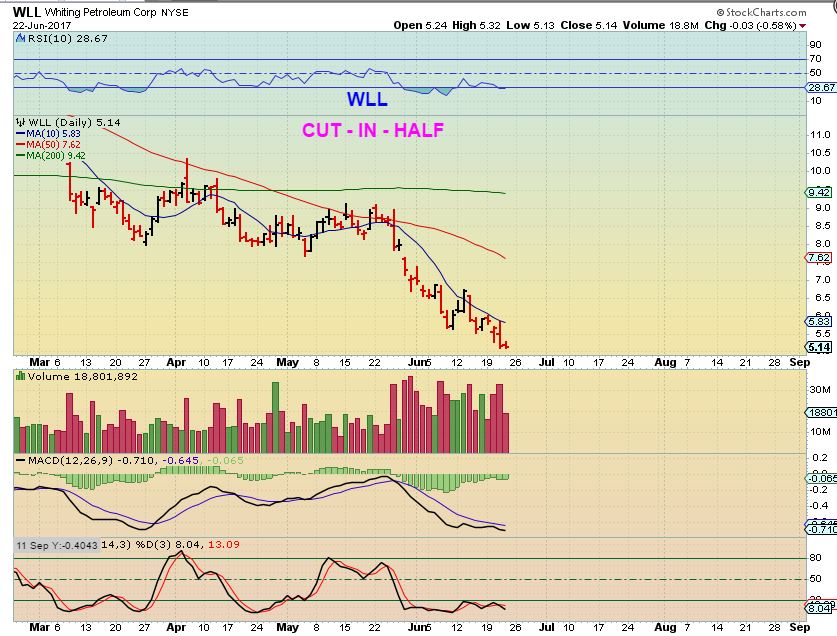
PATIENCE has paid off, many energy stocks are on sale. We did not miss a move in Energy, and buying too early would have hurt. Take a look at WLL for example. It has been cut in half in just the last month of selling.
XBI – This is likely a topping candle and it has completed an initial target move. This could bull flag or drop back down and test the break out area. I believe that the pullback will be a buy.
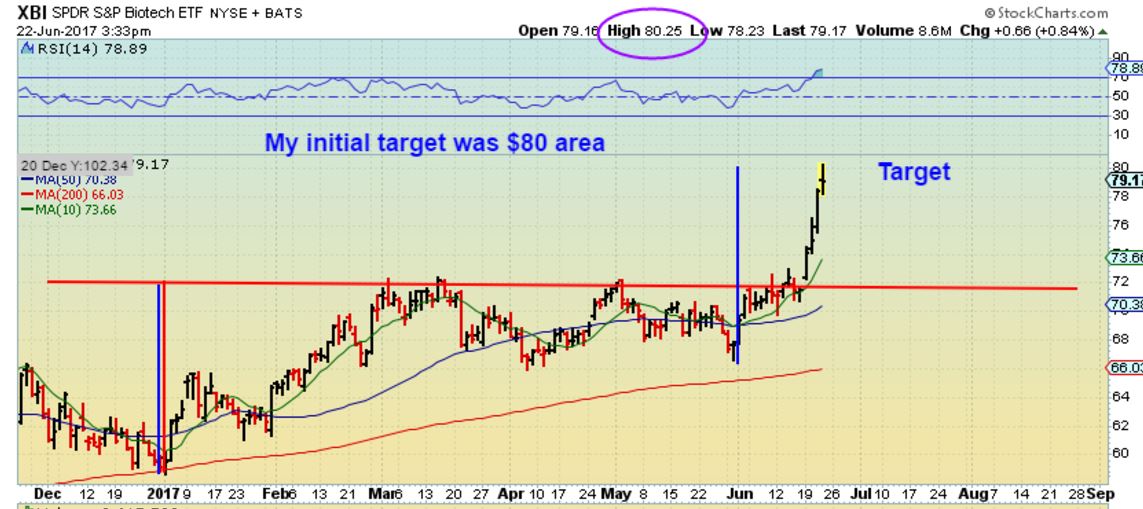
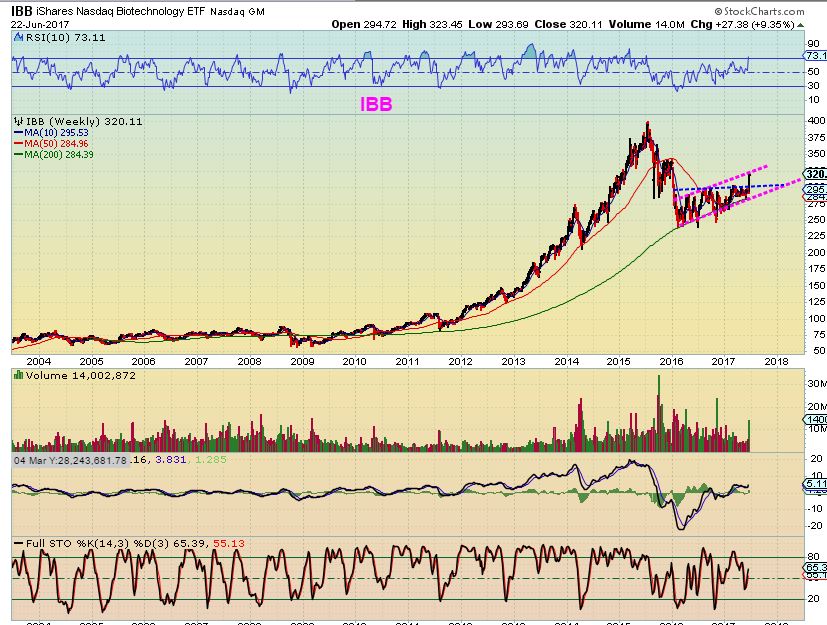
This is why the pullback in XBI & IBB is likely a buy. This was Wednesday…
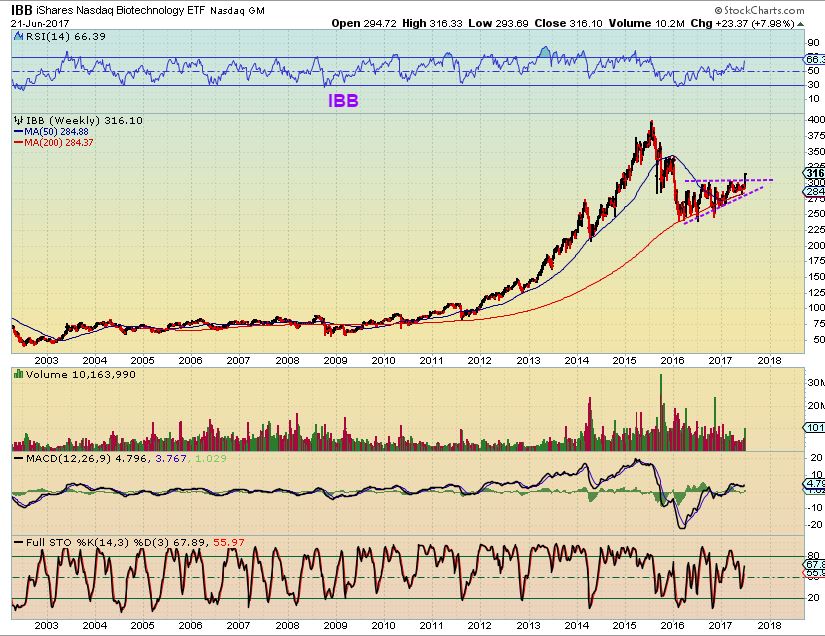
Thursday – A drop would be a buying opportunity, and a break out & run is not out of the question.
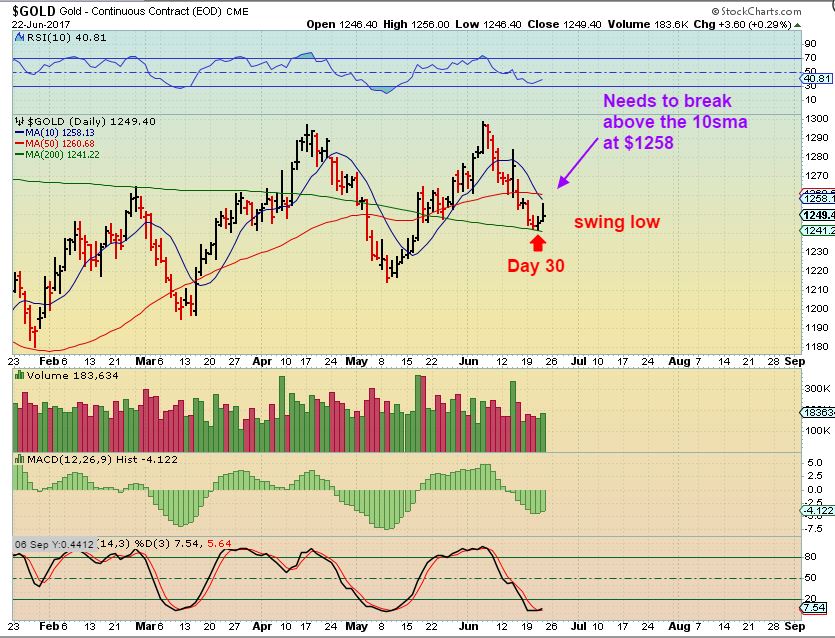
GOLD – Gold has put in a swing low ( unconfirmed at this point). Trading over $1259 or especially a break & close over the 50sma at $1260 should signal a dcl. THEN WE MONITOR ITS STRENGTH.
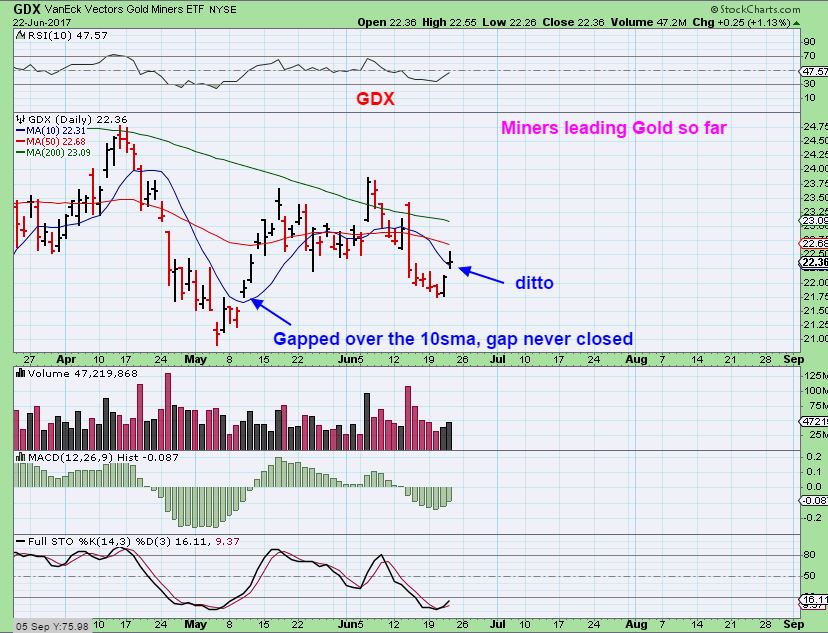
GDX – I DID take a small trade position, since I have been showing 2 scenarios and one indicates a possible ICL in May and this would be the start of a 2nd daily cycle. If the bull run was to start now, you have plenty of time to take a position in some of these Miners. If this is going to drop into an ICL, it should become a very big buying opportunity.
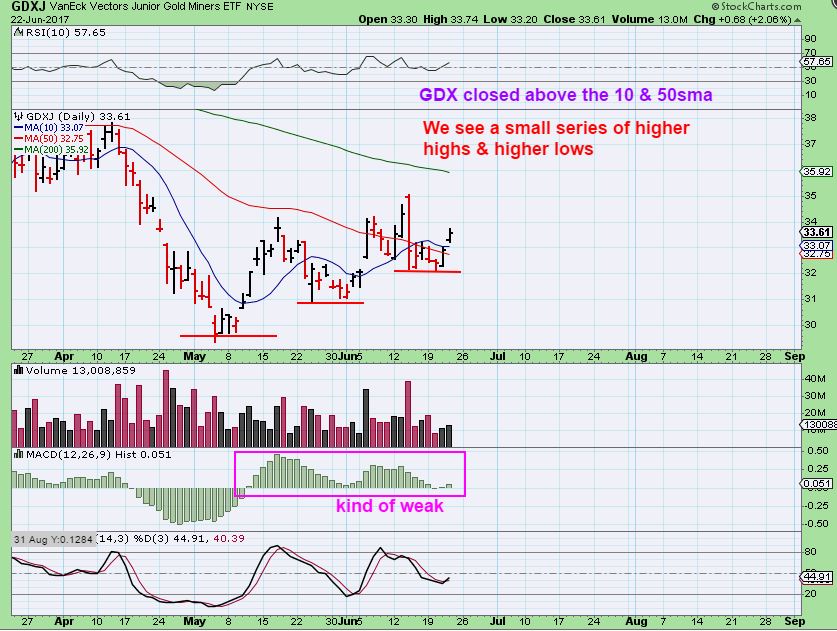
GDXJ – GDXJ gapped over the 10sma, and this is what it did in May, so I wasn’t worried about a gap fill right here. We see higher highs and higher lows, that is short term bullish in technical analysis. The MACD HISTOGRAM might be signaling weakness on each bounce.
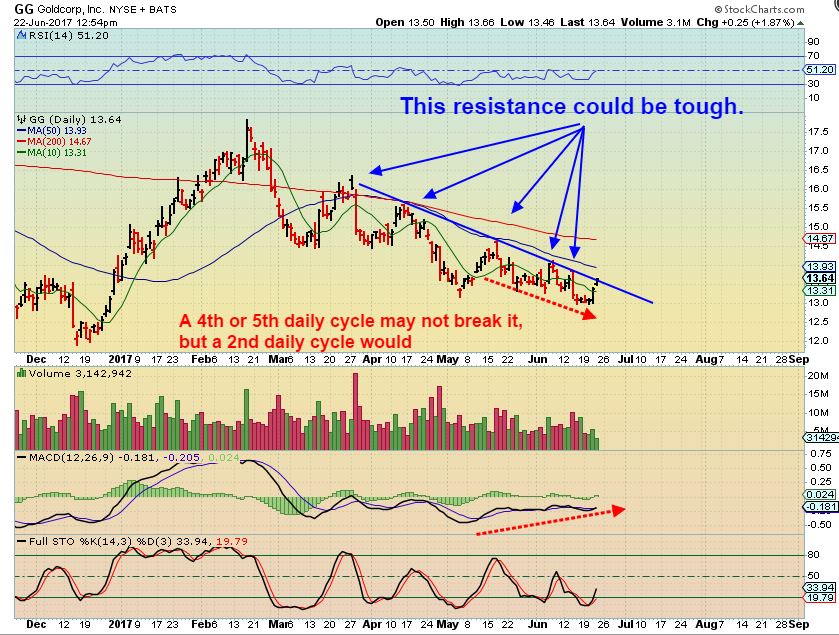
GG DAILY – I’m watching GG. Can it break out?
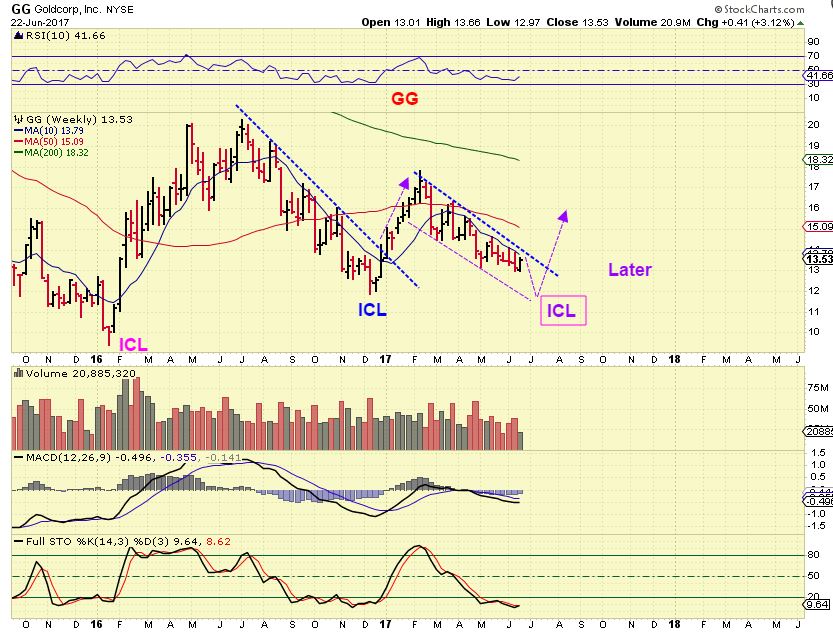
GG WEEKLY – If it breaks now, it would be bullish and I would expect it to run to overhead resistance. A falling wedge break out is bullish.
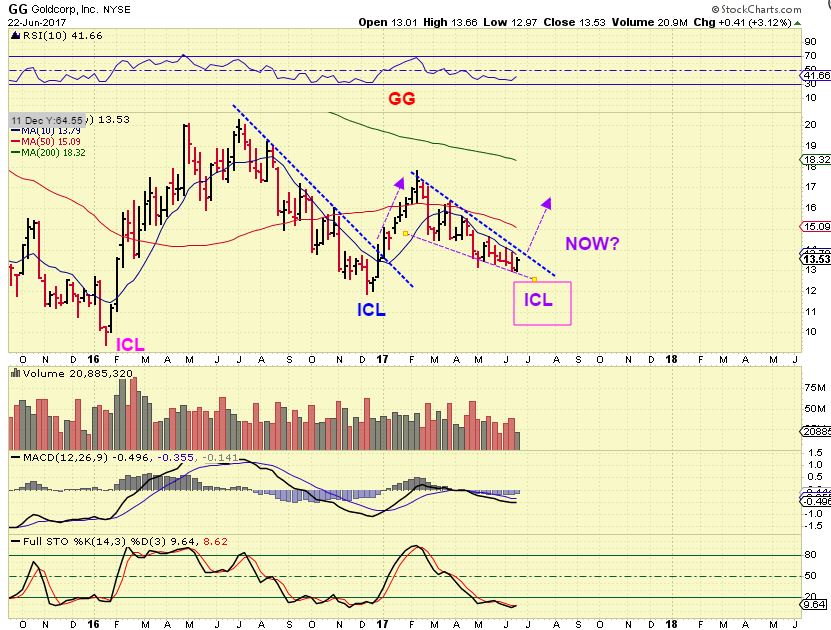
GG WEEKLY – A drop soon would changed the wedge to a down channel. I am worried that it might break and find resistance at the 50ma, but usually a move out of these set ups is strong ( see the last ICL break in Dec).
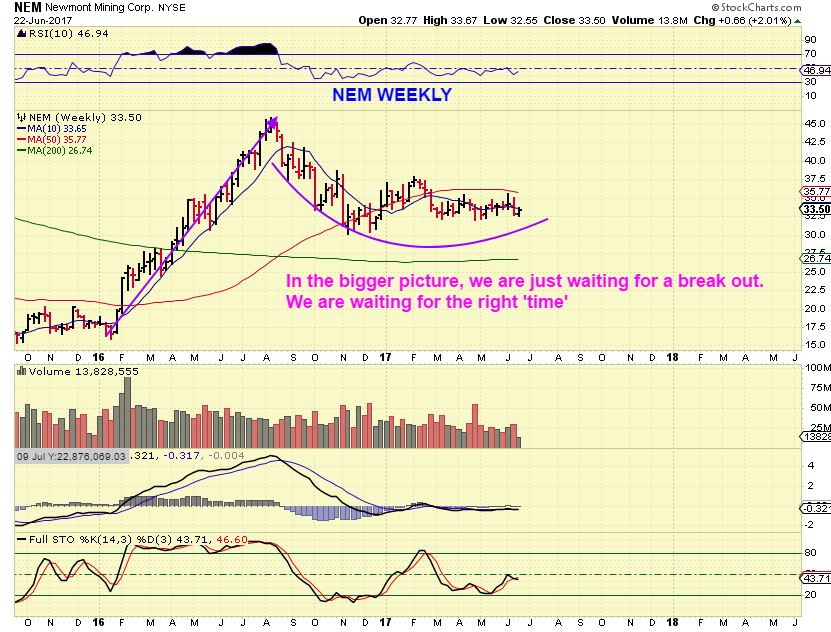
NEM WEEKLY – Lets look at Big Picture Miners again. NEM is a bullish set up. We have not missed a big move at all, but this consolidation could lead to a very big move in the future. We still have time to be patient and avoid draw-down. I can picture either a POP or Drop from here, can you?
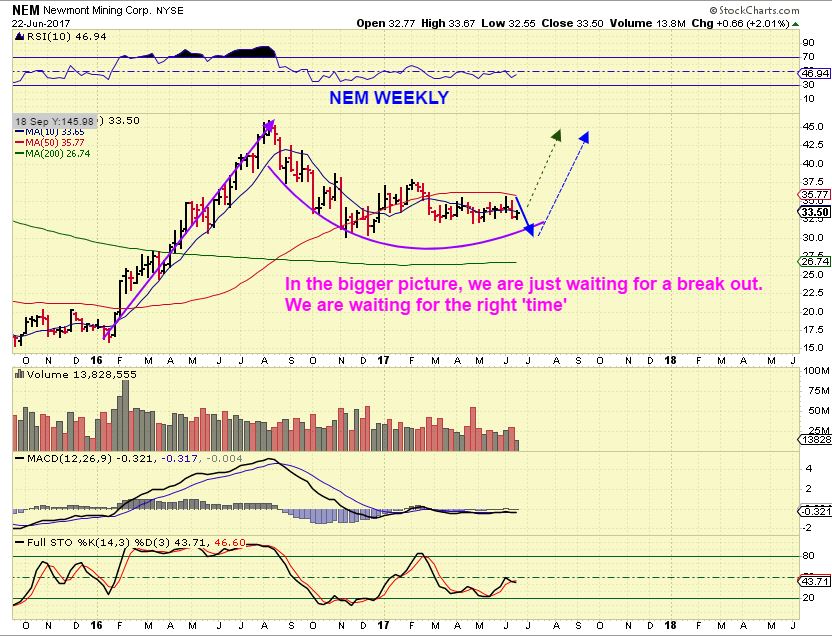
NEM – A POP or an ICL drop. Both should lead to good buying opportunity.
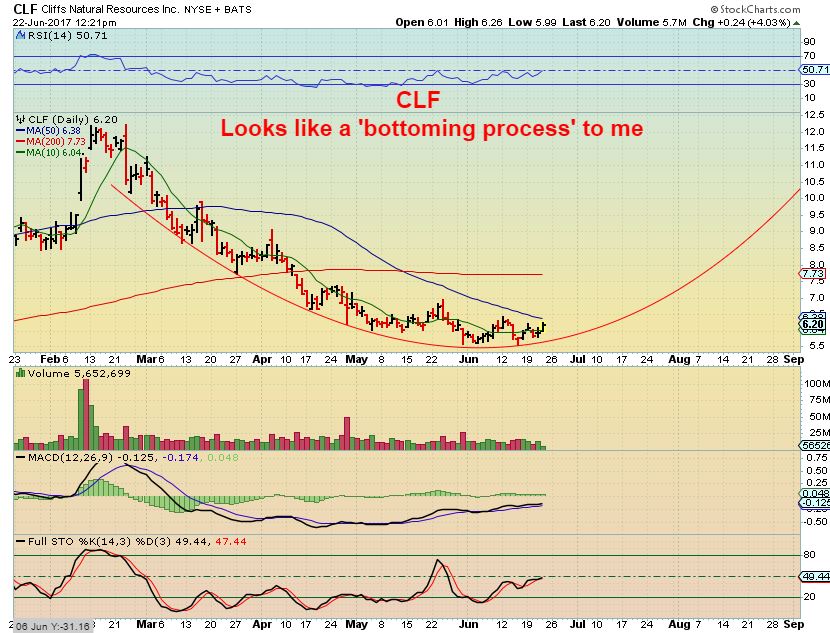
CLF – I used this chart to show that many commodity stocks still look to be consolidating at lows. A bottoming process where price eventually runs out of sellers and buyers take over.
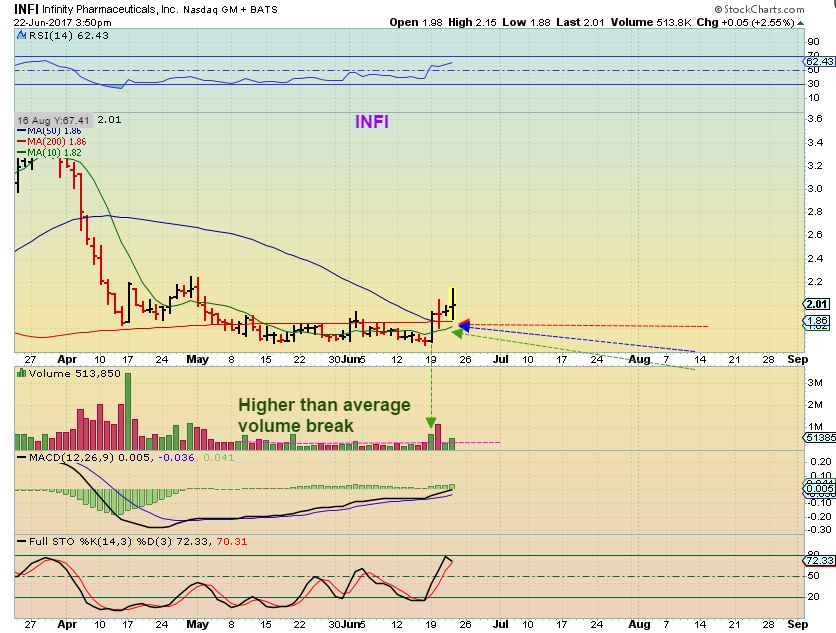
INFI – I own INFI and my position was smallish as it broke above the 200sma, so I did decide to add yesterday near $2. So far the 10sma will be my stop, this should have strong support with the 50 & 200sma together.
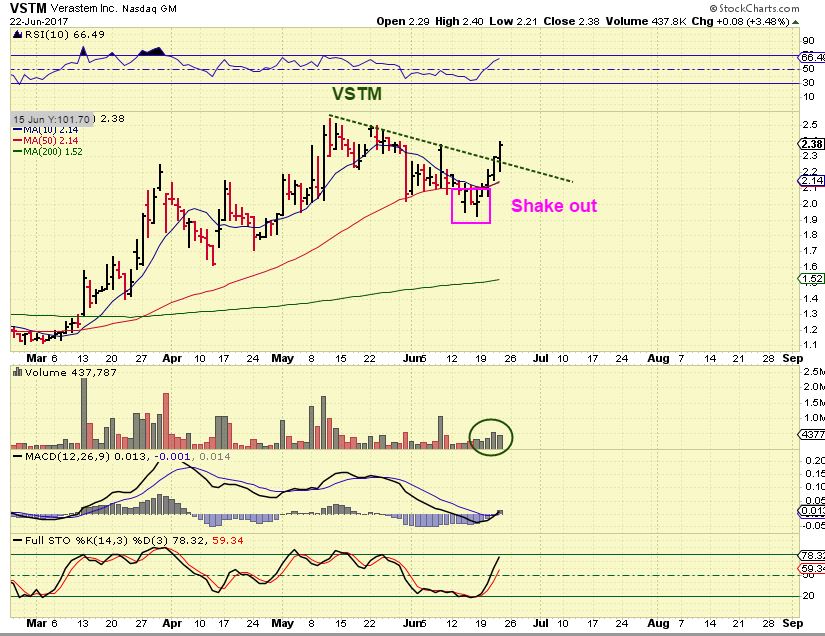
VSTM – VSTM has been rising, it looks to have put in a shake out. Breaking the downtrend is a buy, and your stop is placed below that line or the rising 50sma.
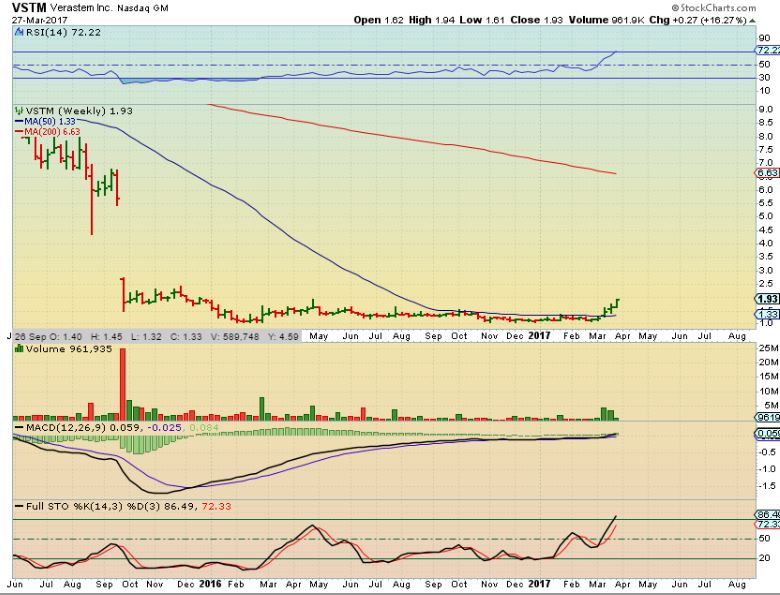
VSTM– When I first bought VSTM, I used this weekly to show what I liked. VSTM is breaking from a long base and a gap fill would take it to the $4.50 area.
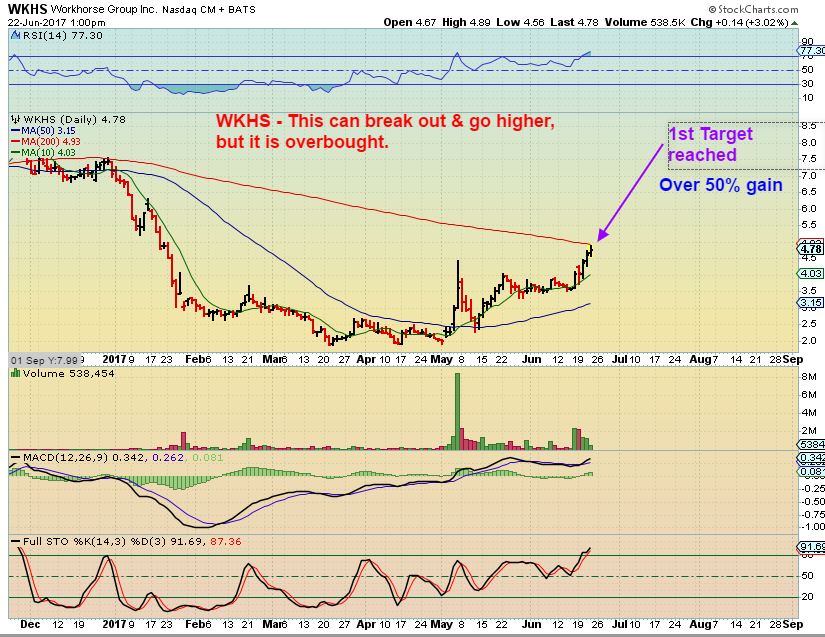
WKHS – One of our ‘buy’ points. I mentioned that the initial target for me was the 200sma, although it could break out and continue higher later.
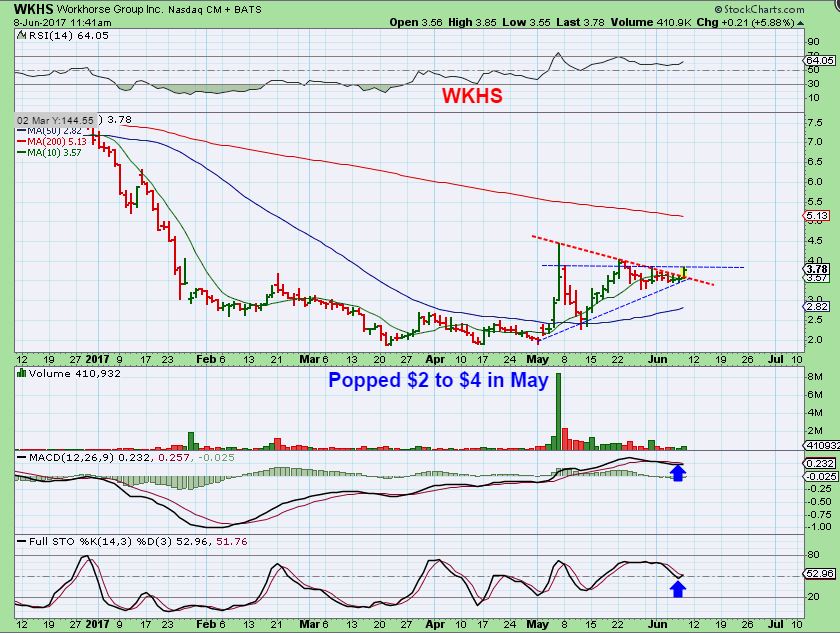
WKHS – So I sold Thursday. This was NOT 50% like I wrote on the chart 🙂 Sorry about that. I thought that I bought my first position at $3.00, but when I looked it up, it was actually closer to $3.40, so a 40% gainer. The pattern played out well, but it did require patience with a consolidation sideways for a month plus.
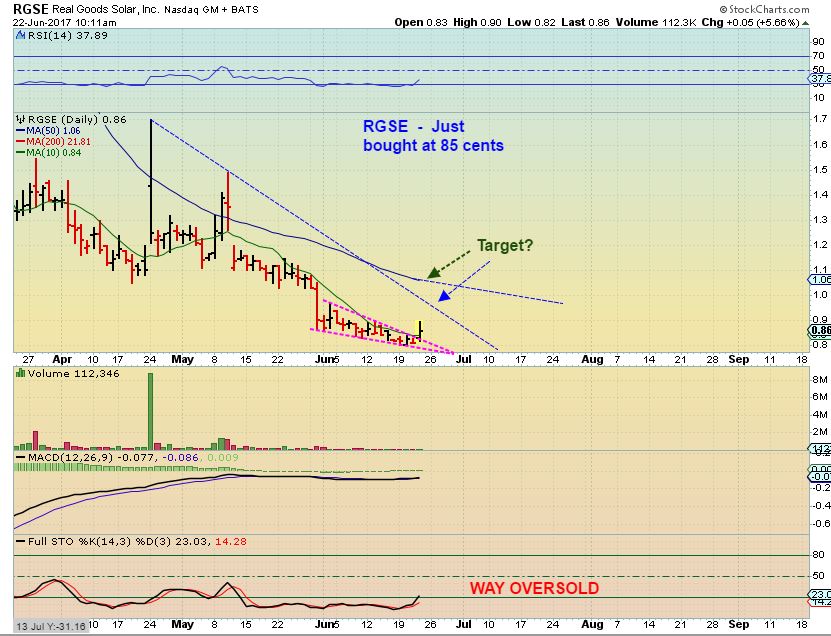
The SOLAR Stocks have been rocking, as pointed out in yesterday report with SPWR, CSIQ, RUN, VSLR. I spotted this in the morning and bought it and posted this chart in the comments with 2 initial targets. I went in with a good purchase at 85 cents on this break out, because the solar stocks were all popping.
Over an hour later, RGSE was already up 15% and at the first target, but no one was selling based on what VSLR and RUN have done.
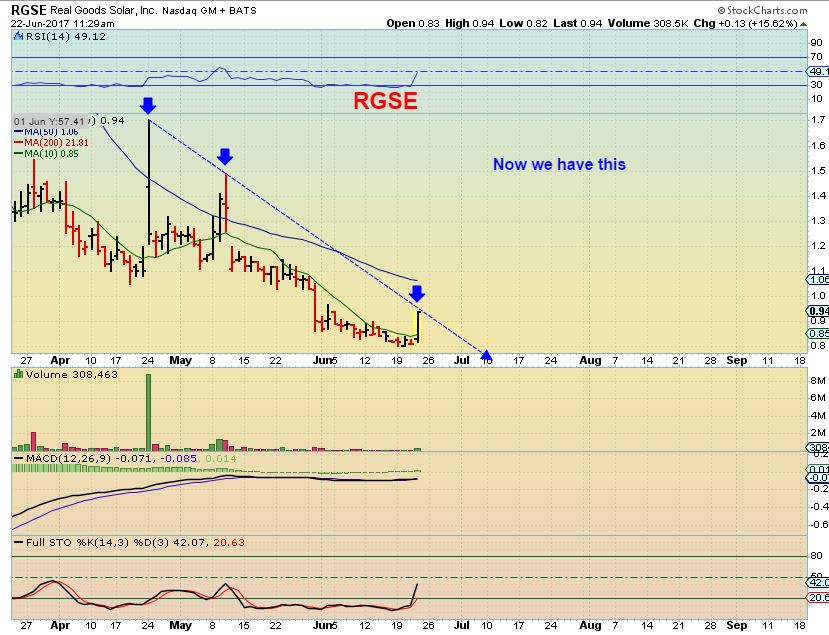
RGSE then ran up 30%+ at one point during Thursday, and tagged the 2nd target. I did sell some there, but I will show you why I didn’t want to sell it all.
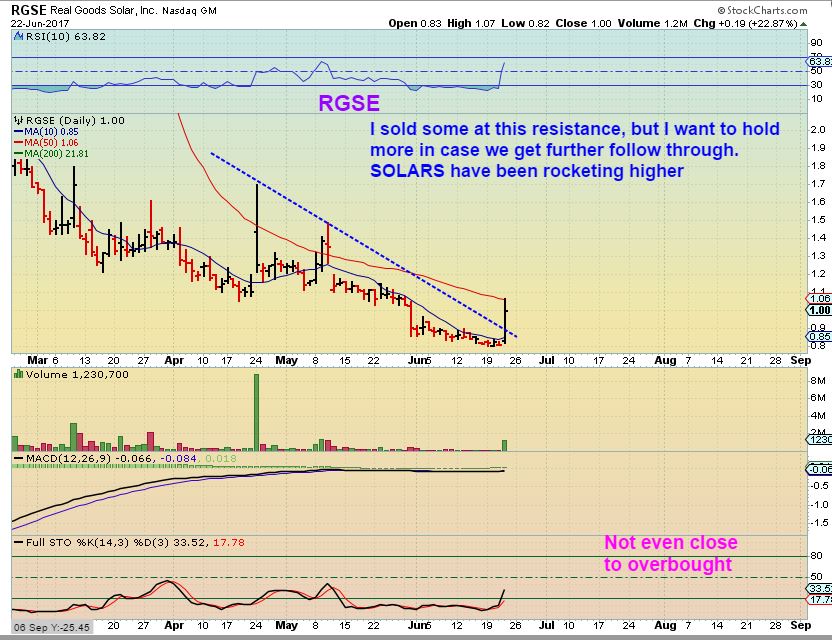
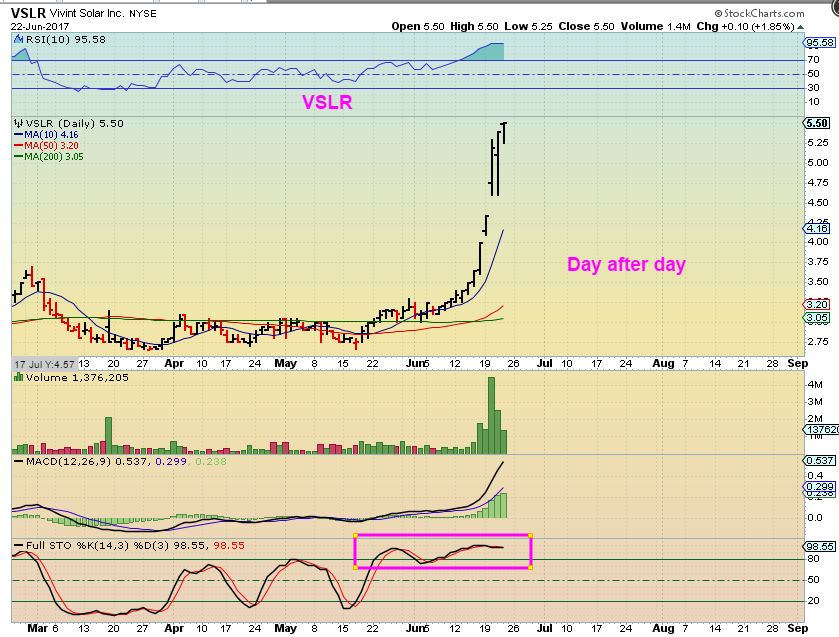
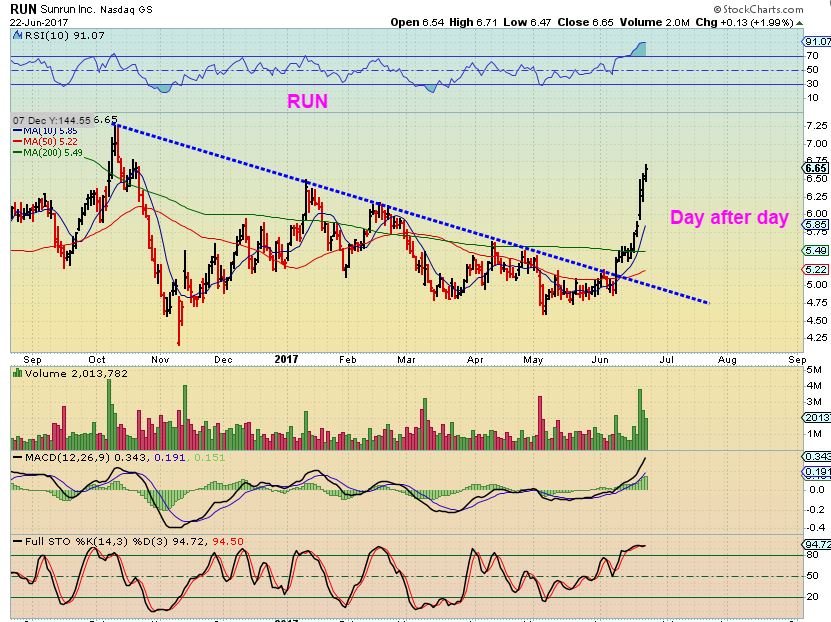
I didn’t want to sell RGSE because some of these solar stocks are experiencing short covering, buying, and a complete loss of control by the bears. This is a chart of VSLR. Day after day it just keeps running.
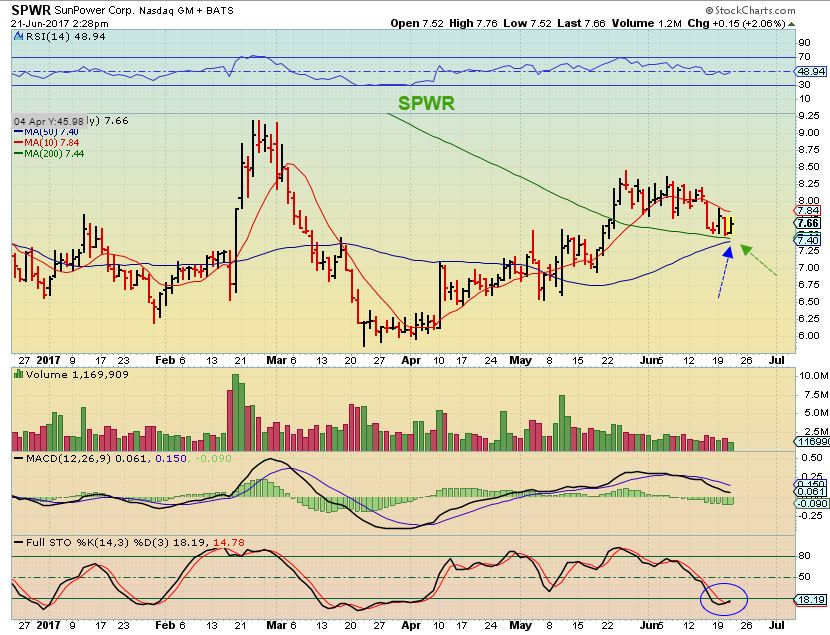
SPWR – I posted this in Thursdays report. This was the next best buy in my opinion as it consolidated to support. I mentioned that I bought CSIQ & SPWR neat $7.50.
SPWR – And Boom. look how oversold this still is. I didn’t sell any, since this could keep running like VSLR.
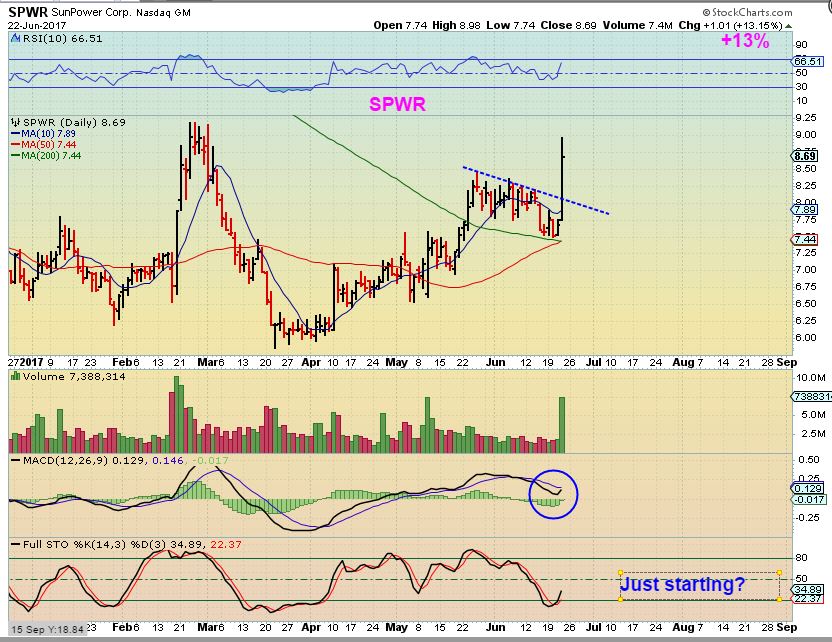
And I did put this in Yesterdays report too. The potential is big over time if the solar stocks are breaking free from a bear sell off. Think about the 3-D stocks that I pointed out , when they broke free ( see charts of DDD, SSYS, VJET, etc as a reminder).
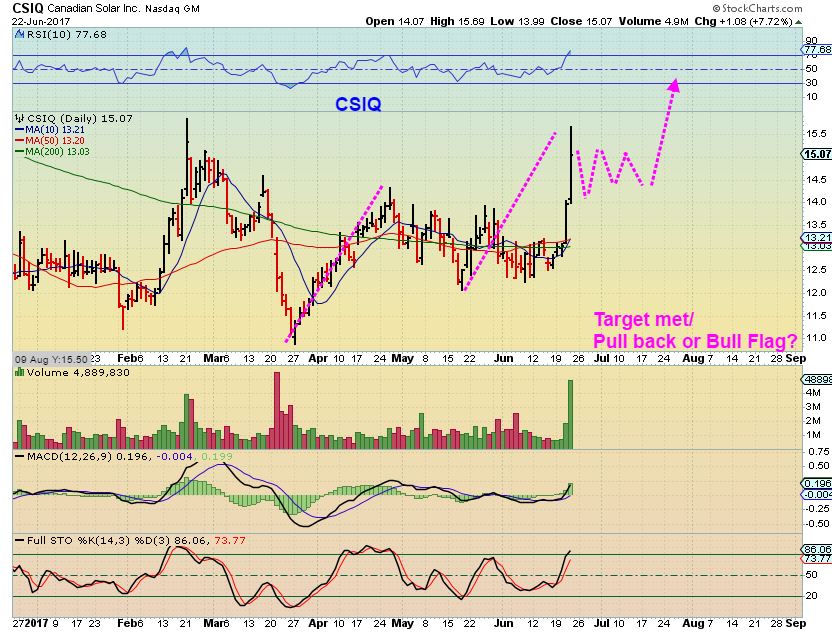
CSIQ from yesterday, I mentioned that I bought this break out and that it should continue to run in the solar sector too.
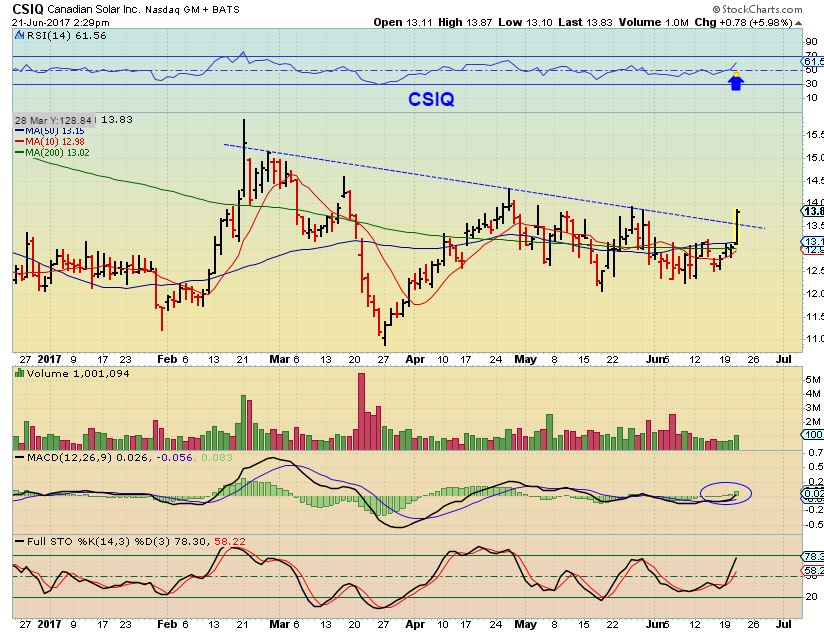
CSIQ – My initial target has been met, so it MIGHT consolidate and do what WKHS did, or it just might continue running. I did not sell, since another possibility is that we may see a bull flag or a rising wedge or some other bullish consolidation.
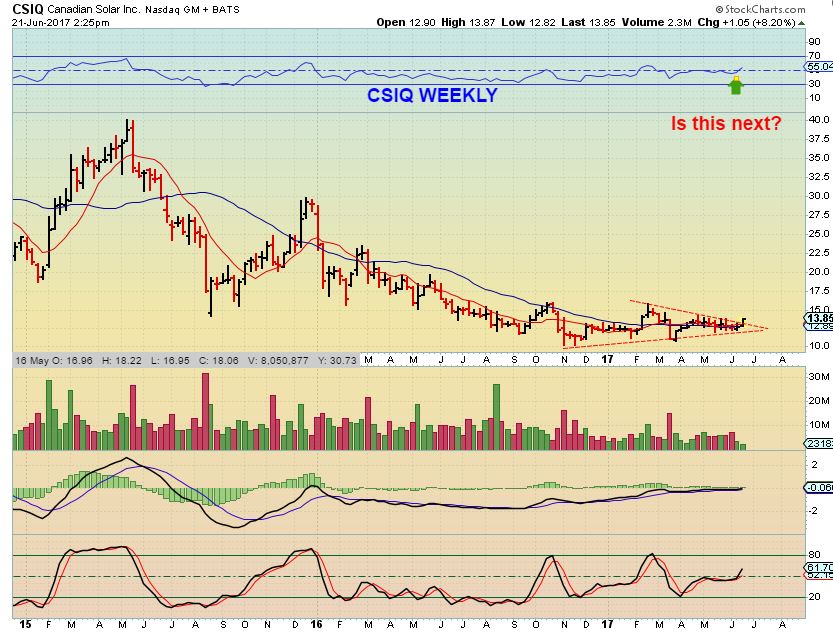
CSIQ WKLY – I posted this in Thursday mornings report. THIS is the reason that I want to hold on longer.
Again, the reason that I didn’t want to just sell yet the pops, these solar stocks below just TOOOOK OFF and kept running. No bull flag or consolidation yet.
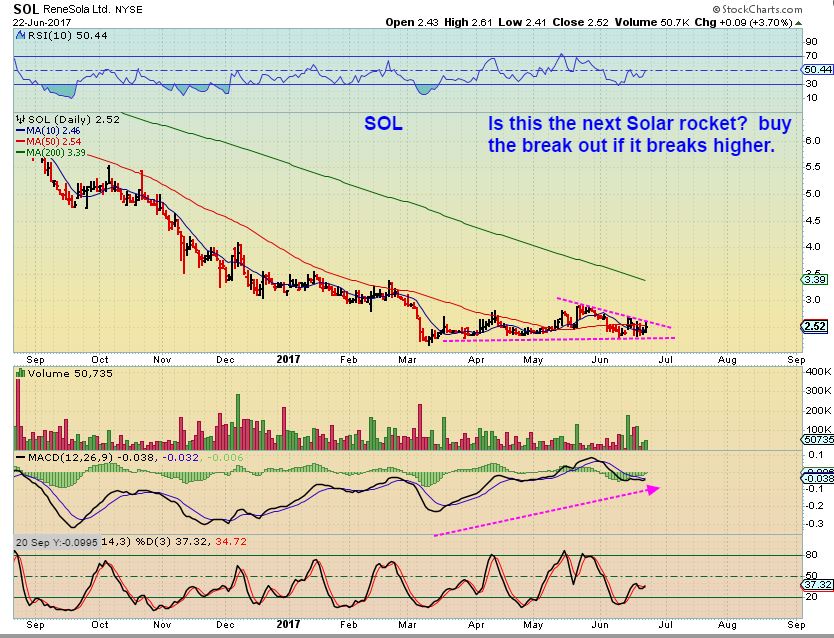
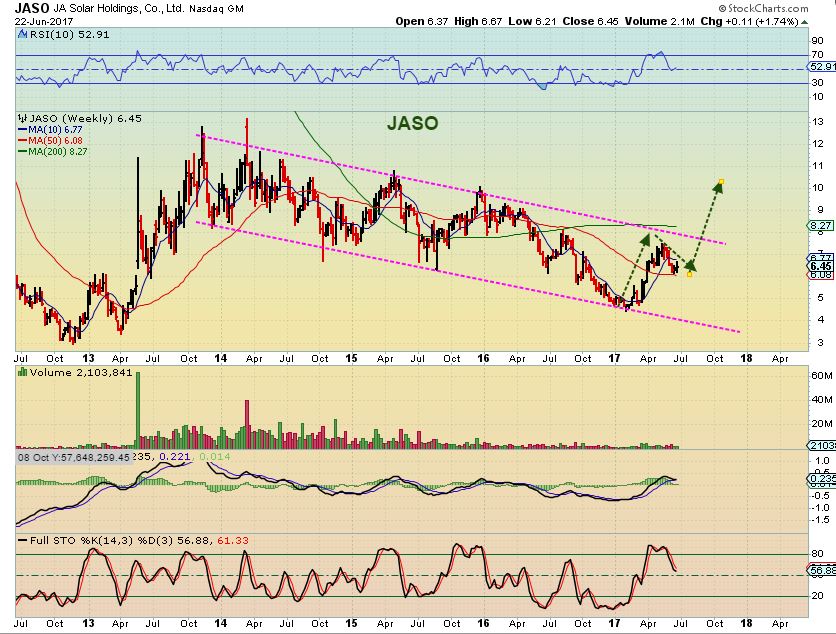
See also JKS, JASO, SOL, YGE, and so on.
SOL – The next best thing? I wouldn’t doubt it.
JASO – Not a bad set up either for the longer term, if the sector continues to break out.
Thanks for being here at Chartfreak, I think we have some EXCELLENT trading coming up. When prices get as beaten down as they are in the Energy sector, it almost looks hopeless, but when Oil puts in that yearly cycle low, many of these will spring back and we can capture good % gains. We also now have the Solar sector on fire, possible blow off move in the general markets, nd the precious metals market ( Miners) are setting up for what does look to be strong moves higher. We have needed to be patient to preserve funds, but when the runs start, the gains should be excellent. patience will be rewarded. Enjoy your Friday trading, enjoy the coming weekend, and I’ll see you in the weekend report!
~ALEX
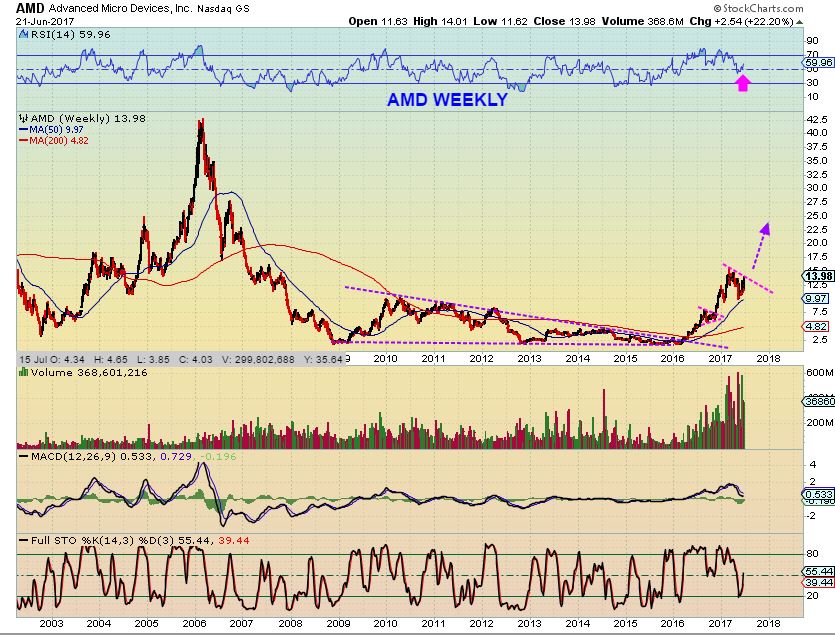
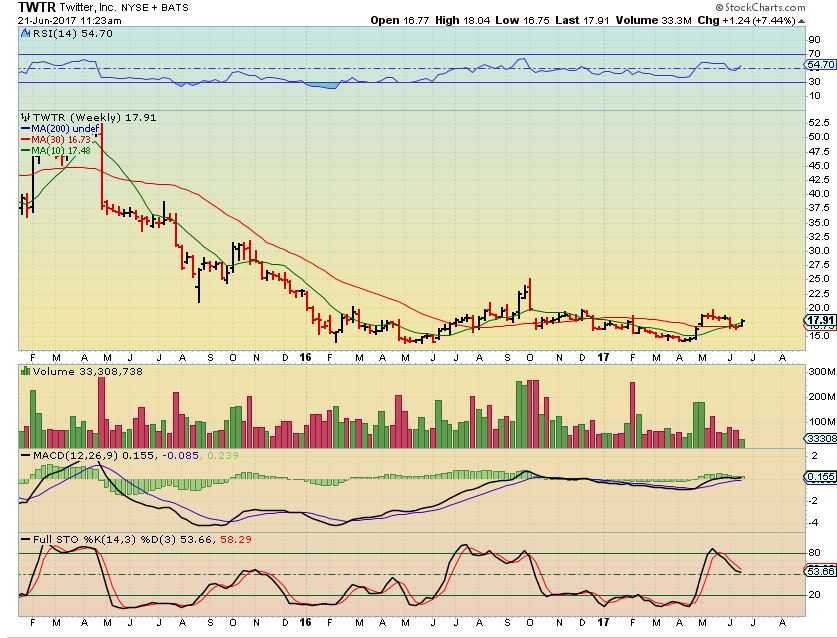
I will be throwing out occasional reminder of stocks that I think would be able to benefit %- wise from a parabolic market run. These are a few mentioned recently, there are more that I think are currently setting up too. These are great for the longer term investors like Chris used to discuss in the comments section.
AMD –
TWTR –
Thursday June 22 – BOUNCE? 
 Weekend Report June 25 – Perking Up
Scroll to top

Hey Nord,
Could
you possibly post your 360 chart of Gold on this comment section too. Is it possible to include the bottom of the chart?
it got cut off on the last post. I like to know price on the right and time on the bottom- Thanks!
Here u go Alex https://uploads.disquscdn.com/images/68ee24199712b7aad459c700688f39c6bfb56e2077ba4b520e8a975ec08c0ee0.png
If the time length of total drop would last as long as the previous, we would bottom on GDP
Shorted gold: Entry: 1258. TP = 1225
Trade your plan, and plan your trade 🙂
https://uploads.disquscdn.com/images/12e222d7c2038c811351733f43f20663d3debcedf5d7967680f50536738d43f3.png
I am however, looking for euphoric last spike to get even better entry. https://uploads.disquscdn.com/images/d710ee899eb34e31e0bfcaa3f5a451d0d369283212905a4ce51cfd9f433c6498.png
I so hope you are right!
There should be a lot of SL at 1261 so lets go up there a little trip
Nord… thank-you for your great input.
What means SL, and are you planning to go short @ 1261, do I understand this well?
Thanks again !!!
https://uploads.disquscdn.com/images/436ff9d50163f612b405e5b7f5644160efb5f9131432e27c5e5b594a3bf69866.png
Being a bit conservative here with the TP as gold is in a bull.
Yes, that is what I was kind of looking for, it seemed to be about 4 or 5 days drop last time into May lows.
I actually am LONG MIners right now with a close stop, but I prefer that we would just drop into an ICL in a 4 day drop. The timing for an ICL would be good and It would be such a better long set up than looking at what looks to be a swing low to me ( So far).
Thanks
We have seen time and time again that miners are not gold, and I might be very wrong here, because it hit the bottom of the upward channel. This is merely a play on a bigger-view thing I have going on.
Thanks!
Amazing chart. Thanks
A question on comparing the volume within the 2 red bar sections you are comparing….do volume patterns/ quantities/ or spikes give any helpful data?
Looking at volume in gold have only confused me more then helped me unfortunately..
Thanks.
Alex…. good morning. Man, you are a very smart man, it must be when I read this report, I must see excellent done.
You just touch my heart in this report.
Alex…. many THANKS, and hope we get a short rally in the crude-oil, probably around the 47.00
Thanks Geurt – You are a very kind man, always positive and outspoken with the compliments. It is not necessary, so I appreciate your attitude. I hope all is well with you, and have a great weekend.
Thanks Alex – great report. One thing that really intrigues me is your MACD and Histogram analysis. If you are ever at a loss for a topic to discuss I would sure appreciate a lesson on MACD. Or maybe there is even a book on it that you could recommend?
*or he writes the book 😉
With you…don’t forget …..
yeah… we’d be REAL productive…..
*eyes rolling….
https://uploads.disquscdn.com/images/e5fbad0dbf5d5d4a9a0b2bb5fca55109bd646ec125781d5fc3b5459b95ba6151.jpg
I’ll add another request….stochastic….there was a discussion the other day about using it to help with entries on a 15 min. chart. I have read definitions of this but would sure like to hear your views that add experience to the defs. My charts offer slow, fast, and full…..?
Its basically an overbought / oversold indicator.
I like to enter a stock when the 15 minute is oversold, but I dont always do that. If it is overbought on a 15 minute chart and you jump in, it could then pull back a little bit ( for 15 – 30 minutes, like that afternoon pull back type of thing) and your entry seems to be a bit higher than you could have purchased it at.
Everything is conditional in my trading though, with many factors put together. That is just one thing that I often glance at.
OK thanks…that is in the notebook too!
I never read a book on it. I just use it to gauge momentum. I always glance at it, and after about 10,000 trades, you kind of get a feel for what it should be showing you and what doesn’t quite look right.
Basically new highs in price are better when the MACD also makes new highs.
Divergence can indicate a change
Thanks for this. I will add it to my notebook.
Notebook, I like that. I used to put MANY of my observations in a notebook 🙂
I went back at the start of the year and reread everything. It was a good review…and a sobering reality check that I was STILL making some errors. Hopefully, better next year!
That is what I learned too when I was writing one. I was repeating my mistakes ( emotional trading) rather than sticking to what I knew was working.
Eventually it helps to change those bad habits. 🙂 Trading is an emotional job, because income is involved, and loss of income or savings is never easy to ignore. Good trading principles and patience and discipline can help regain the losses.
I’m still learning for myself too.
You have been a wonderful caring mentor. Thanks
OK Maria….this should invite a “suck up” type comment! LOL
lol…. u no i totally agree,, haha
ps….really jealous of that lovely lake you are enjoying….went there once when I was a little girl.
i set it as my screensaver…. and plan to continue having my coffee on the balcony learning and laughing to all that is Chartfreak…. ;o)
*the site NOT him…
*gross
You should go down and sit in those chairs on the dock
( then you’ll be closer when we tell you to ” Go jump in the lake”, when you get out of control) 😉
ha!!
lol
dont encourage him….. https://uploads.disquscdn.com/images/d066e2243b7f6aebd792791a23bd0c4a1d344197725b7a424cf98cf5dae35f6c.gif
choose the right MAs, and the trendlines can be very informative too
Thanks…ok, you are in my notebook too! I look here on Chartfreak for the trendlines, but I do use SMAs . Always had 10, 20, 50…but have added 200 since CF uses it often.
i mean the moving averages fed into the MACD settings, like i wuz discussing with you and Ken last week (was it?)
I don’t recall that but my chart has 12,26,9. What do you use? If different, why do you like it better?
mail me over the weekend Nance (sog@writeme.com), when i’ve got time .. and i’ll take you thru my settings
OK. will do!
I am starting to use the 50 ema on the MACD…..
I even have started useing the 50 on some of my RSI settings…..
yup.. also its sometimes just a matter of finding what stocks reacts to what MAs, on an ad hoc basis, and trying those settings
Keep us abreast please……
Still being inordinately patient!! 🙂 Plus also still in recovery mode after amongst other things, fracturing my neck following a fall down a steep flight of stairs and hitting a wall at the bottom 9 weeks ago!! So have had a few other things to contend with as well over the last couple of months and still not ‘out of the woods’ yet!! 🙁
Yikes! Recover well. Sending as much good vibes as I can!
Thanks Nancy. Had an MRI scan on an ankle injury this morning but no results until 11 July and then more X-rays on my neck on Tuesday to see if the fracture has repaired. Have been in a neck brace 24/7 now for nine weeks and literally itching to get rid of it!!
Broke my ankle many years ago….impacted my life thereafter. Your situation makes mine seem small which is always a good thing to help get others to appreciate and count their blessings. My only advice would be…don’t neglect the physical therapy part of recovery. I wish I had done more early on to try to keep more flexibility and mobility.
Thanks Nancy I definitely won’t. The MRI scan should determine if ankle surgery is required but really hoping it isn’t. VERY thankfully though the neck fracture was deemed stable and therefore did not require surgery but has been locked in this neck brace for 9 weeks now when I have not been allowed to bend or twist my neck at all. That will most definitely need physio once the brace comes off!! I’ll probably be like one of those ‘nodding head’ toys you see in cars sometimes!!! 🙂
CHRIS- No Lie, I thought of you when I posted TWTR and AMD in todays report. The Chris mentioned there was you. and The longer term out look 🙂
Really sorry to hear about your fall, that is brutal. I hope that your recovery is thorough and doesn’t take too long.
That is a tough one, Best Wishes, & thanks for popping on to say hello.
Thanks Alex. I did assume it might be me that you meant with my ‘long term scenarios’!! Lol The fall was definitely nasty and as tough as the last couple of months have been I have been incredibly lucky as the consequences got within millimetres of being a million times worse!! Don’t even want to think about that!! Hoping for a really good progress report on my neck fracture next week, which would be a huge plus as well as no small relief!!
Good lord! Glad you are alive! What a scary fall! Hope you fully mend 🙂
Thanks Crystal. Me too!! 🙂 It has certainly given me plenty of time for ‘reflection’ that’s for sure!!!
Indeed — thanks for sharing — it keeps all of us grounded and adds perspective to the conversation.
Chris….What the Hek you old dog ! Your supposed to only fall going into one of your favorite golf course bunkers not on stairs. All kidding aside I hope you recover soon, who knows maybe after this incident that slice of yours now corrects itself 😉 You are in my prayers my friend. 🙂
Thanks Ken. I’m certainly hoping it will cure my ‘over swing’ although I can think of much better ways of curing that!! Still some way to go yet to full recovery but hopefully getting there slowly but surely. A bit like my investing / trading!! 🙂
what?? omg .. I’m so sorry Chris…. peace, love, and healing…. 😉
Thanks Maria. Getting there gradually. One thing’s for sure…’patience’ takes on a whole new perspective!!
get well soon Chris.. and try using a stunt-man for your stair-falls next time
Trust me SOG definitely NOT planning a next time!! Once was definitely enough and pretty certain I have now more than used all of my ‘nine lives’ and most likely had a couple of spares as well!!
Alex.. low volume average on SOL of any concern?
50day average is only 25k
sorry.. my bad.. that was the 4hour average.
50day is 50k..
Yeah, that always bothers me, but at times that volume is a lack of selling at lows when a base is forming. It can increase on the way higher- with shorts covering & buyers stepping in.
That would lift price and allow one to sell in a bit more of a liquid condition.
I’m not sure if it counts at a time like this when all boats seem to float, but SOL has very bad fundamentals. Short interest is around 8 days.
Thanks for you insight on the XBI near term top!
Great report – So many great trade setups!
I feel like a frog in a boiling pot of water holding NAK.
Yes, I own it and it is boring right now. Still well above my buy point, so that is fine, but I really wanted to see this stake off at the 200sma, and not undercut it. Now I need to keep an eye on it.
On my chart it broke down through it. Poo.
Yes, I do not like it if it doesn’t recover like it did in March & April
Wish I was above my buy point. 🙁
I added to SPWR on that dip.
This is not overbought
ooo aks… nice
And CLF looks to be trying to break above that 50sma finally. And it has, just want to see if it closes there
im likin dnr
because it is at lows? SID looks kind of good that way too
Finally…. sheesh
Ditto!
With my steel plays running, decided to scalp GGB – in 2.80 out 2.85 5k shares. Gas Money!
Gas money for the BOAT ! 🙂
I wish I had a boat… Gas money for my darn Jeep… This thing is a earth killer….
lol …. nice trade.
SPWR – After that morning dip, just slowly climbing higher today
A break out here would be great, since I do not see a lot of ‘seller’ to the left – but this is a strong
resistance area that it needs to work through first.
Refresh
https://uploads.disquscdn.com/images/9357bf07c493704e49ddc8156651acea35e7fed05db63462b680dd30d3124634.jpg
Bond Count (TLT) : https://uploads.disquscdn.com/images/831028fd530f6408dad9307c3464a05f4ab5facf134ad336a12ad91e0e2990f4.png
Very tempted too short…….
Look at LABD – That kind of volume on the 3x etfs usually means a reversal,
I am tempted to buy LABD with a possible top in XBI, IBB – ( short term at least ).
I hear ya…..r/r very good.
I just hate shorting Equities in this current environment.
Stop at low?
I bought some yesterday around 6.45 ALEX.
If bios were to reverse they should have been weaker this morning, LABD stronger. I didn’t like it just hanging around. So I decided to pass on the short. Just didn’t see it develop as I would have liked.
VALE: Harvested 75% Call profits this morning…..
Is there something in the chart you did not like? Because it hit the 200 sma?
2 hour stochs overbought was one of the indicators telling me it might be time to reduce exposure….
Thanks…I’ll look to try to see what you were looking at….and I do remember this was to be a fast move for you, not longer term.
Nice. I haven’t been able to do much with base metals recently…
I have a good amount of NAK accumulated, so I sold some that I bought in March.
I want to be lighter in my position, since the break of the 200sma.
Still holding on to some.
Thanks for the update, Alex.
RGSE just broke out above resistance, there is a chance that this gets crazy. (Maybe- see weekly chart)
EDIT: possible bull flag forming on a 5 minute chart
SUNW moving as well
MAN _ I 4got all about that one, I like it
Geez…I forgot to journalize it…. I own some of that.
Thanks for the reminder.
Lst time it went over the 50sma, it failed the next day, but this time the whole sector is moving higher, less head winds I would imagine. We’ll see
Yea mid May…if she can hold above that 50 might be a good LTH.
Solars, uranium running all consistent wth an oil bottom?
What is up with RGSE? It shows it was a $50,000 stock in 2014. And now it is $1?
Too many reverse splits
URA….those dirty dogs stopped run the double bottom.
My stopp was not deep enuf……..grrr
I just got back from lunch, SO MANY good set ups right now, and Uranium stocks are looking good.
Call em Out – Im trigger happy right now
See chart above with comments
Bought JASO.
I like it H50….Final Wave 5 in progress possible.
So far so good.
I did as well.. 6.60 entry… lets see this time around.
HMY: that poor puppy found it’s legs this morning….. 🙂
Alex. Just working my way through one of my watch lists and smiling somewhat painfully at the comments I wrote to my self on AMD on 11 May following a previous mention of AMD by you!! I regret to say I didn’t follow through on my own notes!! 🙁 But would have to agree there is a potentially VERY bullish looking ‘big picture’ on the weekly charts while price remains above that major breakout level around10.0 https://uploads.disquscdn.com/images/2ea3bed42ad6ea81aba5aab773f06386243bed9722bdfcf82cd6f3651e00ce08.png
Yes, I like the weekly quite a bit. I have a mini watch list for the possible longer term buy & holds. AMD & TWTR are 2 of them mentioned recently.
Check out a 5 yr weekly of ticker WIFI too
Needs a pullback, but good bullish action this year
Catching that around the major b/o level around 12.5/13 would have been rather nice! Seeing bearish divergence on my daily charts so will definitely add to the watch list and hope for an intermediate type correction for a more attractive entry level. If I miss one bus I tend to wait for the next one rather than try and chase the one I just missed! I’m not much of a runner!! Lol
Not much good with walking down stairs either! ….JUST KIDDING! Trying to give you a laugh.
Sadly oh so true Nancy! 🙂 In my very slight defence I was apparently the 4th accident that has occurred on this particular flight of stairs and they are now being redesigned by a local architect!! A little late for me but good news for all those who follow behind!!
Lawsuit! It would give you more to trade with!
I’m investing in handrails 🙂
They had those!! Lol
Hand rails and grippy gloves? 🙂
Maybe an instantly inflatable ‘air bag’ suit might have helped that activates when your centre of gravity goes beyond tipping point!! A bit like water buoyancy aids that inflate the moment they hit the water!! 🙂
better yet, elevator stocks: UTX, KNYJY, TYEKF (disclaimer; not in any of these!!!!!!!!! 😉
Wow – A little bit of Maria just slipped out right there. 🙂
LOL! I was thinking that as I typed…wondering if:
1..she’d beat me to it
2…I would be daring enough to post it!
https://uploads.disquscdn.com/images/71eb94137d3134fe85a32b165d6f7046e56640a35a0f36ec872fbbeb43830c11.jpg
yeah… i have that affect on people …
*and grandkids… lmao u should HEAR them..and SEE them… H .. I .. L .. A .. R .. I … O …U …S
quote me verbatim….
bot TWTR for in my long term account yesterday.
Love that weekly chart base
Miners still acting well…started GDXJ position earlier.
Can’t tell where we are in the larger scheme but the swing appears to be in to me!
I would feel more comfortable if there was more volume.
MEEEE TOOOO!
I liked the swing in gold, so I took a starter in JNUG. Small enough for now that if we break this past week’s lows, I’m still ok!
CF, you sure this is a FRIDAY report? 😛
GGB keeps going…. flirting with the 50 here – TGB bouncing agian as well – this friday feels like a monday
https://uploads.disquscdn.com/images/2c71aeec43b449f1f3ce5710d835d501e0f9a70e8a42723a13c52b07092ad3f8.png
Posted at wrong page, so try again.
Coffee tend to move in triangular pattern over time. I think we might have seen the bottom yesterday, but it has to be confirmed. I believe beginning of July should be a potential good entry month.
As one can see, buying is best at the triangular edges 🙂
Just noticed, if conted from the exact bottom, price hit today more or less exact 45 degrees up from that level.
https://uploads.disquscdn.com/images/168bd3f6100f3ad2b122f5123d8f0fa0c4ac857e818a6f9d0923ed3751c77c8c.png
Is there a chance the next short covering rally is developing in the Uranium Stocks? DNN with a SI of 22 is up 5%, UEC with a SI of 12 is up 5.7%.
Wondering if anyone else is seeing the similarity to the Solar stocks where VSLR with a Short interest of 16 ran first on June 8, followed by RUN with a short interest of 16 and the rest just followed along.
we’ll see. I took a position in UEC @ 1.48 and DNN @ .435 – and this from a guy that swore off penny stocks!
Hey, I was just looking at Uraniums among other things, good set ups.
I posted a chart above
Uranium – lots of volume on UEC and also on Dennison on the TSX (I’m assuming they are the same as DNN)
well – AKS turning into a beautiful trade at the moment…
it’s so quiet in here. the only way I could tell if I’m still connected is Maria’s giraffe is still chewing.
Funny.
Just got in from lunch and I;m finding SO MANY nice set ups forming.
I mentioned the capitulation type volume on JO yesterday, and I think JO is at a low.
Uranium stocks are setting up nicely, and if you look at UEC – that is almost a perfect double shoulder inverse H&S
CLF, X, AKS , CENX, Vale if it breaks out here… ….nice.
TGB WEEKLY – that could be a very nice set up.
We might actually be set up to have some good trading set ups next week & maybe even through this summer .
Refresh
https://uploads.disquscdn.com/images/d7a8e5c2a19e371c38f01acd711506215336f35734911b071bc2ac3960b4a9fa.jpg
agree!!!!! and i am having trouble deciding! its like the dessert cart has come to the table and you kind of want one of each…..
Me too, I dont like to hold too many positions, so I want to hold the right ones – the ones about to break out preferably. UEC does look like it could be one of those .
chomp chomp
Yeah, I don’t even have the funds to buy everything he’s throwing out. Especially since I am trying to save money for miners and energy too!!
Alex,
Any other Uranium plays that catch your interest, that might not be up so much for the day (7%)…but might catch up.
HOW DID I MISS THIS? SORRY CURTIS
Someties I g away and when I come back I have to refrsh the page and lose some of the newer posts.
I kind of follow UEC, DNN, CCJ, URG, UUUU, URRE, off the top if my head
When I looked earlier UUUU didnt seem to move yet. AFter hrs buy?
Sorry I missed ur post
HOW DID I MISS THIS? SORRY CURTIS
Someties I g away and when I come back I have to refrsh the page and lose some of the newer posts.
I kind of follow UEC, DNN, CCJ, URG, UUUU, URRE, off the top if my head
When I looked earlier UUUU didnt seem to move yet. AFter hrs buy?
Sorry I missed ur post.
Lets get ready for some heavy Option buying lol 😀
I’m honestly so impressed with CLF, I had to take a small position, knowing the chance of a shakeout is real. I’m looking at Oct 25, 2016, where it gained the 50ma then promptly shook everyone out.
I was looking at the exact same thing! I drew it up on a chart for the weekend report already- Just – in – case . Nice.
INFI is trying to break down below the 200 & 50 sma.
NOT the champ that it looked like yesterday . : (
scco and fcx nice ….doing some solid work…
I think KEN was looking at SCCO yesterday .
I like what TGB is going to do too. Not quite yet, but you’ll see : )
i saw .. .i chomped
Do I Need to take you behind the shed Ms. Maria ? Tisk Tisk 😉
huh? i meant I bought some.. lol
*on second thought … yes… I’ll wear red. 😉
HA HA HA
Hey – that’s not fair. Share with the whole class guys or I’m telling
Oh, I just mentioned take a look at the 3 yr weekly chart of TGB earlier today.
I like it if it can keep moving higher.
and just who would u be telling? hmmm… Bay? https://uploads.disquscdn.com/images/860c8b21cc49dbf30054982677d9f709cdcfc8031671d2ccc50af1a2b173114d.gif
RNVA and RLOG both low float, high volume, tight bollinger plays.
that dang IPI is coming back to life……
Long X and CLF today, but I think there is a high chance of a choppy consolidation here at the 50ma.
A back and fill might be a chance to add to positions.
MTL……
DRYS – lol
SALT, NM, TOO, SBLK look good though
I can not believe they are still Listed ?
Would have been the perfect 2 yr short lol
1 single share short from late 2013- $1.5M. Completely defies logic. How is this still afloat? HA!
I’m out of INFI for now – It is not acting as expected and did drop below the 200sma. IT may or may not close below it, but I dont want to hold it for now.
If you don’t know the dance steps INFI, you cant dance with me.
just bot some INFI. (a former winner of mine from early in the year). perfect action on my hourly chart, bounced at fib to get some juice to retake 200 dma. https://uploads.disquscdn.com/images/23c9ba1729ee9be2ef802ca348428a99ed806c8910ec514f952b74fab89a7d91.png
big purchase at the close. Is that you Maria? https://uploads.disquscdn.com/images/19a1b935fe20cb2d7ac86d285feac08bad3d6766fe7d77a724080d22fb85e0af.png
The daily did close above the 10sma, so thats good, but closed below the 50 & 200sma, and the volume on down days was heavier than up days and it is overbought on the daily stochastics. I just dont like that formula.
The weekly chart looks like it could be setting up for higher price, but this may be in one of those bottoming processes, bouncing around the lows.
NEXT WEEK we will know for sure
hahah… Im lost trying to figure out which convo is which… I bought UEC ….earlier
ohhh Frenchie … :o)
INSY is moving higher the same manner that it sold off.
1 month V-Bottom
Time to continue to float on the lake……have a good weekend all, stay safe.
You too Ken, Say hello to Maria for us 🙂
oooh UEC … I think its getting ready to blast…… just have that ‘feeling’ that’s in my throat right now, but that could also be a coffee burp….;0
now my fingers are tingly…….
I really like that double shoulder inverse pattern…it could get explosive.
quite the show for EOD on Friday……woohoo!
Giraffe Neck on a 2 month chart 🙂
My &^*&^O*&Y*YY*(!!!!!!!!!! eye is twitching …….. must have a drink!!!!!! CHEERS!!!!!!
wow UEC
I broke all my rules and held on to URRE. Make me proud, uranium!
DNN just has to go too (my guess lol!) – massive short position on a thin trader. I had a look at the innards and it is not going bankrupt any time soon. Lots of cash, no debt and great properties
hahahahah
Maybe now URRE has a chance?
I doubled down at $1.52 for average $1.50
RUN LIKE THE WIND BULLSEYE!!
https://uploads.disquscdn.com/images/95eba8a624f6277495db8dc18aae8f7cfbea415425771385592a4bf78205774e.jpg
whooo hoooooooo….
Nord… thank-you for your great input.
You said this morning: “There should be a lot of SL at 1261 so lets go up there a little trip”.
What means SL, and are you planning to go short @ 1261, do I understand this well?
Thanks again !!!
Hey Geurt!
Yes, I expected price to potentially move to 1261 before reversing. But now price is starting to run out of time. On Monday it is entering a new phase of trend, and that can be dangerous if that trend is up 🙂 But I am still in 1258 short ,but careful with the position here. SL = StopLoss
Market tend to go where stoplosses are 🙂
Nord…. THANK-YOU-sooo-much for your response. I will wait for take any action.
Have a splendor weekend.
WKHS – down 10% today – perfect sell at resistance.
I believe a lot are on wrong side in this one. Looks to be a short trade until it reaches point D. Then it has a potential of long-term bull. https://uploads.disquscdn.com/images/9a76b0e02e62a8e0013b45f3f56f545662fded54c4f249e9956461d615afb549.png
Markets are masters in resetting sentiments. Everyone is now a bull just waiting for the right entry to buy the pullback for breakout. But, are there alternative options in play?
https://uploads.disquscdn.com/images/6adf3f99958bcf80ef52ef761b4beae698c28d0e82383f413b9021a4c1695f5b.png
Nord… did you say you are on TradingView? if so … what is your name?
Viking83 on TV M 🙂
Oh yeah .. Thats right.. Silly me 🙂
I did ana analysis of the geometrical structure on gold. It has me convinced now and I finally understand why it cant break the “downtrend line”. It is because the geometrical structure isn’t complete. How could I be so blind? Lol.
https://uploads.disquscdn.com/images/069980dca8c8601cdd058c90f92c8945579ff45c4a9367eeb370f57b2991ff4c.png
BUt there is hope for the bulls as well. They are helped by a more hidden vector. We are getting into this point where price has to make a final descision.
https://uploads.disquscdn.com/images/e08b6faabf39d7fd324926d8cb147cbc00614af303894e4a43dcb7b1af0f2e71.png
Uhh…wait 2-3 years and then still washout below $1000? That would really suck. Sure hope this isn’t the case!!
Nord, what is this kind of analysis. Is there a name for it? I’ve haven’t seen it before.
Well, I don’t know if there are any names for it. But it is kind of like harmonics pattern (you know; butterflies, Gartley, crabs etc). The point is that price is geometry, but you need to figure out what geometry applies to price. This kind of study is totally new for me, I try to integrate physics into time/price studies. I assume it will take years, but new things are learned every day. WD Gann is who I try to get underneath the skin of. To his students, he left a reading list:
http://time-price-research-astrofin.blogspot.no/2012/08/wd-ganns-reading-list.html
So, things are points of forces (gravity). I think we are to determine the point of force that is working on price in each interval, then we would be able to determine its direction (trend)
Thanks. Much appreciated. It seems like a young person could take a lifetime learning this subject.
Exactly. But there is a very nice path of wisdom down that lane, I am quite sure.