
June 14th – Clues
We’ve been looking for and discussing clues heading into todays Fed Decision. Let’s discuss Tuesdays action…
.
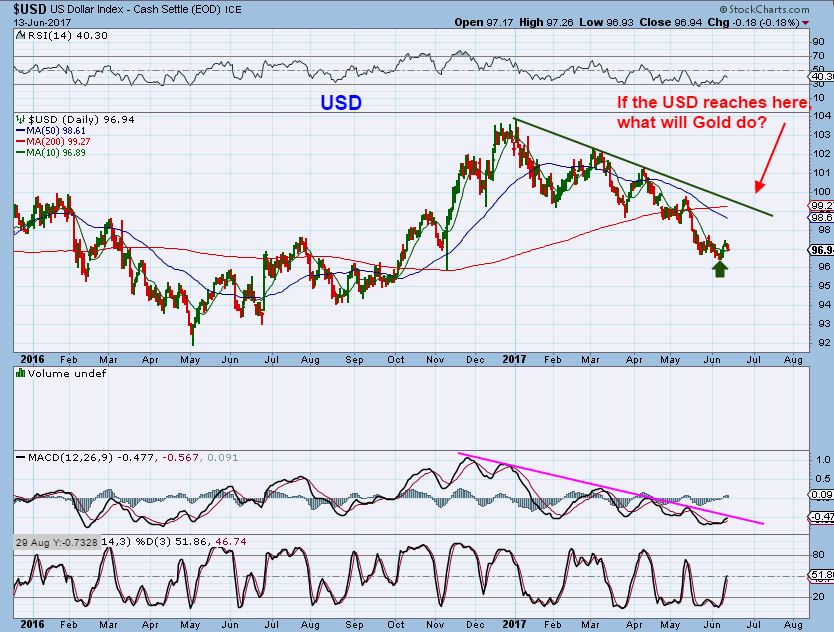
USD – Due for a DCL, The USD has put in a swing low. If it runs higher, you have to imagine that Gold would drop.
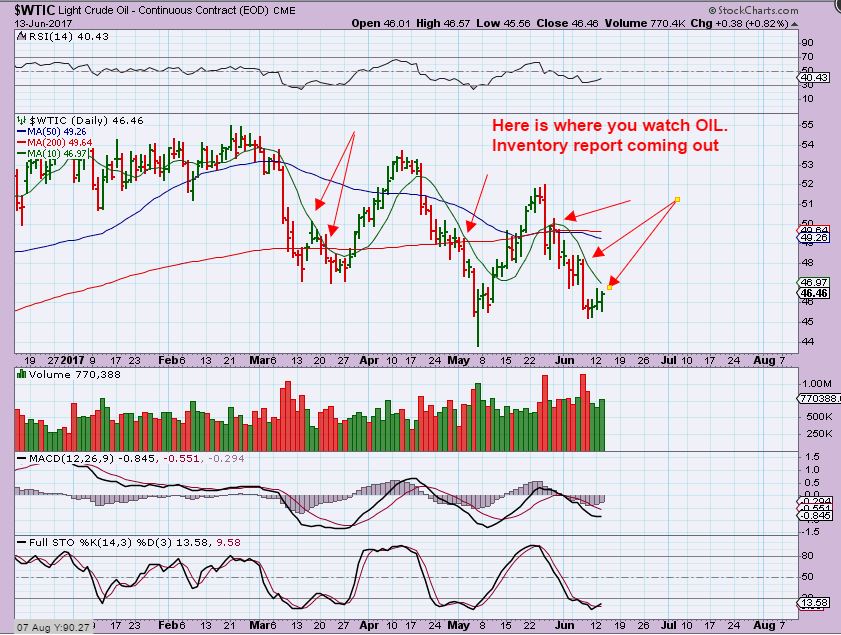
WTIC – Wednesday is the Oil inventory report, and this chart shows that Oil is at the 10sma resistance again. Pass or Fail time. Several OIL, ENERGY stocks are lined up nicely, we will focus on this area when / if it turns bullish. ( AREX, ERF, RES).
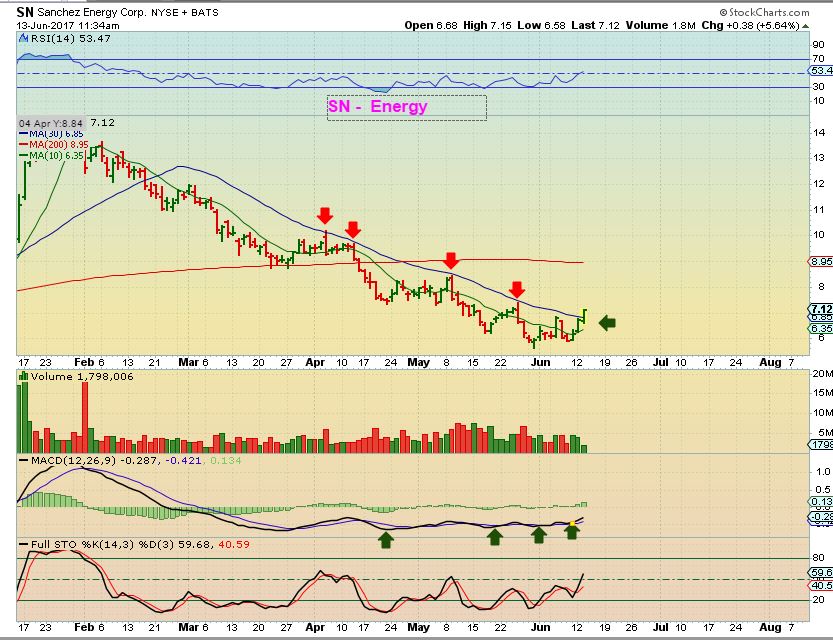
SN – I captured this at 11:30 in the morning, and normally I would buy this with a stop closely below it. Many Oil stocks are shaping up like this one for example. It was breaking above the 30sma for the first time in months. If Oil breaks out, many of these are probably rising out of the lows.
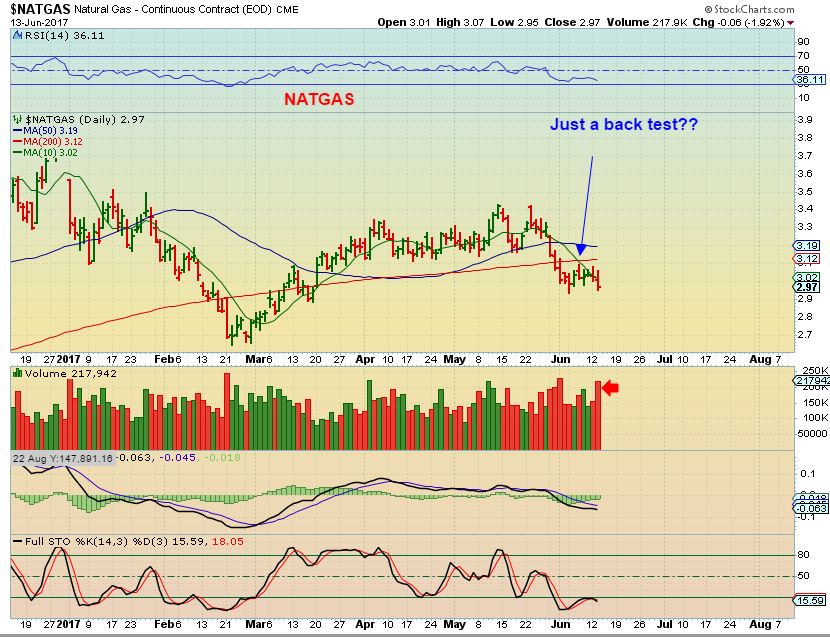
NATGAS – I’ve discussed NATGAS enough lately, see the weekend report for a weekly chart too.
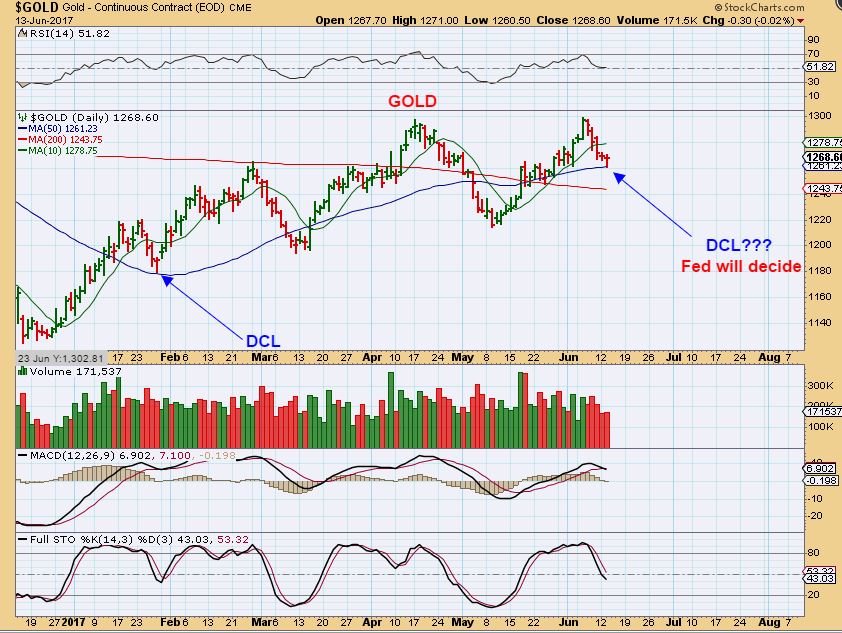
GOLD – Gold stopped right at the 50sma. It IS in the timing for a dcl, but I didn’t buy this because these daily cycles can extend for another 10 days too. It is Fed Wednesday.
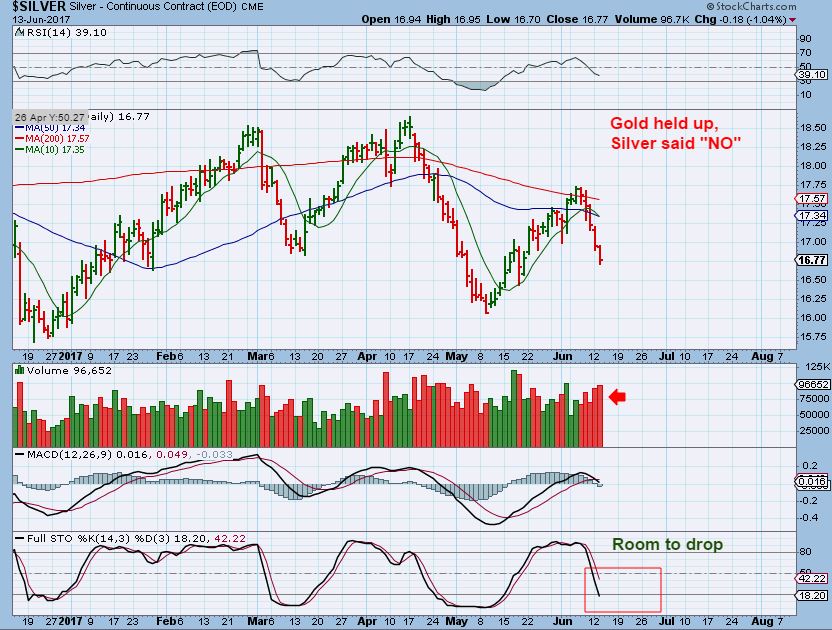
Notice that SILVER did NOT put in a reversal. Selling volume picked up and the stochastics is not quite oversold.
GDXJ – To be honest, this is usually a bullish break out that I would add to my position. I sold my Goro & GSV, and I do not own any precious metals stocks now. I want to wait until Post Fed Decision.
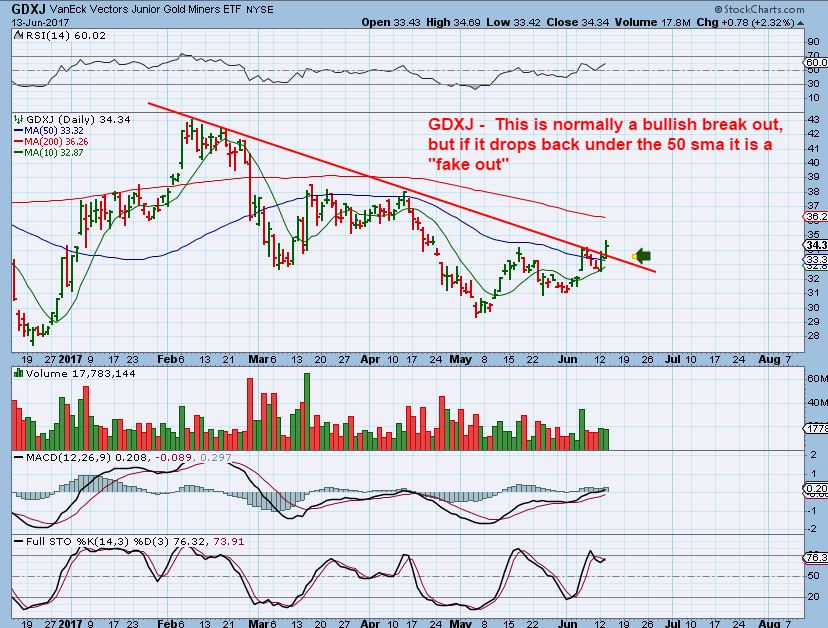
I wanted to look at a few more Miners, like I did in yesterdays report, to show how mixed this picture still is. It also shows that, after the recent consolidation, if we get a run higher similar to what we had in 2016, we have a lot of upside gains coming our way.
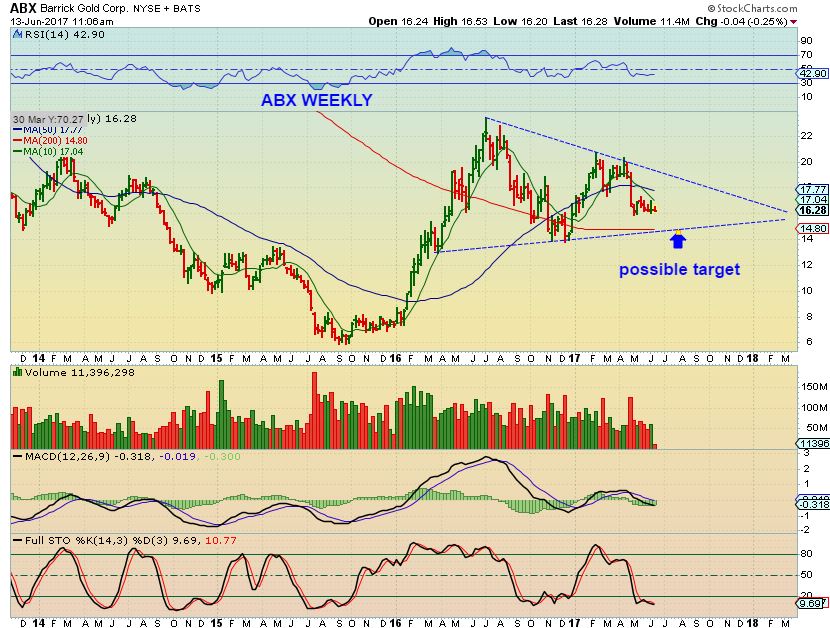
ABX – Whether price drops here to the lower line, or breaks out, a run like 2016 added on to this consolidation would present very nice gains.
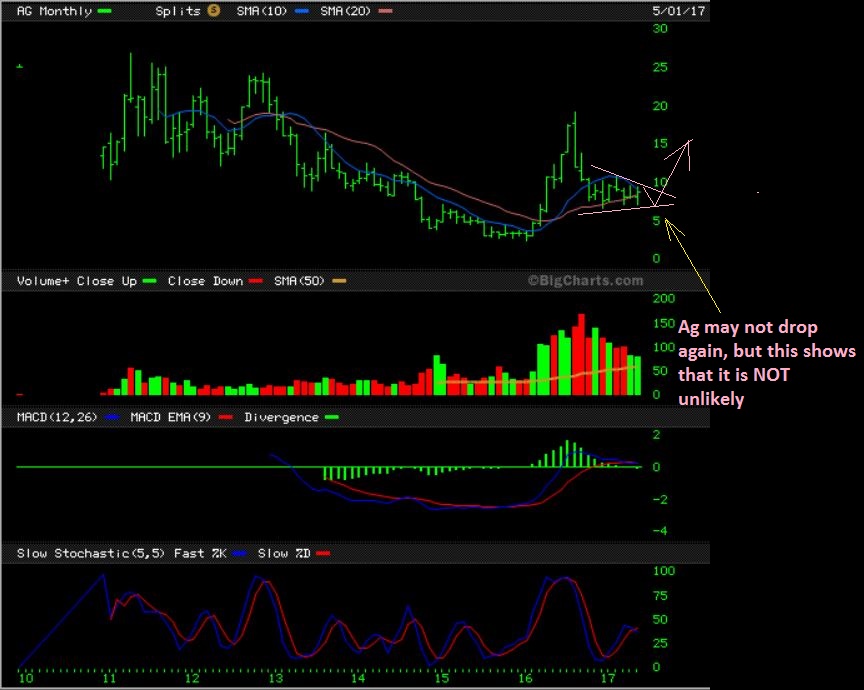
AG MONTHLY – This monthly chart remains bullish. Price can drop from here into an ICL and present a great buying opportunity as drawn. A break out higher would do the same, so patience will pay off one way or the other.
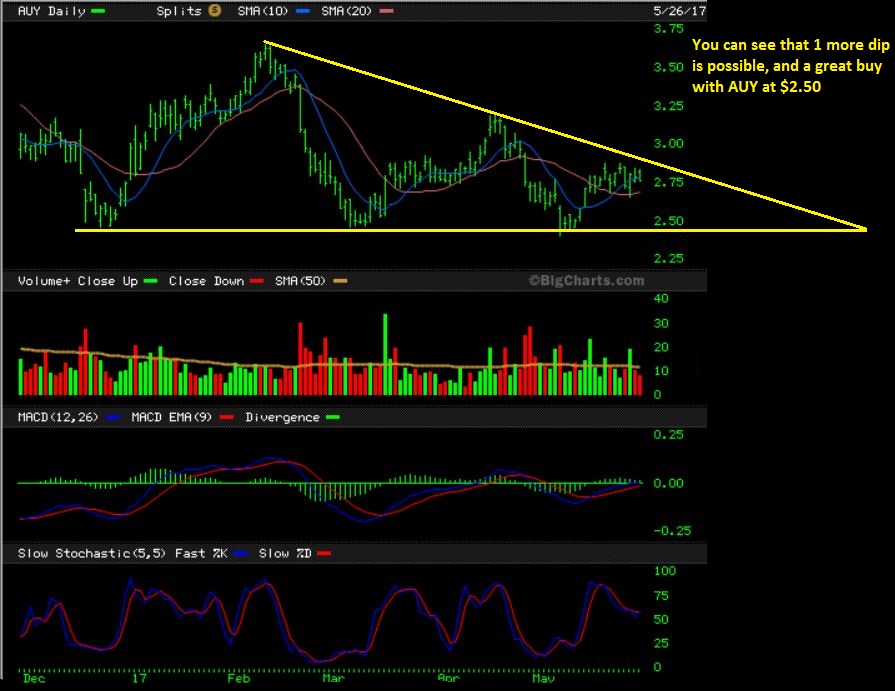
AUY – A drop to an ICL is perfectly normal in the big picture. A break out towards $3 would be too.
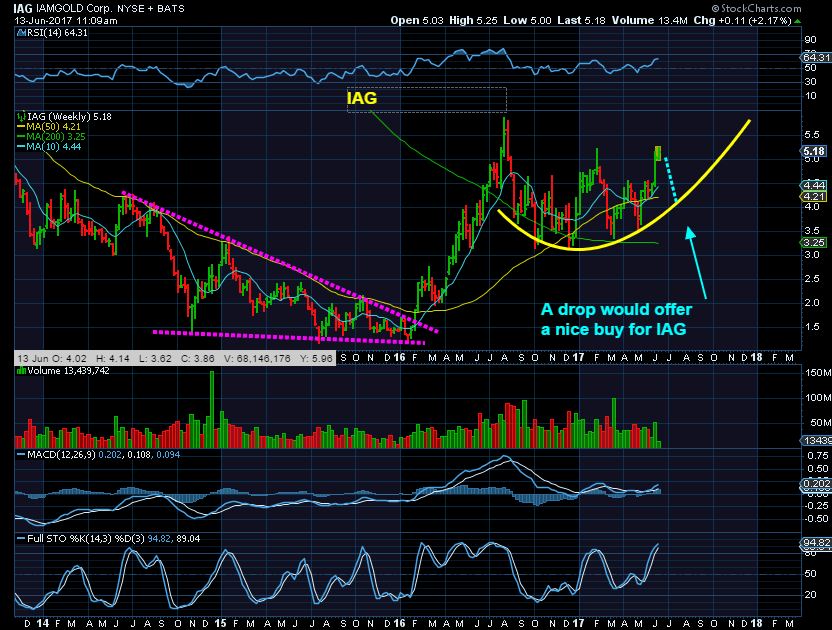
IAG – IAG has been quite bullish lately,
but a drop into an ICL from here would be great actually ( Drawn in blue).
So Miners in the BIG PICTURE remain bullish and a nice buying opportunity (long) is fast approaching. Finally I wanted to just point out a chart that I like a lot, and I did buy it Tuesday morning.
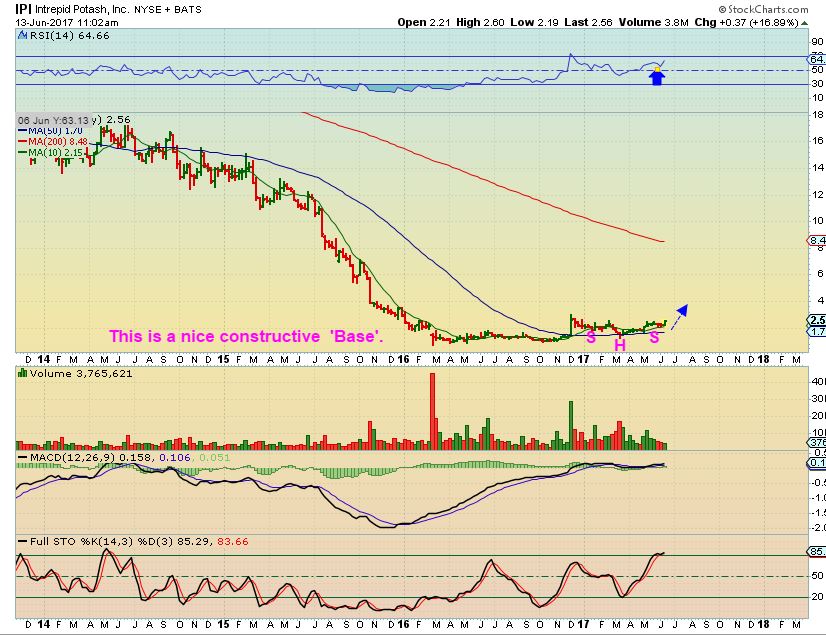
POT, AGU, MOS popped last week, and I mentioned that I wanted to watch IPI, another fertilizer ag stock. Tuesday it POPPED and I jumped in early, but dropped back down a bit. I still think that it could be ready to go.
IPI– This is a long base that appears ready to break out. In the past, we have bought these and watched them rapidly run higher. Bases like this can produce some of the best gains, when they are ready to go.
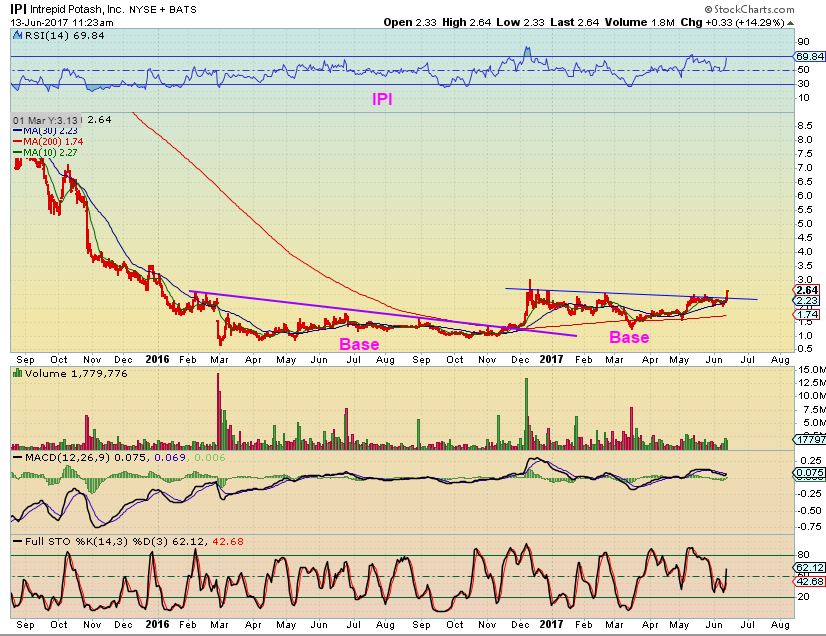
The IPI weekly chart looks like an Inverse H&S too.
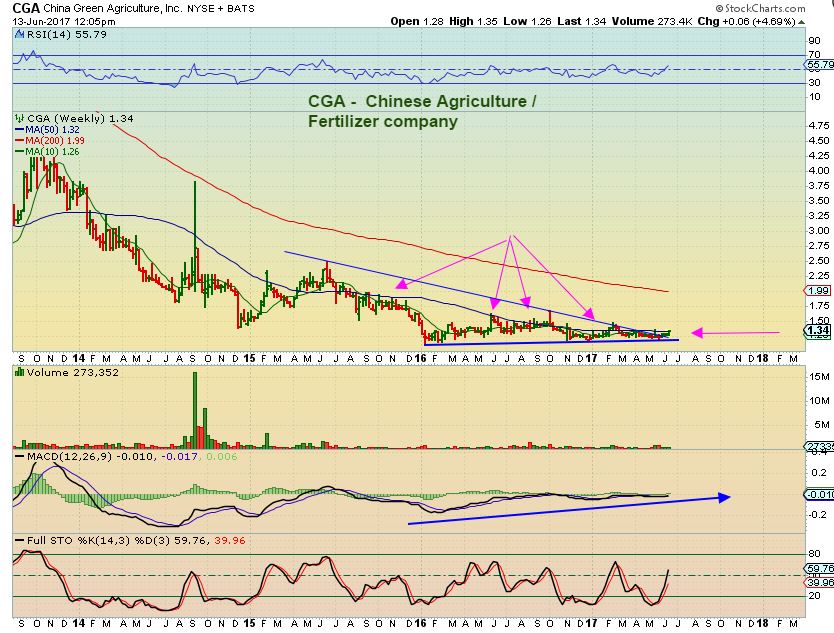
CGA – With POT, MOS, AGU, and now IPI Popping, this is another China Ag stock on my list. I am watching this one now too, and the 1.5 year base looks constructive to me . The daily chart Popped Tuesday too.
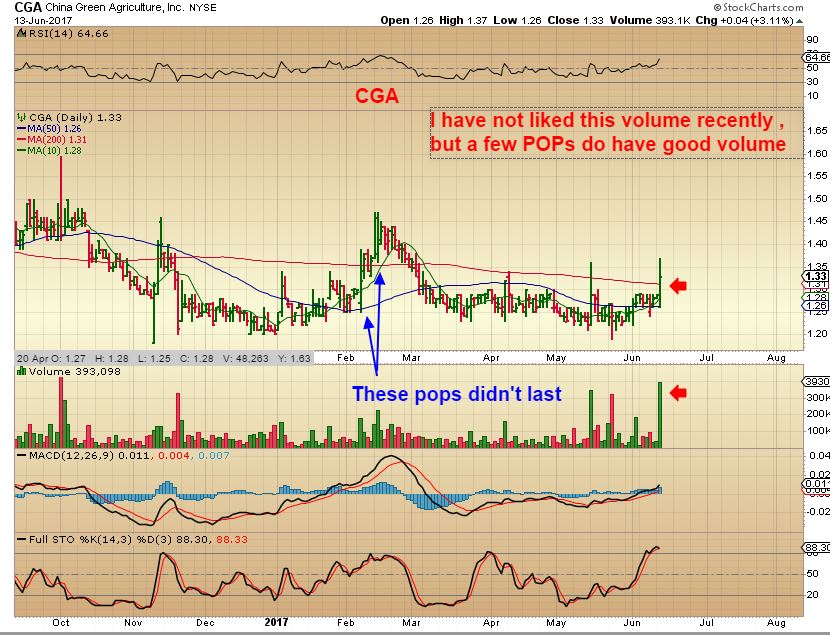
CGA DAILY – I watched this one POP, but I am concerned about the average daily volume. It also Popped in February, but it just wasn’t ready to leave the base seen in the weekly chart above. Look again at that weekly chart and this POP may have caused a break out from the triangle. I’m keeping an eye on this one now too. It is in a 1.5 year base.
It’s a Fed Wednesday, and anything can happen after that Fed announcement. In the past I have warned that the initial reaction is NOT always the next lasting direction. In the past I have seen a sharp rally from 2 p.m. into 3 p.m., and suddenly it rolls over and sells off into the close, followed by more selling down on Thursday. I have also seen the opposite happen, with an initial sell off at 2 p.m., and then buyers step in at 3:30 and it reverses higher into the close.
Personally this has been a very tricky set up with Gold. If we get a rate hike, it should be bullish for Gold, but we didn’t get a normal ICL sell off, so we just may have to endure a sell off into an ICL first. Gold has just simply been putting in higher highs and higher lows.
Well, as you know, I’ve been talking about this day after day after day, trying to help everyone understand what I intend to for and what could happen. It is finally show time! I still recommend keeping positions small until we see what is going to happen, so let’s just see what this Fed Wednesday brings. 🙂 Happy trading & thanks for being here at Chartfreak!


Thoughts on TGD, now ALO? Been moving aggressive.
Hi Mike,
What exactly do you mean by “Thoughts”?
Yes I agree, been moving nicely.
smarty pants answer!
yeah.. every ONCE in a while he does have a thought… mostly… just blather….
Hey, what happened here? lol
I’m being attacked for nothing? These Fed days really do stress you guys out..
#Goforawalk
😀
https://uploads.disquscdn.com/images/5e3047ca5490c5e06cd0ce677c571a8ccb1e0ad86a55f78659b819da5c3ccaa0.gif
Just teasing….but I admit, I am stressed by this situation of no hint of trend. YIK!
What’s going on with $gold? Just back testing 10dma or finishing 1st dcl? So confused!!!
Yeah, Idk, if this breakout holds through Fed we’ll have to face the obvious fact the ICL was back in May, redo all of the cycle counts and try to figure when next DCL would be for the lowest risk long entry. If we blast off from here I can’t tell when the low risk entry would be bc by current count. As fun as shooting higher sounds this is actually the worst case scenario for those of us sitting on the sidelines ready to jump in.
Never thought of NAK as a safe haven play during fed weeks. #zzzzzzz
I believe that URA is finally really bottoming,
A few have strong divergence as they skim across the lows ( See UUUU, URRE )
URG had that last week and now it is bull flagging above th 50 & 200sma.
🙂 I am most always early…….
ditto
Better safe than sorry – locked in a nice big gain in NK yesterday right above the 200sma… And wouldnt you know, she rips above again today…
Bill, $$ getting crushed this morning…
It holds the key…
#BH HB
Its due, not sure what’s going on lately? Very confusing, its like cycles don’t exist anymore. #HB is #HFT
Once a method becomes too popular, it quits working. I may be the classic indicator, and since I’m now a true believer in cycle theory, it’s probably losing its effectiveness. I must’ve done the same thing to the poor Elliott Wave folks a few years ago.
LOL, Cal! Happy Trading…….
LOL! I thought it was ME jinxing everything! Glad it was you!
Idk Cal, it could have been me as well. Just ask SOG, I’m pretty much the kiss of death for a trade, why not for an analysis method as well?
I’ve posted a couple of times, but yeah I just don’t understand, it’s just not lining up like it used to. Confused to say the least.
What is your cycle count for the USD, when you say that it is due?
Maybe cycles are working, but the count is off?
I was looking over the USD charts and wondering if we are due for an ICL right now or at the Next dcl.
Im just counting Gold day 25 and Oil day 27. USD probably on day 35, very extended. The last 4 cycles from 20 to 39 days.
Pretty rough selling in some of the energy names after surging yesterday. #NotReady
AKS playing around with that 50sma. Hoping it doesn’t close below it.
IAG, GSV, & ALO are really nice looking run over the past few days.
Others are not looking as great.
If the Miners are ready to move higher after the Fed, others will follow and we will have to catch them, but for now I’m still waiting on the FED.
CLF crappy drop too.. though it looks like its may be drawiing out an inverse right shoulder at 5.98 (left shoulder would be at 5.97)
Yes, I’m not in it, but I’m watching ho it reacts to the 10sma on that one.
I am…..although I did reduce exposure this morning (not by choice 🙂 )
I think I will add to what I have held when it is ready……I like it as a Long Term Hold.
So far CLF held on that 10sma, and AKS dropped to a back test and seems to be moving higher again.
So far, so good.
SUX!!! X down hard again. It’s bouncing from 20-22, I sold at $22 just assuming it would drop right back to that bottom rail again. And here we go.
AKS X CLF WLL OAS all are casino play!
Based on what analysis?
base on my understanding of current white house administration. It’s basically going nowhere.
lol – wont argue that
So…what are your current holdings ?
Based on your understanding of the current administration …… 🙂
You could always leave ?
Again i ask, based on your position of the current administration what are your holdings ?
Leave for where? I don’t understand your question. I hold 95% in cash.
nice to have disqus working for me today
My view of AKS at 10 a.,. – Nothing wrong at this point. Still well off of the lows, but I would like to see it hold this 50sma
Chart refresh
https://uploads.disquscdn.com/images/64ad9bb198ab074bd3b1700f92a7544d5c7ece8098eb2b1e6b172f0bb266d718.jpg
XLE drop 1%
Oil Report …..
Crude -1.7M. Gasoline +2.1M. Crude sliding a bit, about 1.5% but still early in reaction phase.
UWT straight down
Buying a few USO calls……. stop below recent lows…. less than 1% risk straight up.
hey K.. thought you might be interested..
weekly USO finally did a touchdown of red channel (channel top at 9.33).. and falling inside
https://uploads.disquscdn.com/images/ef64d681af158b9a6f61b5951f81a34781e5c522149849d7ab9d2277e3a1ada8.jpg
Thanks SOG. It is close, I can “smell” it…. lol.
Bonds (TLT) breaking major TL……..
and as most know….. lol 😉
The YEN is breaking out, and most know what I think about the YEN & GOLD moving in the same direction.
Refresh https://uploads.disquscdn.com/images/d52f48ca1075ef8979f2503cef01d73d09c0b0ac45e24105f17324b3453eee80.jpg
I sold my GORO & GSV, but I wish I had held on to them until FED DAY like I originally planned.
SIDENOTE: At a glance of the chart, SLV looks like an ICL in MAY and a DCL today.
This has been a very difficult period. I hope things clear up after the FED today, as you mentioned. I bought the Canadian equivalent of UUUU and CCJ as a long term holding. Hopefully uranium has turned a corner.
LOL
lol. what’s so funny??? 🙂
OAS completely schizophrenic!! Up 10%, down 10% the next. You’d be WAY better off with a slot machine. Energy is TRYING to bottom. When it does finally, could be really good. But you can’t be early here. Nuts!
GDXJ was up quite a bit this morning. Now, do I go long or short 🙂
Both! You’re guaranteed to be right!! (Then you can brag on ST!) 😛
we might as well make this interesting and take a poll … person closest to the correct ‘price’ wins ummm … a free ‘session’ with chartfreak..
LMAO
#evilLaugh
*a trading session .. u dirty P .. I … G… S . 😉
Uh…how do I lose on purpose? 😛
GDXJ/JNUG backing down from early morning sprint…Gold not budging.
hi alex
can you comment on the steel etf SLX ? Steel looked like it wanted to break up but is now reversing… same as other names like CLF, VALE , etc..
China industrial data overnight disappointed Asian markets, potential spillover in US equities for commodities?? Just a guess. Happened last week as well.
Hi Frank
SLX itself was rejected at the 50 and 200sma, many other Steel stocks look to be bottoming.
They have strong MACD divergence and are off of their lows.
$DJUSST itself was able to break above the 50 & 200sma, but it has dropped below it now.
The selling is always something to keep an eye on, but at this point it really could just be a normal base-building process at this point.
CF any new thoughts on oil with today’s selloff? So much for that 10day bust.
Bill – XBI trying to break out!! (I posted chart late Monday, too late for most to see). Just added to LABU.
It’s not really a matter of new thoughts. I have been thinking that OIL could tag the $42 area. Some energy stocks appear to be leading out of the lows and acting correctly ( AREX, ERF, RES) and so I am watching to see if Oil / Energy stocks bottom first, but I have mentioned in the past that Oils ICL could be near $42 and the last bounce was just a back test of the break down.
I’m not long Energy
CF-I’ve been thinking along the same line for some time as well. I see a 3 drive pattern playing out with turn at $43. I was in but got out too early.
https://www.tradingview.com/chart/USOIL/RtEgLHi0-USOIL-Trade-idea/
Ok, thank you! I remember the $42 call, wasn’t sure if you had modified any. I’m still short 2/3 (crude) and deciding if I should just take the profits or keep riding. After a drop like today it usually bounces a bit so trailing stops can be a little tough.
Agree, looks to be breaking above the trend line. TSI moving higher. Could run to the top of the channel?
https://www.tradingview.com/x/qEGGf9zw/
Is it possible that silver, gold, and miners, rather than falling into an ICL at roughly the same time, are now ‘out of phase’ for this intermediate cycle so that the ICLs are occurring weeks (or months) apart? Maybe due to geopolitical events keeping gold up and not so much silver and miners? Just thinking out loud…
In the past I have seen Miners bottom at a different time than GOLD.
Look at the charts, that 2016 run in Miners started 1/2 way through January, Gold actually bottomed in Dec 2015
Right. Good point. This one feels different though. Even the feel of the days leading into a Fed decision feels different. Like something under the surface has changed. Like the song is different – the beat and the rhythm is different but everyone is dancing to the old tune. Can’t put my finger on it though… One thing I do know is that after each of the last three rate hikes the 2 year and 10 year bond yield curve became inverted for a while – suggesting a recession on the horizon. So really, though it was well telegraphed, the rate hike decision IMO is bizarre given inflation numbers etc. This will be interesting going forward. I am soooooooo curious to see what happens here…
CF I know you mentioned (and so did Geoff) that TDW was going BC… However, im holding on. BC means little to nothing with some of these charts. And im not in for a long haul – in at .86 looking to exit around 1$…. But I appreciate the warnings. Charts too pretty to let it go
BT- Can’t figure out what you mean by “going BC”- can you enlighten? Thanks
Bankrupt
Look man… Im getting tired of this… Tell miners to do something, CF – and make em listen, and then your followers (Us) will copy and get paid. Hurry up and just do that. Thanks
https://uploads.disquscdn.com/images/1a8551171cb7d9ce9ff925691f00013a742b8e9b3746af51342ff454a8dbd4c4.gif
LOL
Exactly! I agree!
SOG…..
Would you be so kind and watch Crude for us and keep us abreast……I would like to know if she hits the bottom of your channel. Thanks in advance. 🙂
sure thang K-dawg 🙂
FYI.. bottom of red chn is 8.50 currently
I see that on chart below and the channel is moving upwards so….. 😉
its a weekly so it moves real slooooww.
last 3weeks range = 8.48-8.50
Cool….thanks.
… stop out the longs… stop out the shorts….. make everyone chase…. lol (my prediction … jk
Up, then down, then back up….then ???
Have a beer ! 😉
bahahahaah
this is funny
Anyone watching GDXJ intraday 1 minute chart knows why the FED WED is so devious .
UP, DOWN, UP…
yes…. its nuts… https://uploads.disquscdn.com/images/bfae96a41d0544c7cb26a3518df60de3298d5590e9bafd2acc59dc26661a11d7.gif
Gold hardly moved, now Miners selling off pretty good
Speaking of MJ stocks! EDXC looking a little buzzed……..
yeah.. the whole list ‘Lit Up’ ;o)
YukYuk…my 4 MJs are all still red. Poo
Blaaahhhhaaaaaaa
So….. do we buy miners. or short em…
GDX is still in it’s Triangle……
Probably going to be short it or wait for a dcl ( ICL)
Thats just the vibe I’m getting at this point. The day is not over yet,
dang…. cray cray…
Huge volume capitulation and reversal on GDXJ 5 minute chart. Now it looks bullish again- lol
Def CRAY CRAY
https://uploads.disquscdn.com/images/1d19d9215cd73d4bd284c3ac2186e6d05d9fe94782f50a64381f71afa738ddf2.png GDX:
Just to be clear… the point of the chart ? Bullish or bearish in your view ?
I guess I should add…or neutral
Ha…..tricky question.
Since I still have a core of jr. miners my view may be tainted…. 😉
But…. I would Love to see GDX break that upper channel and hold the ReTest.
I hear ya. I sold mine so I wouldnt have to ride the Fedra-coaster
I’m getting a feeling that we are going down though. Really won’t know until the close ( or Yellen stops speaking)
Just think of how cheap JNUG could get again 🙂
oh, and if it broke out and held on a back test, that would be a great place to buy
🙂
Timing wise I expect a drop to the bottom line, then the ICL.
Are you saying that that drop will be the ICL or that the ICL is later?
Still Above the May 8 Low (ICL) if the lower channel holds…….
Good point, you need a failed cycle to get a ICL. So, the price would have to drop below May 8th price. We are on day 25, I expect 33 days around based on the previous cycles. Best guess.
I expect this drop to be the ICL.
It doesn’t matter whether I was holding JNUG or JDST- I wouldn’t be confident that I was correct with this type of intraday whip saw.
It is actually good to be on the sidelines ( And I can also re-enter GORO or GSV cheaper than I sold it for yesterday if I wanted to 🙂
OK, YELLEN NOW SPEAKS… This ought to stabilize things 🙂
HA!!!!
https://uploads.disquscdn.com/images/2d40ebf0dee8ff99cf30eb67ef94d98ace3d28174532fc04cec29094df67e6d3.jpg
Janet’s bla bla now!
Now if she can get silver to turn red, we could see some damage done.
Still riding my poorly timed $65.50 jdst. The last couple days weren’t pleasant;)
Entered decent JDST positions @ 63.34, 65.26. Relatively tight stop.
Well I added 200 shares of DUST 28 for a scalp.
Get Em Bay !! 🙂
LOL I Havent scalped in a while. The rush is kinda fun lol
Had my “rush” this morning with Crude… lol
entered jnug as a scalp… 😀
Added back to CLF….PSAR is my stop.
Kinda crazy, SLV held up all day and just started to slide in the last 10-15 min, almost a full hour after announcement and long after Gold and miners started to retrace?!? Interesting?
Even with miners down, remember JDST was almost $85 to start last week!
Big reversal candle ( So far) off of the sell off low today on a daily chart
Stocks selling off now too … maybe a top there?
Doe looks ok but NAZ getting destroyed for 3rd time in 4 days. Ouch!!!
If you ain’t short, you haven’t made much this week. All of my longs have been getting killed for awhile now. IBB does seem to be holding ok though.
VIX only up a tiny 5% – no fear? there must be some more work to do on the downside
ThinkOrSwim has new software, so we’ll see how this work
Here’s Daily chart of GDXJ – seems to be flirting with important support
http://tos.mx/OrmYxL
Well that wasn’t very good – I’ll look for another method!
Can’t access the site, you’ll have to cut and paste.
https://uploads.disquscdn.com/images/d7b325fd5fcc85161b8b37b425bfafbfbb2fa3f7b6e50aaf307f14eb3b8efd59.png
Let’s see if that’s better than the last one
Looks like Kens chart below. Did TOS generate the support/trend lines automatically?
Sorry to repeat – been too busy to keep up with all the posts!
No, I’ve had that drawing going for a long time – the bottom line connects with the low of January 2016
Big rebound last 5 min with short covering.
For grins, here is a close up to show the lower support line (sorry these are so big!)
https://uploads.disquscdn.com/images/fdcc900c55332f0ede27a22073a64abf92a31fcdcfb2a5cbcbb352773d4f8070.png
I just do Not see how you can NOT be vested in the general stock market…..that is where the big money continues to flow.
It is. I don’t talk about it in here much bc I don’t actively trade in and out of some of my holdings like I do here. But I have a fee holdings that are just long SPY, RUT etc and it’s just hold it, add and forget about it. It’s tough fighting the man!
Oh thank goodness, hopefully we can get a solid, tradeable, identifiable low here in PMs soon so we can all go long and make some real money (instead of just getting paper cuts!).
Long tail “signal candle” on SPY from yesterday’s pre-market and AH hit today, then SPY reversed at EOD.
Conspiracy … or coincidence? https://uploads.disquscdn.com/images/c0f7487c1efeae45c66236a4def50fcae9df4597fa8130412bdb6d786ec08a3a.gif
https://uploads.disquscdn.com/images/4bca7f22462fc6e5f90dc9be875e90160f05fd31f3057488038642bb4567de13.png
HEs Baaaaaack! I see those with Schwab as well. TGB (smaller stock) did the same thing about a week ago.. 1.19 long tail.. Sure enough a day or so later, 1.19 like clock work
Interesting
Where you been???
Man, gonna have to be a good report tomorrow. Good thing CF is writing it and not me. Can’t wait until tomorrow morning to read it. Can’t wait!!!
https://uploads.disquscdn.com/images/73b9e5a6c10ef3b54d25052ed6953c6ae1b56a53c03ddab1a69ef601060b47a9.png
Yep…. like wise me Cason! See what Alex find today after the FED storms.
Do you think he will go short with GDX ??? (buy DUST)
Thanks for reading this, and…. have a good evening.
Hi Guert, this is just me – but I don’t think CF will chase a new short here after that fall today. Likely to concentrate on finding us that next low. Might not have to wait ling either. Could be good!!
Thank you sooo much for your nice response, Cason !!!
Yeah man, good luck. I keep reviewing GDX/J from last Dec where miners went down. Huge red day, gapped down hard then spent 3 days carving a bottom. If we follow that this could be quick. Dec ’15 took much longer but as soon as the low is spotted trust me it will be all over this board!!
The THURSDAY REPORT has been released….