
Tuesday May 23 – Patterns Within Patterns
Please reread the weekend report for my thoughts on the markets. Mondays moves still fit the thinking that we have gone over for the past couple of weeks. In addition to the weekend report that I released, I gathered some charts of trade set ups or trade ideas that may be forming. At times we see patterns forming within patterns, like the picture above, and I want to share those charts here…
1st, there are 2 charts that I need to discuss –
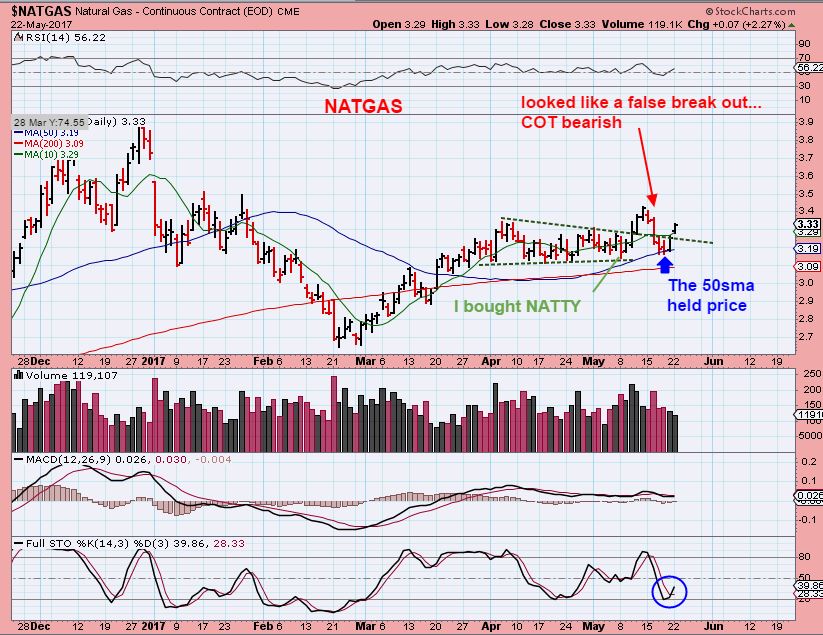
NATGAS – Due to the bearish heavily short COT report, this has been a very tough trade to hold ( I got stopped out while on vacation recently). Natty broke out and then invalidated that break by dropping back inside, but has now found support at the 50sma. It is a low risk buy from that standpoint, but a bit tricky because the inventory reports are released on Thursday and the weekend report showed that COT has been increasing in heavier shorting. It is a personal call whether or not to take this trade here, but the stop under the 50sma does make it low risk.
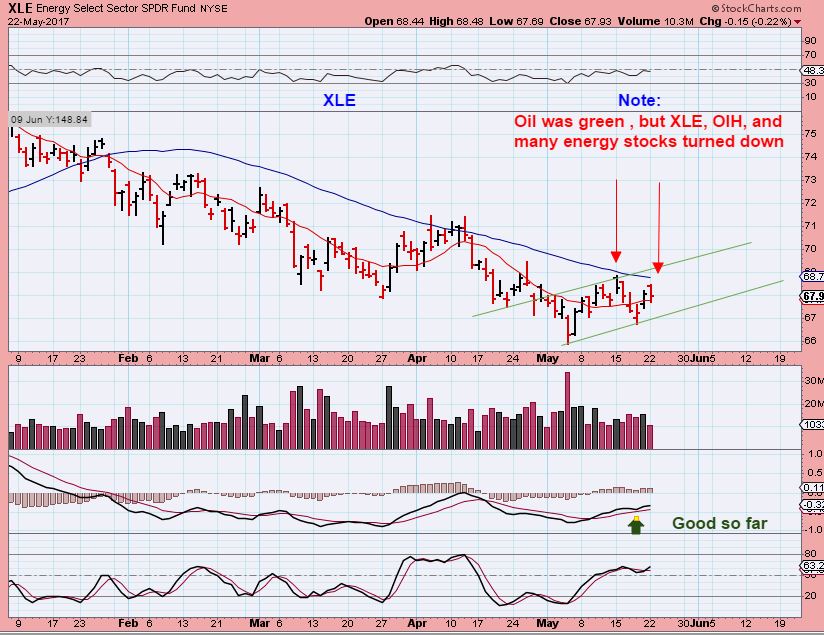
XLE – Please read the chart as a side note, before I discuss some energy stocks. Basically, there is still no break out here, even though Oil broke out a while ago.
Charts From The Weekend…
All of these charts were gathered this weekend. The more research that I did for the weekend report, the more it kept on growing and it just got too long to include them. Many were still valid, so now we have the advantage of an extra day of trade to see if these set ups remained good a day later. You will see that some were possibly ready to ‘break out’, and are still looking like they may do that, so let’s take a look. If you keep a watch list, you may want to add a few of these to it.
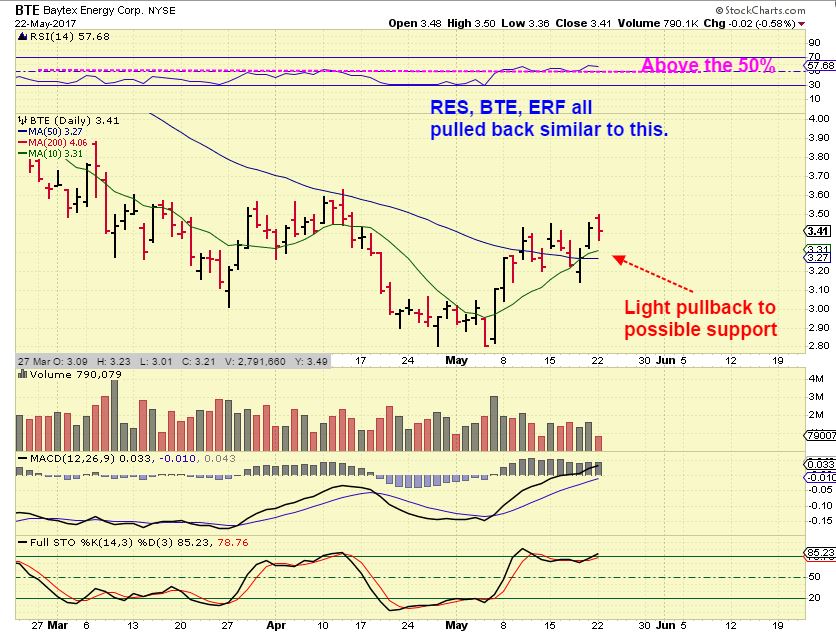
To start: Last week I did mention some Energy stocks that looked to possibly be leading out of the lows or shaping up, and included a few in the weekend report as possible leaders. They were these charts of RES, BTE, and ERF.
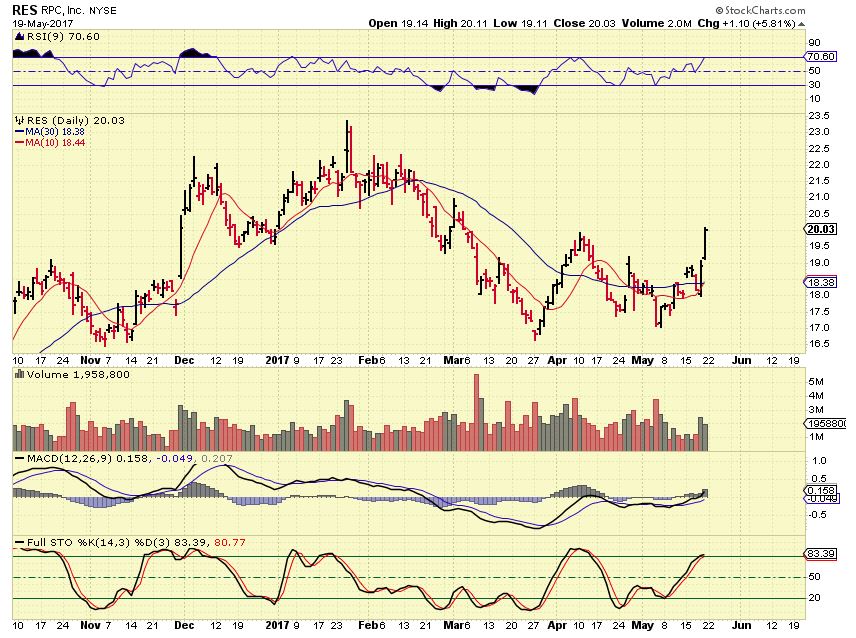
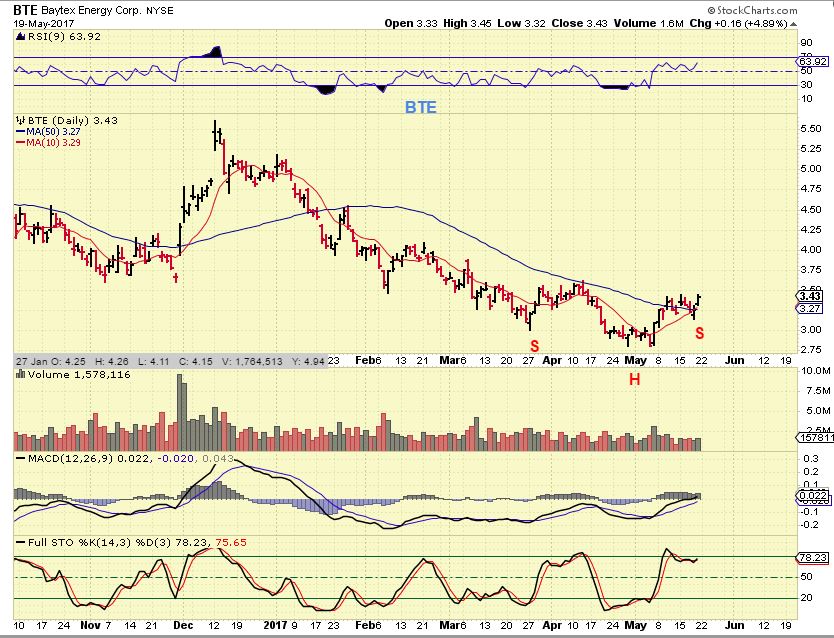
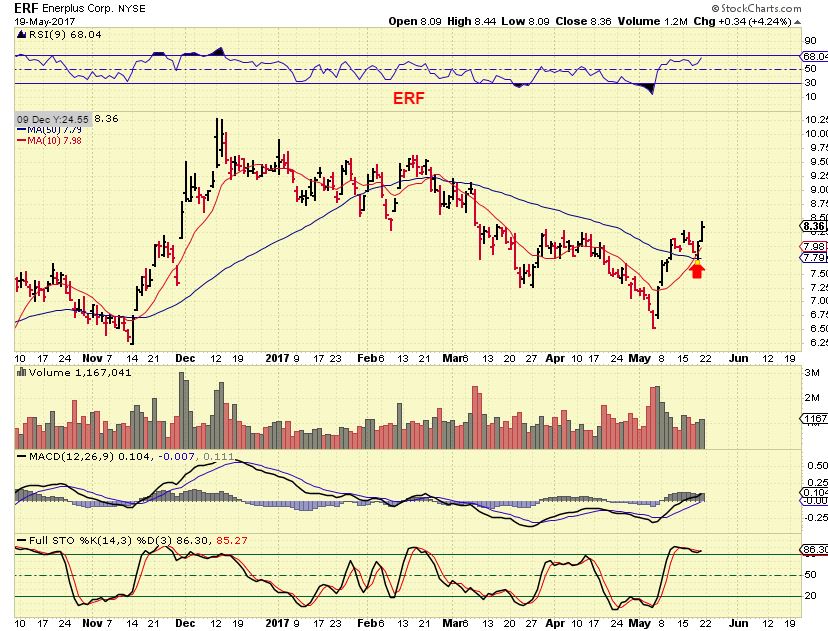
All 3 of the above stocks pulled back like this and they still remain healthy looking. The odd part is that OIL was higher and The OIH & XLE and many other Energy stocks turned down like this, as shown in that XLE chart above. I have mentioned that another drop in Oil is my expectation at this point.
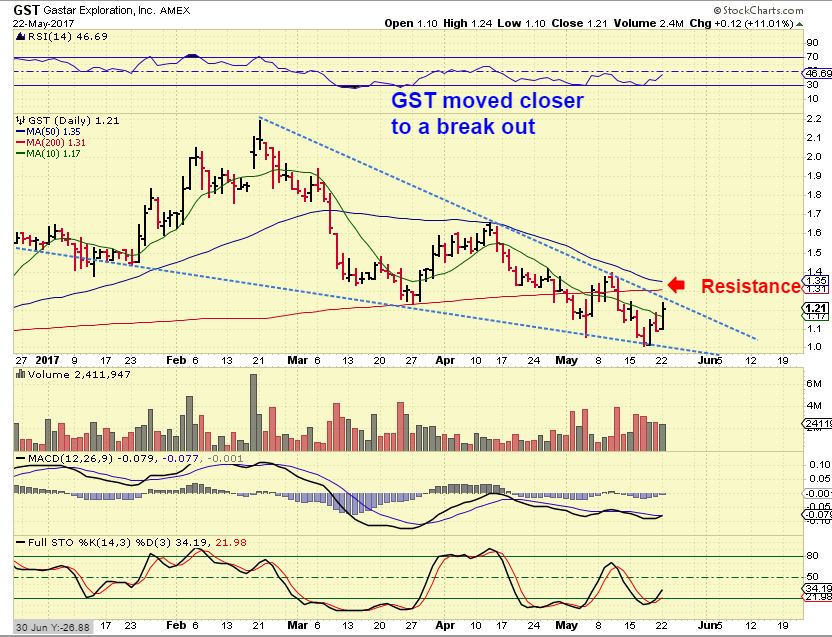
I was also watching GST and drew this weekly bigger picture chart for the weekend. It still needed to move higher ( Above $1.20) to break out, so this was meant ro go on a watch list.
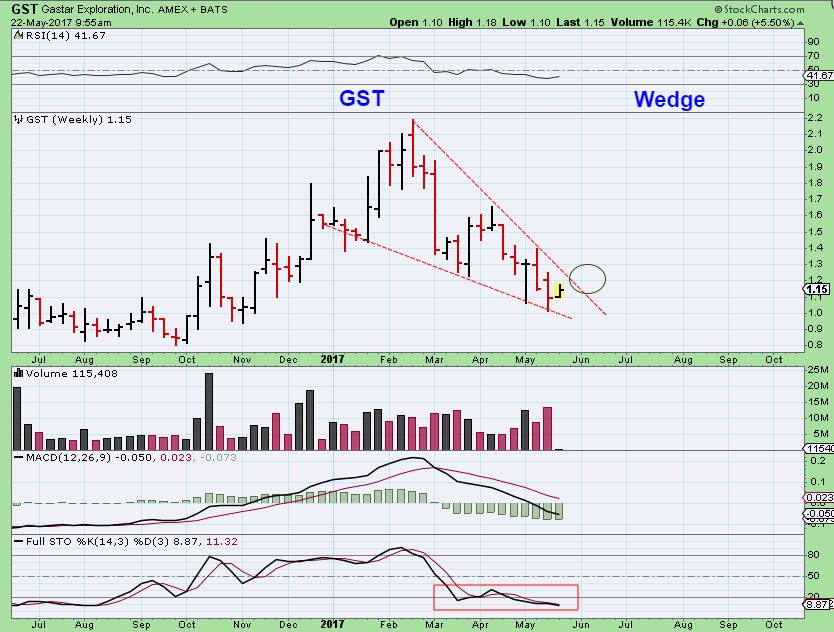
GST on Monday – You can see that GST was actually up 11% more on Monday. It is above $1.20 now, but looks as though it needs more upside to break out. It may do that Tuesday. This is now worth watching for a possible immediate break out above the 200sma.
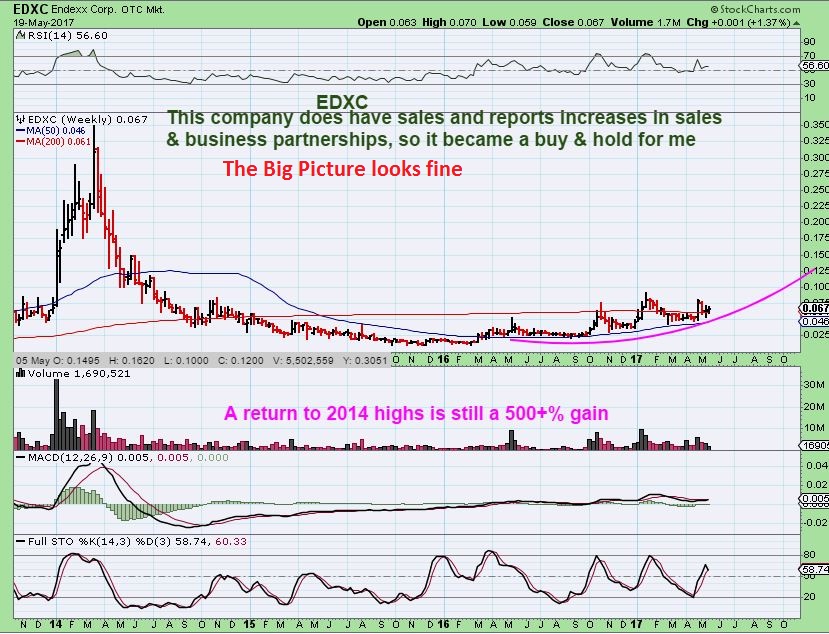
EDXC #1 – Another BIG PICTURE chart , that looks perfectly healthy and shows signs of breaking from a sideways consolidation soon. Earnings were released last week and I own it, so I had my eyes on it. Earnings news was very promising growth-wise. I have presented this one in many prior reports as ‘a growing medical marijuana company reporting increasing demand in pain & anxiety remedies for pets, and they recently signed a contract to infuse Herbal teas for human consumption. This is a large constructive base, though it is taking its time to really get going. A return to former highs is a 500% gain,
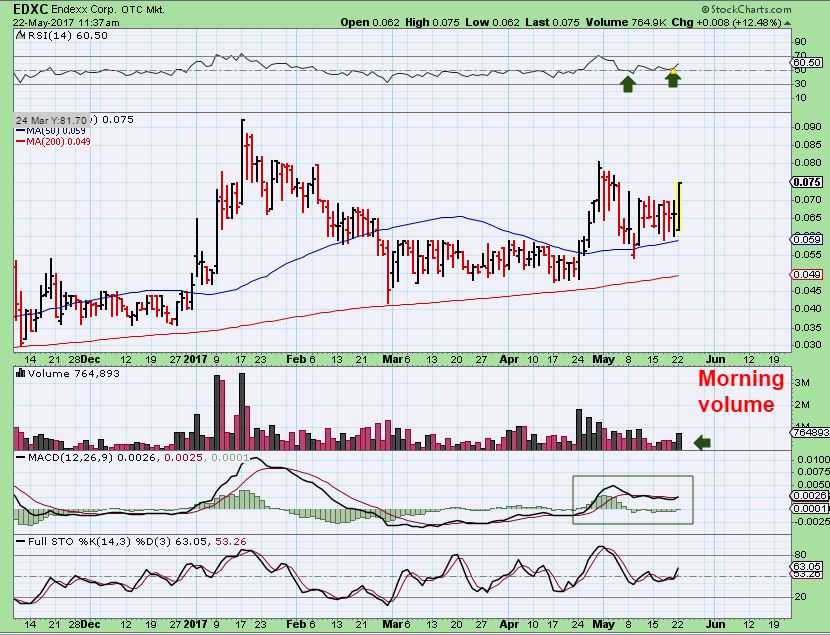
EDXC #2 daily – It has been popping along the 50sma for weeks. This is why the weekly chart looks constructive. Monday it popped and I posted this in the comments at 11:37 a.m. This could be a loose & somewhat sloppy inverse H&S, but it looks ready to break out. It ended the day here with volume over 1 million.
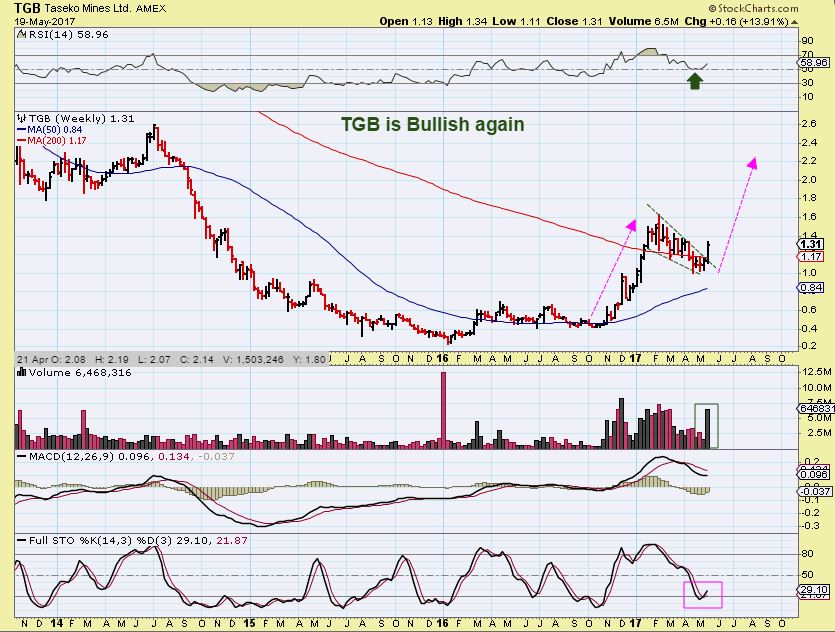
TGB WEEKLY – This is a bullish break out. On the daily, It pulled back 2 cents on Monday and looks to be possibly bull flagging above the 50sma before continuing higher. It could eventually double on its journey to the former highs.
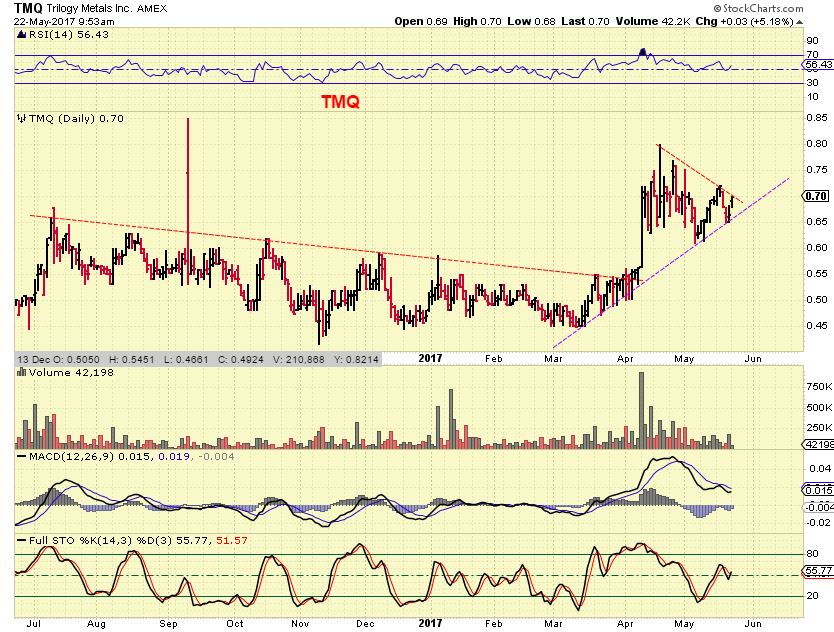
TMQ – Loose bull flag, holding the uptrend line so far. A drop to the bottom trend line is actually a tag of the 50sma on a daily chart. That would be a low risk buy, but it may just break out higher. A break out higher would be a buying opportunity too.
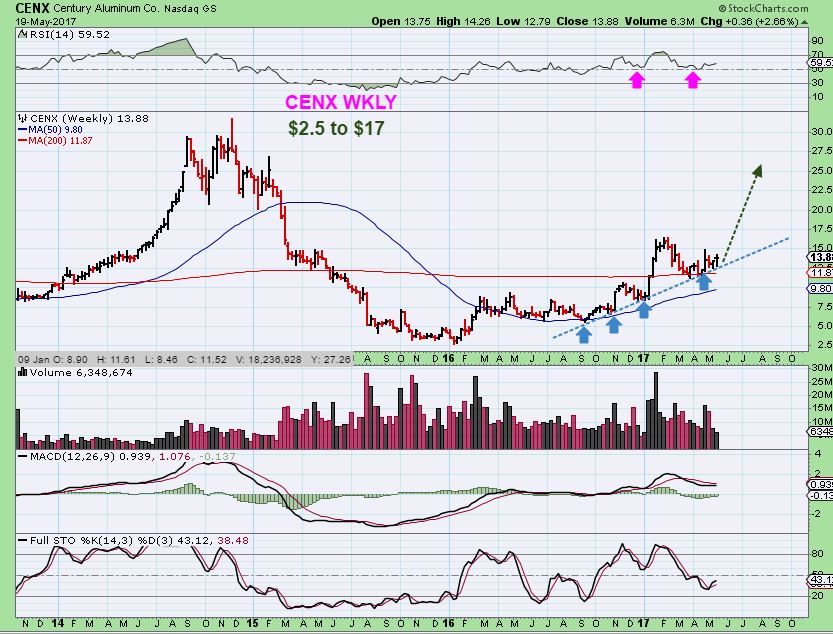
CENX WKLY – Look at this steady climber. If commodities start to all run again, this one looks steady already.
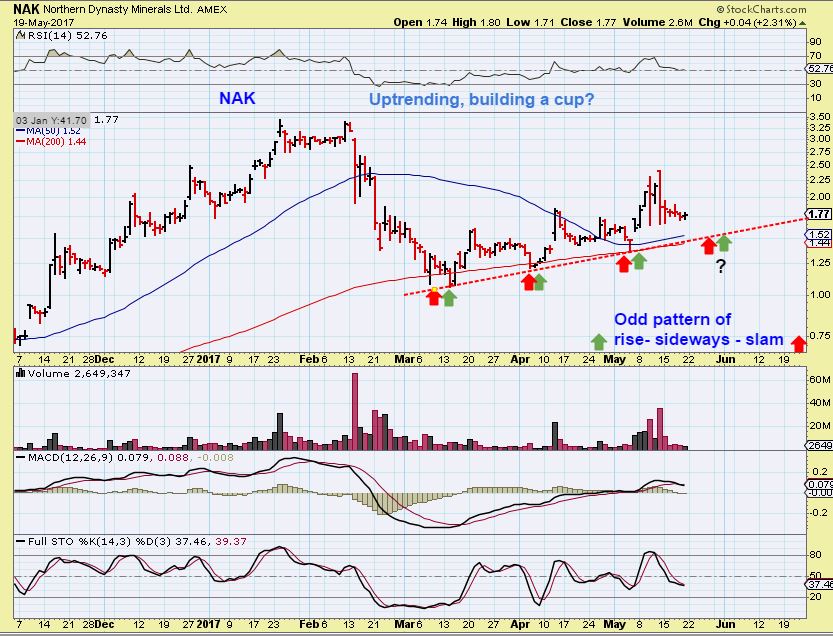
NAK – Semi bad news? It is up-trending but I noticed an odd but very real pattern. It has Tagged the red line (or 200sma see the red arrow)- POPPED for days – then goes sideways, and drops to the red line again. Repeat. Repeat . We look to be in the sideways part before a quick drop, so this MIGHT drop to the red line before the next move higher if this continues. I would consider adding there if it did. I’m not selling what I own, because this drop may not happen, I’m just preparing you for a possible pattern to continue playing out.
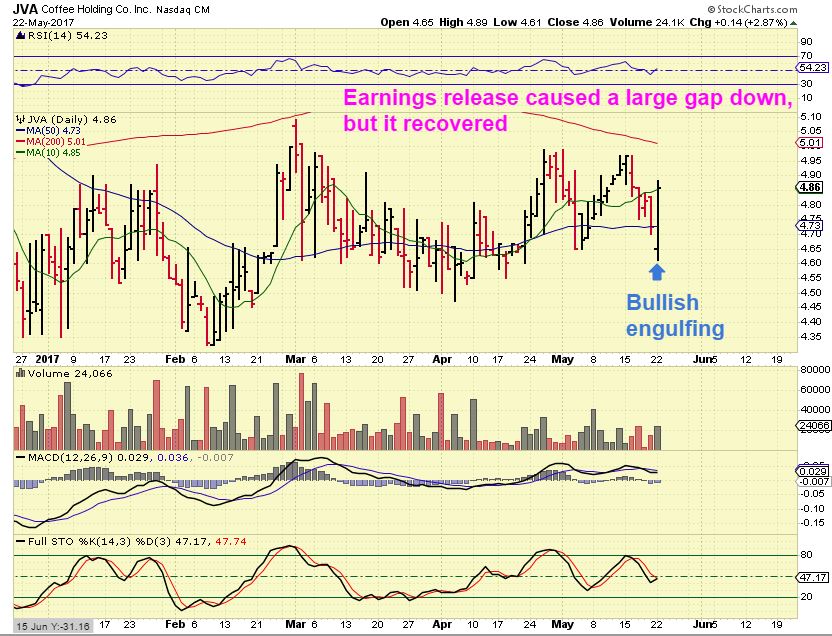
COFFEE WEEKLY – I noticed a double bottom on Coffee (JO). JO has returned back to the 2016 lows.
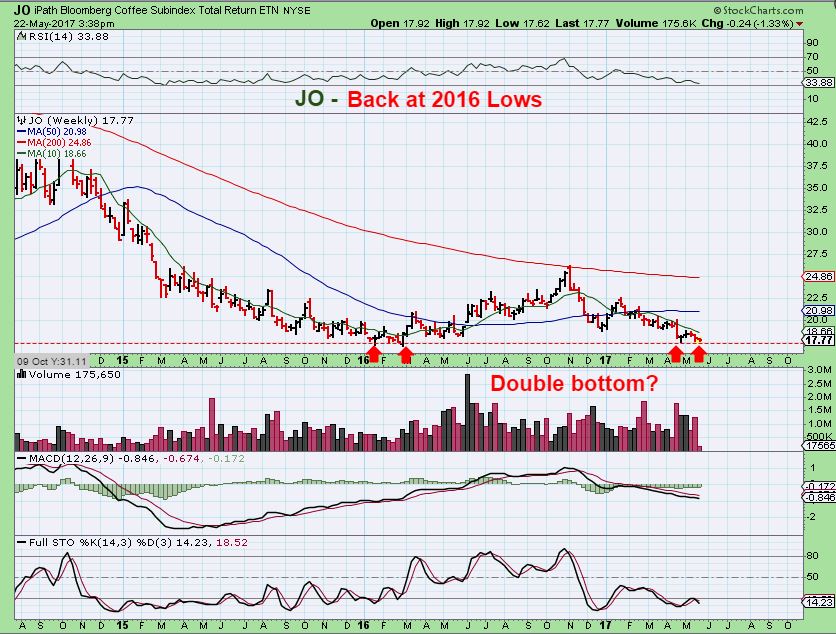
JVA _ This is a coffee stock that I track and we have traded it here well over a year ago. On a weekly chart, it is NOT back at the 2016 lows like JO is, and it is consolidating sideways.
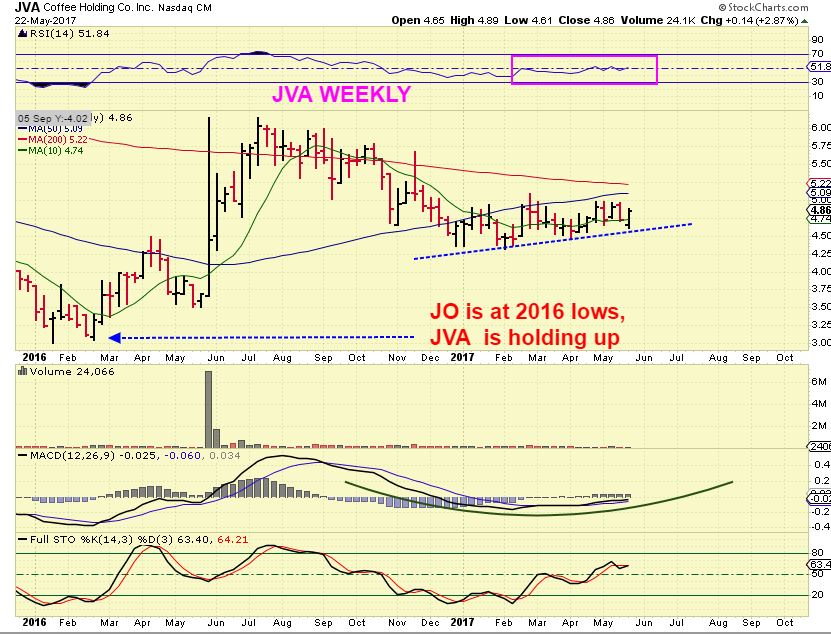
JVA – after releasing earnings Friday, it gapped down sharply Monday morning and then reversed higher. This is now a ‘bullish engulfing’, and that usually indicates that the gap down selling exhausted or rid itself of the sellers, and buyers stepped in. These are often bought immediately with a stop under Monday lows, but you also can just put it on a watch list and see if it JOs double bottom holds and runs higher, pushing this along with it .
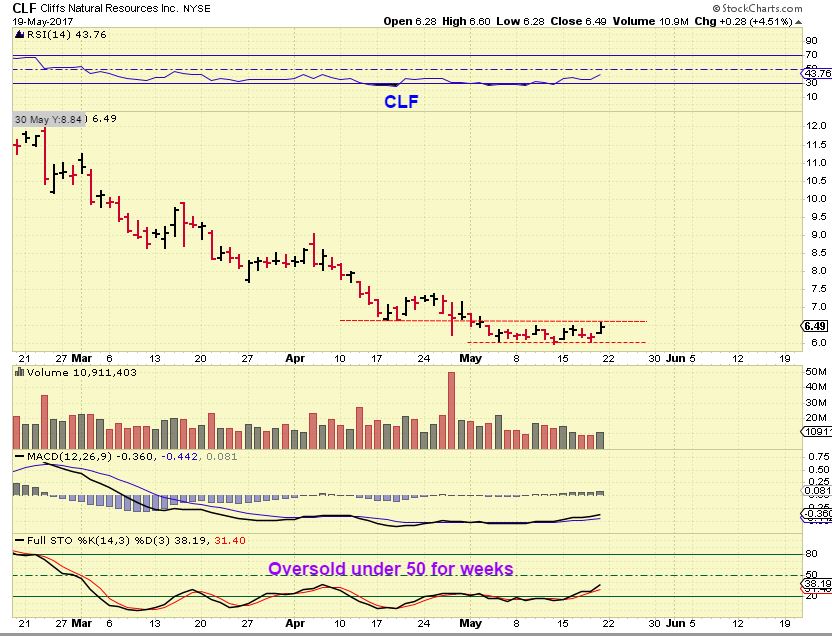
CLF – this was in Thursdays report. It seems to be basing after a break from a descending wedge.
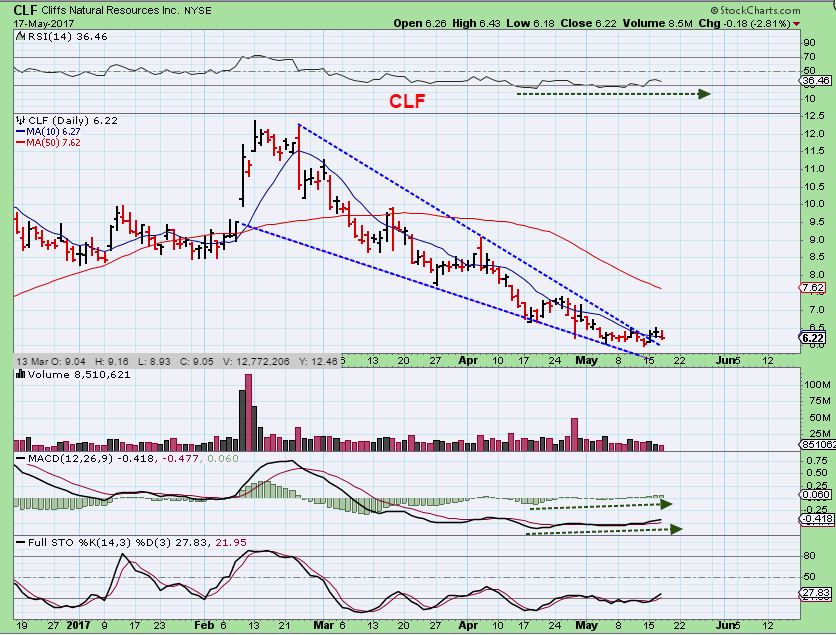
CLF – This is CLF when I gathered charts last weekend. It could be bottoming, watch for a break out higher and a stop in below this base.
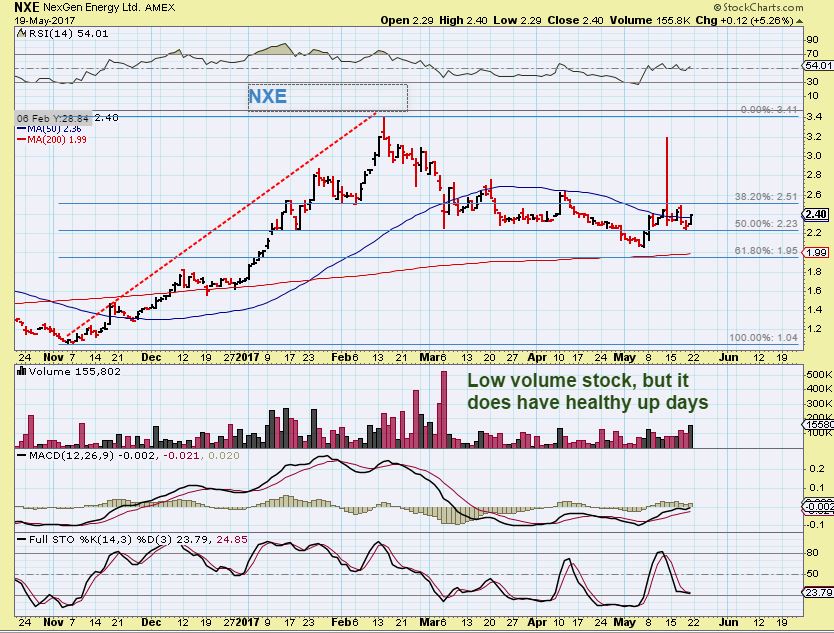
NXE – NEXGEN ENERGY is now trading under the ticker NXE on the AMEX. The volume is light at times, but it has had a great run from $1 to $3.40 November to February and is now consolidating. A drop to that 200sma could happen ( A buy), but that MACD is rising as it possibly forms a right shoulder to an inverse H&S. I like the chart potential when it is ready to make the next leg up.
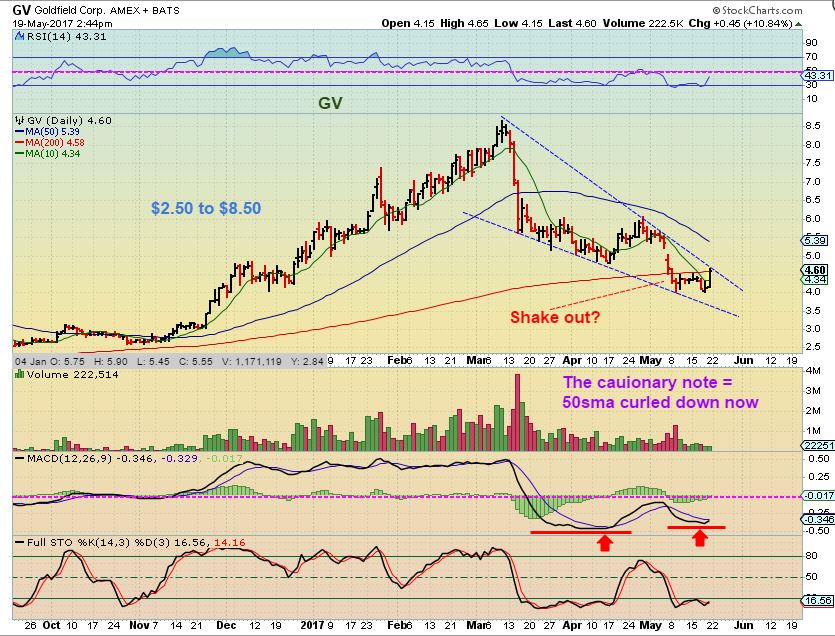
GV DAILY LAST FRIDAY– This actually moved 10 cents higher on Monday, and is now above that 200sma. The 50sma is curled down and may act as resistance, but the run from $2.80 to $8.50 shows its potential if it gets going.
Well, That is a lot to think about right? Please know that this is just a number of possible trade ideas to choose from, for those that want a trade or two. Some may be happy in cash waiting for an ICL, others may be happy with the trades that they currently hold. I am NOT saying that you should buy all of these, I certainly do not. These are ideas of set ups for some of our active traders. At the same time, these set ups may also help us to see whether certain sectors, like energy, are improving or not.
Enjoy your Tuesday trading and I will cover the various markets sectors in the next report.
.
~ALEX
.
Note: Those taking trades may also want to check and be aware of whether the company is releasing earnings any time soon or have they already done so.


I appreciate your thoughts on NAK Alex. I took some profits at the recent high and loaded up after it corrected. The pattern does allow for speculation via a non-core position for a patient investor.
to be a 4th daily cycle it seems quite strong for metals. I guess we will need to see if we can get the Left translated or right translated cycle real soon.
Yeah, coming out of the DCL was a good trade. But we seem to be topping here L translated in my opinion.
https://uploads.disquscdn.com/images/a3e44787dc3c40c63456bfc2abc8f7c2b47383ef8d67f82c5dc5ca32eb4506f1.jpg
Alex, where are we at in the gold cycle count? Is it ready to roll over and head down?
Hiya Nancy, don’t wanna speak for anyone, but it looks Alex might be outta the house. The weekend report outlines gold’s cycle. Alex wrote on the chart, found in the weekend report, that gold should peak by day 11 (roughly). Today is day 10 for the yellow metal
Thanks Rob.
https://uploads.disquscdn.com/images/1b6528b3c07194138516fb35c3e3769e80e65b9c9d88d13c4ef3fcfa2f71746b.jpg
tsk tsk, naughty girl!….I am glad he answered! Prompted me to action.
just teasing……………….. ;o)
https://uploads.disquscdn.com/images/3a84421d59b9af8dac8bb23db9210df9ba69ca3725c54074a007f4f465735cc4.gif t
OK…me too!
Thx Rob, Yes, “Rough;ly” by day 11 because that used to be when we would see it. It used to top out by day 8-11, but now that daily cycles are stretching longer ( They used to be 24-28 days) , it can peak on day 15 and still be L.T. with a 33 day daily.
By the way, what is that Maria doing? Offering you some gum? 🙂
No, she was offering it to Rob who very nicely stepped in to answer since he thought you might not be available…..I am now a tattle-tale….she should be scolded [meow?] right? [uh oh…now I have put a target on myself! LOL]
lol… ULuvIT
#NancyTheRebel
True you are fun. I needed a laugh today with the world situation.
Yes, my wifes family is in St Augustine and she stayed with them a bit longer, so I picked her up today.
Did the artist notice the pattern in the pattern on the opening pic? That is Lilli in my mother in laws quilt
cute..
*WhoIsLilli
see above 🙂
“Lilly was here” nice tune….
i dont believe ive heard of her… nice… she’s beautiful…
Is Lilli the peeking puppy?
Thats her, my in-laws new 3 lb puppy
CUTE!
awwwwwwwww………………. how cute.. what kind?
Chihuahua
😀
My take – I think we’ve topped out. Like CF said, ain’t saying it’s straight down, we could even move down and re-test highs. But I think that if one slowly adds to a short with miner strength, that could be a solid trade with the ICL upcoming. Then that’s all getting to the long side when it’s time!!!
Good plan!
Worked at the top of the last daily cycle . 🙂
Just so people understand, the daily cycle may have ‘peaked’ , but…
“Roll over and head down” is an unknown. It should “Peak” relatively soon to become L.T. – a 30+ day daily cycle would peak by day 15 or less, but look at GDXJ in March and April. It ‘peaked’ on day 7 as left translated , but it was still near that price on day 26. It went sideways for weeks
( I know because I took a starter short at the 50sma and people followed me and then it took forever for it to head down. I got emails almost every day about how strong GDXJ looked while we were short – lol).
I am patient…I watch the bigger picture and you explain that very well. [ Now Maria will offer me that gum!]
got jdst this morning
Whoo!! I added just a nip at EDO yesterday.
I went heavy
Small here, but I’ll be ready for more. Nice timing.
I grabbed some XGTI yesterday, wishing I grabbed more – Really doing well today
Yea I saw that up move this morning nice trade Bay….
Just a thought, an estimated GUESS.
MAYBE / MAYBE NOT – It is tough to tell when they gap up strongly. They can run or work off enthusiasm
refresh
https://uploads.disquscdn.com/images/77debc48275af29ceb8bc306a8f4f7046772240668e43e32805423b077c33f5e.jpg
cool ….
tx Elliott
Elliot Wedge, my pseudo name
Or Elliott Ness ……
*as in Nessy the Loch Ness Monster
😀
Just not Elliot Wedgey.
HA! I’m surprised YOU said that Ed! LOL
Oh No Ed, Now you’re adding fuel to “HER” fire
I think that gal was born with rockets strapped to her legs and needs no fuel from me. LOL
… now THERE’s a guy that gets me … ha ha ha
I knew all along riding that horse was just a ruse.
I kind of like the commodities here for at least a quick trade.
CLF again, on the 10sma with a MACD cross .
VALE looked like a shake out
AKS mentioned last week with a chart is trying to break off of the lows and above the 10sma.
I added to CLF & AKS for a trade earlier this a.m.
The move today in CLF looks more ‘real’ that on that last pops
GO CLF! Alex, really liked your perspective on that basing pattern in today’s report – thanks.
Added a chart above too. Thx.
I am interested and would appreciate you keeping us up to date on your moves here in and out if you take a trade
X also might be a consideration ?
I own it…. 😉
Yes, it is at least a commodity bounce that seems to be lining up.
Zeus too
Is ZEUS a steel play ?
yes, ZEUS is called Olympic Steel,
Also SCHN, X, AKS and a few others
Thanks …. did not have that one in my list.
I have been doing some extensive research on Block Chain and it’s future growth.
If anyone is interested in my “group” of stocks that will benifit from this growth let me know.
Very interested, Ken. On reading up on what it actually is, I did not realize that it is the core concept behind bitcoin.
Rather Large Implications Ed……
What do you take from it Ken?
https://en.wikipedia.org/wiki/Blockchain
By Passing Governments and Financial Institutions.
Both will protect !! How would they do so you ask ?
Speaking of large implications try this one on for size. imagine doing away with invasive biopsies in a mannrer that Bones did in the original Star Trek with his “tricorder”. This may become a reality with the Bruker Corporation (BRKR).
http://www.kurzweilai.net/new-nuclear-magnetic-resonance-technique-offers-molecular-window-for-live-disease-diagnosis
Very Cool !!
Yes, it even has an acceptable chart.
Nice weekly chart : )
I am
Yes!
All the following are Blue Chip Tech. which makes since because of the funding needed:
AAPL ADBE AMZN BRCD CRM
GOOG MA MCHP MSFT NXFT V
There are smaller jrs. in the sector but with much higher risk/reward.
Wonder if there are any Jrs. with patents that would be buyout candidates?
Alex, is this a valid chart? Could you please point out any inaccuracies. TIA.
https://uploads.disquscdn.com/images/c5ec57c785cbf9abab035bfd70791ee33046bcb514c8ec42dc0cc80c0c4beb3a.jpg
Yes, If it plays out. A valid H&S has to break the neck line. AT this point you may or may not have a right shoulder
CF – what are u looking at for exit on CLF
I am not sure if it will make a strong bounce or weak, will it tag the 50sma? Will it do a 38% bounce? etc , so I will just take it step by step.
refresh for 2 charts
https://uploads.disquscdn.com/images/ddf217b4af95be03b82997e5336bea175ac2a0982392453d01a359979dd7aad6.jpg https://uploads.disquscdn.com/images/5dbde4fe29a12b62d535c4abb9cc2c16ba62590d16112ecc462468fc07f8ce61.jpg
excellent .. 😉
Awesome, thanks for sharing
The Gartley pattern is playing out perfectly in Silver. Typically a 50% retrace is in order. That puts it https://uploads.disquscdn.com/images/ac78c071f44eb071e32a657f6bef00938f841e671064c6a2a89d2f4c976a2505.jpg up to the 150EMA then a correction into the ICL.
Same as Rob’s H & S Chart ?
Similar to my Silver from my earlier report – the 50% is near the 50sma
Refresh
https://uploads.disquscdn.com/images/653bb95be67a5c268b93ca38d98b4101ecbcb6cc1ffcbfaf6bf673d2fbf65809.jpg
I believe I posted my chart a week or so ago. With an expected turn point. I didn’t take the long trade due to the 4th DC. Amazing how it works out. Sometimes….
You have plenty of time to short here, though…
As long as we didn’t put in an ICL, then yes. I bought JDST an DUST Yesterday. I’ll start adding more
I want to be BH when I grow Up! Nice trade. I have JDST as well, still small for now.
We’ll see…….
A typical % of correction according to Gartley ? Into your ICL….
50% is what Ive seen posted before. I see a lot at 62% as well, some even higher.
I find that it depends on the strength and timing of the equity.
38.2% happens too, on the weaker bounce
I haven’t researched enough to define a specific retrace. 38.2% is almost a give with any correction. I’ve even seen posts of retrace up to A. I am personally expecting it to be weak due to the with DC. Im sticking with the 50%, Miners should turn first (perhaps today)
Hi Bill. Thanks for this and keep posting these Gartley patterns if you can. Hope this doesn’t get invalidated.
https://uploads.disquscdn.com/images/56ee955df8dadbb0d8fc27b6b75baf7d8d17cbd42bb517bdb20e77769a534edd.jpg
That is where I have Support, at that TL Rob……
So, what do you think 1170 or the 1135 below? This weekly chart sets up a nice higher low if that ends up being the next ICL!!
No Idea. I am just playing around a bit as I wait for the ICL. I just try to get a sense of where price might go, but I will wait for Alex’s call.
Me as well, but having a plan always helps. I like the chart above. That could play out which gives us a great entry and a higher low. Could be sweet!
X, AKS, CLF making some moves here, nice
SOG, was able to add BRZU yesterday in the low $25 area. I hope this bounce is for RE-AL! HA! Thanks for the dialogue yesterday.
nice job!.. lets hope we get some green action
Yeah, chart looks like 35-36 is do-able but nice action today. May not play with it too long if I’m ahead…
https://uploads.disquscdn.com/images/6252f7a4230fcdeb2b1e7ee3bf4aa00cef569f61b99dbe9c157f3223b62efbf4.jpg
DGAZ looks ready to break out ( SO we know what that means for NATGAS).
About steel stocks:
Steel stocks (SLX +1.4%) surge to session highs ahead of tomorrow’s Commerce Department public hearing on its Section 232 investigation into the impact of steel imports on U.S. national security.
AKS, CLF, SHLO, TMST , X, ZEUS etc – NIce
yes…very excellent … Wedge.
Hi Alex!
have any thoughts about GDXJ this afternoon?
It marginally broke below last week’s low and is flirting with that level now
I think I’ll keep a little short
Hi CAL Short term it can bounce, but the peak may be in
AVP. (Avon) up 4.4% on triple dv off the bottom.
Some nice drops in miners today (ALO -12% GSV -10%)
Just keep it going for a while…always feel better about jumping on when they bottom out after a hammering
rut roe
Maria…. what does this means?
Thanks.
sorry .. i was just testing discus to see if it was down or not… I had heard it was Down.
it doesnt mean anything… ScoobyDoo says RUT ROE… when something is wrong….
https://uploads.disquscdn.com/images/503ad424c5923ab61db3873f69a1dc9ca2ce0b9b0e5c9a7d30308c7a7df343c4.gif
Dammit Maria.. i just bought 1000 shares in each of RUT & ROE thanks to what i assumed was a recommendation..
They’d better be green tomorrow… or i’m a coming for you!
you’ll have to catch me first … ;o)
heee hawww!!
https://uploads.disquscdn.com/images/08fa62af8809a4bd6cbe3fc94b5d4109dd855892f5bfa88635b13c9130da414c.jpg
Is that a fanny pack?
LOL … ok .. step OFF the fanny pack!! ;o)
ha ha ha
ps. note the date.. im so fast … this was taken tomorrow … ;o)
Back to the Futures!.. brought us a list of tomorrows stock prices, perhaps?
Funny people!
yo Johnny too!..
hows it going NightRanger?
Great Mr. SOG! My little girl is preparing to graduate 6th grade! I hope you are great too! 🙂
https://uploads.disquscdn.com/images/d9852a3d58849d885d07e2c6b30a505b6f736891f6ac8a8b2295162000268e5b.png
yo Tommy!.. long time , no see ‘Tommy-emojis’
Hey SOG! 🙂 Hoping to be around more coming up soon…lots of catching up to do!
https://uploads.disquscdn.com/images/3be831f61fcf56845218fa4abf2db334d8a64cb72d145faaa137a7c6bd1b8bbe.png
thnik we need to get back to the Golden Age of Emoji.
You, M, Cas & Crystal… get ’em ready
🙂
https://uploads.disquscdn.com/images/58dc1c60595d4665a6aaa99cd04a8e1a2fca2b910e81ae2b97bb98e1d511e0dd.png
You have to wait for the flipped candle chart BEFORE you buy, man!
A few massive block orders going thru on CLF and AKS AH.
Fed minutes tomorrow afternoon!!