
April 25th – Give Me A Break
After the 1st round of the French Elections Sunday, we saw price break through many of the trend lines that we were watching.
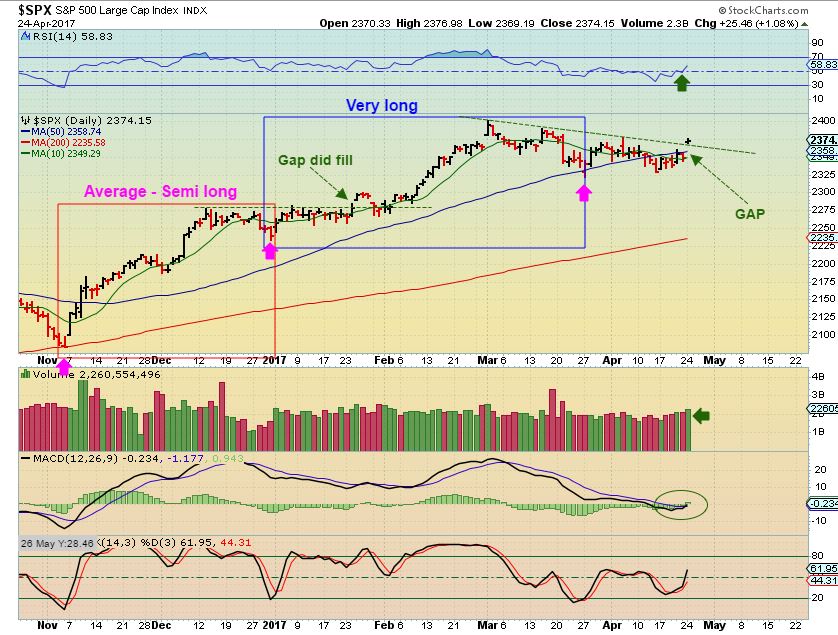
SPX – This chart was from the weekend report showing that trend line resistance for the SPX.
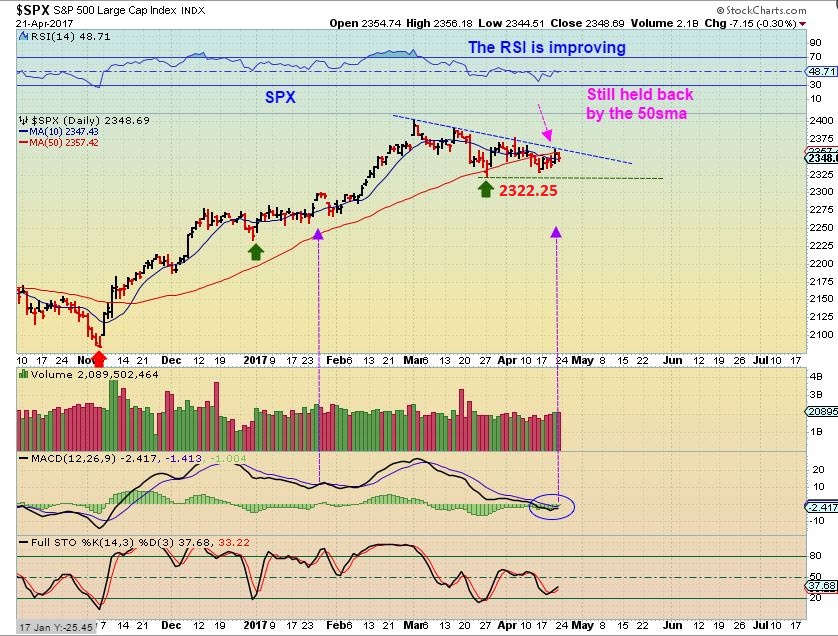
And we had a break out on Monday, even if I use the peak of the spike on April 5ths reversal. We’ve seen daily cycles run various lengths, see the 2 boxes drawn below, and so this does have the ability to run a bit higher.
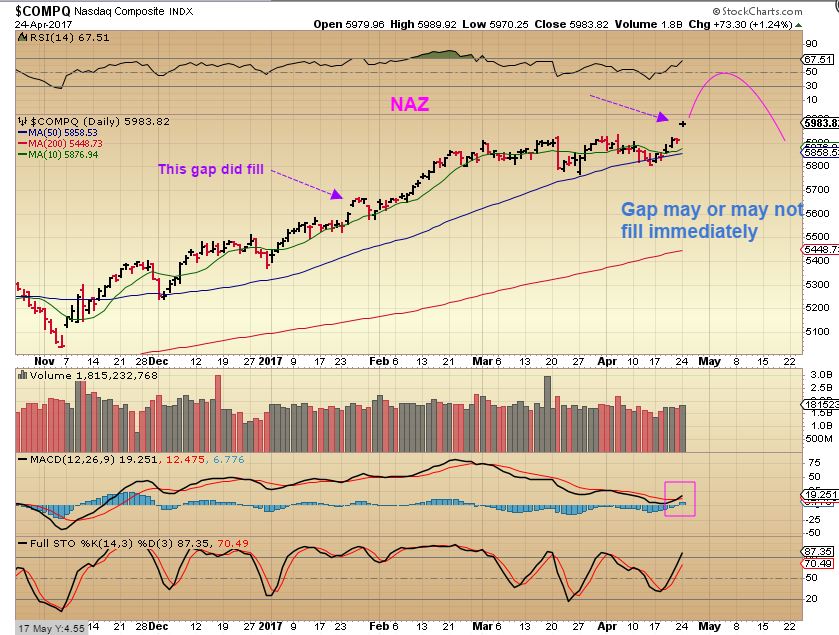
Lat’s look at the NASDAQ…
NASDAQ – From the weekend report, The NASDAQ regained the 50sma and a possible MACD cross ( Inverse H&S).
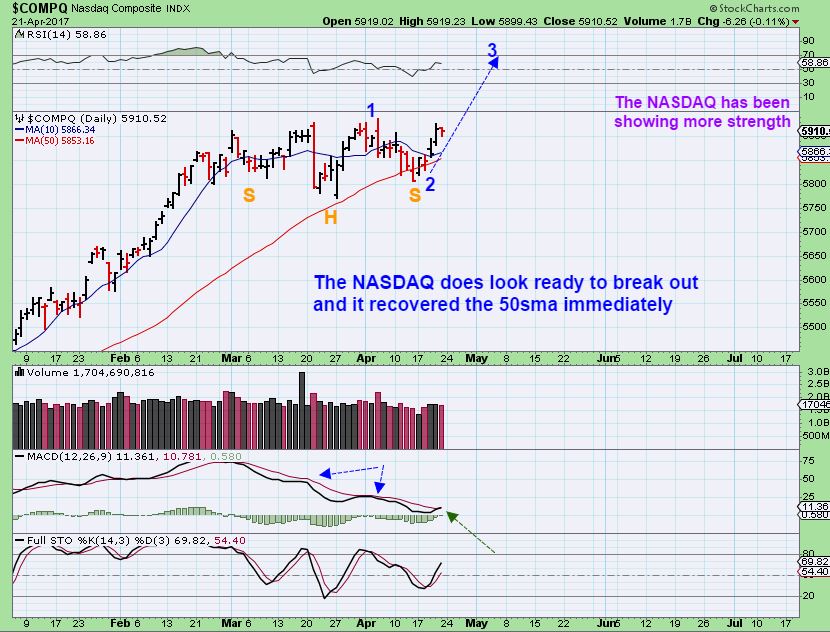
NASDAQ broke out and I’ve mentioned that some of the TECH stocks have looked stronger than other stocks. TTWO, JBL, AMD, etc. looked set to break out last week. Now the question is, “Will that Gap fill, or will this just break & run?” In January a strong gap break out higher did fill in 5 days, and then it took off higher. This gap could fill now or it could fill later on a back test of the break out at a dcl. There is no real way of knowing.
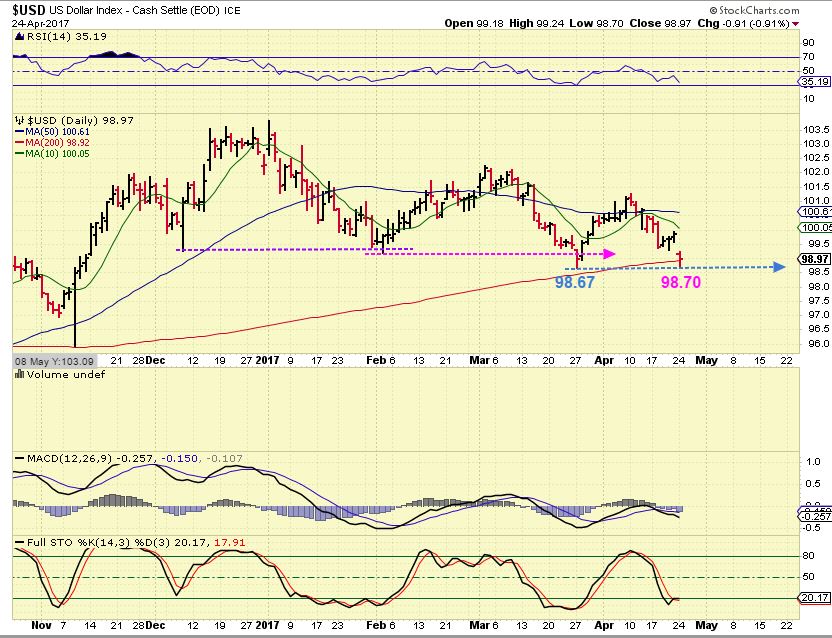
USD – So far the USD has been putting in lower lows and lower highs. On Monday, it held the lows so far. The YEN, USD & GOLD all dropped quite a bit, while the EURO Surged higher. That was the knee jerk reaction, and time will balance this area out.
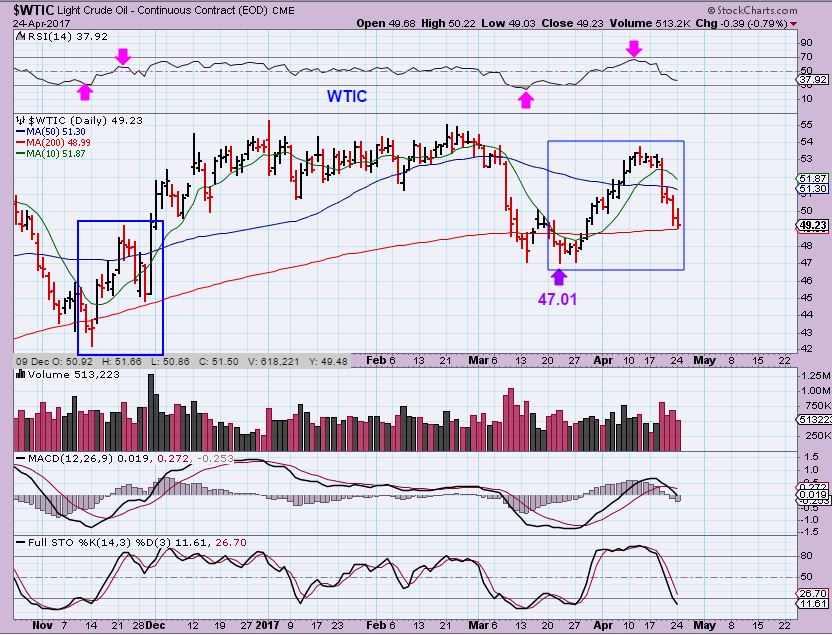
WTIC – Oil held up at the 200sma, simikar to what it did in November. Is it dropping back in a similar 1-2-3-4-5 manner, or is Oil still seeking out the ICL and will break the March lows? Its hard to know, since the XLE broke to new lows. I’m watching this 200sma for now and will look for signs in Energy stocks as time moves on.
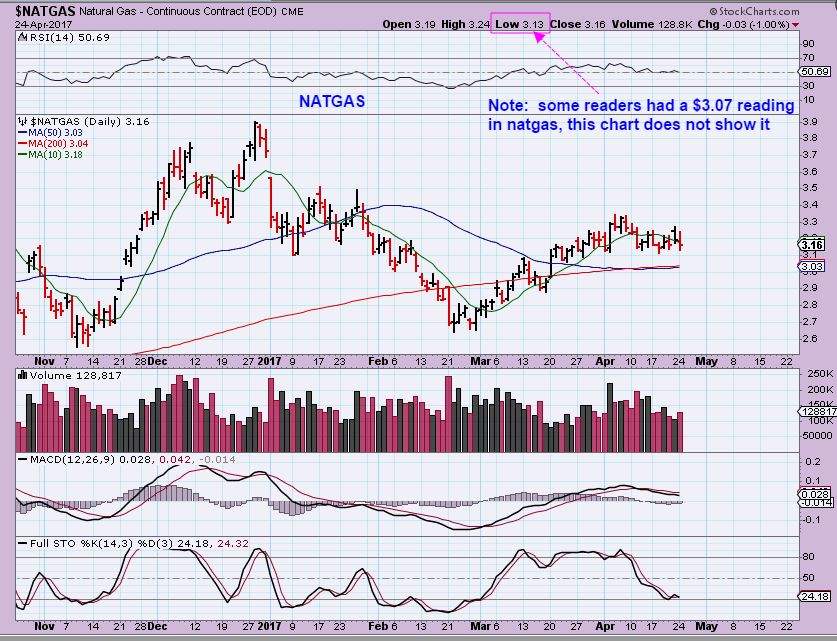
NATGAS – No real change. Some readers mentioned that they saw NATGAS at $3.07, but FINVIZ & STOCKCHARTS do not show that as a low. Even if it did, it remains above the 200sma & 50sma at $3.04. I’m still debating re-entering my NATGAS long trade as it gets oversold here. NATGAS does look good so far.
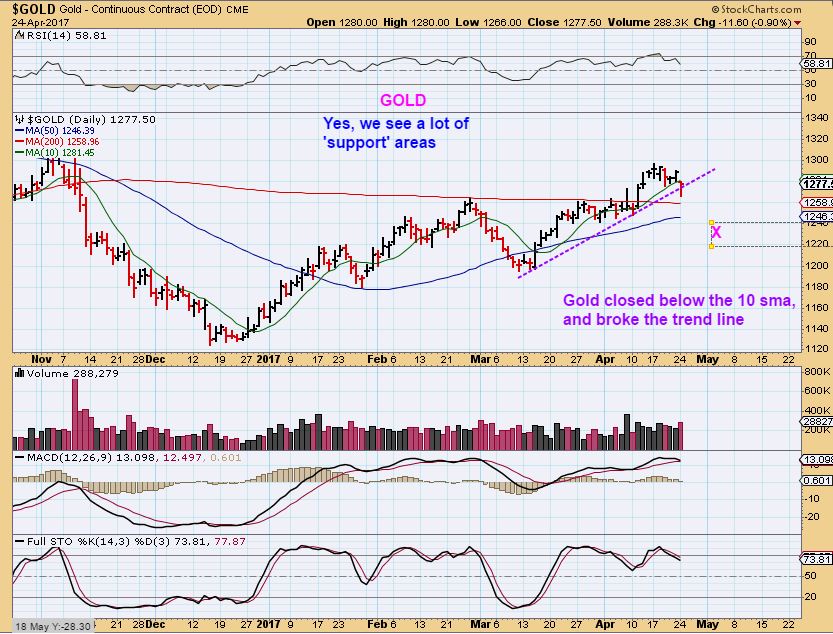
GOLD, SILVER, & MINERS
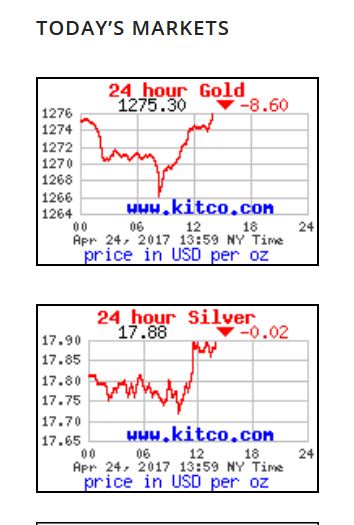
Gold & Silver dropped and actually made a good attempt at recovering after the slam down overnight.
Gold broke the uptrend line & 10sma and that is important to identifying a drop into a dcl. I personally do not think that this was all we will see for a dip however. Miners did NOT act like this recovery into the end of the day is real. Gold has time to drop further and is not even close to oversold. 1 scenario could be a drop into Fed Mtg next week and then we see the dcl. I will discuss this further with Miners.
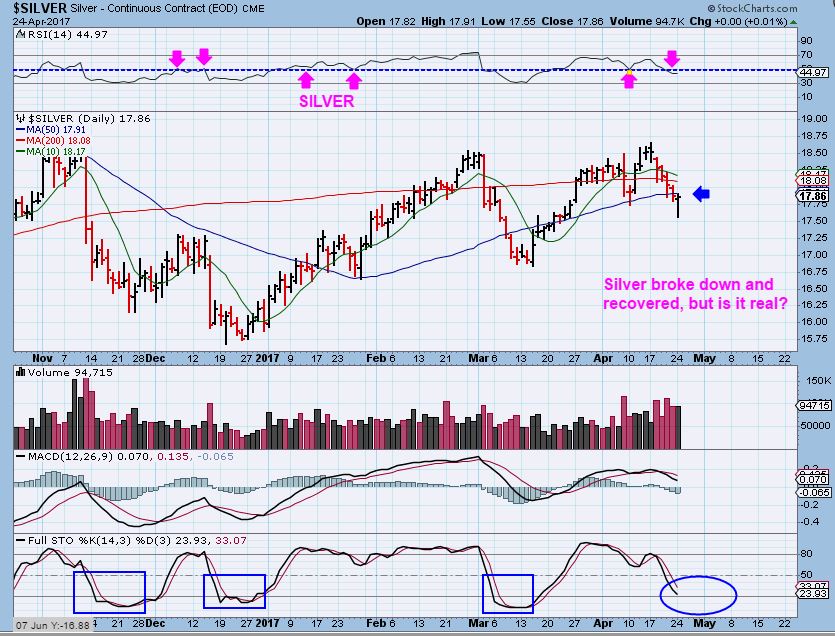
SILVER – Silver dropped and also put in a nice reversal candle. It is still below the 50sma at this point and notice how the stochastics is not nearly as oversold as it has been at prior lows. I would expect a bit more weakness.
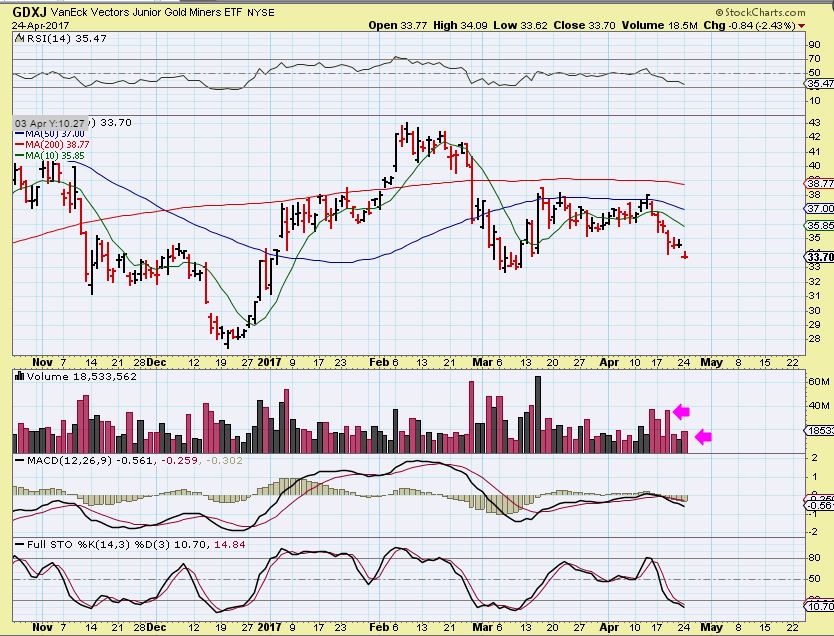
GDXJ – GDXJ actually gapped down on light volume. I sold 1/2 of my JDST position, simply because that is my trading style. This could drop further, but it actually looks like selling dried up a bit short term. Maybe it bounces for just a day or two and then resumes selling into the May 3 Fed Mtg?
GDX – GDX broke the uptrend line and the 10sma, signaling that it is dropping into a dcl. It also closed below the 50sma. This chart does not look like the selling is done either. Again, we could see an up day on Tuesday and draw in the bulls / Buyers, and still have more selling ahead.
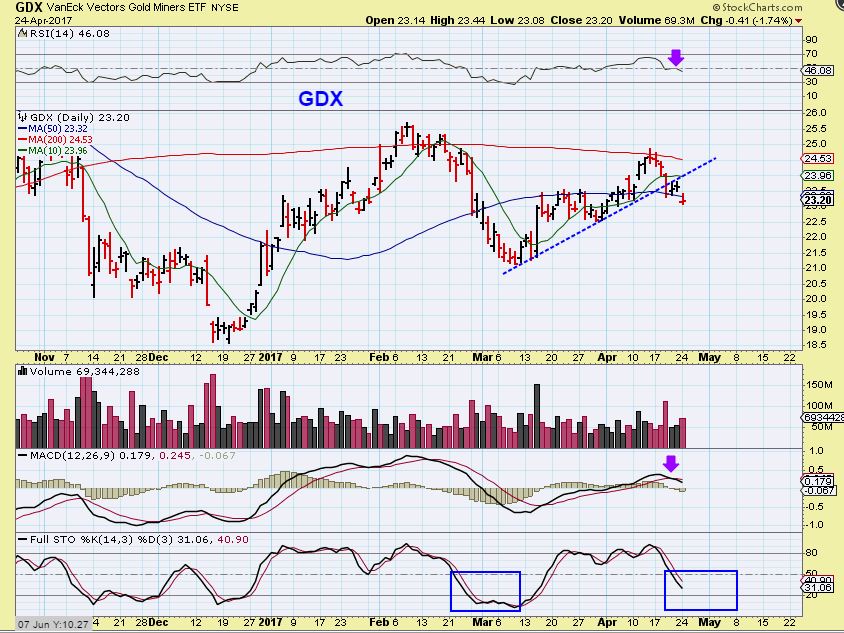
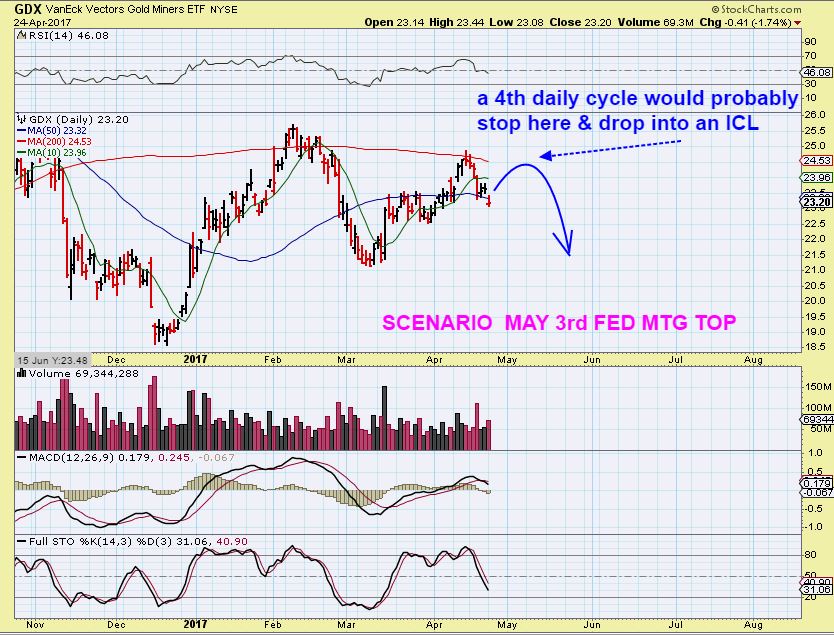
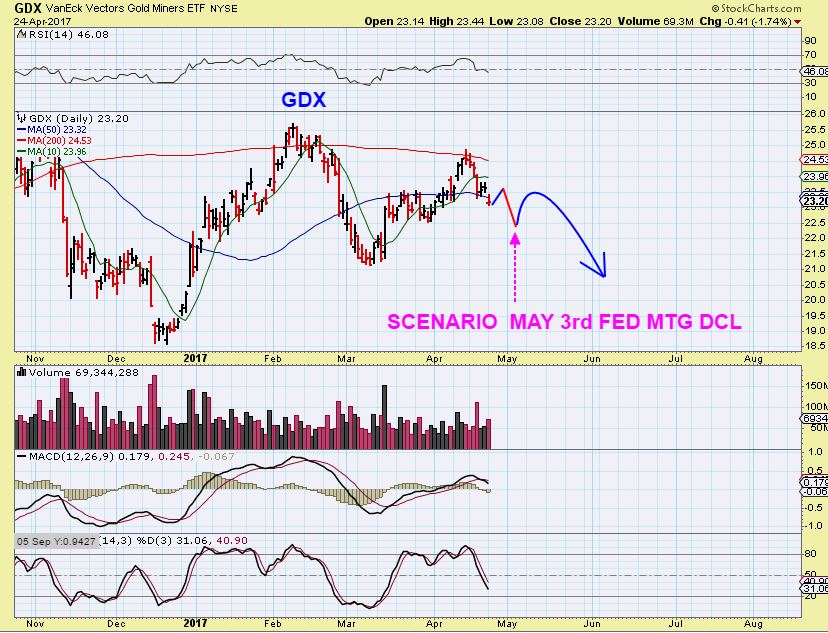
HOW WILL THINGS PLAY OUT FROM HERE? There is no magic formula to know the exact track that things will take, but I can throw out a few ideas just to give visual ideas.
GDX – I expect more downside sooner than later, so this is a less likely scenario. It shows a bounce now as a 4th daily cycle that tops out at the FED MTG next Wednesday, and then it drops into an ICL. That’s just 1 possibility.
GDX – A small bounce and then a dip into the dcl on May 3 Fed Wednesday next week. A bounce out of the Fed Mtg then rolls over after a few days into the ICL. Either way, the best buying opportunity is a few weeks away , but it could be the best buy of the year, stay tuned!
The General Markets broke higher and do have time to run further. It just feels like the FED MTG next Wednesday May 3rd is going to play into the timing on all of these markets. Oil is dropping after back testing a break down, I am watching Energy stocks for clues of where the lows might come in. NATGAS is holding up well. We are finally getting the drop in Gold that we expected and SILVER & THE MINERS have been weak for a while now. Even though N.Korea is threatening to blow up a US Ship in the seas and other things are happening that would seem like RISK would have people buying Precious Metals, Miners have been weak and Gold & Silver are now dropping too. We are pretty much due for an ICL in the next few weeks, and that drop will be deeper than many expect. A ‘bounce’ into a 4th daily cycle is expected first, and then that drop will come. Enjoy your Tuesday trading.
.
~ ALEX
.
TRADING –
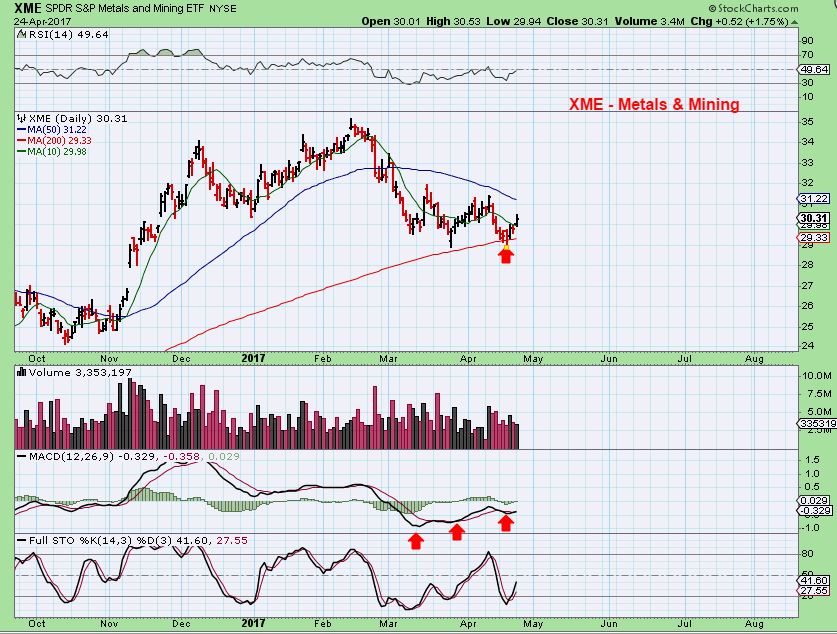
XME – I wanted to take a look at the XME, because it represents Metals & Mining. I know that the Miners aren’t very strong, but the XME does look to be holding up well on the 200sma. SO I looked again at VALE, CLF, AKS, CENX, FCX, AA, etc. Some daily charts do look good, others need a little work. It is earnings season and they look set up to ‘pass’ or ‘fail’ . Let’s take another look at a couple of them.
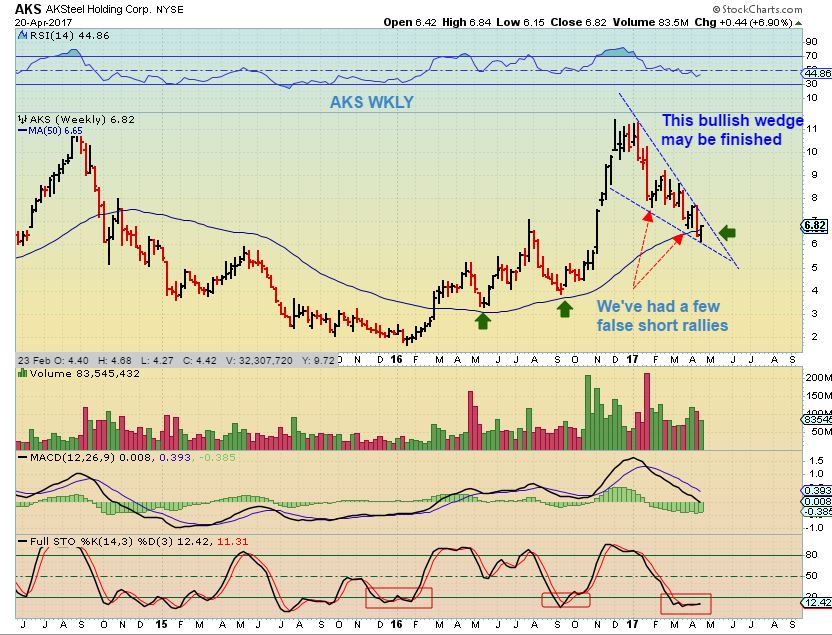
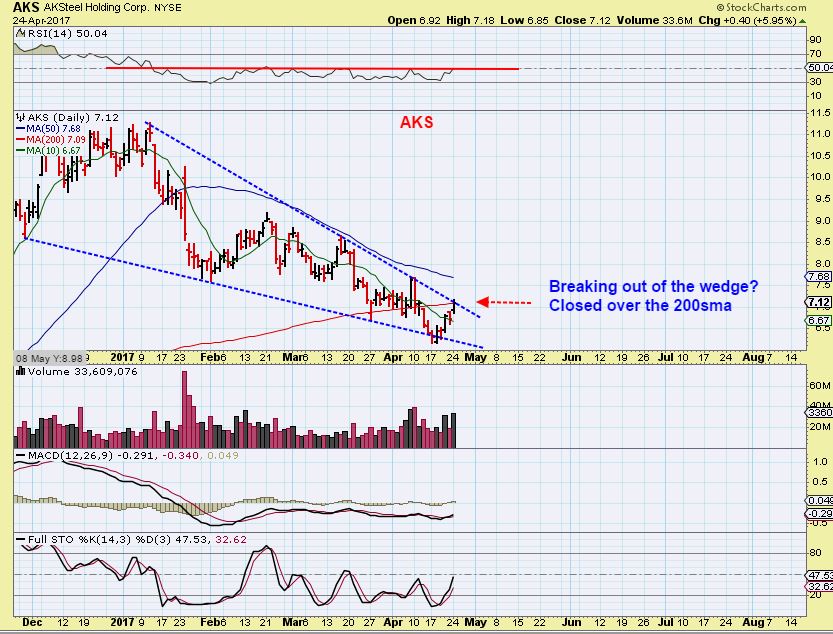
AKS – April 20th I had this chart in my report. I like a wedge pattern when it breaks to the upside. Is this ready?
I wrote a report on Steel stocks, and liked the way they were setting up.
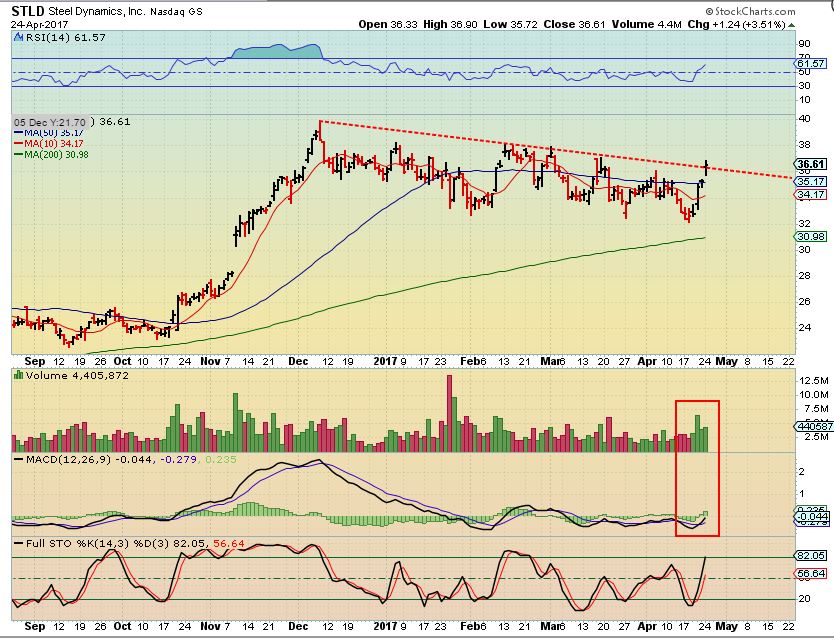
STLD – Earnings were released last week. Is this Breaking out from a huge consolidation? It looks to be, and STLD ran like a gazelle out of the last consolidation. I would expect this to eventually continue higher if earnings remain solid. A stop could be placed under the recent break out.
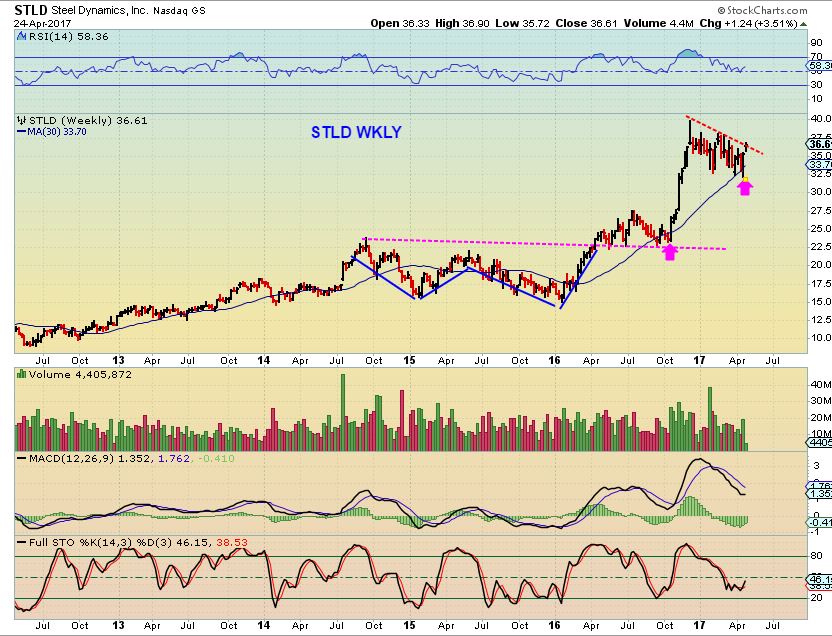
STLD WKLY – a “W” Pattern formed in the 2014-2016 consolidation. This looks ready for one more leg higher. If it is anything like that last run, it would be almost straight up.
AKS – AKS has volume increasing as it pushes against the 200sma and trend line. This one continues to look good. I’m not sure when they release their earnings though, pre-market or after market, but I think it is today.
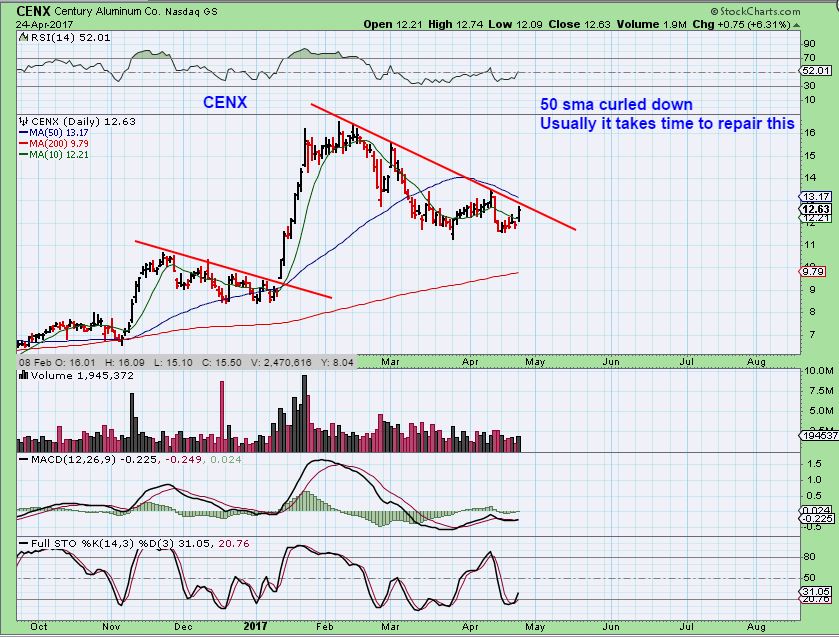
CENX – The MACD does look to have divergence and the RSI is close to crossing the 50%.
AA – Nice burst of volume as it attempts to break out. They released earnings Monday and last I saw AA was up $1 in after hrs at $34.35, right under the 50sma and above that trend line. AA looks good.

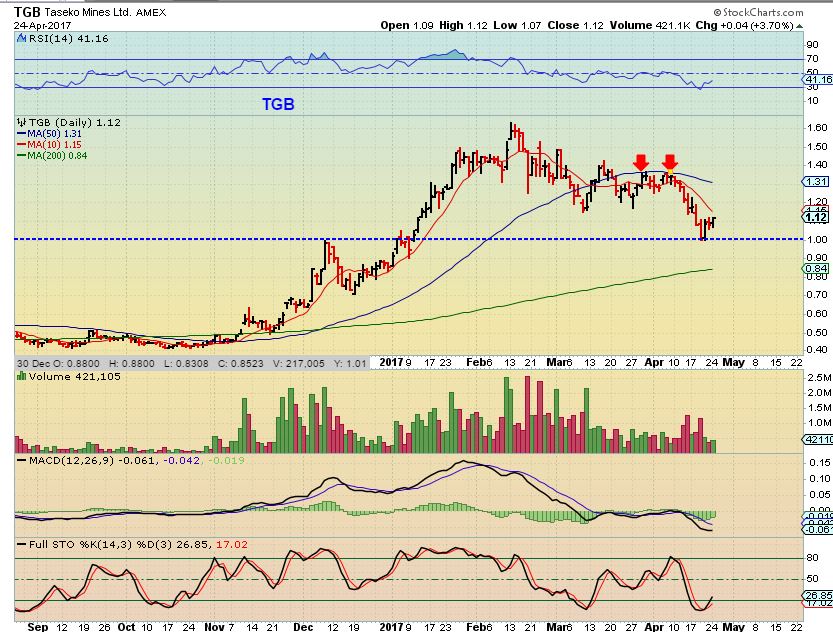
TGB DAILY – As mentioned above, I do not love all of the daily charts on the metals stocks yet. They look “o.k.”, but not really bullish. Here TGB could be at support, but the 50sma has been strong resistance and the MACD is sloppy. The 200sma is below and price may still want to go there. The weekly charts do seem to be setting up nicely, however, so I am watching all of the metals stocks. Let’s look at TGBs weekly chart…
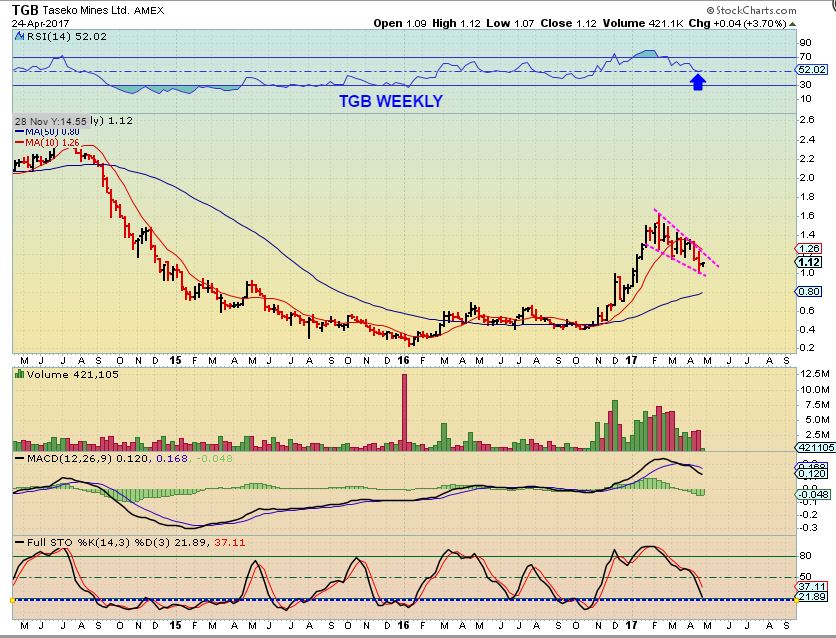
TGB WEEKLY – The weekly chart looks great. TGB breaking to the upside would be a buy, but so far the consolidation continues and again, that 200sma is still below price and may be a target.


I scrolled through the comments early this morning and I missed a few that were directed to me.
Just a note: I am in & out with the markets and the ‘comments’ s ection of the reports this week. This is the week that I spend a lot of time at my parents house, helping with spring clean up & Yard work. Yesterday I spent more time outside than with the markets, it was in the 70’s and I have no regrets 🙂 .
So some of the steel & Metals stocks may be shaping up, for those that prefer to go ‘long’ while waiting for Miners to drop & form a trade-able low. Just want to be aware of earnings releases and their timing.
AKS, X, FCX all report today.
Nat gas – everyone was right! May futures closed at $3.06. June futures are about 10 cents higher at $3.16. May futures expire tomorrow so UNG and friends will he facing contract roll, please understand how that affects your positions.
AKS up 6% pre-market – looks to be breaking from the wedge, still needs to recover the 50sma, but looks good
Gold & Silvers reversal candles yesterday did their job. They got the “Buy the dip” Crowd to think that buying into the close yesterday would pay off. Buyers would think that they were buying a reversal and their positions would be rocketing higher today.
Today they will have to endure a gap down in Miners and wonder, “Should I sell now on this gap down to protect funds, or am I selling the lows and will regret it?”
i feel for those poor souls that dont subscribe to chotfreak…..;)
Poor unfortunate souls.
Alex, the low on JNUG in December was $3.77 I think – do you think it will go below that at the upcoming ICL?
Yes it should, but also I believe they are doing a reverse split to boost price, so those numbers wont be the same, but Dec lows will be taken out in my opinion.
What is your strategy for exiting the remaining JDST?
I dont have a pre-set selling plan for the rest, I kind of have to watch it if I can. Buying low around $13 allows us to watch it and sell when we want to lock in gains. A big position can be sold in smaller increments ( That is what I do) . Selling THE TOP is not likely. It becomes more of a feel at this point, and I try not to get too greedy. JDST can open down $3 one morning if the DCL comes in, but the run has been excellent so far. Well worth that dreadfully long wait with GDXJ at the 50sma forever.
You can see now that GDX & GDXJ are dropping into that DCL. Miners often slam down for 2 or 3 days sharply into the dcl ( Worse for the ICL). I just watch it and lighten up as I see fit.
Kind of hard to explain – its not a method or target at this point. Currently we are at $13 to $20. Selling will be tough, because we hate to part with the run, but last time it dropped from $23 to $19 in a day. I will likely sell a little here an there.
LOOK AT A CHART OF JDST- IT DROPPED $23 to $13 in 4 days in early March. I’m not giving this back : )
looks like its gunning for that 23 again…. no?
Possibly – I was thinking that it would get there and break above it by the ICL. I dont know where the dcl will come in.
I want to sell all of mine near the dcl, and re-short the 4th daily cycle bounce for another stronger run.
This was my first attempt to “hedge”….Bought some DUST and JDST,,,but after you said you had lightened up yesterday…I got ready this morning in case gold was going down more. I sold out and learned some lessons. These 3X move insanely fast! Next time I will put it all in JDST…I did very well with that, but DUST only made me $1!
Now I will be looking for the 4th cycle to “hedge” again brfore the big dump to the ICL. Thanks Alex!
NICE TRADE NANCY – As a hedge , it takes the pain of the miners selling down away or eases it a bit anyway.
They do move insanely fast, and when they go against you, you just have to let them go.When they go in your favor… $ 12.5 to $20 in 8 days. That is 60+%
Sidenote: JDST & JNUG are known to have 20% days near the tops and bottoms.
woohooo …………………………………… Gidddd EEE UP
Hi Tammie…welcome back…more hugs to you.
Thanks, Nancy! 🙂 🙂
https://uploads.disquscdn.com/images/788d5b0c9709bb3b32cf021c76c291c87ac30967545d0dc8a082e849331d53c9.gif
oops that was for tammy… lol
well .. all of us i guess too … 😉
LOL, thanks! 🙂
LOL…I can always use a hug! We’ll just send some extras to Tammie.
FCX looks good. Strong volume after earnings ( revenue missed, but price looks good). It does have overhead resistance at the 200 & 50sma, but with this volume it could break right through in time .
sweetness…
I have GDX in a price channel and it is sitting on some resistance in the $22.65 area. If that area doesn’t hold I don’t see any reason for it to not get to the $21 area later this week or by the FOMC
Hi Bran, I see GDX traded below $22.65 already. It is tough when the drop into a dcl or especially an ICL comes along. The supports and important technical areas get broken, and that finally changes sentiment to allow a rel low to be put in place.
I also have GOLD in a falling wedge to the 1245 area by weeks end or FOMC
Looking to Enter: CF opinion?
BHP
HBM
IEO
BHP – I just dont know about these Oil stocks yet. At times they bounce before a bottom and then do a final drop. BHP can drop to the 200sma.
HBM – I was watching that too. Sits on the 200sma and I like the weekly chart. It’s close to a buy for me ( Obviously low risk / reward using the 200sma as support ).
IEO – Possible bear flag, under the 200 & 50sma with 50sma crossing below the 200sma. Light volume, looks rather weak, I need more signs of strength
Thanks.
fyi…..BHP has some oil but also iron ore, coal, alum. zinc, copper, etc., more of an overall commodity play ?
Yes, and right now Energy, MIners , Coal ,and Uranium can be the drag on this one. It also Mines Silver & gold and Uranium
Or……most are in a bottoming formation ? 🙂
They should be. Sometimes that bottoming process can be a pain in the neck, like the GDX / GDXJ topping trades were over the last few weeks, but at least the risk reward is usually defined
Concur…..
im watchn HBM as well… all the copper plays…
nice
SCCO too….. 😉
WRN – I’m watching the 200sma – actually looks like a big H&S on a 1 yr chart, so that may scare the early buyers away until it negates .
Do you consider this more a copper play than a gold/metals play? Have you notice it follows copper more than gold?
I have some as a core position but want to add. If it drops more with gold , it seems wiser to wait for the coming ICL, correct? Were you looking at it for a fast trade?
waiting …. no purchases….
i am playing dust/jdst … 😉
heres the description i have.. fyi
The Company is engaged in the production of copper concentrate, consisting of copper, gold and silver, as well as zinc metal. The Company is focused on the discovery, production and marketing of base and precious metals.
Thanks
Hi Ken, by the way there’s much more volume in XOP than in IEO
Yes….thanks ray.
Both tracking the same…..
AKS shot up and hit the 50sma area and sold off… now it is even back below the 200sma.
I’m watching it to see if they’ll buy it back today. Short term chart timing is what I am watching. 15 minute, 30 minute, 60 minute..looking for signs of stabilization. If it gets back over the 200 sma I may take an entry. MAYBE.
AKS – possible support above that Gap? trend line support? 15 minute chart, not quite oversold yet, so 30 minute isnt even close to oversold.
https://uploads.disquscdn.com/images/4f688b273808bbb75113ef8c3e7e602a1917f5ed65b989b352fa0524fde5089f.jpg
I was JUST about to ask what gives on the price action in AKS today! didn’t they beat expectations? Great call on JDST btw Alex…I just cashed in half my position myself…
NIce – take it from them before they take it back : )
THAT was a tough trade if you entered with me way back on every bounce at the 50sma GDXJ. Patience really paid off, but the daily grind was ‘ difficult & trying’. Congrats
Admittedly I got in around 14.5 and got kicked off the trade once before reentering at 15. It did get get a bit boring watching it waver back and forth around there…
Looking at the gold chart, it looks like it has some room to drop still. Assuming miners are leading the decline and bottom ahead of gold, wouldn’t it make sense to short the actual metal now instead?
I thought of doing that with Silver last week ( because the silver drops can be huge) and it is possible – but I’m not playing it that way.
yes, I actually bought JDST on the first tag of the GDXJ 50sma, so I had to trade that around a bit too and start again on the next tag. I was riding JDST from $12.75 to $15+ a couple of times and that is a tad frustrating when you think that the move has finally started & GOLD kept breaking out higher.
THAT was the problem, GOLD was so bullish , and we were in JDST, that is always a confidence shaker for me, but cycle ‘timing’ usually corrects it. 🙂
Thats why I say Nice trade Danyo – eventually worth the frustration, but by no means an easy one .
I can’t find any news that they beat. Do you have a source (I’m invested). Thanks!
http://www.cnbc.com/2017/04/25/the-associated-press-ak-steel-tops-street-1q-forecasts.html
I’m about to dump it…I’ll probably be wrong, but I don’t want to give back my gains!
I just sold as well. Don’t like the direction.
looks like we had the right idea letting that one go…
I’m still watching it on a 15 & 30 minute chart. CRAZY action. .
AKS got down to the gap, put in a believable little bounce, and then CRASHED / SMASHED right down into that gap. Heavy volume. Now it is bouncing again, and I want to see if that was it?
Or is this going to keep selling off.
The daily chart is below the 200 sma, so it needs to get back over that.
Odd reaction to the earnings.
Seems like you were right!
Alex, What about CLF? I sold it and want back in.
This answer is situational. Why did you sell
If you sold because it dropped below the 200sma, it is still below the 200sma.
Took a bounce trade Jnug at 4.55. Don’t want to swim to hard against the current. Admittedly don’t like seeing Abx down 9%
Refresh – Now we watch for a reversal and a swing low ( That can come soon, or that may take time)
.
https://uploads.disquscdn.com/images/b3d4fb95edb1448a55763f80ff7e17a40b3883e3df551739689ab1acac5424ff.jpg
JDST & JNUG look like they may be having one of their famous 20% days ( often near tops & bottoms).
u mean 30%? :0)
You never know if the panic escalates and all those that were buying lately start to hit the exits.
Let’s get this drop over with already. 18% is good by me 😉
It is nice to be on the right side of this “blood-letting” for once! 🙂
Yes, agree!
I hate shorting, especially the Miners, but there are some good gains to be made when they drop into a dcl or ICL.
Sounds good to me. I’d like to get some JNUG in the 3’s, downside would be limited and risk-reward would be skewed in favor of reward over the longer term.
You do know about the coming splits, right?
Not that it matters to the bottom line, but sometimes a split bugs people if they get in before it happens.
u see AUMN…. hmm
I do now, I was watching TRX, because it showed strength before the drop .
yup
nak looks like its rounding the bend …… too
Not much volume for a 9% drop.
EGI also bucking trend.
I think GDX is looking for a DCL…..it is due.
Wave ii of 3.
im trying to help with dust/jdst ;o)
Massive down volume in AUY,IAG, MUX, KGC GFI and AG
Yes, and a few others too. It can be a sign of capitulation.
alex when you say capitulation you are still looking for ICL right?
Yes
When I say Capitulation, it is just sellers all bailing out at once, and then THAT period of selling possibly dries up.
An ICL is ahead, it should come after the next daily cycle peaks.
so … like if we say this a “C” wave down ….. then this capitulation could be a “3” wave down — then a “4” bounce …….. and final 5 wave would be the ICL …. ?
Yes – It could be that, and the 5th wave down would not be truncated, it would be deep if it was like most ICLS.
that NQ keeps on keepn on ….
Sold DUST for 16% gain on a position that is way too large for a 3x etf (almost 100% of that Roth account). I think PMs have more downside I’m happy exiting early while playing with explosives.
CGIX still lookin good. Anyone have a target on it?
MACK:
Moving stop up at the PSAR which is just below the lower TL.
May SID close above the 10 dma !
Bonds (TLT) retest of break out …. Still correlating better than the USD for PM”s. imho 🙂
as a sidenote: In March – TLT was at Dec lows, Gold & Miners weren’t close.
Uh ? Both hit their lows March 13.
So you are just talking about timing then? I though you mean correlated in price action.
What I was saying was TLT was back at the Dec lows 1 month ago.
Gold only dropped 50% in March and never got close to tagging the Dec lows.
Correlation of Time…… 🙂
I know you disagree and that is ok 🙂 but just look at the last 10 trading days there is no price correlation between Metals and a lower USD, they both are moving down together.
No, I don’t disagree, I have never studied the 2 together. I can see that correlation of the ‘time’ march lows was the same, if that is what you meant.
I just noted that TLT was weaker Dec to March, and went back to the Dec lows a month ago. GOLD was really strong from Dec to now.
I am not the one who said to you that the USD correlates better,, by the way. 🙂
I pointed out the YEN and GOLD have moved together over time, and I did a big report on it in the past.
When one turned at lows in the past, the other often followed.
I have also pointed out in my reports that the USD and GOLD have both gone higher together and dropped together for weeks in the past. I have said & showed this with charts in my reports.
You might be mistaking me for someone else with the USD correlation thoughts. They are inverse most of the time, but there are times historically where I have seen them run together.
Both Bonds and Metals are “FLIGHT TO SAFETY” imo.
Yes you did a report on the Yen / Metals correlation ( I agree btw), I do remember that but in that report you also discredited the Bond correlation.
Metals are considered a currency in todays world…. imo….And currencies are the Most manipulated sector.
Well Ken, Good enough on this conversation. We can agree to disagree, I’m fine with that, but
I’m not sure why you’d say that I discrdited a Bond Gold correlation in my Yen report. My Yen report was over a year ago, in Feb of 2016. I have never in a report ever discredited Bond correlation specifically.
The thought has never come to mind for me to compare the two. I’ve never looked into it historically.
MAYBE something that I said could be taken that way, but I have never compared the two for the purpose of discrediting or favoring a correlation.
MAYBE I said that I thought GOLD was going higher in a report and at that time Maybe I said that TLT didn’t look good to me? I remember Ray emailing me and asking about the TLT set up, he was in a 3xETF for it. I could have put TLT in a report by request and I may have said , ” I like GOLD better for a long here” or something like that?
I dont usually cover Bonds in the report unless someone asks me to, I dont get much bang for the Buck in TLT. So I dont remember covering TLT and saying that it is not correlated to Gold, but maybe I liked one chart over the other, I dont remember. . I may have said that the set up did not look as good as Gold to me when Ray emailed me? I dont recall.
Kind of sorry I pointed out the march drop now.
Fair enough…….we did have this same discussion a while back so sorry i brought it back up.
https://uploads.disquscdn.com/images/33f4a73ece999cf839f5762a445815e381be0b9b7b15e1053439b6d868d36c27.jpg
Speaking of ‘butts” based on my colonoscopy last Fri. I would like to announce my colon is in fine shape !! This message will be deleted VERY SOON !! 🙂
It doesn’t disappear until people refresh though : )
You know that means Maria will copy and paste this everywhere for the next few weeks. lol
Too much Risk… lol
https://uploads.disquscdn.com/images/3f3c37feea9cd2eb1a18d37daf465a702d4ffac2077f80cb8df20e420ccbf917.png
I guess that You wont know if she saw it unless it pops up in the next few weeks sometime during a sell off, when we’re all talking about stocks ‘dumping’ or ‘being in the crapper’ or something.
Then Ur comment reappears
lol ….
*alls well that Ends well …
I stand corrected
I know !!! 😉 hence the quick deletion. lol
yeahhhh … WELLL … about that ….
since u replied to my comment … I received an email w/ said text…
heee heee heee heee (evil laugh)
oooooh, a co-conspirator! Had to be one of the ladies here.
no no no … ken replied to my comment … so I recvd the email
*WhosOnFirst
damn !!
https://uploads.disquscdn.com/images/029bcf0befd4785759742325926db79a32f0af68dcadeec31f34b82bc7f88259.gif
Get back to Work Maria or I will be calling the college ! 😉
😉
LOL….
BUTT … BUTT …. daddy….. ;o)
Thats what I needed, a good laugh : ) lol
Thx Maria
Yep. I remember the last discussion, as well.
SMH break out….. 🙂
Good call, Ken.
Thanks Ed….where have ya been ?
FCX looks good breaking through the 50sma,
AA struggling with its moving averages, good volume, but it does look good. May just be a matter of time.
CENX stalled at the 50sma today ( so far)
All roads lead to 1257? https://uploads.disquscdn.com/images/e68e672e4b596f4fc944f704391228ea10a227b80f6658290dd8a80875edab8d.jpg
Guess where a back test of the 200sma would be ( Close)
I kind of want to add to my MACK position with it back over the 50sma, but this has been one long boring ride too.
I expected the pop higher out of this base weeks ago to have some follow through, when it recovered the 50sma for the first time.
Sitting tight for now, but I like the base formation.
Bo-Ringgggg!!
AKS – down 8% after originally popping higher on Earnings. Really selling down today.
In fact, the daily chart looks like a huge bearish engulfing
X also…..to a lesser degree.
SID reports on May 12……..
Merrill lists May 7
NASDAQ states May 12 ?? hmmm
I didnt even see “X”…last time I had looked this a.m. it was looking good. HMMM.
So, we are expecting another gold move up in a 4th cycle before dropping to the ICL. Is this the time to try riding JNUG for the 4th up, or is it too short time-wise before the turn down?
I personally never leverage a 4th daily cycle. They can just go sideways and the up & down will drive you crazy.
Thanks! Those fast movers are scary but fun! LOL. I will restrain myself!
I agree. If you want to play the 4th DC, wait for a left translated top (between 1-8 days??) then short, but keep it on a short leash, you never know. 🙂
Yes – and it can be day 9, 10, or 11 or so too, so start small and add : )
I/we thought gold could top btw 8-12 in this recent cycle and it stretched into the late 20s, like 29 or something. So, we’ll need to monitor closely (so I don’t short too early again! :P)
Thanks for the answers Rob and CF.
#TagTeam
….. meow !!
Thanks ALEX….. would you let us know when “you think” to buy again JDST or DUST. Last night after closing I sold some and this morning I sold the rest all. Profit? $. 750.00
But….. when we see an other chance I like to do this again ALEX !!!!
THANKS a lot, and stay calm my dear.
I think that I will be doing the same Geurt, I will put it in reports.
Here is the question then Rob and CF:
Do you see a Higher ICL than the Dec. 2016 ICL ?
man…. u r just itchin to lay down….. 😉
Kinda feisty today…. lol
Probably should work out … lol
That is a huge question ( And answer).
You saw Dec 2015, then a higher ICL in May, then that lower one in Dec 2016 was actually concerning .
I went back and looked at 2000 – 2012 and I think it only happened once ( A break to new ICL lows).
We both expect an ICL in June…….I just do Not think there is enough “Time” to break that Dec. 2016 low.
If Gold remains as strong as it has lately, probably not, but take a look at the sell off from NOV to DEC 2016 ( ICL) – or NOV to DEC 2015.
They get brutal if the selling panic kicks in. Those sell offs were sick.
EDIT: Let me add that I hope the Dec lows hold. It is just more bullish to make a higher low.
Yes I most certainly agree it is possible !
Geopoitically much different times though……
Good Point, when the time comes, that could be a strong catalyst
yes.. i need a good stiff .. drink
. do some pushups
😉
Can I give a smart-alec answer first ? 🙂
Sure go ahead lol
If it is correlated to TLT, it will obviously drop to the Dec lows like TLT did in March : )
Sometimes something pops into your head and you just cant resist – lol
J/K
LOL…..
Real answer below
Real counter above
Rob ? 🙂
Sold another 1/2 of my 1/2 of JDST $20.66
NAK is pushing ( without success) against that 50sma again. Really needs a good solid POP above it, or else it might drop down to teh 200sam again.
Alex, if I draw JBL on the 15 min 5 dyas, I end up with a descending triangle and what appears to be a bounce on the 50 day. I trying to learn intraday charting. So is that the correct interpretation?
Sorry I missed this. Sometimes I leave my screen and come back & if it went to sleep, I have to refresh and lose track of whats new and whats old in the comments. Somehow I missed it.
No problem. I’ll ask something similar in the future. Just trying to learn intraday charting.
It is basically ( or exactly) the same as a daily chart pattern-wise, but what I keep in mind is that using a daily chart , it can take something 7 days to play out. Using a 5 minute chart, it can play out in an hour. A 1 hr chart can play out in 7 hrs ( or by the days end) etc.
It takes time to get used to it, but you’ll see, for example, ‘Oversold’ to ‘Overbought’ on a daily chart can take lets say 7 days.
Oversold to overbought on a 30 minute can happen in 6 hrs.
A 5 minute chart can go from oversold to overbought in an hr or less. So patterns fulfill faster. The target completes quicker, etc
That is the big difference…time.
Hi all – I just sold my GDXS (double short GDX). I was asked by others to report on my experiment, so here are the details:
1. I bought GDXS for $14.9035 on 7th April (when GDX was $23.83).
2. I sold all for $16.96 just now, when GDX was $22.16.
Analysis: GDX went down 7% over 18 calendar days, and GDXS gave me a return of 13.83%.
Overall, I think this experiment worked well because the 2X nature of the short made it easier to hold through all the shenanigans (and uncertainties) a few days ago when GDX rose to $24.73. In fact, because it was only 2X, I felt able to double down on the bet at that top (thinking that the downside was less severe if GDX broke through).
Overall, I’m pleased with the result and would use GDXS again in the future.
Thanks for the feedback!
I remember your buying that , nice trade and a little safer feeling than the 3x etfs.
Thanks for sharing, I’m sure many readers will use this for the next daily cycle.
This is actaully a POST that I will copy & put in the report tonight for the benefit of those that do not have time to skim the comments after work.
Thx D
Great – glad to help. GDXX is the 2X bull version of this short ETF, so I might play with that during the next ICL…
Nice! I gotta figure out how to make the report some time. Still working on that one. Hmmm….
spreads are pretty wide on GDXX and GDXS (low volume too), did you get good executions?
I didn’t track that aspect closely. I did get slightly less than I expected, although I put that down to the currency transaction (into GBP), which is also a big spread.
I guess with GDX down 7%, and me getting 13.83% in execution, I’m happy enough, but I agree that might be an issue in certain circumstances.
I think a key to success in this trade is selling on the way up, because buyers are there, and buying on the way down, because sellers are there….and I think you may have done both of those.
That is also 2 of the hardest things to do…sell on the way up is one that I force myself to do against what I really want to do.
To be very clear, Alex, I could only do it because of your reports, and the community here. Your work gives me an edge that gives me the confidence to take some short-term drawdown, and being clear when I need to abandon the trade (and potentially reverse direction). Quite simply, I would never have taken that trade if I wasn’t here.
Sure and thanks, but you pulled the trigger on both sides of that trade, buy & sell. That to me means that you learned and applied it along the way. I never posted about GDXS –
so good trade Dialogue 🙂
Here could be your next experiment dial:
Try GDX Puts ITM 3 months experation next time. Less cash outlay with greater returns.
deffffffintely on my bucket list….for when i *hopefully* retire next year… ;o)
Thanks for this. Options scare me because I lost so much once…but perhaps GDX puts might be useful. How/why do you select in the money 3 months expiration? I don’t get free trades on options, but it wouldn’t be too bad to pay a fee.
Hi Nancy,
In this case because the Puts would used as a hedge, that would be considered by me as a very short term trade to protect long positions.
I gotta try the longer dated but I don’t want to front the extra money. I have often had options come up to expiration only to run wildly the next couple of weeks. Like maybe SPY Apr monthlies? Ugh!!!
Thanks for sharing!
Getting a little divergence in the SHORT TERM charts for a bounce in AKS.
Nothing says that it will last once that short term 5 & 15 minute charts get overbought again.
Yikes….
SID or GGB might be a better play ?
Did they have their earnings yet?
STLD & ZEUS still seem ok, and GGB & SID are near lows, but I dont know when earnings are.
SID May 8 or 12……
based on discussion below.
so….. chartMeister… do u think Gold could repeat that last leg up …. which would give it the “5th” wave to complete the impulse…?
look at this ..
I will give u the zoom out first… thennnnn the zoom in.. lol
zoom out view:
https://www.tradingview.com/x/4F3SN408/
zoom In view… hmmmmmm pretty close .. :-O
https://www.tradingview.com/x/Op8ecFjI/
Sorry – I do not think that this will play out exactly this way. I dont see the ICL ( They are deep sell offs that make gold bulls throw up usually).
giggle…no apologies necessary… just a wild hair brain scheme 😉
Not too wild- possible upside similarities . Once the iCL is in place, I would like to request that ramp up, because a wave 3 would do that . just need a deeper pullback at this point I think. 🙂
well.. let me just say… i am SOOO thankful I am sitting here in the high seats of the dump truck… patiently waiting to load up .. instead of being down on the ground running the shredder … getting my finnnnners cut off…
;-D
I’m usually in the shredder. Nice to not be there for once!
wild hair ??? 😉
bad hair day today ? 😉
oh…. really…. .. i thought u would have taken care of ‘all that’ …. you know
…. given .. the ummm … ……. ‘test’ in all …..
hey there is No hair in or on my c****n !
#c****n proud.
lol
LOL
ahhahah… omg.. CF has to build in a CF romper room .. complete with padded walls and boxing gloves, speed bags (im pretty good btw), etc… so we can all work off our pent up *energy* while waiting for the dang ICL …
https://uploads.disquscdn.com/images/a25cc7314c60712be2e8d08cab7568bcb79e03c9ffcebfe74d94050c5715dd5e.jpg
You would look pretty good with that 1960’s hair cut btw….. 🙂
*meow
which one… the bombshell?
;o)
Just get us to 1560 after ICL, would ya? Last rally was disappointing overall (certainly if you stayed too long like I did!).
I kinda like it ……
Alex,
When/how do you determine if the miners/GDX are simply heading down into an ICL right now, rather than getting a modest 4th DC? I sense we are heading directly for the ICL in the next week.
I might think that normally too, and I’d think that the FED MTG would be the ICL & Miners rocket from there, but there is reason to believe that this isnt a drop into an ICL. It will be in future reports, maybe the next one.
remember that Golds 3rd daily cycle was extremely right translated and an ICL needs to kill bullish sentiment. Miners may not be very bullish in peoples minds, but Gold still looks all out bullish even with recent selling.
Alex,
I agree. No way gold is done yet. GLD has some real room to run lower. I know sentiment remains too high as I heard CNBC this morning say – “gold miners getting hit today, we’ll show you what to buy now….” Uh oh. I will wait until that turns into “gold miners hit today, today’s expert says gold heading to 1000!”
Thanks for the comments. I sold all my JDST today that I bought at 14.06, and half my DUST. GDXJ is now oversold on the daily, so will need to reset a little. GDX is still not quite there. https://uploads.disquscdn.com/images/4c3c3482f08de85d82581a0b9e5bbfffb1d554de658eca10fe1871681a08d448.png
Congrats on the trade 🙂
Nice chart!
WG, CRK, WPX and a few other ENERGY stocks getting interesting.
Just took a small XLE here.
I am giving AREX and AXAS a shot…..
Holding off on any USO Calls though……
GUSH
OAS?
One more 100K question (I promise 😉 ) :
Will the BO’s of QQQ, IWM, SMH etc. Hold there BO’s ?
FWIW. Sold my JDUST just now, was a little early on the entry but still bagged 30 or so %. looking to enter again on a bounce, if we don’t get one then that’s cool also. Back to almost all cash bar my old friend CLF.
Nice trade. I know most have said that they don’t like trading the short side as much. And neither do I. But you have to trade what the market gives you. Trading against it does NOT work, trust me I’ve tried. Sometimes, you just got to make a buck. JDST was a fantastic trade for me; had a really large position.
Nice double bottom with divergence MACD & oversold on GUSH ( I’m tempted , looks like it wants to run to $70 , but I am Not buying it myself, so hard to say that I am recommending it. if I bought it, my stop would be 2 days ago lows).
why 70 ? and not higher ? any specific reason you say this ?
funny you said 2 days ago as i bought them 2 days ago : ) as well as ERX
I just meant at least $70 – see the 50sma
I am also giving HBM a shot here……
Nice reversal today right on that 200sma. Good risk reward.
Yes….possible double bottom also.
I am out……Hopefully my $100K questions will be answered in the next CF Report !!!!
X down 14%, wow
Wow, didn’t see that at first. Just read the basic earnings results. That was a terrible quarter!
I have about 25% of my account on this 🙁
Sold Jdst a day early – left the other $3 on the table:(
Surprised Jnug volume didn’t get 100 million through. Nugt matched Jnug volume which is interesting- maybe nugt coming back as preferred trading vehicle.
Barrick volume (51 million) and sell off were both impressive
Yeah, that’s why I was only selling half. Also, while GDXJ was starting to really get oversold, Gold was not, at least on the daily. Now after today, I had to take some money off the table for sure. Giving it all back is always a terrible option!