The 1st round of the French Elections are being held on Sunday April 23, and that may temporarily shake up the markets, but so far, things do seem to be lining up as expected in various sectors. Let’s review …
.
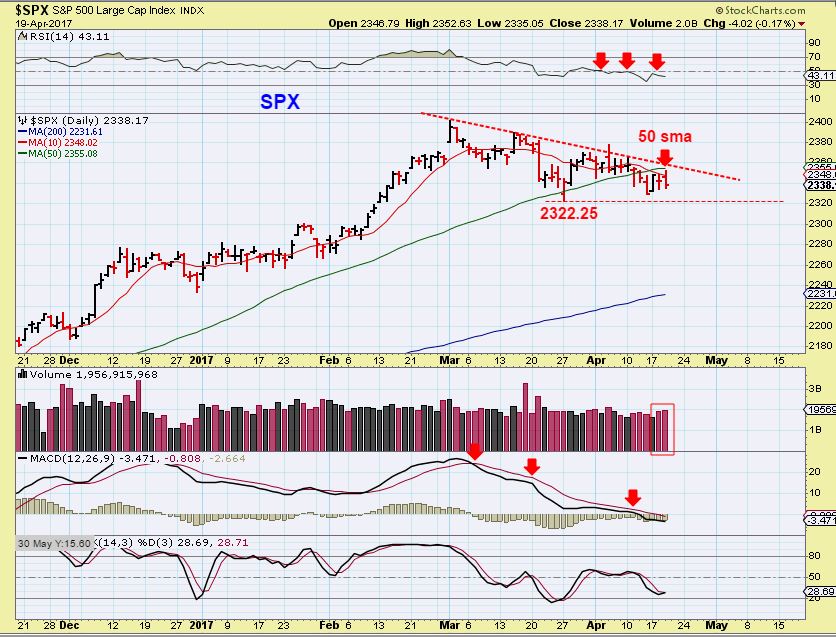
SPX – On April 19th we saw the SPX continue to be rejected at the 50sma. I mentioned watching that 2322.25, because a break out higher or lower is important.
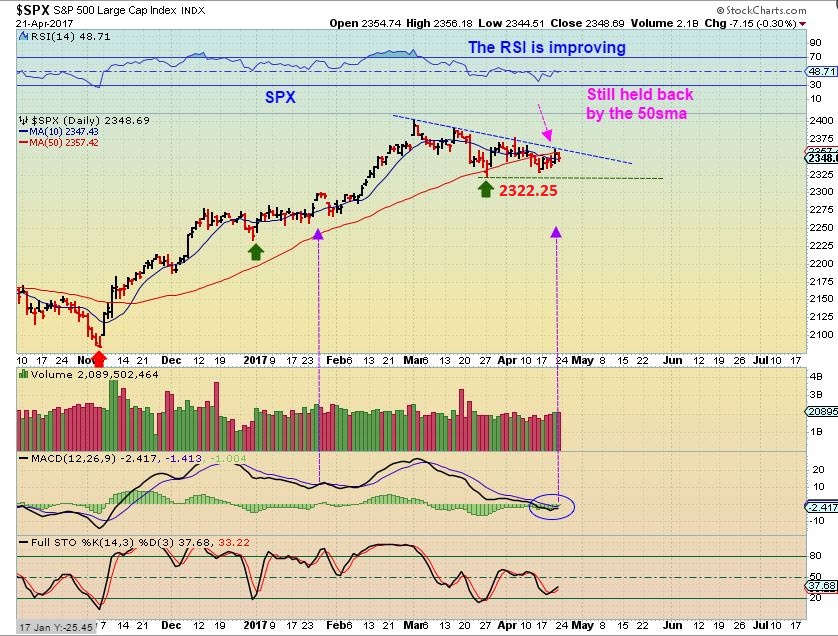
SPX April 21 – No change yet. The RSI & MACD are improving, but no break out yet.
There is a bit of a mixed picture in the General Markets, due to varying degrees of strength or weakness. Let’s review this.
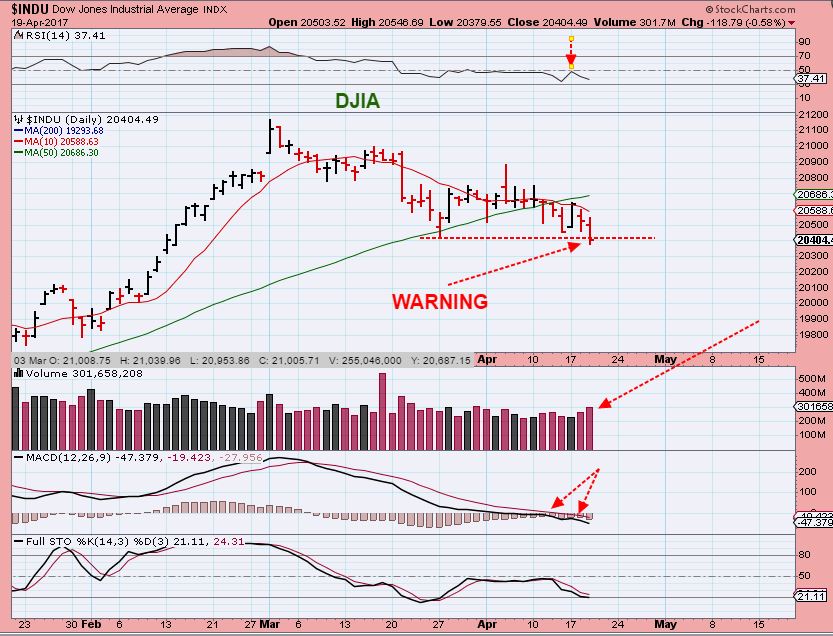
On April 19th I pointed out that the DJIA & the XLF dipped below the last daily cycle low, so that is a sign of weakness & failure. It is a red flag really.
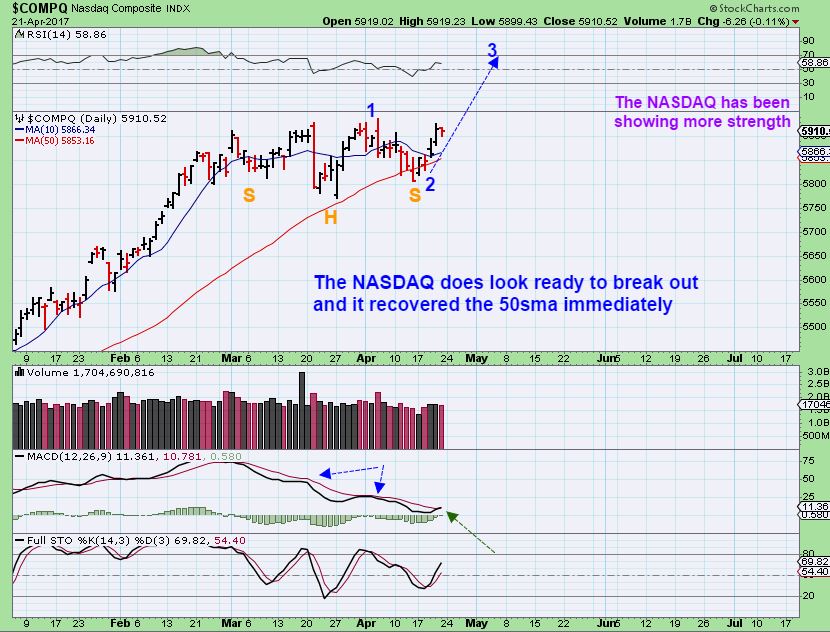
NASDAQ – The NASDAQ has been stronger and looks set to break out higher after holding up at the 50sma. This could be an inverse H&S , but the MACD is lagging so far. We do see some Tech stocks showing bullish signs as follows…
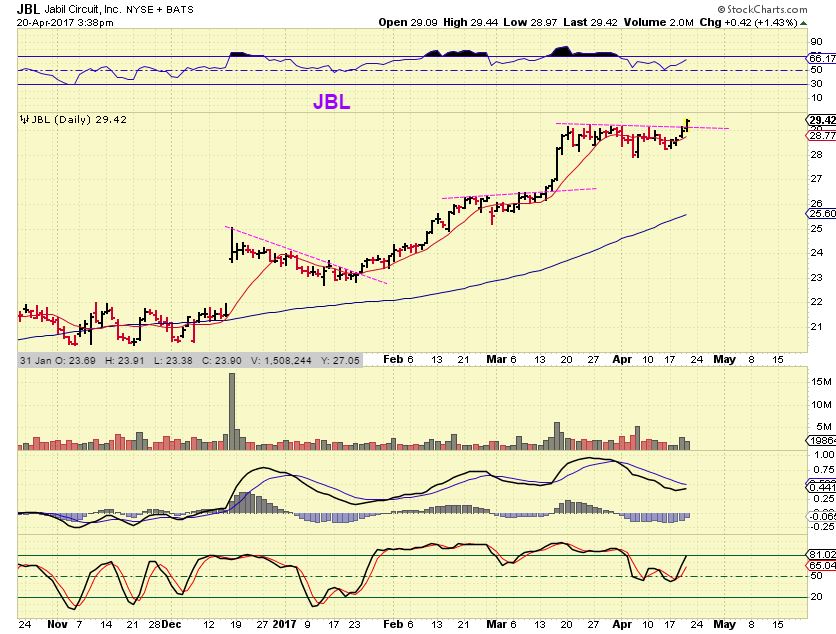
JBL from Fridays report.
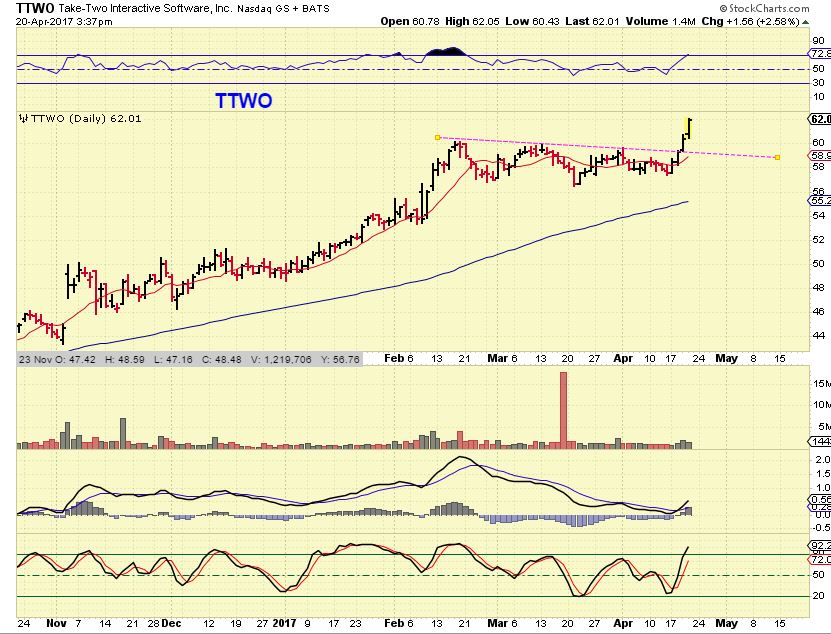
TTWO from Fridays report
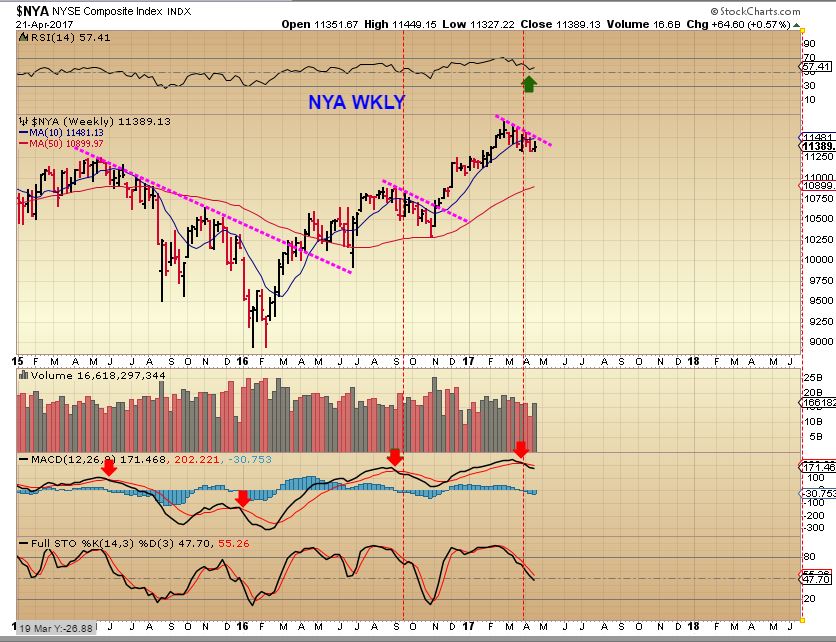
NYA – Here we see a consolidation similar to past consolidations. In the past it dipped down to the 50sma when the MACD crossed. This chart is basically neutral.
So the General Markets are Mixed at this point as they continue consolidating before a break out or a break down. They can offer SHORT TERM trade set ups that are pretty low risk, as shown in past reports, since the lines in the sand are well defined. It is now getting late in the 3rd daily cycle and even if these markets break out higher, they should roll over and begin seeking out the next ICL. The DOW actually looks like a failed daily cycle and indicates that it is already weak enough to do that.
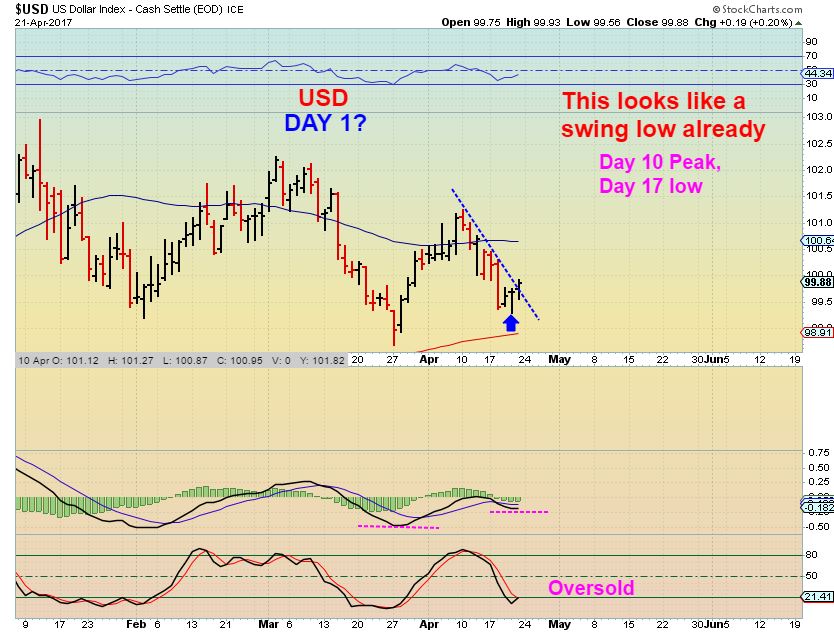
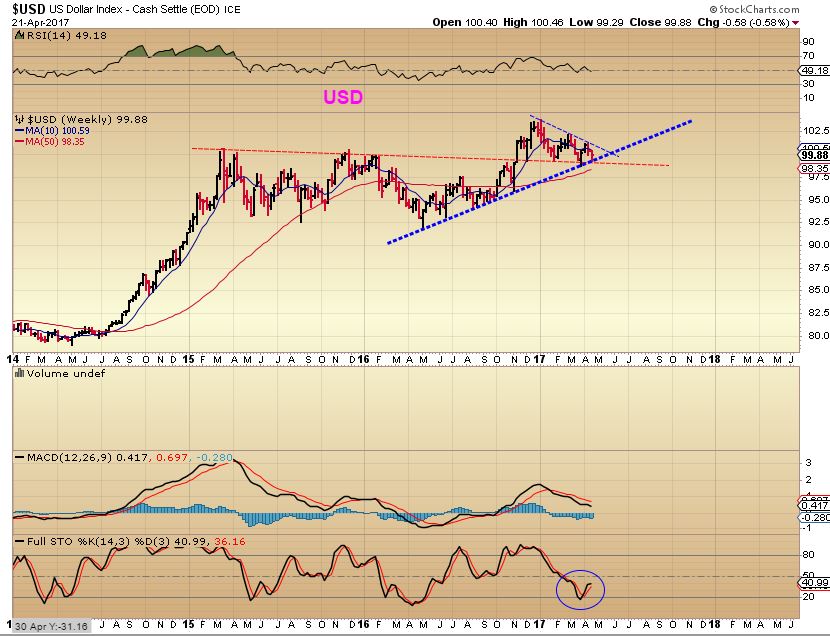
USD – The USD may have a bear flag (Continuation) here, or it may have even put in an early DCL, since we do have a swing low in place and a break of the trend line. We haven’t taken out the 10sma upside yet, but it is close. The last few daily cycles were unusually long, so could this be a shortened one for balance? It has happened in the past. I have been thinking that we saw an ICL in March, so this would be the higher low that we need. A break of the lows means that we do not have the ICL in place yet. We will know soon enough.
USD WKLY –
WTIC REVIEW – Over 1 month ago, I expected a nice rally to back test the break down (B), and then I wanted to short OIL.
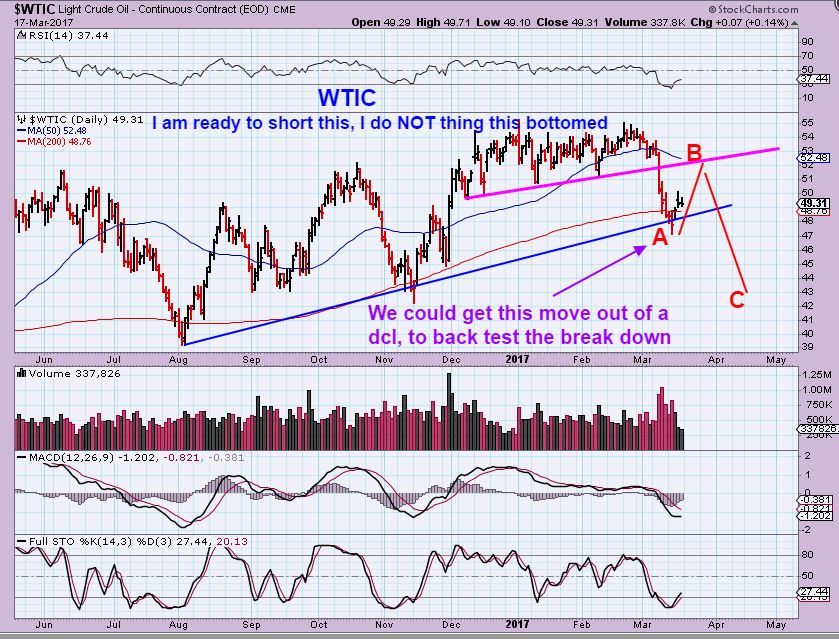
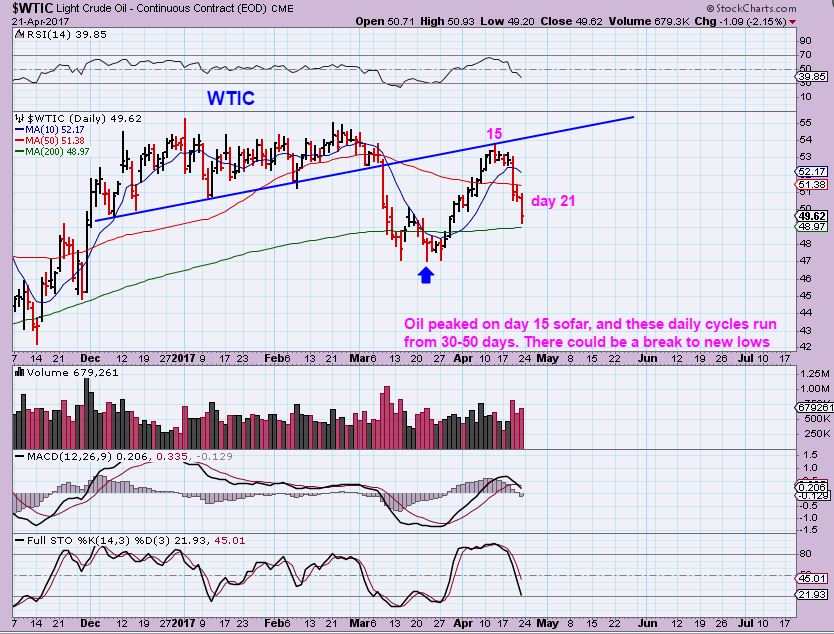
WTIC – SO far we are getting what I thought would happen, but I didn’t play it on the short side like I originally wanted to, since many Oil stocks looked like they were recovering their 50sma, etc. So where are we now? OIL can have 30- 50 day daily cycles and that gives Oil a lot of time here. I originally was calling for OIL to drop to the $43 area or lower. It may or it also might bounce around and try to hold the recent lows or break them just slightly. The Weekly explains why…
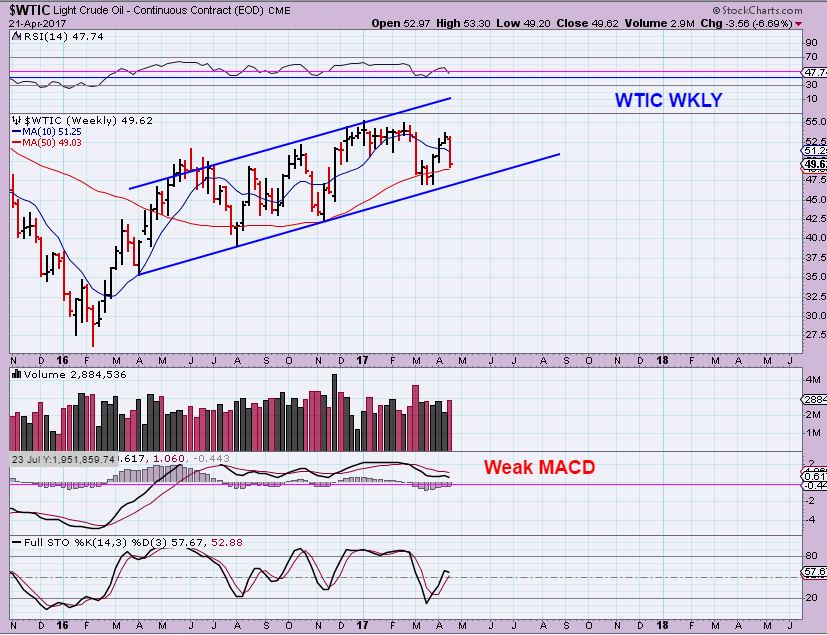
WTIC WKLY– You can see that a drop to that blue line could find support, and that is not as deep as the $43 area. If ‘everyone’ is looking at this blue line for support, usually it will be broken on the downside to get people to go short, and then it puts in a quick ICL & recovers. The markets are devious like that.
NATGAS APRIL 19th – I was watching this downtrend line & Support
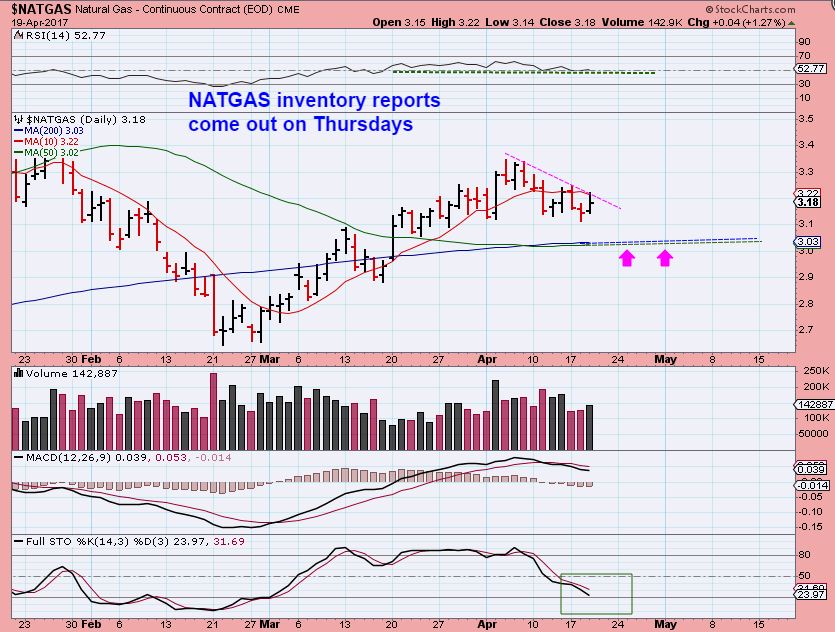
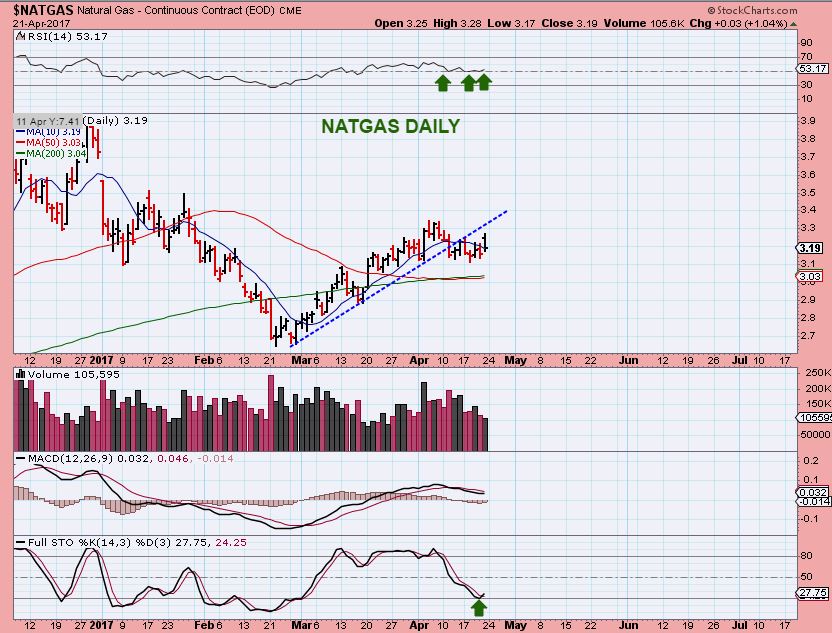
NATGAS – I’ve expected a possible tag of the 2 supports as a possible buy entry (The 50 & 200sma), but so far NATGAS held up and even broke out temporarily above a small downtrend line shown in the above chart. It closed below the break out, but that could be a swing low above the 10sma too. NATGAS has become oversold.
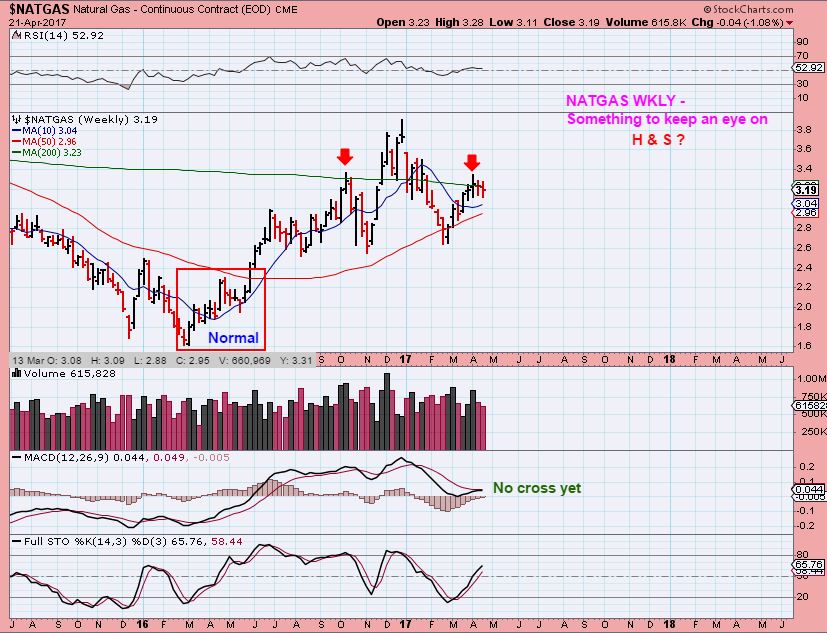
NATGAS WEEKLY – Then you look at the weekly chart and you can see that NATGAS is at the weekly 200ma. This is NOT a H&S at this point, but it is the potential start of a H&S unless it moves higher. I would be cautious if NATGAS breaks and closes below $3.
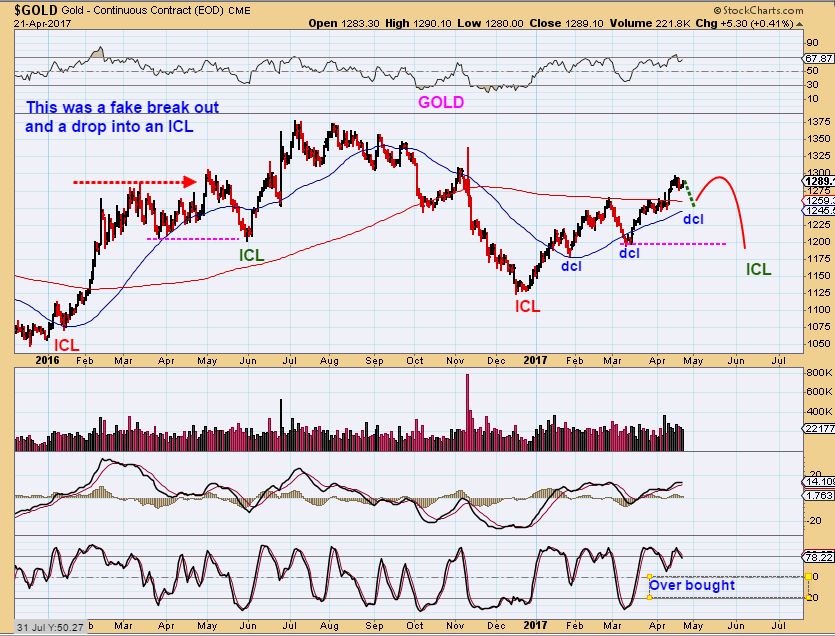
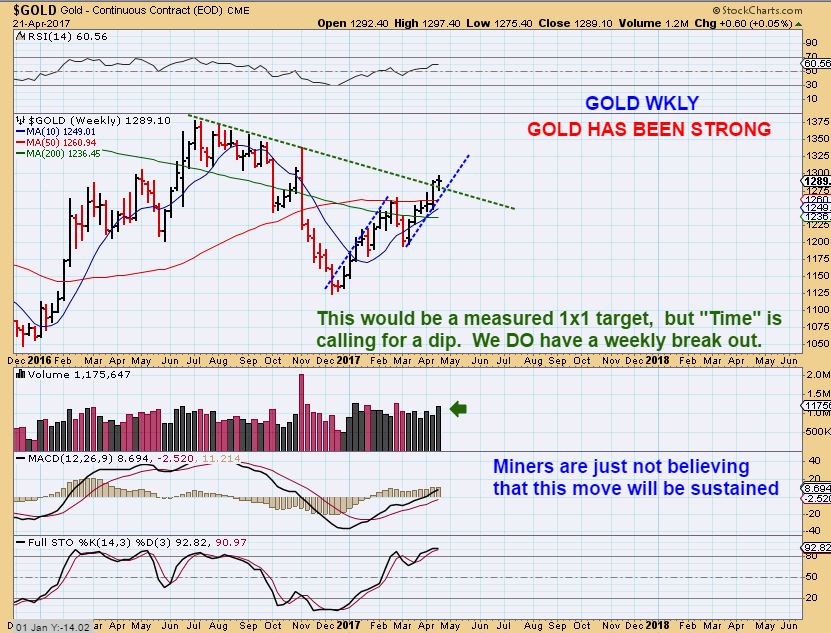
NOTICE THAT GOLD IS WELL ABOVE THE FEBRUARY HIGHS
IMPORTANT GOLD CHART – On the left side of the chart, I am pointing out a fake break out to new highs in late April 2016. Gold then dropped to an ICL for the entire month. SO Gold looked really strong in April 2016, but the ICL still came in late May. I expect the same this time, even though Gold looks so strong in April again. ICL in May or June.
GOLD WEEKLY #1 – A measured move continues higher, but it may not fulfill with an ICL due.
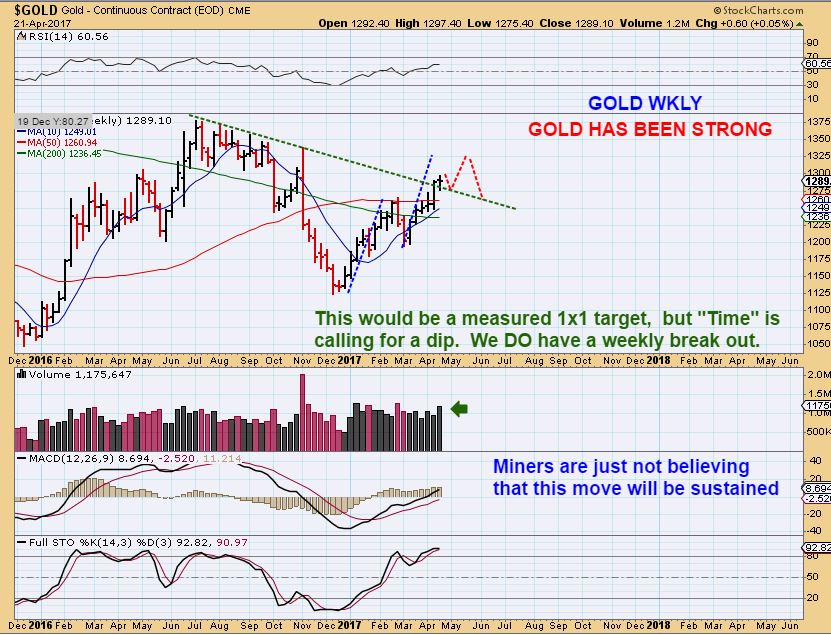
GOLD WKLY #2 – This shows 1 idea – a dip into a shallow DCL soon, then a push higher in the 4th daily cycle for the measured move, which would roll over L.T. and drop into an intermediate decline. I expect Golds decline to be deeper than this actually, so…
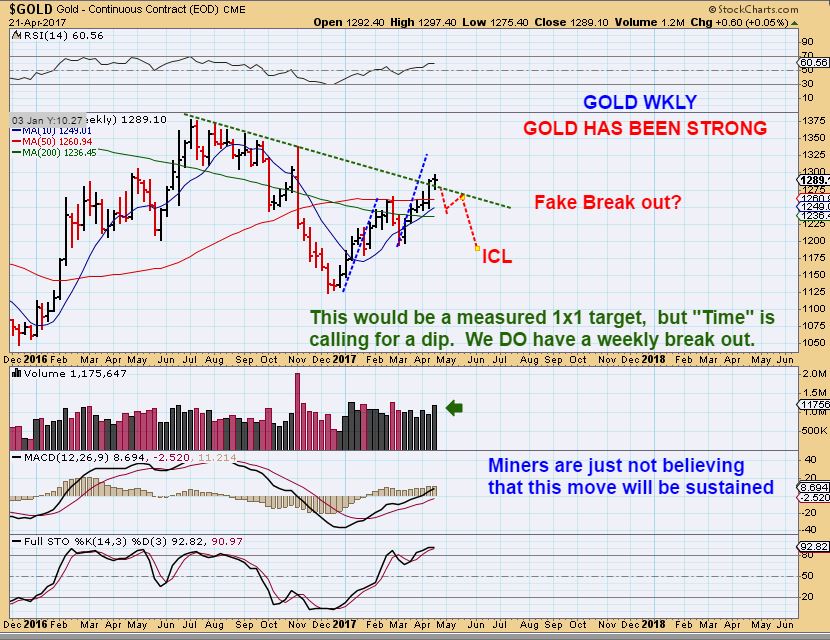
GOLD WEEKLY #3 – This shows the measured move never fulfills. We drop into a 3rd DCL now, Then we see a sideways bounce in the 4th daily cycle & roll into the ICL. The current break out would suck in the bulls for the slaughter.
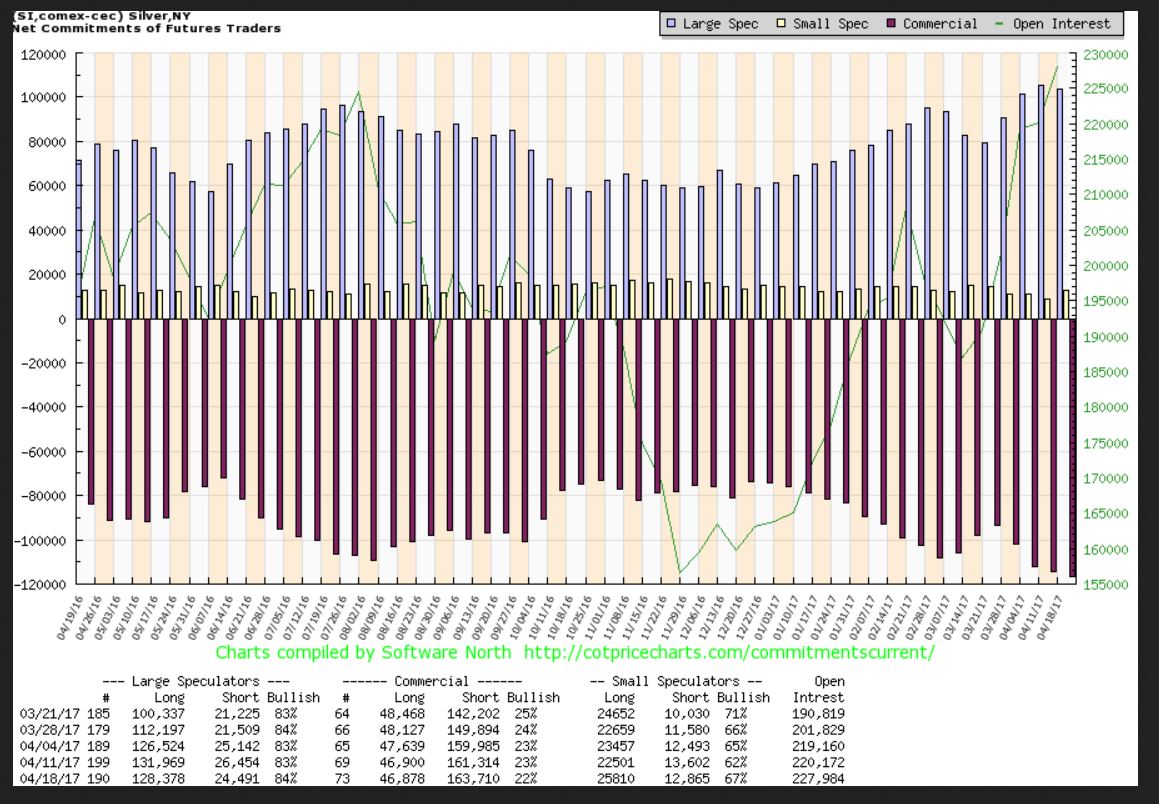
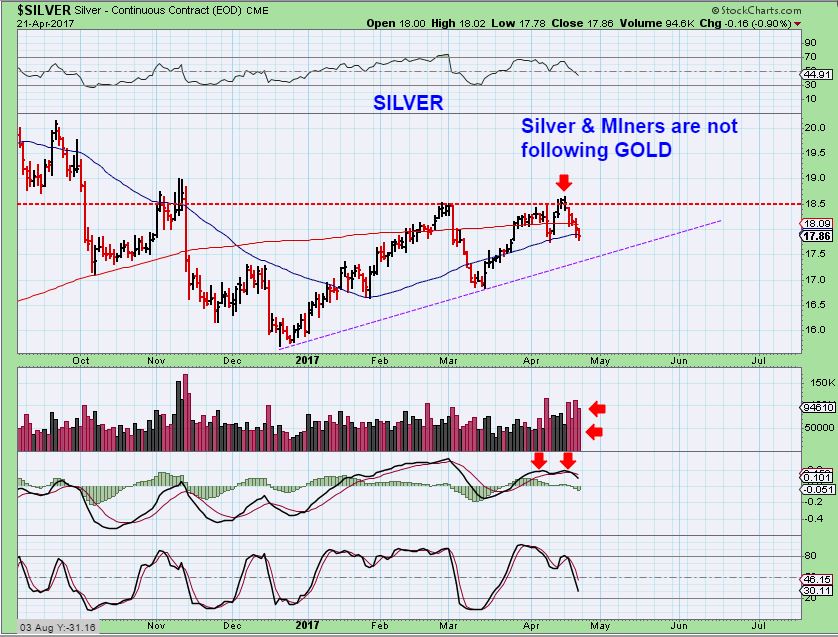
SILVERS COT remained at record levels as of Tuesdays reading. THIS IS BEARISH FOR SILVER the same way Oils record short level was for Oil.
SILVER did NOT follow Gold higher any more last week, it remains BELOW Feb highs. It joined Miners with a weaker week, and we know that we are due for an intermediate drop too.
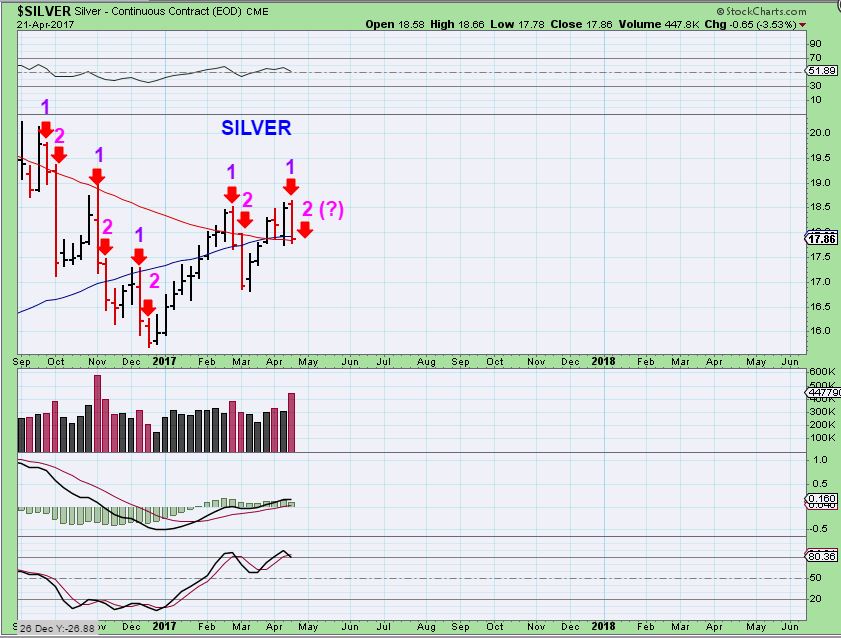
SILVER WEEKLY – IN the past SILVER has a history of dropping at least 2 weeks in a row, I decided to show that here.
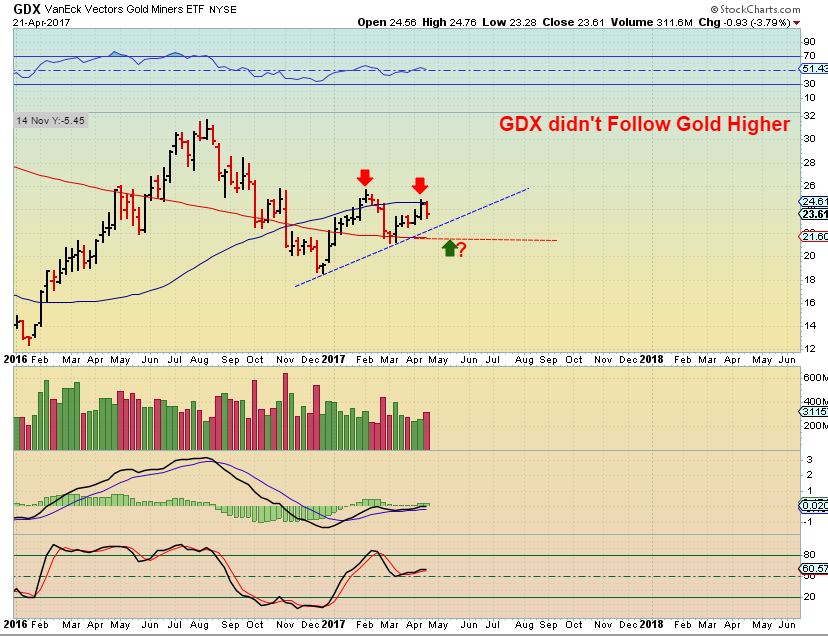
GDX – GDX was stronger than GDXJ lately, but it did not follow Golds break out higher last week either. That is usually the only warning that Gold longs get. GDX never broke above Feb highs. This has been my expectation, and we are due for a DCL / ICL.
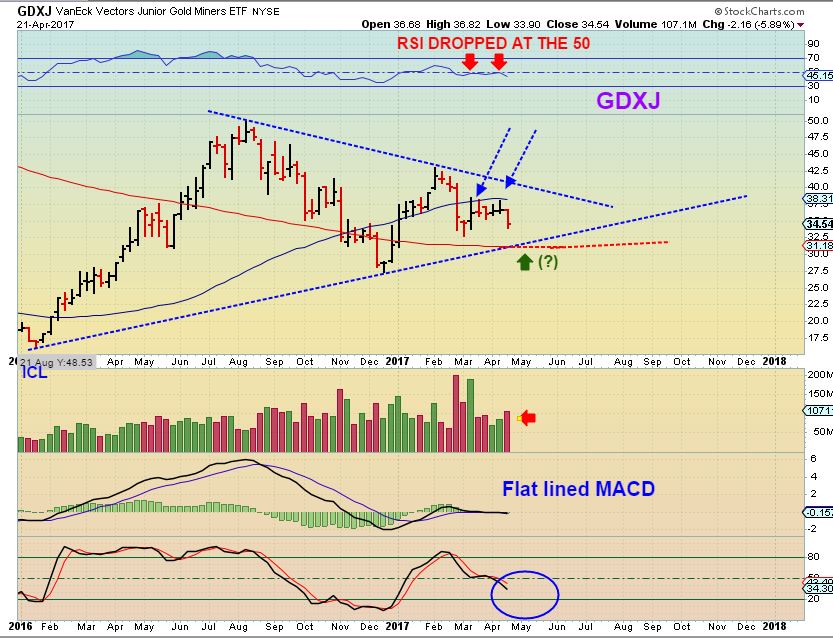
GDXJ – NOT EVEN CLOSE TO THE FEB HIGHS, right? I have drawn in possible support, but when seeking out an ICL, I have seen that supports do not usually hold up. They are broken and recover later. When dropping to the DEC ICL, did the red or blue line hold up? No.
This summary goes along nicely with everything that we have already been discussing over the past few weeks. It does seem like things are lining up. When we eventually have an ICL in the precious metals sector, we will be making great money trading the Miners again. This is the time of the year that I seem to make my biggest gains. Stay tuned! Enjoy your weekend!
~ALEX
NOTEWORTHY NOTE: Noteworthy, but not extremely important, read at your leisure.
For the sake of my readers I want to make something clear, I am an analyst and I am not known as one of those “GOLD BULLS” in every sense of the word. I think that I probably did make most of my best trades going long Miners in the precious metals markets, but I do not fight the markets. I analyze and trade accordingly. I say this because I had someone kindly write to me ( They honestly were very warm and kind) and say “I’m buying Miners all the way down and I will be happy years from now. That is all that matters and it saves the headache of timing the trade. Why don’t you just do the same- buy miners on each & every dip? A year from now you’ll be happy. “
I’m not here to tell anyone what to do, or what is right & wrong, but I am here to show my way of making the most of my trading in markets that can get tricky. Maybe I can show how I learned the hard way? And Maybe I can use a couple of charts to simply give some gentle persuasion. At the very least, We will see that I choose to trade based on analysis to help us to try to buy low and try to sell higher. Lets take a look..
Well, for starters, I enjoy trading! It isn’t a headache to me at all, it is a challenge and I enjoy trying to Buy low, sell higher and eve re-entering lower. Sadly, I know friends of mine that bought and held Miners in 2012 rip Roaring Gold Bull Market and they held on for dear life, instructed to do so by other letter writers. Those Miners may still at this point be cut in half or even worse, they’re still down 70%. My friends are not happy about that now. Even if it goes back to break even 8 yrs later, they are wishing they could have sold higher and bought maybe 5000 – 10,000 more shares at current prices with the same money. Gold was a MASSIVE bull run, but the Markets are unpredictable and good money management is a responsibility of every trader. Some have learned that the hard way, and I consider myself to be one that had to learn that the hard way too. Please learn from me back in 2000 with the TECH BUBBLE. I was newer to investing. Everything that I read was saying, “Tech companies are changing the world and have been running higher for years. Funds are accumulating for the years to come.” I though, ” No one would ever sell those for long, right? Buy these dips!”. Especially after Y2K passed!! Do you remember Y2K? The world was going to have a Tech melt down, so after that was all clear, buy buy buy tech stocks in 2000!! I had watched many run higher, split, run higher, split, etc. etc. I vividly remember buying stocks like CSCO, EMC, NTAP, JDSU near the 2000 highs right after Y2K fears dissolved, then I kept adding at the bargain prices of each sell off with no stops. This was CSCO, and I bought this one among others.
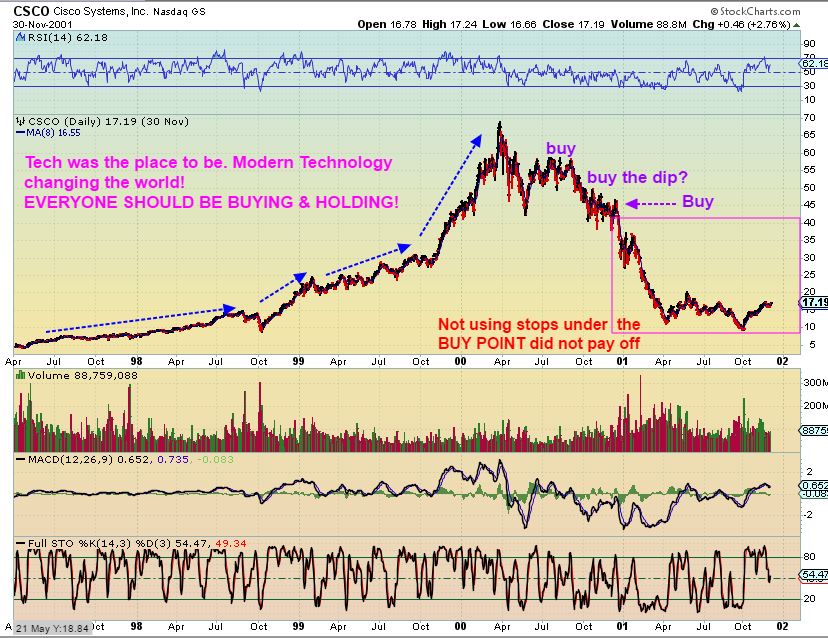
Eventually I found myself then selling after eventually getting cut in half. 🙁 I traded without money management because I trusted the markets were Bulls. I said Quote , ” I trusted the bull markets”. Big mistake.
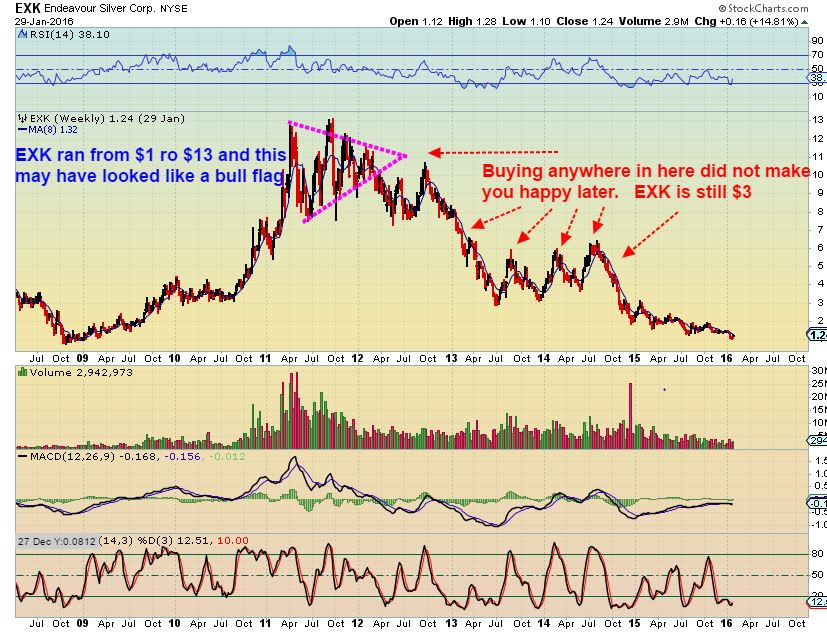
The MEGA GOLD BULL MARKET was running form 2000 – 2012. I have a friend that bought EXK after it broke above $10 and they still hold it now, after buying more on each bounce on the way down. There are TONS of Miners like this, and there are TONS of holders from the 2012 time period that bought that ‘Guaranteed BULL MARKET’ and it was a ‘BUY & HOLD’ with no stops adventure. Don’t let go, dont sell them or you’ll lose position in the Bull run. Those buyers that are still holding didn’t know that Bulls can end and return. You cant blame them, but sadly many are still waiting to break even. EXK went from $13 to $1 in 2016. Please be careful, and I always say “Please use and honor stops”. N-O-T-H-I-N-G is guaranteed in these markets.
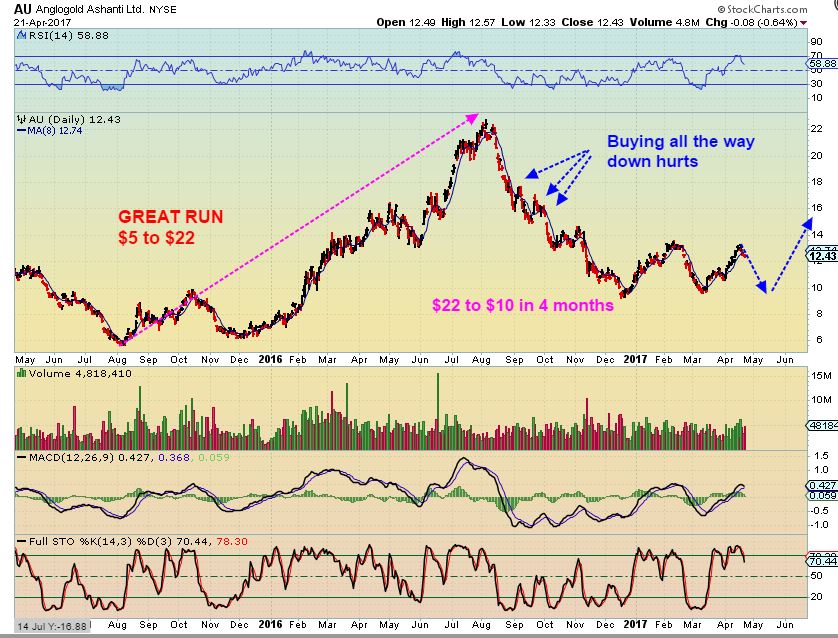
DO I think Gold is going higher, eventually back toward $2000 and more? Yes, I really do, but how it gets there is still undetermined. And please remember that even after even The Great Miners Run in last year in 2016, where the Bull returned and many Miners doubled, tripled, quadrupled, there was a strong selling period into the DEC ICL at the of 2016. The lessons are valuable and should be fresh in mind. As a result of my Tech Bubble losses, I have found a better way to make money and keep some of it. I dont sell the exact highs and keep every nickle that I’ve ever gained, but I buy low and sell high to make money. Adding all the way down into an ICL can be painful for weeks, even months, and who knows exactly what the future brings. Notice this chart from the EXCELLENT 2016 run in Miners…
AU dropped from $22 to under $10 last Aug to Dec ( in 4 months). It can happen quickly and Miners can have added risk with earthquakes or floods or other factors inhibiting earnings & profit.
Just a painful lesson that I learned the hard way, and just a noteworthy note for the readers.
Friday April 21st- STEEL SPARKS 
 April 25th – Give Me A Break
Scroll to top

Great report! Staying only about 10 to 15% on trades now and waiting for the next ICL.
Same. Bought a couple small positions (AKS and CGIX) from the report on Thursday with conservative stops.
Me too , keeping it rather small until I can get that FAT PITCH to really swing at 🙂
Thanks Alex.
CF,
What are your last two ICL Dates for Crude Oil ?
TIA ……
FEB / AUG ( normal length) then possibly a really short one in NOV, THAT is why I was thinking that we would get that large ABC back test of the break down and then the ICL next. We had a very short intermediate cycle if Nov was an ICL, so I expected the next one in MAY/JUNE…..Not April.
Then the triple bottom in APRILs daily chart and the ENERGY STOCK STRONG RALLY was having me wonder if that triple bottom would be an ICL.
I think we are on the same page……
Are you currently thinking that this March 2017 low is an extended ICL from the Aug. low, assuming that that low is not broken ?
Big gaps at open. Any news driving this? Could be false breakouts/breakdowns.
French Election. Presumed winners did make the runoff, worst case for the markets was avoided so went to a “risk-on” trade. We’ll see if it holds through the NY close tomorrow! This outcome lines up with Alex’s thoughts from above and I am positioned this way so hope it holds, personally.
Great report and advice….
Thx David – Live and learn … I’ve had my lumps 🙂
Great job chotfreak….. Thank u for sharing your personal experiences… 🙂
Thanks Maria – You’ve been away for a bit, hope all is well.
Thinking of you too Tammie…
Thanks, Alex, certainly appreciate it. 🙂 Just now popped in and saw your note. My mom’s funeral was yesterday, so at some point I will get back into life and all the things I need to do …as much as I’d like to just sit around for days and do nothing I think tomorrow I have to get back to the world and start working on some of her things that have to be done – looking forward to catching up on some of your reports and slowly getting back to market watching and seeing what’s been going on the past 3 weeks. Thanks for thinking of me. 🙂
Hugs to Tammie.
GroupHug :o)
Thanks 🙂
Thanks, Nancy 🙂
sending healing energy girl….
#strength
Thanks!
#everythingisenergy
Have you seen the Tedtalk on this?
No, I don’t think I have seen that one…I’ll have to look it up….:) I’ve got lots of books
on it though…..:) #quantumtouch #scalarenergy #thoughtsareenergy
If you search “stroke of insight Ted” it’s the one with 4million or so views. Really interesting (but kinda gross that she shows a real brain to the audience!).
Best wished Tammie, never easy….
Thanks, Bill! 🙂
NATGAS – I waited and waited and now its up 11 cents?? Wow. I did not take my re-entry yet.
Where do see this Alex? I see it’s down, 3.074?
Well, if you scroll over the time stamp to the right of my name in the comment, you can see that I posted that comment at 11:17 p.m., so that was last night, and things can change over night, but I still see it up 7 cents at $3.17
http://www.finviz.com/futures_charts.ashx?p=d1&t=NG
Thanks, I bookmarked your link
Booknark this one instead Chad , its better. Then you can just click on anyone you want. I use this every morning 😉
http://www.finviz.com/futures.ashx
what means booknark…
*spoken like my gbabes… lol
what means “chotfreak”, from your post below! LOL………#CG
hiiii pecos ;o)
miss me? 😀
*remember back in the day when he posted audios?? snicker…..
Got it, thanks.
Thanks CF…another tool in my toolbox 🙂
Is the finviz chart wrong? I see two other sources with a price of $3.04 as of 10:10am while finviz is still at $3.14. The former makes more sense as UGAZ is down nearly 6%!
If UGAZ is down, It would make sense that NATGAS is down
what u think of AKS AND STLD…. CHOTFreak
They still look good, but AKS may have to contend with the 200sma
tx dear… AKS reports 2moro I believe so tight leash on that one… 😉
in from last week…
giddyup
Good info. Gonna tighten up my stop on this one. Looking at their annual report, seems like there’s a lot of asbestos cases pending: https://uploads.disquscdn.com/images/653bb51893d532fcabb86512792bf2508fd1c21ec49479996659ba5fa13ac1e1.jpg
GL .. im out – no desire to gamble on earnings.. 😉
Yes, they do!
Alex – you mentioned you’d be cautious if natgas breaks and closes below $3…I’m thinking we’re going to get there pretty soon. What are your thoughts on where natgas heads if it in fact gets to that point?
To further illustrate the futility of buy and hold through a ICL, as Alex said, I’ll enclose a snippet from well-respected Ned Davis Research, Inc., in Venice, Florida: “Say you invest $10,000 and your account takes a 10% loss over six months. You’re down to a $9,000 balance. Because of your reduced capital base, you will have to earn 11% to recoup your losses. The steeper the losses, the higher the hurdle becomes for breaking even. For example: Recovering a loss of 30% requires a 42.9% gain; a 50% loss requires a 100% gain. To recover from a loss of 75%, a 300% gain is required.
Getting back to even can eat up precious time. Take that 10% loss over six months. Earning a steady 4% annually after that, you will still need two and three-quarter years just to get back to where you started. That time would be much better spent accumulating new money. Remember, the idea is to grow your money, not just regain lost capital.”
Hey Edward,
Good points.
I always think of that 50% one too, because so many Miners do get cut in 1/2 on a good sell off. It goes along with the last chart in this report ( AU). It was $22 last August, and then $10 in March. It is a 50% loss and then some, but now it needs to do a 100% gain and then some to get back to $22.
So you can buy it on the way down and hope it comes back, or if you can find that ICL and then it goes back, you get a 100%+ gain.
And like you said, a 75% loss needs a 300% gain to break even. WOW. I’ll take the 300% gain over break even please 🙂
Wish the uraniums would bottom out!
Looks like they may be finally making that move now?
Got stopped out of URRE for breakeven, and small $25 loss on UUUU.
I am still in them waiting for up!
May prove to be best policy… but i dont wanna ride them down. if thats what theyve yet to do.
Yep…I am good at that …ride them down and think…”heck! They HAVE to turn soon!” I am here to try to learn not to do that so often. LOL
i dont much like this URRE weekly histogram breakdown..
it may be a fakedown-overthrow, just to fool me, but am gonna play safe for now.
if it goes further, that rising trendline may yet be hit at around $1.40
https://uploads.disquscdn.com/images/db9e0d20d0e39e372ef9853d6b303db20ff16ee67a8e0ad71d727f49d0f91af0.jpg
Getting close to the 62% URA Fib. And I have it currently in a c wave correction……it is close.
Thanks…I like your charts!
Sell the bottom! That’s what I do! 🙁
URA is close I think….following the major TL lower.
UEC lookn better ….. 😉
What is your “opinion” in Crude currently SOG ?
tbh, not really followed it for a while.
just glancing at my indis .. USO looks to be a falling knife at moment.
although 4H histo may be rounding off.
is it close to one of your Fib turnaround levels?
OK thanks.
here’s D USO chart with momentum indis and EnvChans.
got 2 comparable situations in past year, where indi is curling back under its trigger line whilst in the red.
https://uploads.disquscdn.com/images/2b29e6ea2ddc554021b05917943aacb8642493d3035a7cc24f527a0d64b26c53.jpg
Cool Thanks.
Bottom line: Will the March low hold iyo ?
well thats a $64m question aint it? 🙂
can only look back & compare.
pulling out on weekly chart,.. now is very similar to situation in April/May 2010, where price T/L was broken to give some kind of (yearly?) cycle low.
so (im guessing that) its quite possible the March lows get broken.
https://uploads.disquscdn.com/images/f585b9f5d8c2f10388f8284876ba6b3d0b4cba431e22d9ffd7bdedecf7f5b6f1.jpg
Thanks SOG for your opinion.
I may play it that the March low was an ICL (certainly due), I also have two of three major TL’s below price currently but Above the March low. All my indicators are saying a low will occur soon, just do not know how low that will be. Then you have some geopolitical issues going on. I like the RR.
It is a pretty tough call, but right now the divergence is good in the MACD on the daily ( I’m using USO at this point).
Now take a look at:
AREX, AXAS, IEO ……… all working on their lows above their March lows.
SCO getting overbought ?
Yes, XLE broke to a new low , but seems to be stabilizing now.
And also broke it’s March low…….i dont like that. 🙂
cough… DNR … ;o)
https://www.tradingview.com/x/OdwTn5zM/ ??
I am beginning to like the Oil Sector….. 🙂
the monthlys are fugggggggLey … 😡
SO I sold 1/2 of my JDST ( Roughly $13 to $17.55) as a trade.
I’m holding some in case we get more of a drop in GDX GDXJ over the next couple of days. IF we were to just drop day after day into an ICL, I’ll have skin in the game, but it may not play out that way.
I am also thinking that a DCL COULD be very close for GOLD, and we’ll get that bounce in the 4th daily cycle. That daily cycle will top early Left Translated, and then a more sustained drop.
SO I will ride some JDST since there is good profit, I sell some to lock in some of the trade at $17.55, and if we get a 4th daily cycle bounce, I will probably enter a short again on that bounce for a drop into the ICL.
Nice trade CF !
Im still holding. I like the lower lows and lower highs on GOLD. The Stoch hasn’t reached a significant over sold level yet on GOLD.
I’m still holding “Some”
Golds been moving higher for 2 hours, JDST doesn’t care, isn’t buying it.
I know, SILVER just POPPED and is only down 1 penny, JDST not reacting either.
Though I might have expected more than 6% on JDST when gold was at lows. But yes, didn’t care about afternoon recovery much. Silver did rebound but it also slid big last week on Thurs-Fri when gold did not.
REXX … lmao
I think it’s about time to flash my box again…. no??? SOG?? lmao
*snicker
howzzzabout FCX .. im diggin on copper
https://www.tradingview.com/x/fCazcf8w/
I’m with Bill. Nowhere near oversold. Last two DCLs, which came on strong R-translated cycles, at least tested 50-day SMA (1st) and broke it (2nd). A flash drop to 20day only with no MACD cross and decent stoch? Holding short.
NIcely done, Alex. I also appreciate you writing down what you are thinking.
Rob…. excellent said about ALEX.
I’m in the same boat in your thinking.
ALEX….. keep going, I’m serious, I’m not joking with you!!!!
Thx Rob, Boy , THAT trade was like watching paint dry, and wondering if it would ever really dry on time.
I really do hate shorting vs going long, even if the timing is correct.
Thanks Alex….staying Frosty.
What are the conditions that must be met for DCL confirmation?
Well, conditions to the downside have been met now. so the lows could happen anytime.
To identify the actual DCL, you need a reversal higher on the day after the lowest lows. That day higher must then move over the lowest days highs ( on a separate day). Sounds odd the way I wrote that, but that is what it is. 🙂
A break above the 10sma on the way back up is better confirmation.
I sold my Jdst today too. Bought a few weeks too early but got a nice move this past week. I cleared my full position off. $17.425 and out.
I hate shorting- but made some nice money – take a trade where you get it.
Good luck those still holding Jdst!
Just noticed my stop on NWGFF got hit. Hmm… that was supposed to be long term position.
Mine probably should have too, but I’m using a mental stop and I was away from my screen for an hr or so.
I will probably hold, it is not a huge position, it was an experiment, and at this point I’ll use the 200sma as a guide.
My position was small as well. Still like the business model. Just surprised to see it down like this on no news.
Our CGIX looking good the past few days, but I really want volume to start growing. I dont really want a double top
I should have stopped but haven’t. Really small position. So volatile day to day, hard to lose it on random gyrations day to day. BUT, mounting up losses isn’t that great either!
Alex, does the break above the down trend line in this SPX make you think this has legs at all?
I like the break out for some reasons, but it is a tough call at this point. we are well along in the 3rd daily cycle, so how much time is left? I cant chase it with a gap, but if I entered the trade last week, I’d probably let it ride and see what it does.
Being in a 3rd daily cycle – I expect this gap to fill sooner or later and a break down into an ICL in the near future. I’m GUESSING that the FED MTG on MAY 3rd may be turning points, but that is a whole week & 2 days away. What happens between now & then could be a whole host of things ( Gap fill? Run higher? etc) Tough call.
Thanks! Great perspective!! Still holding JBL and hoping for a break above 29.44 and a run..
yeah, you saw what TTWO did when it had a similar consolidation & break right? The set up is a good one.
Looks like it’s starting to go!
Before Fridays down day, you can see that it was just going higher slowly day by day ( 4 days in a row) , so hopefully you’ll get a move higher than just keeps trucking along 🙂
I hope so. I’m learning from you how to chart these moves intraday on the 15, 30, and 60 min. I think right now I’m getting a kind of symmetrical or ascending triangle, but not a descending one. so not sure what that means or even if I’m doing it correctly. Thoughts on the intraday?
I suspect that we will see a bottom around the time of the Fed mtg on 5/3.
JBL breaking out on the 15, 30 and 60 min.
Many of the energy stocks look like double bottom lows with big divergence in the MACD.
DNR & SWN for example. – compared to an uglier MACD like LPI.
Alex,
With this in mind…..do you think OAS did a shake out…..or should I Iook to exit with this strenght?
thx
I haven’t decided myself. Crazy oversold on the daily. If I didn’t own I’d take a shot here with a together stop.
If oil bottoms shortly, I’d hold OAS. If OAS just bounces but crude stays weak and “pre-ICL” I’d cut losses or sell breakeven.
OAS wants apiece of that 200 day…. giggle
hmm… copper looks interesting… Ken – do you have a count for Copper?
think it wants to go tickle 3 ?? ???
;o)
https://www.tradingview.com/x/gIWkJReB/
Maria, I’ve been watching copper also. Nice chart.
$3.00 copper will get all the Dr. Copper crowd revved up; the economies good, and rates need to rise, blah blah blah 😉
For whatever reason, I kind of expect silver to get pulled along should copper move, maybe with enough umppph to break 18.50 for real next time.
🙂
here’s a zoomed in view ….
https://www.tradingview.com/x/xJoAD5jr/
Looking Hawt!!
Chotfreak, what do you think of HOLX, I’ve been watching it, seems to be breaking out. Volume and TSI are good.
xbi/labu lookn interesting…..
Right, LABU looks to be moving higher off the lower trend line. TSI crossing higher.
https://www.tradingview.com/x/44BmL2Pc/
I’m in it to win it!
EPE .. hmm
It might just be my tin foil hat, but I’m beginning to think GDXJ has an investor confidence issue. Who would want to hold it with all of the background noise?
FCX, X, AKS all report tomorrow.