
April-1-2017 Weekend Report
Uh Oh! – What does “Don’t Shoot The Messenger” have to do with our weekend report? Read on and you’ll see that what I am seeing lately is not what many were hoping for in the Miners. We will discuss the implications in the Precious Metals section of this report. This is a rather huge weekend report, enjoy!
.
SPX – I was pointing out a rising bearish wedge a while ago and I said that it would have to break out to negate it as it approached the apex, or it would have bearish consequences. Well it did break higher and even back tested on the recent sell off…
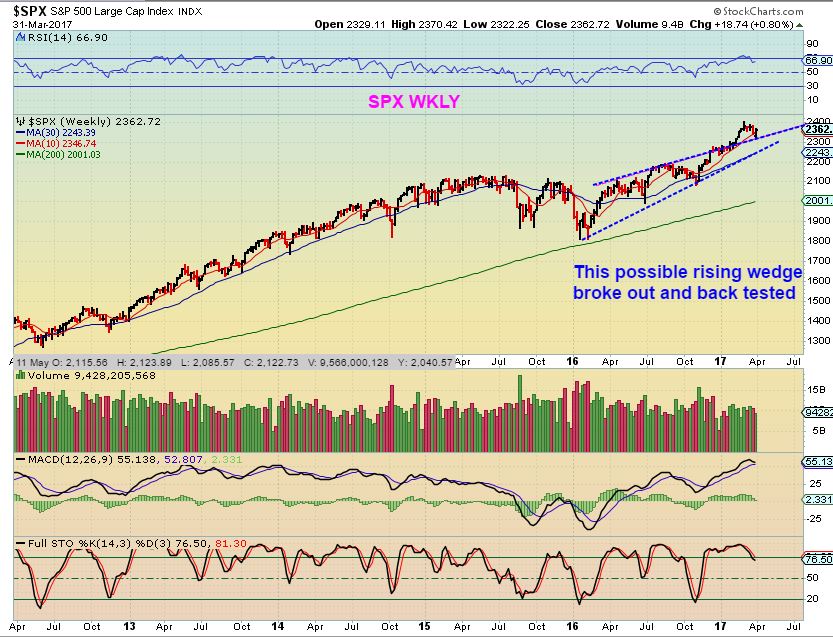
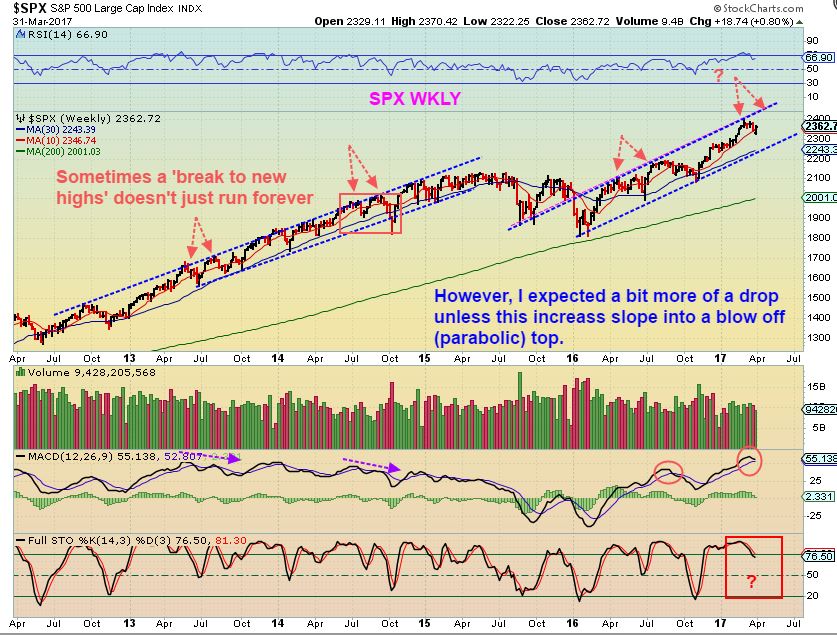
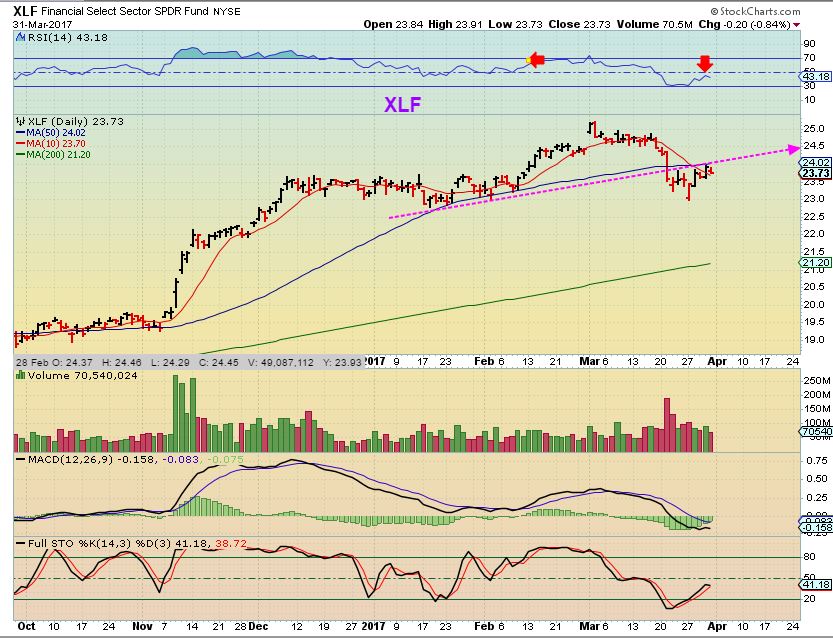
So a long position on that weekly back test was equivalent to buying the recent daily cycle low. So far, so good, but I have mentioned the importance of using stops because I am concerned with the Financials ( XLF, JPM, GS, BAC, etc etc ). So now I’m watching the SPX this way. I was expecting a drop to an ICL at the 30 weekly MA. We could still get that even if we break to new highs – look at my orange box & arrows. That BOX dropped into an ICL after a short break to new highs, thus trailing stops are helpful.
XLF – This is still not a recovery story to me (yet?).
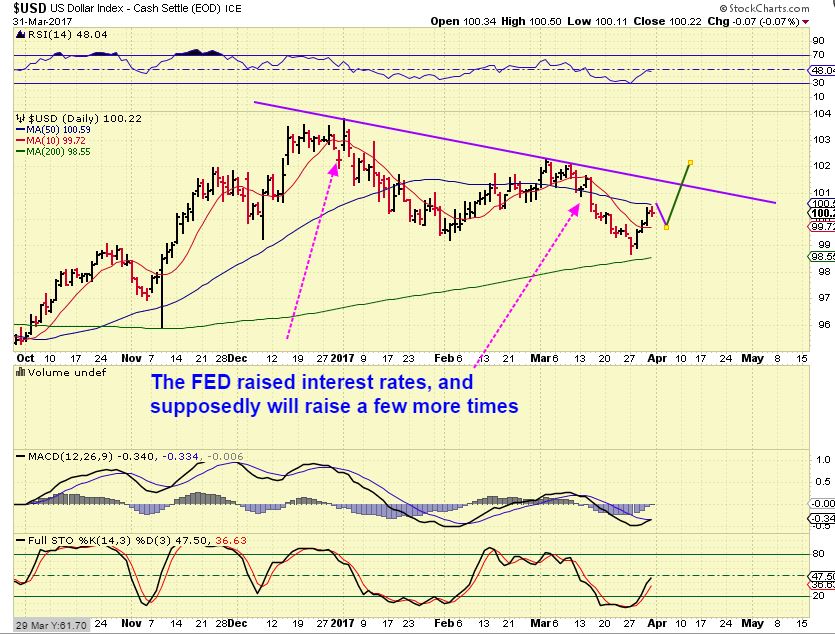
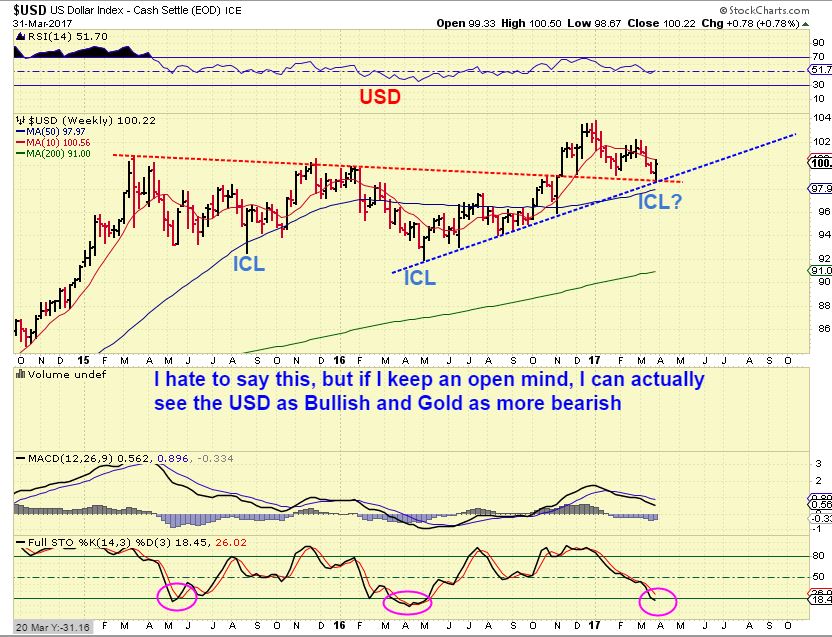
USD DAILY – We had a dcl and a strong move higher for 3 days. It paused at the 50sma, so if it drops to the 10sma to build strength for that break higher (let’s say Monday) , GOLD might bounce again to its 200sma.
DON’T SHOOT THE MESSENGER – When I just glance at this chart, I think to myself…
“Did the USD just make a much higher ICL and a normal ‘back test’ of the break out?” It didn’t break that trend line like an ICL usually does, but we haven’t broken that trend line in almost a year! We are due for an ICL, and there may have been another higher one in November too. This looks bullish. I will discuss this chart again with Gold.
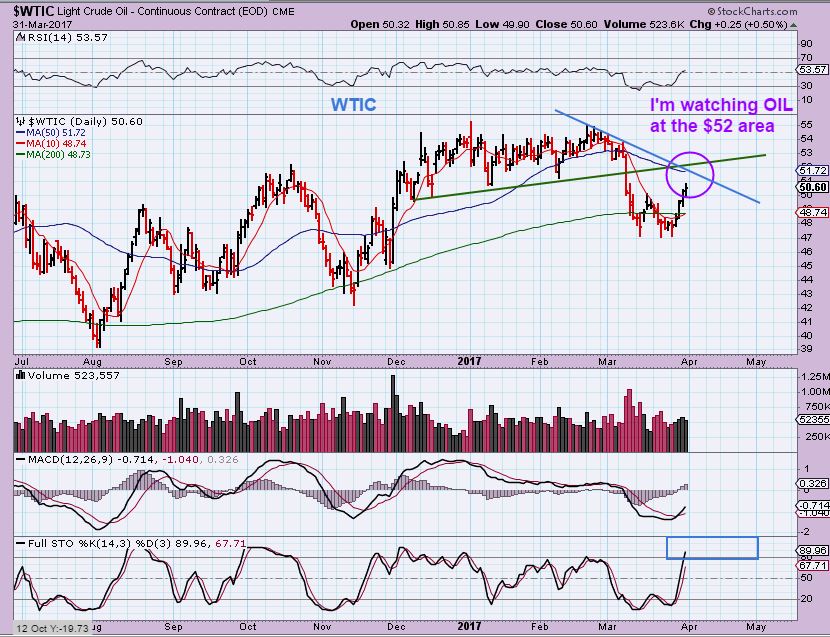
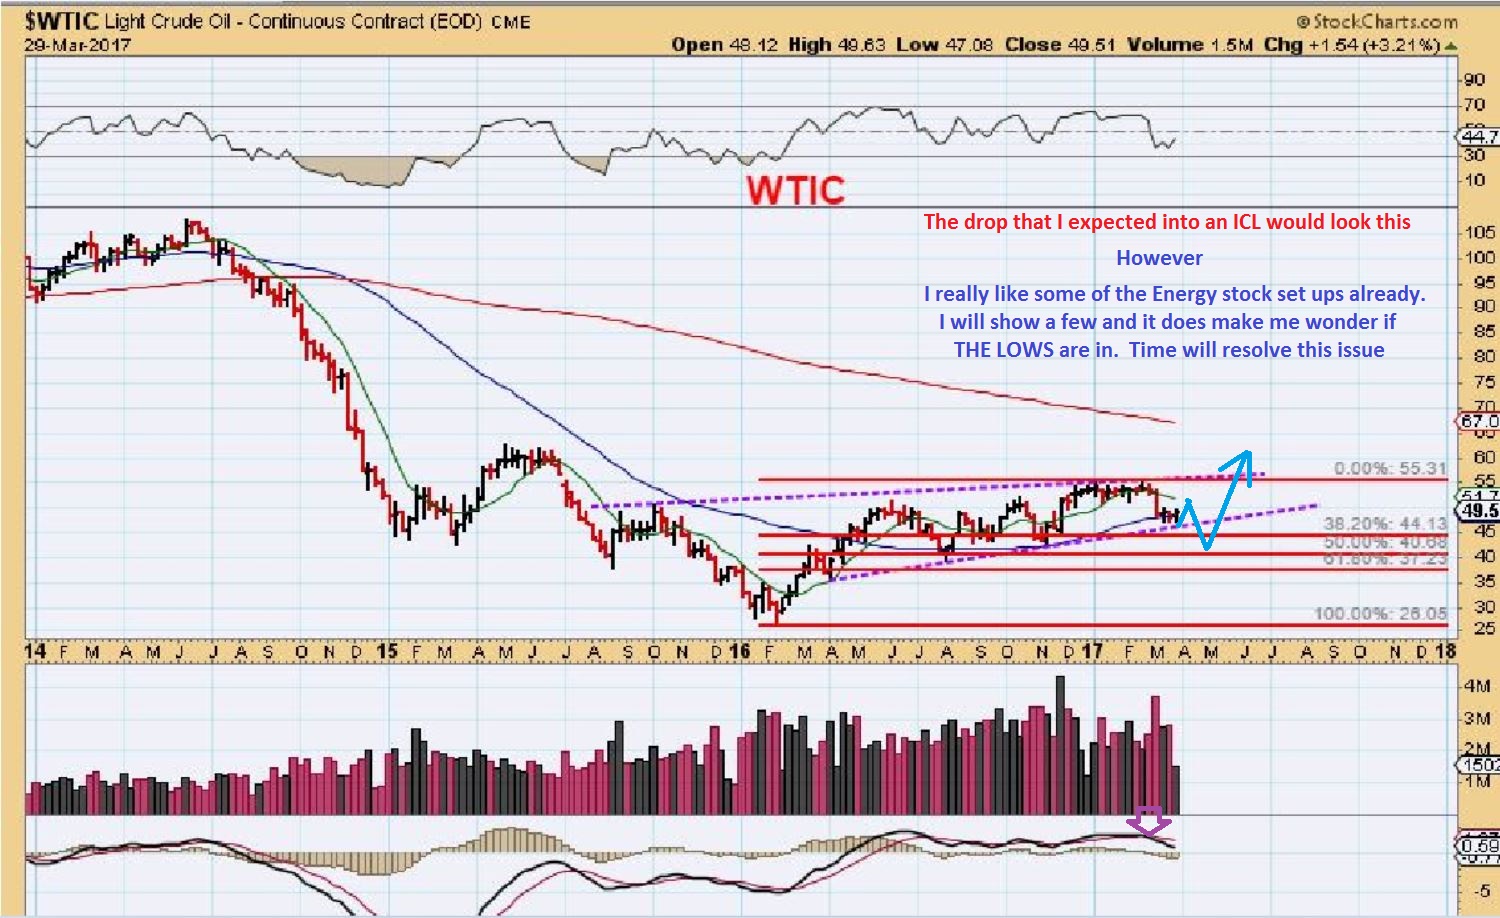
WTIC – I’ve been expecting a run up to this area and then 1 more drop. Some Energy stocks actually look very bullish and that does make me wonder if this double bottom was the final drop. I am long an energy play and will raise stops and play it out.
2 very separate thoughts here .
1. Oil didn’t even pull back 38% from the 2016 lows to the recent lows, and that is O.K., but if we get another dip I’ll be watching that area ( $43-$44) or the 50% area ( $40) for an ICL.
2. When I look at several ENERGY stocks, they look so bullishly set up, that I have to consider that THE LOWS could be in place. We are doing what we should do under these circumstances – we have taken some energy trades with caution and we will continue to watch how things play out. If THE LOWS are in, we ride it out. If it drops, we have profit and look for other entries at the next low. Read the chart.
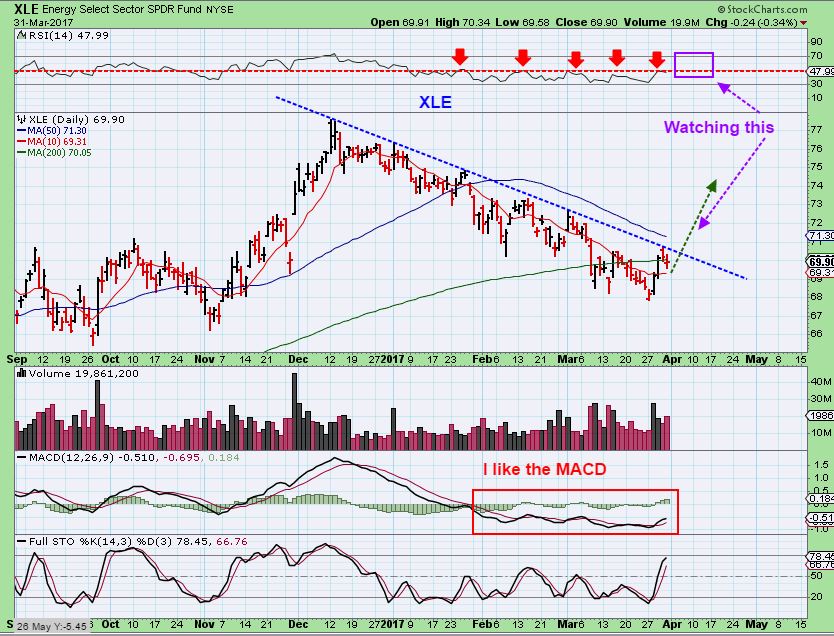
Let’s also examine the XLE with 3 charts
XLE – The XLE has been contained in a downtrend, so this could give us our next clue. Will it Break out or remain contained?  Stay tuned, this week may give us that answer.
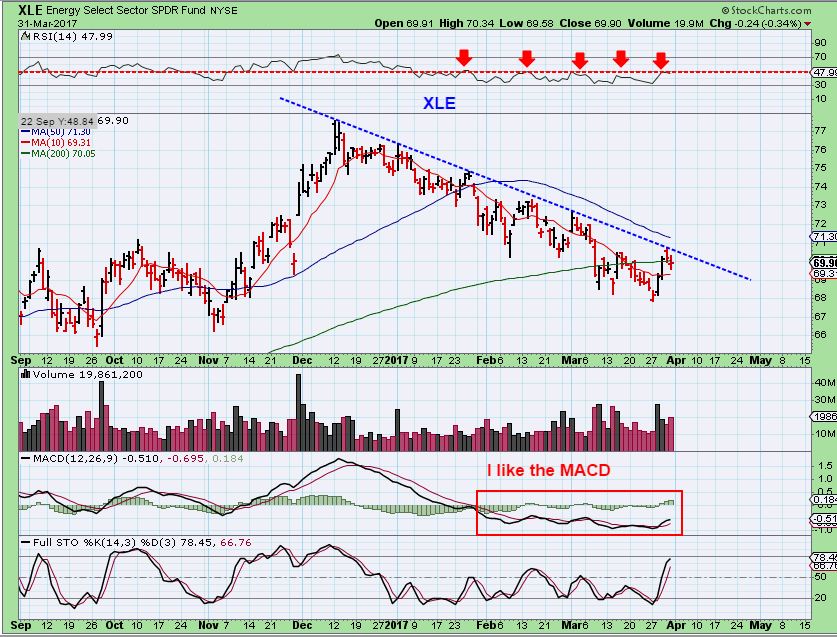
XLE – This would be a bullish expectation, and it will be a good sign that some of the Energy trades pointed out here recently could continue to perform well. I’m discussing Energy trades at the end of the report.
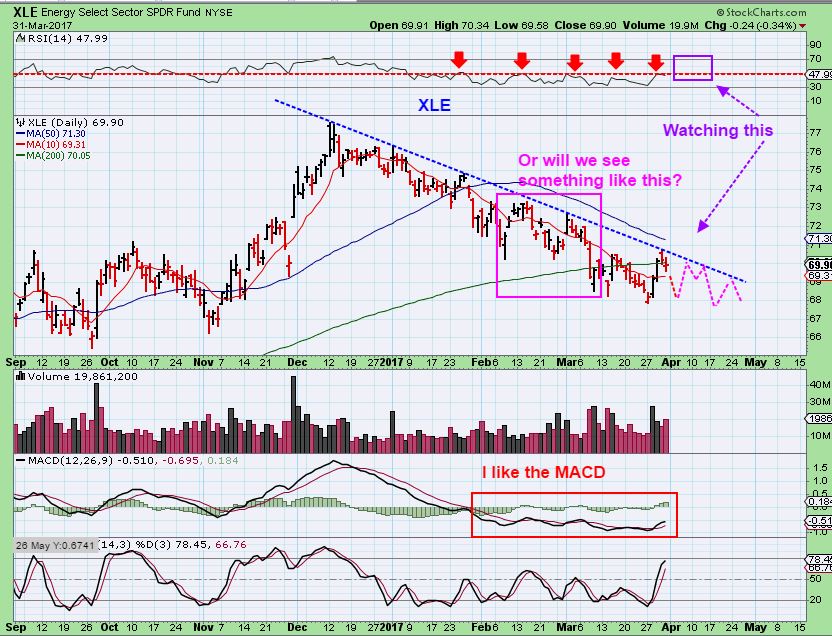
XLE – This is the ‘still contained’ scenario. So this is what I am watching for going forward.
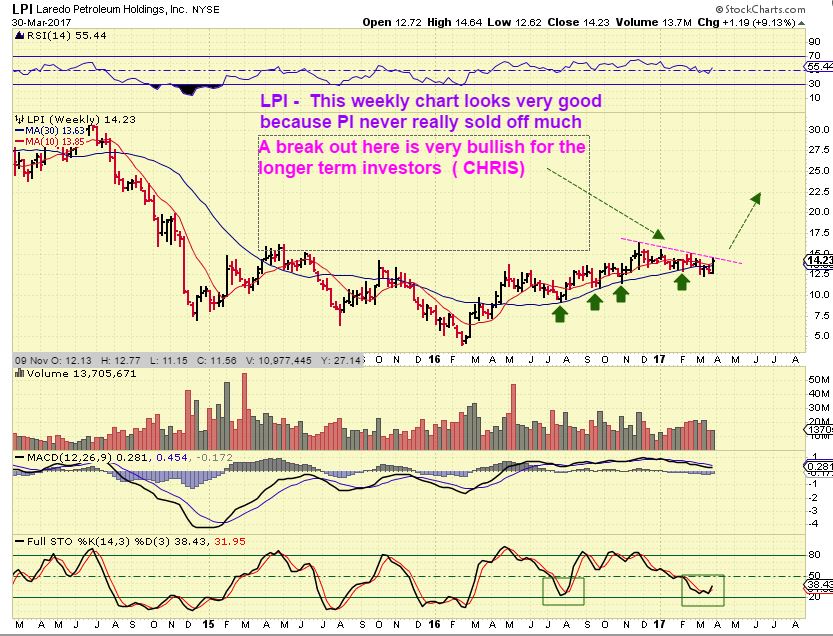
I mentioned that some of the ENERGY STOCKS that I looked at were very bullish looking. I thought to myself, ” Wow, these are really bullish and these could be great short term trades or even long term buy & hold candidates” (CHRIS, are you listening?) 🙂 So I will add one here and a few more at the end of the report.
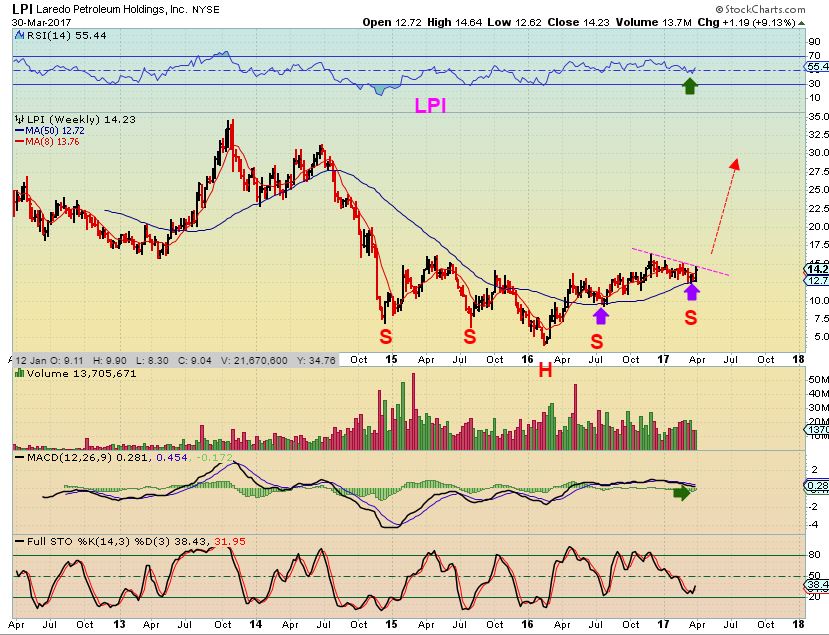
LPI – We traded this in early 2016 and after a strong run from roughly $4 to $13 and eventually almost $17, we have a HUGE BASE FORMATION. Typo on the chart where I wrote ‘PI’ should be ‘LPI’. This could be a nice 100% gainer over time. More on these energy set ups at the end of the report.
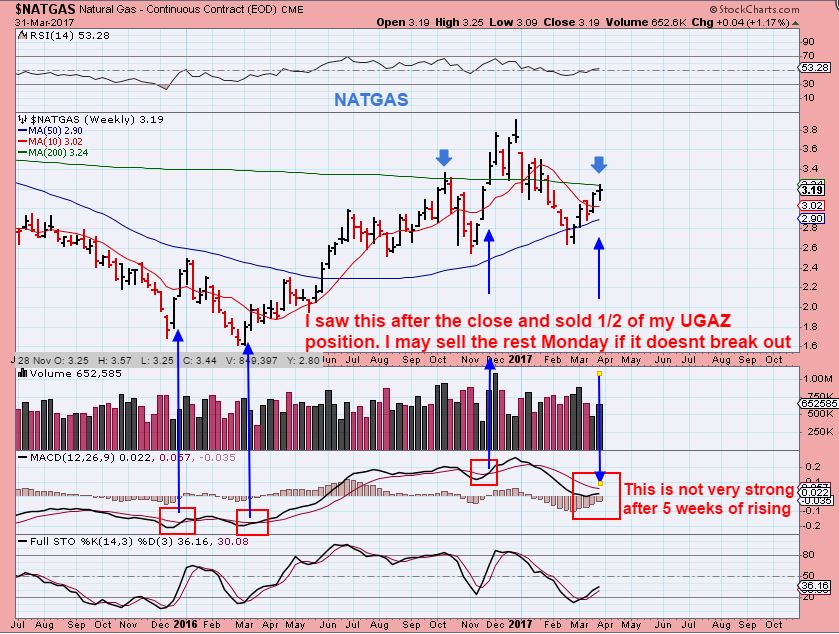
NATGAS – I thought that these runs higher out of an ICL looked similar. On the left hand side, it looks like it Popped & Dropped at this point. Maybe we are due for a drop into a dcl soon, and then a STRONG run higher. Look at the example of that 2nd run higher on the left of the chart from the GREEN ARROW. If NATGAS back tests that 50 & 200sma now, THAT might be the next buying opportunity for NATGAS , if you missed this one.
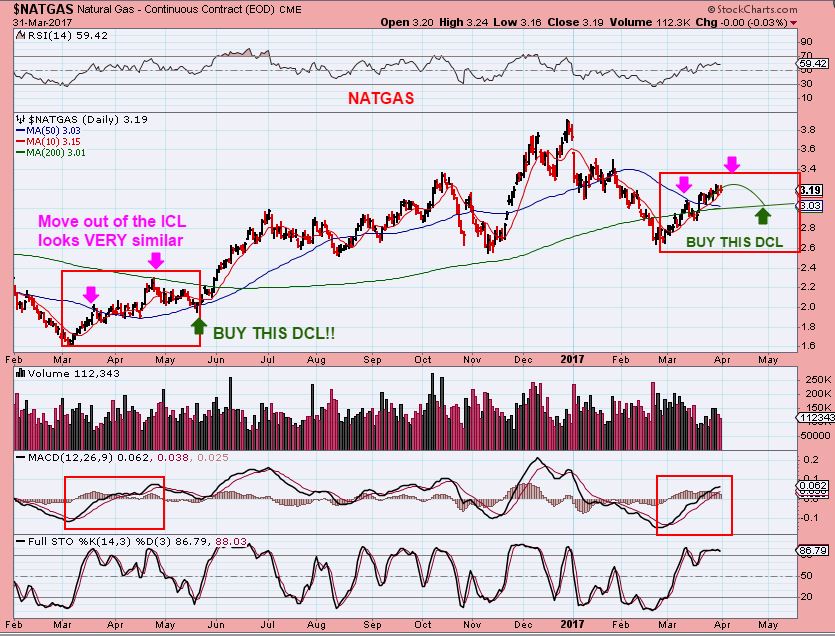
NATGAS WEEKLY –
So we may be nearing the time for NATGAS to drift down into a dcl and then I noticed this weekly chart AFTER HRS on Friday. I sold 1/2 of my UGAZ Friday after hours and might just exit the rest on Monday due to this weekly resistance & ‘timing’. I do not expect a big drop in NATGAS, but UGAZ can be a ‘ Take it while you can get it’ trade’.
.
GOLD, SILVER, & MINERS
.
To begin, I did a little extra research with Gold & what I found very much surprised me. It was semi bearish, but what I want to emphasis and will discuss is that in this Gold market, is that we have seen Gold go from Bull Market runs, to Bear market, then back to a Bull Run in 2016, and now? Well, that is what I will discuss. The point is, if I see a bear market type pattern now, it CAN change back to Bull market after it exhausts into an ICL, but it needs to be addressed. THAT is my job here.
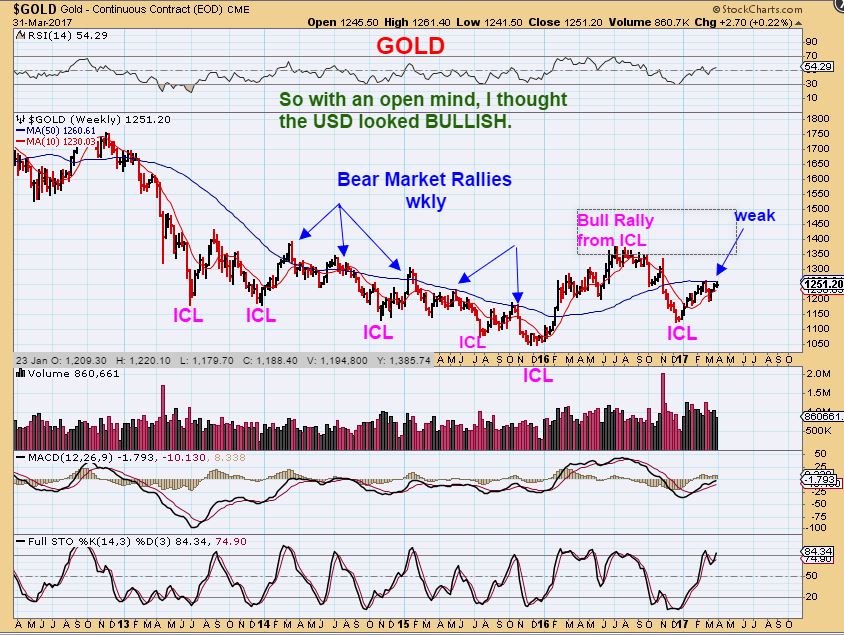
Let me start by re-posting this Bullish chart of the USD. If the USD is looking bullish, obviously Gold must be looking bearish?
Notice that the USD was making lower ICL’s and breaking down in 2015 & 2016, and GOLD bottomed in Dec 2015 and had a strong bull run in 2016. Now the USD may have had a higher ICL in November and another one right now. Also that’s a normal ‘back test’ of the break out ( Red line). We didn’t break the Blue trendline like I expect to in a drop to an ICL, but we are overdue, so that could be it. The USD now looks bullish.
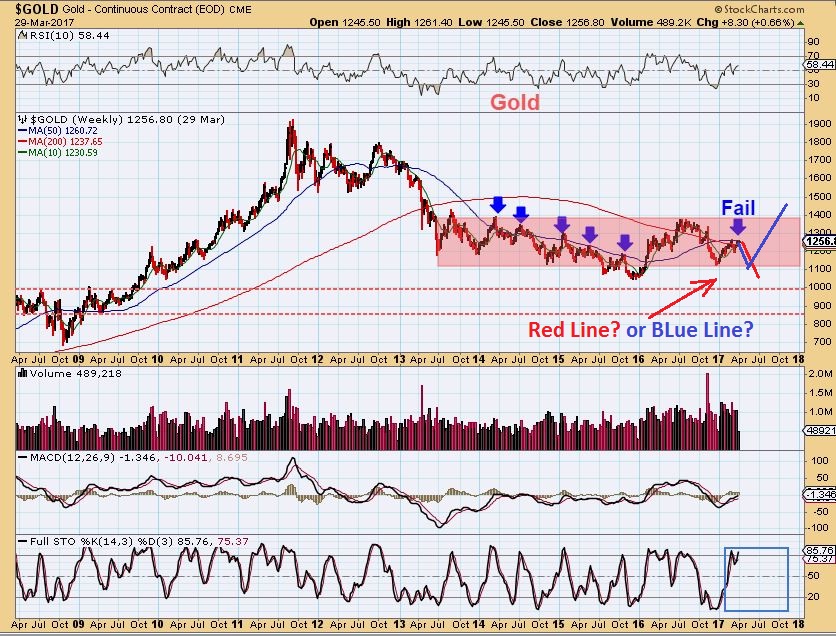
GOLD WEEKLY – I have mentioned in the past that it is rewarding to buy an ICL in Gold, because ‘EVEN IN A BEAR MARKET RALLY, THEY MAKE SOLID GAINS BEFORE FAILING”. In the chart below we see that in 2013, 2014, & 2015, bear market rallies had 2 strong daily cycles and then they fail. In 2016, THAT was a strong Bull market Rally out of an ICL.
Notice that each bear market rally out of an ICL failed around the 50weekly ma. The 2016 BULL RUN pattern blew right through it. This last rally has the footprint of a bear market rally after 2 daily cycles and we are 15 days into the 3rd daily cycle, still stuck under that 50wma. 🙁 Don’t shoot the messenger. What can I conclude if this doesn’t break out higher this week?
GOLD may be in a giant Basing Pattern. Bullish in the long run, bearish in the next daily cycle or two for sure. In my head I’m thinking that interest rate hikes are bad for the USD, good for Gold, and that Gold entered a new Bull Market in 2016, etc , but this set up is heading lower in my eyes.
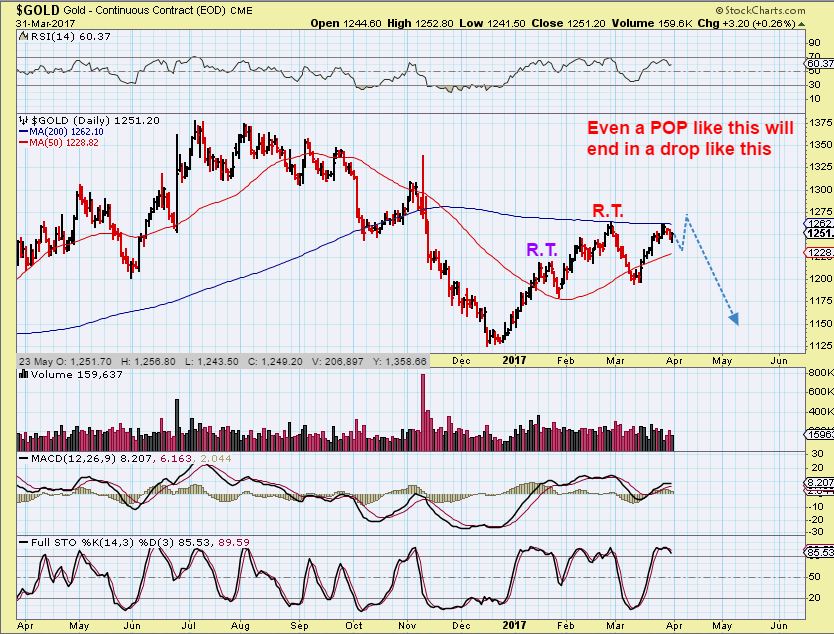
Even this LEAST LIKELY SCENARIO, one more pop, would lead to a solid drop this late in the 3rd daily cycle.
Let’s continue…
SILVER WEEKLY – I have been saying that Silver continues to look bullish, and it honestly does. A break out here would be very convincing, but the drop into the coming DCL would be a back test of the break out. My thinking is that Silver does not break out at this point though. Let me show you something…
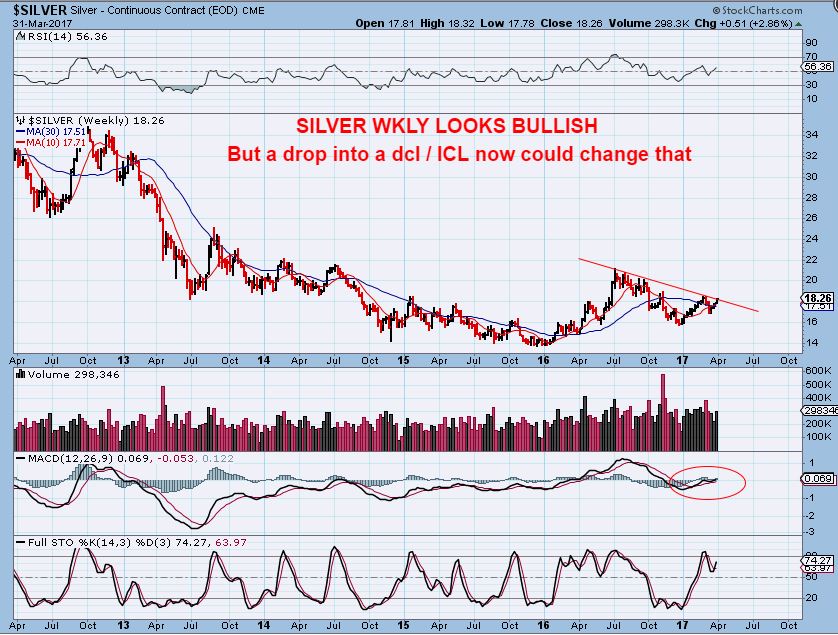
SILVER looks Bullish Right Now, RIGHT?
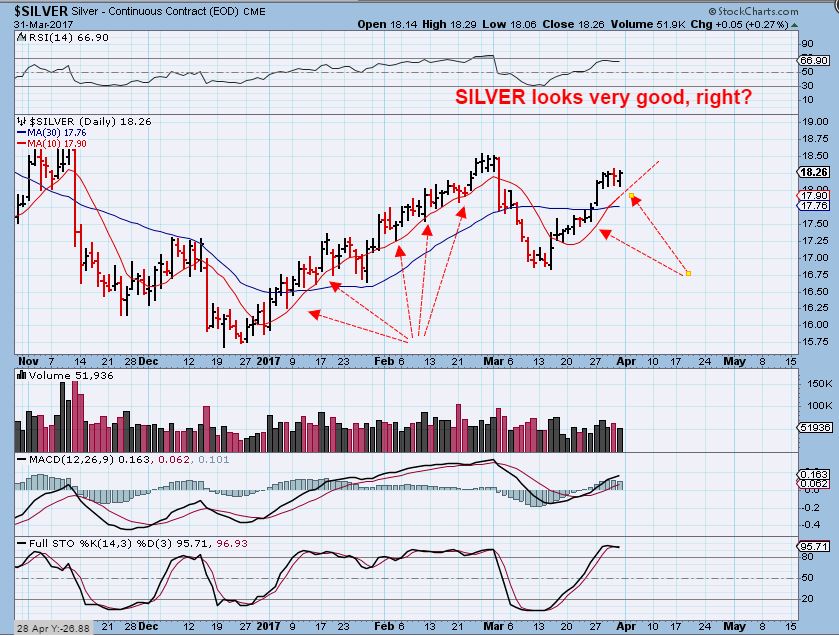
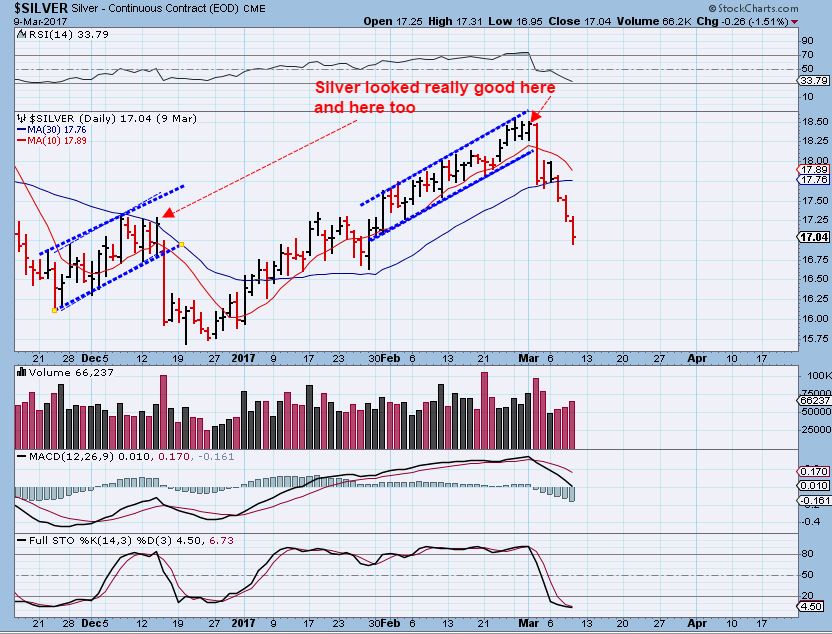
Look how rapidly that bullish posture can change with Silver.
In 1 day you can get slammed in Silver ( And leverage multiplies the damage).
LET’S LOOK AT MINERS
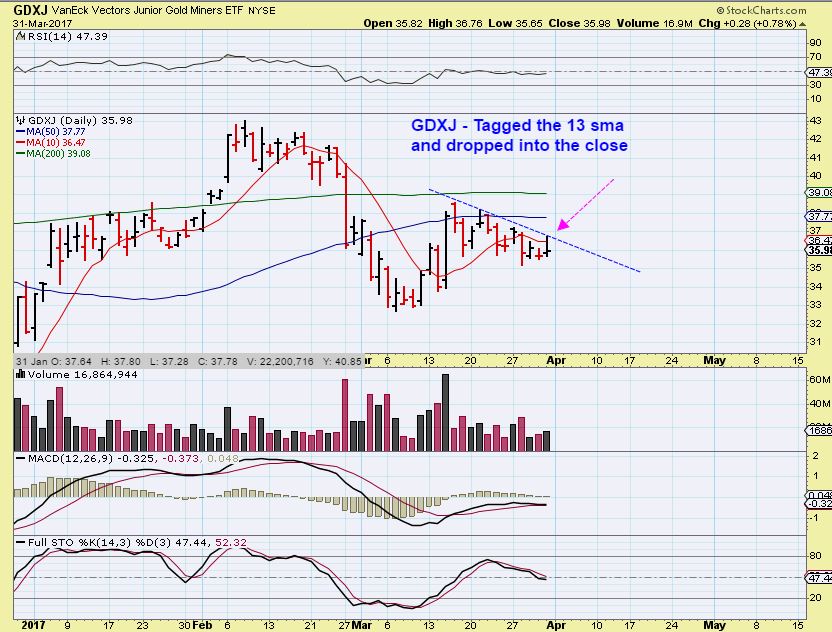
GDXJ – I posted this chart Friday in the comments section. Miners started to rally and that is when more people started to feel bullish & email me to change my thinking. “Is todays action changing your mind? Can I go long JNUG safely, I want to buy it now before the break out?” was the idea. Many thought that this is a bull flag and bullish consolidation. I want to add that it does look very bullish, and under other circumstances it could be, but with Gold on day 14 of a 3rd daily cycle, “Timing” becomes more important to me. Even a break out above the 50sma next week would roll over as a fake break out.
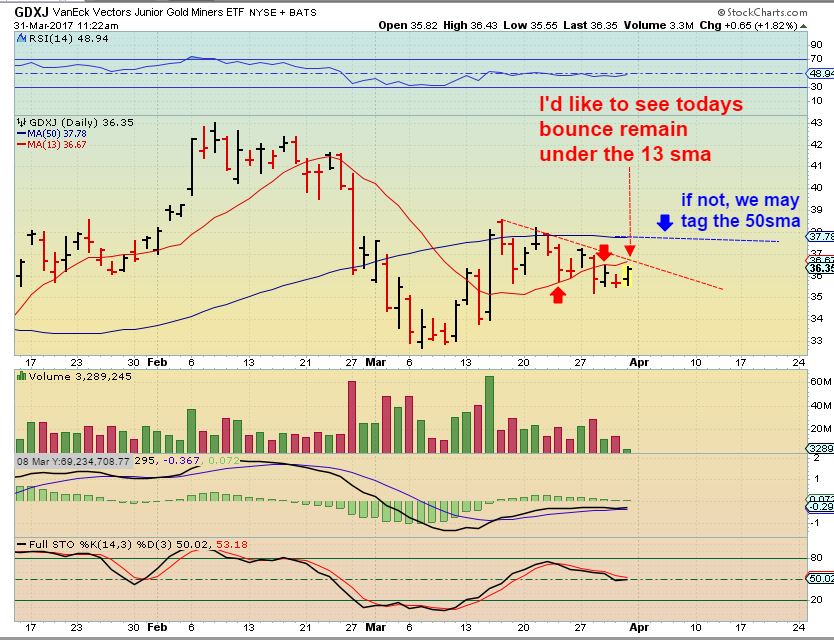
GDXJ SO GDXJ tagged that 13sma on Friday and sold off into the end of the day. Some still may say, “They just can’t get the selling going, everyone wants to own the Miners!” Lets examine that thought…
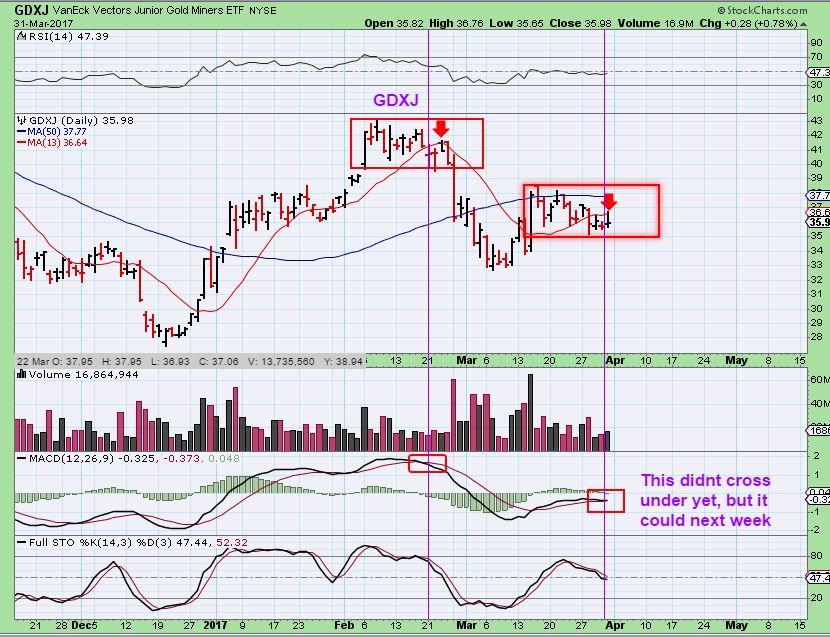
GDXJ – Last February GDXJ struggled at the 13 sma too …
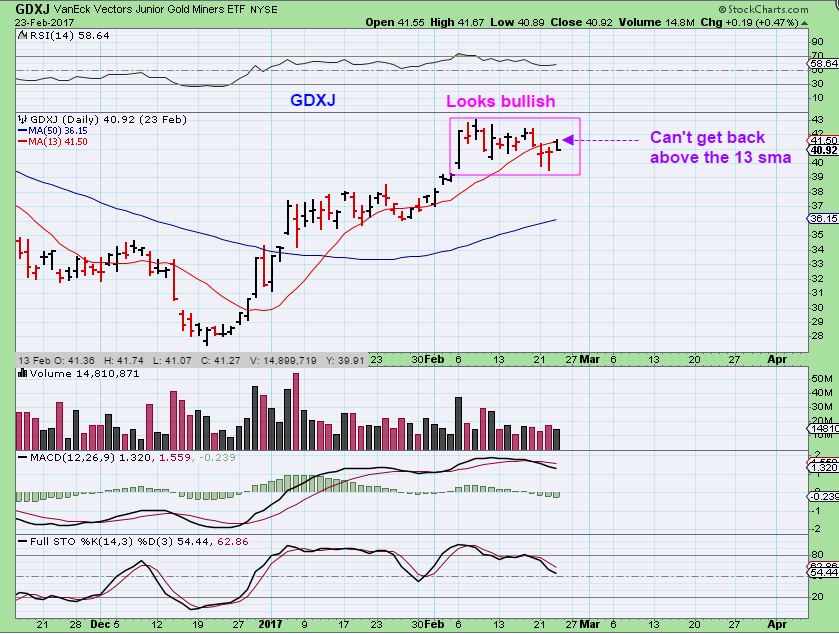
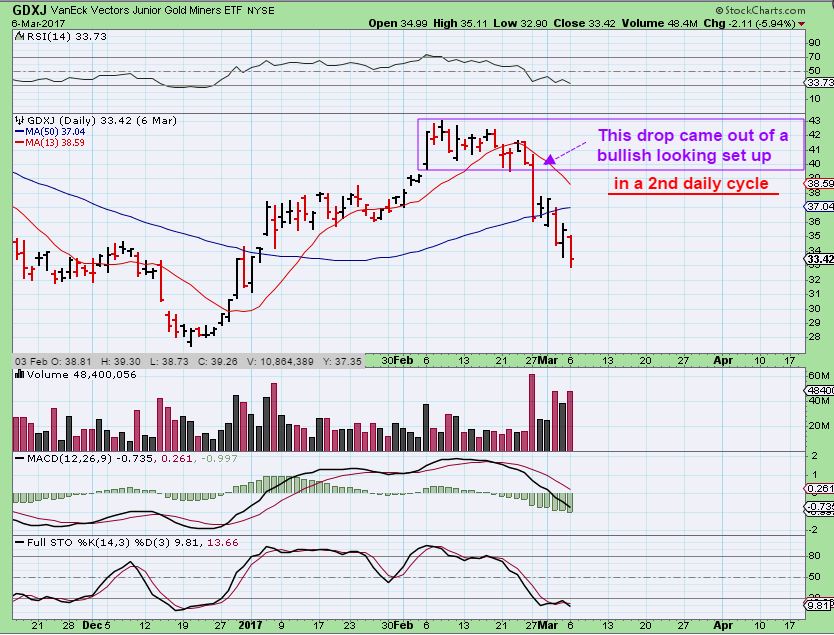
Now I want you to look at February and see how similar that looks to right now. Twins! I was bullish at that point, because it was only a 2nd daily cycle and should have popped. That Flash Crash Monday was only a month ago, but many have forgotten the suddenness of that swift slam already. Now we are in a 3rd daily cycle, so buyer beware.
How soon we forget that Feb drop that had us all hating what the miners can do to the downside.
IS THERE ANY GOOD NEWS?
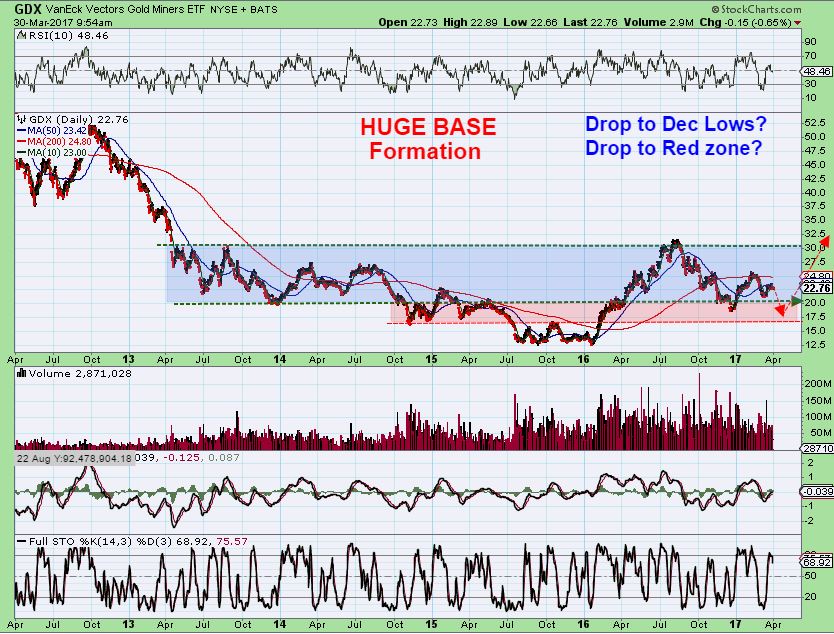
YES! I still see this as a giant Base in Gold, Silver, and the MINERS. There will be upside and downside, so we need to be prepared for what I feel will be the next drop into an ICL. At that point, we will LOAD UP LONG AND STRONG and make some great gains upside again too. The next run could be the end to this giant inverse H&S base  It could it be the ‘3’ of a giant 1-2-3-4-5?
SO the General Markets have put in a low, and so far it was higher than I was originally expecting. I have explained that if they are going to do a blow off top, it gets parabolic and the pull backs become more and more shallow. That said, I still do not like the XLF yet, and this could indicate that a deeper pull back into an ICL is still ahead. It’s OK to be long, but be ready to take profit or raise stops. Trailing stops may help. The USD put in a dcl, was it an ICL? It looks short term bullish, matching Golds timing for a drop. OIL is having a nice move higher, but I was expecting one more drop into the final lows there too. Several energy stocks actually look like they have put in some Longer term lows ( I will show a few more at the end of this report), so this MAY be THE LOWS for some energy plays. XLE has been charted here with both a bullish ‘break out’ or more neutral ‘contained scenario’ to guide you. NATGAS continues to act exactly as expected. I took a good size position in UGAZ at the ICL and added once too, so I sold 1/2 on Friday. See the NATGAS section for my thoughts going forward. It seems that the best may be yet to come there in the next run higher. GOLD , SILVER, & MINERS. Huge Bases and inside of a base you get strong moves higher and the drops are to be expected too. We had a nice run from Dec to MArch in Gold, now I am expecting the drop soon. Many of our trade set ups are working out again, and we will continue to stalk the markets for good set ups , as long as the market sectors remain bullishly set up. Enjoy the rest of your weekend and thanks for being a Chartfreak with me!
.
~ALEX
.
TRADES – Let’s start with the energy Stocks that I said look very bullish. They are weekly charts and show that after the very strong run higher that we enjoyed last year, consolidation has lead us to some nice weekly set ups.
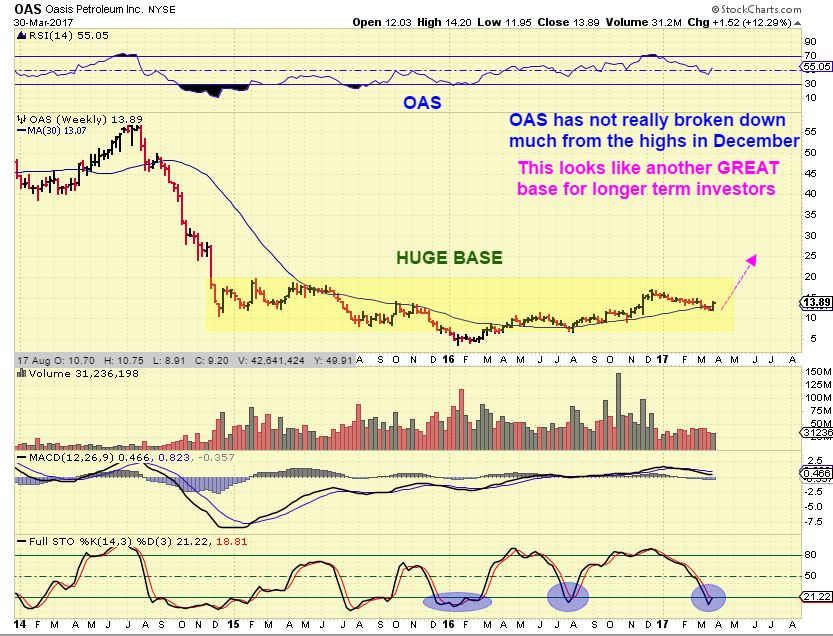
OAS – We made some very nice trades in OAS last spring, and now this huge base looks ready to roll. If OIL does sell off again, I do not think many of these set ups will have to break the lows, that’s how good this looks longer term.
LPI WEEKLY – This could double or triple over time , once it gets going.
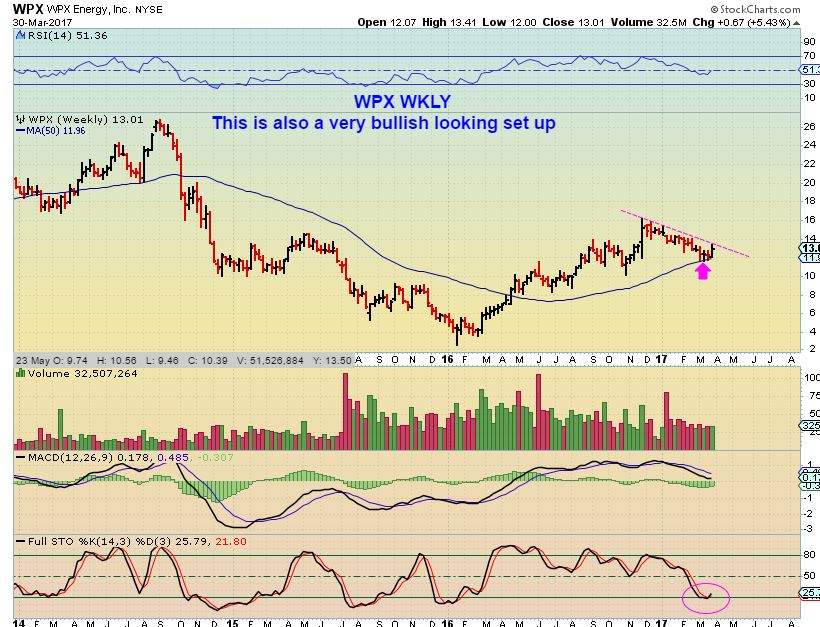
WPX – Another energy stock that we traded well last spring. This went roughly from $2 to $13 & eventually $16. Even with all of the selling in Energy recently, OAS is only at $13. It is a stronger stock.
SWN WEEKLY – So this one could drop if this wedge is not finished setting up. I wanted to point out the upside if it does just continue higher though. We just bought this in the $7’s and it could easily run to 2016 highs ( 100%).
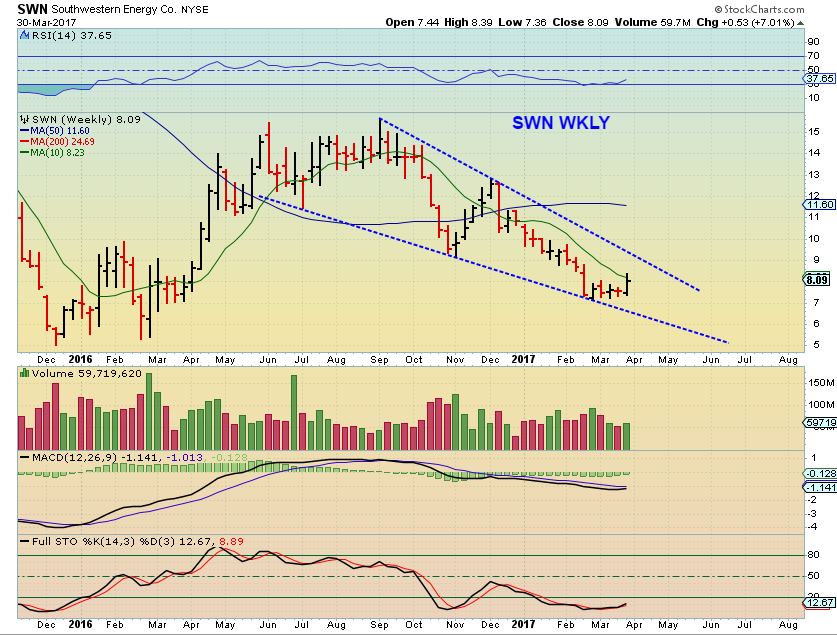
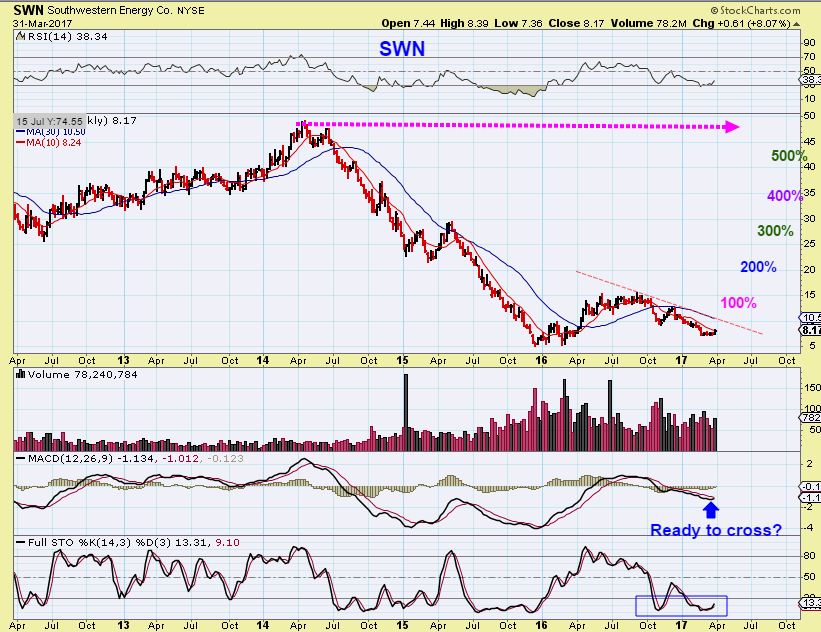
SWN WKLY BIG PICTURE – For those longer term BUY & HOLD investors, this could be considered a ‘higher low’ and a bullish entry when it finally gets back above the 10 weekly MA.
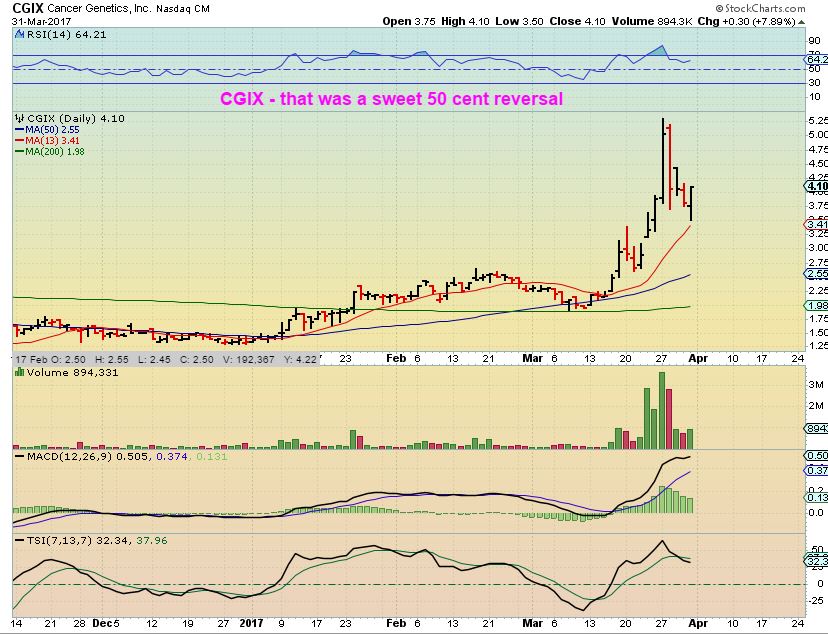
CGIX – This had a crazy day. It dropped to $3.50 and then reversed at the 13 sma and closed up 8%. That was a 50 cents swing on a $3 stock. Wow. In Fridays report I mentioned that I restarted a position near $3.90 and I added on Fridays dip, but I was a bit nervous too .
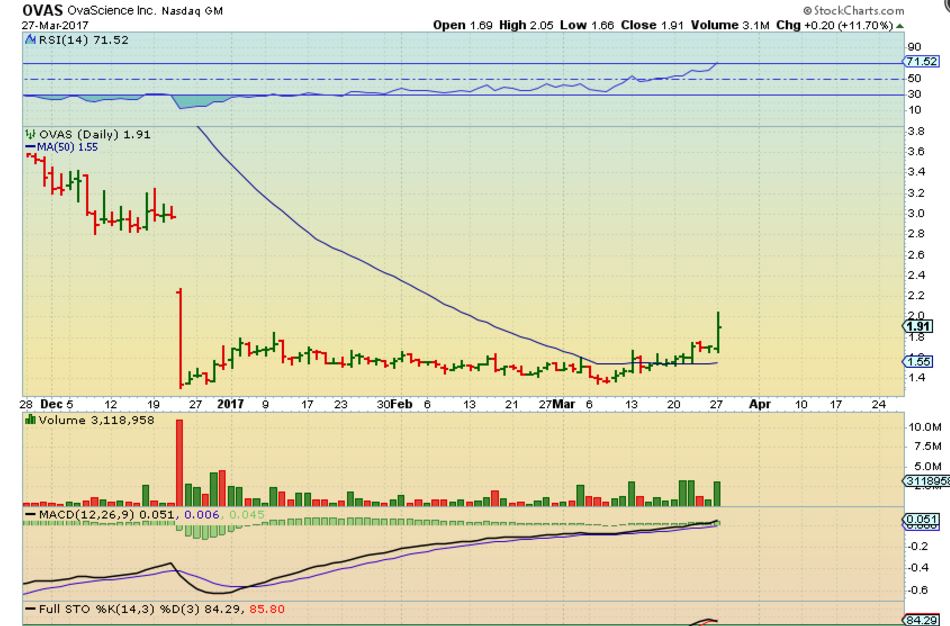
OVAS – This may be worth repeating too. I liked the base when Baytrader pointed out this stock.
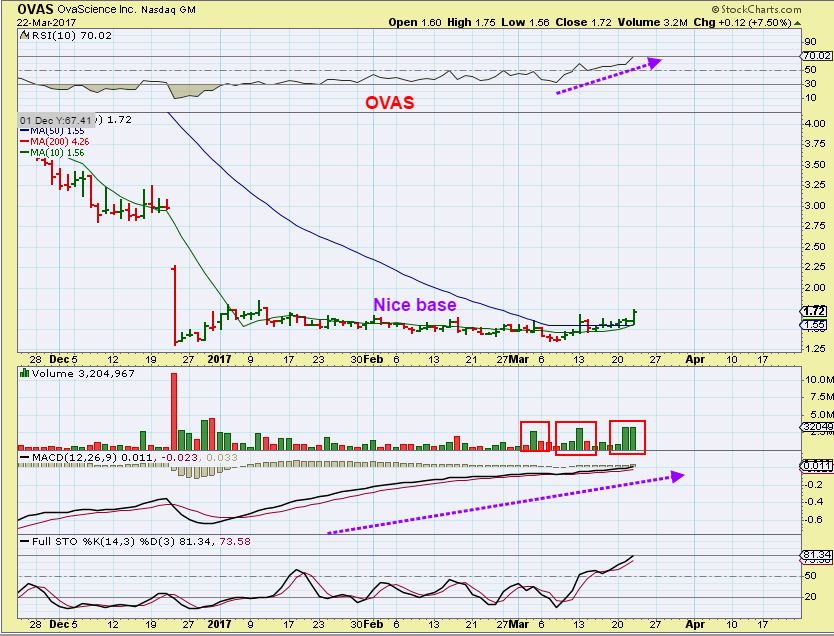
NICE POP & to me it is also a confirming sign of strength.
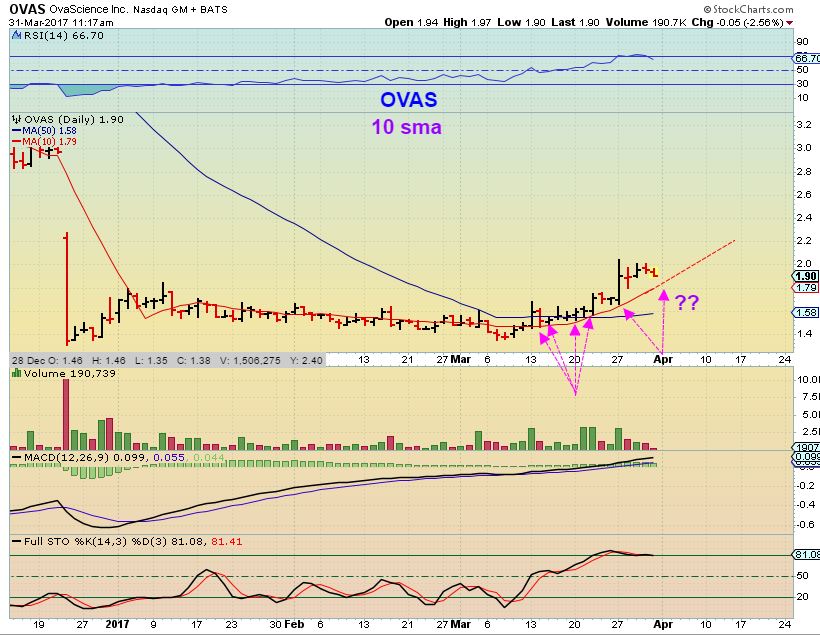
OVAS – Thinking that it could be a bull flag, I posted this follow up chart, and it could drop to a moving average.
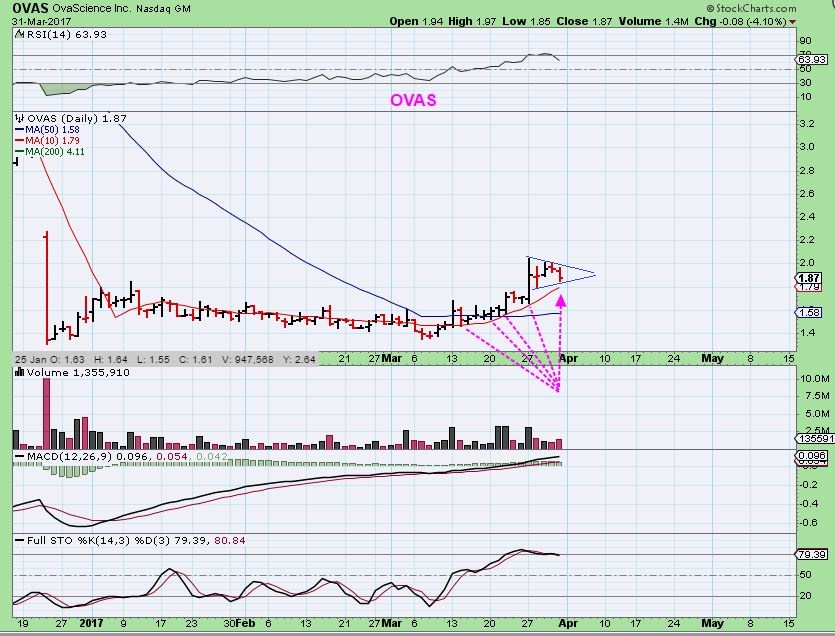
OVAS – This was the close on Friday, so I still own it and added a bit more. These BIOTECH stocks get risky, so I don’t want to get Tooo heavy, but I do try to add on a dip and sell some on a pop.


Great report Alex! Thanks so much!!
Thanks Alex appreciate your work as always
This report is a beauty, Alex – a ton of work, i’m sure.
https://uploads.disquscdn.com/images/1c3e2bb9462fdc52cae6744af3a138d952756c25d86882db0e5365919f311dfb.jpg
I can still hear them screaming… BOBBY ORR – SHOOT – SCORE!!!!!!!!!!!!!!!!!! 🙂
I’m seeing quite a bit of bullishness for Miners in Twitterville – refresh for an example.
People are talking about loading up on Silver & MIners, so it makes it tough to be so cautious when many others are bullish, and if Gold makes one quick final pop, it’ll be really tough, but we are in the 3rd daily cycle – so timing calls for a dip soon.
https://uploads.disquscdn.com/images/1431140237cefb09d40f8e878d02e66e182e56fb0a8d162a090f8cface8cab27.jpg
Just try and remember that if you were here last year, we got our ICL at the end of MAY. That doesnt really match this seasonality chart either.
Alex- other than the usual perma bulls I see the blogosphere cautious for the most part and expecting weaker miners.. I am and have been waiting Bc as u know that 2nd daily cycle to me failed in miners as it never made a higher high so that leaves me very negative so I am flat. What concerns me is everyone seems to feel similarly that miners are due for another beating and I don’t want to miss the next move higher if we see one.
That is not what I am seeing- I see plenty of bulls posting stuff like this Refresh.
I see a lot of bullish tweets for Silver & miners breaking out & seasonality is bullish . ( NOT MY THINKING, I’m just saying what I am seeing)
I dont know what to tell you when you say ” I dont want to miss another run higher if we see one”.
Buy & use a stop if you see one? There is a chance that GOLD put in 2 r.t. daily cycle, the 3rd could POP to a new high, but Miners had a L.T. 2nd daily, I dont see them running anywhere above the 50 or 200sma before rolling over.
https://uploads.disquscdn.com/images/f27372693189fee7fcba5b8d5a9090cf56a8a5e583690c3817ff2b41bfd962bf.jpg
https://uploads.disquscdn.com/images/38189cf3bed3fa40295224ba21f58cbb2df6a1865a7d43e1396d8de344cbe3b2.jpg
Solid report!
I think silver and the mining share price action will make it difficult to be long when the time is right. By the end of April/ early May, I wonder if the triangle chart above will be pushing on or have broken the lower trend line and the broader commentary be for retest of dec 2015 lows…that would mark a heck of an ICL and make it very challenging to go long.
Thx Glenn,
Could be, about that triangle & Dec lows.
The ICL is so hard to buy, and often I am a tad early and get stopped out too, because I am always eager to buy the hated set ups as a contrarian.
Then the run up & out of an ICL makes up for every mistake on the early side : ) I have tried to develop indicators that allow me to be more patient & wait for THE LOWS, but those ICL can get so heated to the downside….tricky ( & extremely rewarding, even if you dont catch THE LOWS).
Likewise, a lot of Twiter is saying gold ready to move higher, 1/2 cycle low in place, etc.
Alex, awesome report, as always. And no doubt a huge amount of work. Sometimes “thanks ” doesn’t get it.
Wondering, though if there might be a typo worth correcting. Between two USD charts, you said “Did gold just make a much higher ICL and a normal bactest Of the breakout?” I am wondering whether you meant to say “Did USD just make a much higher ICL ….”.
Again, great report.
Thanks J Lo – And I saw that typo and even fixed it, but I think I forgot to ‘save’ the change – so I’ll have to go back & do it right.
Yes, that was a typo- thanks. 🙂
Both my newsletters somewhat predicting an outlier event like a stock market bubble has me thinking it is highly unlikely. We will have to see, but I am not betting on it.
The hard part is that even though they show up very clearly in hindsight, they are very hard to predict until you are already running parabolic. The constant shallow pullbacks seem like a very bullish scenario and everywhere you’d hear that the “buy the dipd crowd and the plunge protection team will never let this market drop”. Then it does crash one day . ( I rode both the GOLD & SILVER runs higher. In hindsight it is easy to see that parabolic blow off top, but real time it just feels so right : )
Thank you for such a great look under the hood. Very comprehensive with a clear directive in the major markets. I can better appreciate where we are with the help of your cycle analysis. It helps me to understand the reason for the cautious/bearish stance with the metals which complements your TA…Alex. Just so we all know to whom this comment is directed. (I assume we can all dispense with the jokes on TA)
And by the way…your humility which shines through in your writings including your comments is very much appreciated. Sharp and humble are really rare and underrated qualities these days. Just wanted to say….
I can’t reply to this or I’ll ruin it – lol, but Thanks 🙂
Thanks Mark 🙂
At this point I wish we could just get the selling side moving on the precious metals and trade long again,
but as various versions of the saying goes, “Patience is a bitter fruit with a sweet aftertaste’.
The sell offs can be bitter
So NATGAS is higher this morning, UGAZ is up 60 cents at this point, and I MIGHT want to sell the rest of my position and wait for a pull back to get back in.
The trouble is that at times NATGAS can just take off straight upward and run away. If I sell and that happens, that is the end of my NATGAS trade.
Decisions, Decisions.
Hi Alex,
Can you let us know when you sell….just continues to sell off after your post….
thx
I sold in premarket based on my feeling in the above report ( Wkly chart)
It doesn’t mean that this is going to be a big drop, I was just doing a comparison and saw that it dipped to a dcl, and then a strong rally.
If you look at the chart in the report, the one on the left just POPPED before it dropped, but I sold Friday because of that weekly chart & resistance overhead, and the same in pre market
I sold my position on Friday……FWIW
It’s a funny lesson for me , UGAZ ran from $13.99 to $22.01
I only caught roughly $16 to $20+ and feel like I missed a great trade,
But realistically $16 to $20 in a few weeks should be considered a good trade, its that whole perspective thing about not buying the exact low and not selling the exact top.
Human nature. It was a good trade.
Yes, Human nature. And then after a trade works out, one always wishes that they went in twice as heavily : )
Im thinking that about JDST right now.
I think GDX & GDXJ might make a pop to the 50sma again on a daily chart….see above post on intraday bull flag possibility
LOL…this happens to you too!? I thought you would be immune by now….not really…can’t escape that human nature thing!
CGIX starting out higher again
Alex- how low did you expect Ovas to drop to?
I dont know- I didnt really expect it to drop
Honor stops if you have one
REFRESH – You can look at it this way (daily chart) , or watch the 13 sma, or 20.
I have to watch a sell off and read it in real time, I dont want to just guess. If I have a stop though, that comes first.
https://uploads.disquscdn.com/images/651a8e1bad37eeb1dfae5a863499a7fc774ab3dc7d43e3ae866e4d7021a09408.jpg
REFRESH – 13 sma
https://uploads.disquscdn.com/images/c51a59e8b6fb078516e9c84553c99cb80e204b8f4efb9e6ded2dbd44697d8f71.jpg
OVAS was riding that 10sma nicely, but broke through it today. That also breaks the lower line of the bull flag : (
I’m still in it for now- I like the weekly chart and it didnt violate my buy point
Don’t know what to make of this action in OVAS? Feels like CGIX last week. Still holding?
CGIX did do something very similar when it dipped to the 13 sma and then reversed into the close.
Alex, what do you think of IMLFF chart? thanks in advance!
I’m in in Tammie- first marijuana stock I’ve had that’s been working : )
Yeah, this is the only one I’ve had working for several weeks now I think……I’ve bailed on most all others…EDXC I have and CNBX (which is at a loss….)….
I still have 4, all at a loss. Poo
I had OWCP and finally bailed with big loss….I couldn’t stand seeing it in my account….once upon a time I had made money with that …..sold for profit, bought again, and the 2nd time overstayed my welcome….jumped in and out of several too many times….overall I’ve still made some money on the marijuanas…just stayed too long in some…
I came on board too late. I have EDXC,MCOA,AGTK,GBLX. Did well with CNBX.
EDXC is about run ; – )
LOL…that is the one I will probably just keep as a longer term lotto ticket. Or at least some of it. Sure would like to see a giraffe neck about now!
EDXC as I see it, and the weekly is even better .
It consolidates and puts in a base ( Boring , right?), sellers leave, buyers accumulate.
Then a ramp up when sellers are all gone and buyers push it higher.
Overall, higher lows, higher highs
Refresh
https://uploads.disquscdn.com/images/a52ad467fb91d07cb7d8b4138d1701e3204ca46e56f06acb3b3edbf0a80ed4d1.jpg
Thanks for the chart! I like it…am about ready for the boring part to be over.
Me Too – but these never care what we want anyway : )
It’s a very nice chart , but it is in the middle ( or possibly even at the end) of a move higher.
If I owned it I would hold it in case it breaks out & runs, but I have no recommendation for a stock in the middle of a move, because it can pull back quickly too.
CNBX had good report today on it’s cancer trials – sent it up for now –
MACK is starting to run
Interesting how gold rallied when stocks pulled back. I am expecting stocks to break down and this may be a tell that gold will be taking off simultaneously.
So you are expecting a break out and run higher in MIners?
I find it more difficult to predict what miners will do, but I believe so.
If the general market goes down , I vote for the jnug going down too.
Thx,
I do think that we are going to get a strong run this year, I’m personally thinking that after we reach MAY, a LOW is in place and a strong run higher.
We’ve had one interest rate hike & That was that big strong UP day in GDX & GDXJ, then it kind of fizzled.
My thinking is that possibly around the MAY FED MTG, we reach an ICL and they do a 2nd hike that really starts things rolling ( ANd that may kill the markets too, we’ll have to wait & see).
I’m neutral on miners for the time being, long term bullish and looking to buy heavy this month or next into any sharp pullback.
That should pay off very well in my humble opinion.
If I were daytrading JNUG, I’d see a Definite BULL FLAG on GDXJ
Refresh- 2 charts – prob going to test that 50 sma again
https://uploads.disquscdn.com/images/94d161343770014191c1ff80655cce86e35a03a425ec1dc4955e5189807bd57c.jpg
https://uploads.disquscdn.com/images/cb987ffebc093acbfb0d6268aa3a20ea4ad69a1e03b79b3dd163ebe8a31038b5.jpg
Gold is up at $1253, and I can see it running to the 200 sma again this week.
GDXJ chart- REFRESH –
It does look like it wants to go higher, with a bullish looking set up,
but ‘timing-wise’ I cannot buy thinking that we get a strong run higher from here.
Using smaller time frames ( 15 minute, 30 minute, etc , I can see day trades, but I’m not taking those right now).
https://uploads.disquscdn.com/images/14419216774330035048712a62490bdee8a795ab11d7410e997572a4e590c8f8.jpg
This chart puts things into perspective. Nice.
Sorry I have lost track here. Alex you still in JSDT?
I need to stop thinking out loud 🙂
Nothing has changed from what I have been saying, I was just showing day trader views – short term moves, how to predict them, and even trade them short term, while keeping the bigger picture in view.
In other words, this small bull flag could encourage a JNUG trade , until GDX GDXJ full fills the target price of a flag, or GDX tags the 50sma. A Scalp trade.
Sorry for the confusion.
im playing the bounce.. i was thinking 7-7.30ish…. u?
lol .. sorry that was for jnug
It should if the flag breaks and stays legit
( What is meant by not staying legit? You know those false breaks called “throw overs”. That would be if it broke the flag, but didnt stay legit).
yes.. that’s my rational .. that this is a “4” .. throw over
And Miners do not look genuinely strong, they look weak when it comes to conviction
yes.. i figured just for cashflow – id take it – and HEY .. if it turns out im wrong.. it’s a win win ;o) im locked and loaded… lol
OVAS is only down 4 cents now. Thats slightly encouraging, it was down 11 cents earlier
Alex, thoughts on SWN?
Ooh,sorry, I didnt see that, I got out on a tag of the 50sma and was going to re-buy on a drop to the 10sma or a further break out higher.
At this point, I dont know what it is doing, but I would draw a trend line along that bottom and stop out if it went below there ( Or just sell and re-enter if it stabilizes later).
alex, you watching MACK?
I’m in it , so yes I am : )
just wondering if we saw a half cycle low and now a bounce for 3-5 days…gold stopping at 200 dma or throw over to 1280 pivot?….either way the next drop I am playing short expecting a lower low…..we’ll see.
Hi Alex. Way, way behind with things this weekend and have only just got to your weekend report. Not sure if I am the CHRIS you were referring to in the report but regardless, thanks for the ‘heads up’ and they are now firmly at the top of my watch lists for a closer look. Much appreciated. And waiting patiently on that anticipated ICL in PM miners (early May?) to really load up again! 🙂 🙂
You are the Chris : )
When I see long term charts acting correctly, I always think of the investor that is looking for maybe Higher lows after a run up and a pull back. A long term chart with an entry setting up for another move higher. Then you probably have your own entry idea ( like a weekly 10ma? Or 22,44,66 mas daily? or 50 sma daily? Etc)
Those energy charts have performed very well in 2016, and then the deep corrections ( normal to a long term investor) usually offer a nice entry if they prove themselves on the pullback. Again, I’m not sure of your entry method at this point, but they have done a nice solid run out of the lows and the pull back to the 10 & 30 MA is one of the things that I look for in weekly charts!
And YES, ICL likely in MAY : )
so Cheers!
Very much appreciated and much more what I look for. Just had a quick glance at LPI and they have had a great looking minor x2 bottom on my 3 long term EMA’s which have clustered and are now rising gently and all my shorter term ema’s are back in a rising bullish sequence. My very short term charts suggest a pullback has started (poss back test of ST down trend?) so will watch very carefully for a potentially lower entry point near term and can now easily work out my stop loss levels. Thanks again and still have the others to check out yet. 🙂
I really like the looks of that OAS too.
Best wishes
Thanks again Alex. 🙂
🙂
as they say….All good things come to those who wait!! 🙂
Scalped XIV…Held 9 minutes….I don’t trust anything else at the moment…will be an observer. Glad I’m out right now..100% cash…scalping only.
Dude, that’s fast!
DE short from last week working. I expect the lows of last week to be taken out
I remember you mentioning DE.
It is breaking below the 50sma now, looks like a round top formation, doesnt it.
It looks fine to me. H&S on 1h chart too. I’ve been looking at it for a while now. When I learned that Buffet dumped his shares in 1q, it sparked my interest. Too much Trump hype built into it
Major gap to filled but I can see it finding support around 100
That gap lines up perfectly with the 200 sma, so it may eventually get down there .
I got a major buy on CDE on my weekly and daily chart. Bot some Jan 2018 10 calls as a starter. Long position for me. Will add at ICL.
Looks like it broke out of a cup and handle formation on a 2hr chart (past 7 weeks).
GL. CDE broke my heart!
This is a chart of what short term boredom looks like to me
( Yes Geurt, I’m still in it, but I’m bored and I might sell 1/2 position, because I went in a little heavyier than a normal starter position , expecting $2 target)
https://uploads.disquscdn.com/images/fdad0fe63ef33c3edea988a30296e8168b2b2414ce09b1d4ae80a80ee641793c.jpg
Hi Alex,
I think the boredom is the handle on a cup and handle pattern
There are several silver stocks that have broken to the up side on this pattern..(like CDE, AG etc.)
KGC is closest I can see on the gold stocks.
http://schrts.co/7BGXcU
(2 hr chart)
Actually, EGO broke out of the cup and handle pattern about a week ago.
http://schrts.co/PdBDmc
EGO is gold not silver if I recall.
It is, but I mentioned KGC was one of the few gold stocks that also broke out of a cup and handle, then I mentioned EGO. HMY also joined the group today.
Some of the silver stocks that looked absolutely horrible recently look good today.
I’m seeing lots of overhead volume resistance though. Do you think that will limit upside given the cycle counts?
SOXS on the move
SWN hurts today. Wtf?
Still holding but…. not loving it.
ECA (also long) is preferred
The only news that I saw was that they were going to be joining the S&P Midcap 400 – I thought that that was good news.
“sell the news”?
Confusing… we all know how hard it bottom picking… which is what we’re doing with SWN… under all major mov averages
I’ve got it too. Looks like it just backtested the 10 successfully today though (at around $7.70). My stops are much lower than it got today.
I have SWN too. Still some profit but was wanting more than that!
Look at that volume today. Yikes. https://uploads.disquscdn.com/images/ec0dee0d89837d7d7ca557389a5091cc8b7dfe281fcbe0e5ea8b93761cf4409d.jpg
Would have been a sweet add at morning lows but didn’t see chart until near close so just kinda eating it for now. 🙁
Still holding NWGFF but so boring …
Same! *bort* “It’s like watching hemp grow.”
Make it 3. How do you get bored with pot? What?!
Alex. I have a starter in MACK @ 3.12. When would I add? Break of 3.44?
I added today because it is above the 50sma and is inside of a base that could really get some upside if it gets going. 3 month daily chart looks excellent. ( So far) 🙂
Some of these ( LIKE OVAS & CGIX) are becoming a bit difficult to ride & hold on due to their volatility, but they overall are still acting correctly .
Thanks!
PAAS looks good too… over 200ma… 20ma pointing up…
Ditto on SVM.TO as well
Good eye LeChiffre!
http://schrts.co/PdBDmc
OOPS wrong chart, look at this one
http://schrts.co/KBpmDe
giggle
Interesting – A few of the beaten down and left for dead Silver stocks look better all of a sudden
like CDE & AG & EXK – Beaten down and abandoned
EXK & CDE were both BELOW dec lows – CDE still below Dec lows, but perking up nicely.
PAAS & SSRI, also look good today
TKRFF seems to keep climbing, too. You still own it? It’s one of my two long-term stocks (along with DNN; have TGLDX, too).
I like it and SGSVF for quite a while, but I do not own it
Isn’t it nuts? ETFs are weak, we are late in timing and now in a dash for trash the laggards are out front? Crazy sauce!
I do hate the fact that I now own 3 Biotech/ Pharma stocks ( MACK, CGIX, OVAS), because I’ve seen these things just drop out of thin air, but so far so good.
Hopefully they dont teach me the same lesson that I learned from them years ago and apparently have forgotten.
CGIX was the one that taught me not to trust it
I took a trade in OVAS at the trendline/support tag this morning. I also like that base on MACK but missed my entry.
I think the black boxes are trying to trick the technical traders, up down down up, gyrations and churning.
3 -4 week in April is going to be stunning for metal and miners.
Alex – are you adding to your JDST position on this weakness?
interested to know
Possibly on tag of the 50sma with GDXJ , but first I have to see what it looks like on intraday charts when or if it gets there
If Gold runs back to the 200sma this week, GDX GDXJ could run back to the 50sma ( or even their 200sma and top out there in a very convincing manner). Many Gold bulls would be buying miners and possibly get flushed out after that.
Thanks for your update on GDX / GDXJ ALEX.
Let us know how the situation developed on these ETF’s this regards JDST. B.T.W….. I’m out early this morning in NAK, you are right it’s boring, there is not much music in.
Thanks a lot for your ‘perfect’ support Alex !!!!
Wondering if the heavy trading in miners resurfaces into the close. Still holding Jdst from 1420 last week
Holding JDST and DUST from 14.83 and 13.19 from last week also.
MACK tagging the 50 day..? Just wish I had bought more….being so conservative these days so not buying a lot…
I missed the add this morning, will look to add on any pullback now that it’s breaking out.
Added a bit more to MACK.
Just thinking out loud… ixed signals in the precious metals
GDX & GDXJ look a bit weak, but then you look at HMY , AU , SBGL and a few silver stocks like EXK look good.
A 3 month chart of HMY actually looks like GDX , add the break out higher.
MIxed signals, but ‘timing’ is still too late for me to be comfortable chasing
… and XRA 😉
I’ve dumped XRA from my watch list, I would not buy it now, unless I want to own GG : )
The market gods gave me another entry on JDST!! Now I have no reason to be angry anymore!
I know I’m probably the only one here who cares about the general stock market, but I bot the dip this morning in TQQQ. I was nervous because the first reversal ran out of gas but buyers came back in starting about 1:30 PM ET. TQQQ is still a “buy” (Up price trend) on my 15 min chart so I am anticipating a rally into the close or at least no major drop. This is not quite the “fat pitch” trade I’ve been waiting for, but TQQQ broke the 8 and 9 day EMA and came close to tagging the 13 day SMA, which is good enough for me. Still keeping a close eye on TQQQ since it’s a lot safer to buy near the bottom of the BB rather than the middle or top. Contrast TQQQ to JNUG which teases in the morning and then sells off in the afternoon. TQQQ is acting bullish while JNUG is not IMO. FWIW JNUG is currently a “sell” (down trend) on my 15 min chart, so it may continue selling off into the close. Check your own charts, make your own trades. Good Trading to ALL!
Nope, not the only one…
I have a “feeling” Steve that the “fat pitch” will probably be gaining some serious weight over the next couple of weeks!
TQQQ was a great buy in the wash this morning. Not sure about the daily candle, dojish looking at the close. I will wait before going long the qqq. I don’t trust these markets.
UPDATE: JNUG had a late rally to the close and TQQQ had a late sell-off … opposite of what I was expecting … but TQQQ is bouncing back strong in the AH. Miners are tough to trade right now, I prefer the “safer” trade in stocks right now because I have Wall Street, the bankers, the Fed and the gov’t on my side and I don’t have the luxury of being able to sit in front of a computer and watch the market all day like I used to. I find that the LESS I trade, the better my overall results. I have been guilty of “over-trading” in the past. As Clint Eastwood once said in a movie, “A man’s gotta know his limitations.” I’m set up with a good chunk of TQQQ in my retirement accounts and my plan is to let it ride for the rest of the year unless my stops are hit … which could happen if there is another strong sell-off in stocks like on March 21.
Steve, I like trading XIV which is a bet on the S & P 500…reverse $vix. I trade only the two hour charts with daily in background….close to a buy here on XIV.
Man, XIV was a go-to ATM for me there for awhile. I’ve gotten away from her for a while now. It never corrects enough for a really juicy entry!
Yea I hear you Carson. In the early stages of a bull it is great!
So what do you all think about SXE? (There’s your set-up, Maria 😉 but seriously… it been on a tear and I hesitate to chase, but then look at the volume and the three year chart, could this be getting ready to break out?
;o) Happy Spring Woman :o)
so you found her at last 🙂
indeed … took some serious coaxin ;o)
Man it is so hard not to comment on this…
Ha ha!!
… the Gang’s all here …
https://uploads.disquscdn.com/images/7883b380fb7ebd1d39b1be8be136ef3d4d8b0e4bcc42668e8cdf16ec16059f3f.gif
that’s me … w/ the gum…
lol
Who am I? Ahahah
the dude with the headband? lol
Ahaha. Rasta man vibrations!
:o) giggle …
Just need Billy Bob and Kenny Boy
…and not to forget JohnnyBoy (you there J?)
Johnny is my fellow Night Ranger. Swoops in with wise words once the lights go down!
Hey Crystal! 🙂
yeah.. wtf has she been hiding?
It’s been a long winter and I needed a rest 🙂
Glad you are back again!
ok C.. nice to see you back then!
Glad you popped in , refreshing:)
SXE – Chart on that one doesn’t look too bad at all, definitely. But let me tell what’s fantastic – SEX.
Sorry! I couldn’t help it!!
Ha! So I looked up that ticker symbol…..can’t seem to find it anywhere….lol
It’s ok. We’ve all been there before, Tammie. HA!!
couple of sentiment readings I watch actually are lining up bullish for miners right now
Precious metals are near there recent highs in spite of a large advance by the dollar.
Miners had most of their recent gains on one day (3/15), but they have held up pretty well during the dollar advance.
Right now it does not seem like investors in the metals and miners are expecting this strength in the dollar to continue much longer.
Loving the silver miners move today. CDE, SSRI, EXK, PAAS
It looks as though silver’s correction may be over. Perhaps that is the case with gold as well, though it is less clear.
When we expected strong we got weak. Now when I expect weak we get strength. This is some pretty strong weakness!
Ok, so far looks like I am on the wrong side of the gold trade right now! :O
The timing is a bit strange, so let’s hope we have the cycle count right. Given our current understanding of the cycle timing, this should be sucking people in before dropping into the daily cycle low.
I know, right? I went long at the DCL, was stopped out with chump change gain. Doesn’t make sense how strong gold is last 4-5 days with USD screaming higher. Just really interesting miners were so weak at beginning of 3rd daily with USD downtrend and now won’t quit late with a $$ rally. That doesn’t make sense but I’m not shaken off my theory without more evidence yet.
I don’t know anything about cycles.
I see the possibility in GDX (and most pm’s) of an inverse head and shoulders pattern (weekly chart) that would target about 32 – 33.
I see a minute wave 1 and 2 ; minute 3 projects out to 32.70. Both projections close to previous peak.
GDXJ projects out above it’s previous peak.
Shown in link below:
http://schrts.co/N6Q2Cb
If you get EW this well you’ll find cycle theory intuitively obvious.