
March 17th Weekend Report- Thinking Out Loud
Let’s go over the markets and see what may or may not have changed with the Fed Rate Hike this week. 🙂
.
This was my MARCH 10th SPX chart– I expected the general markets to drop back a bit more on the pull back, and then to put in another run higher. It would then be in the timing to roll over into an ICL as shown.
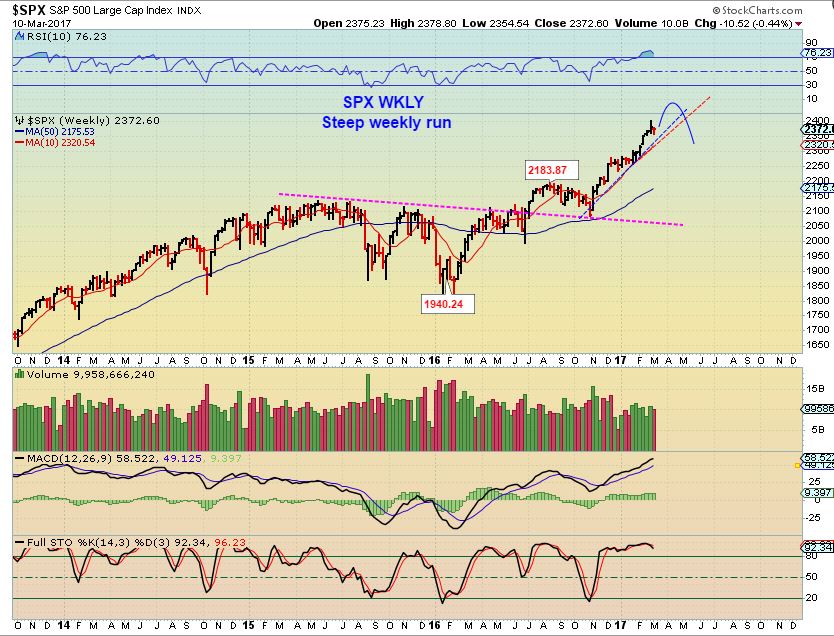
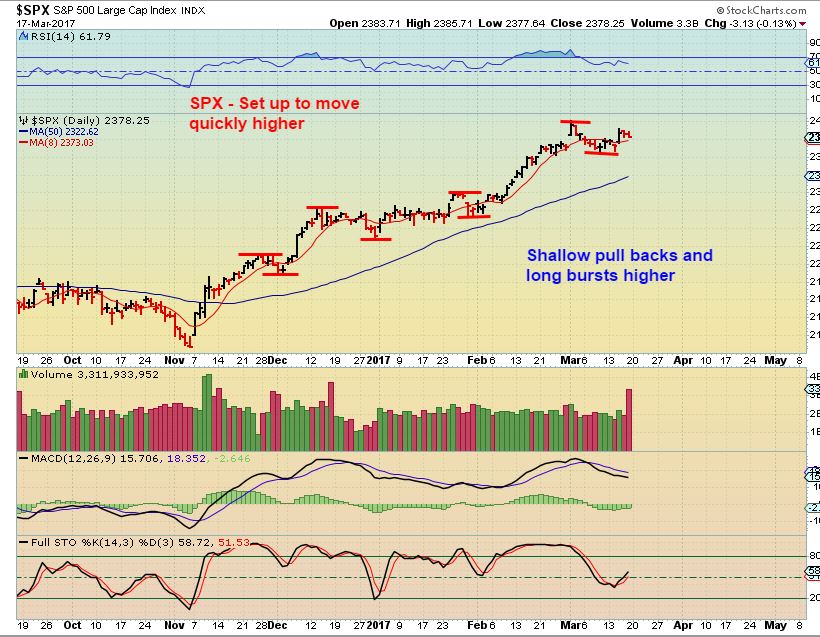
SPX – We got a bit more of a pull back and last week I mentioned that the dcl is probably in place. I expect a run higher. We have had a series of small pullbacks , and that can be very bullish.
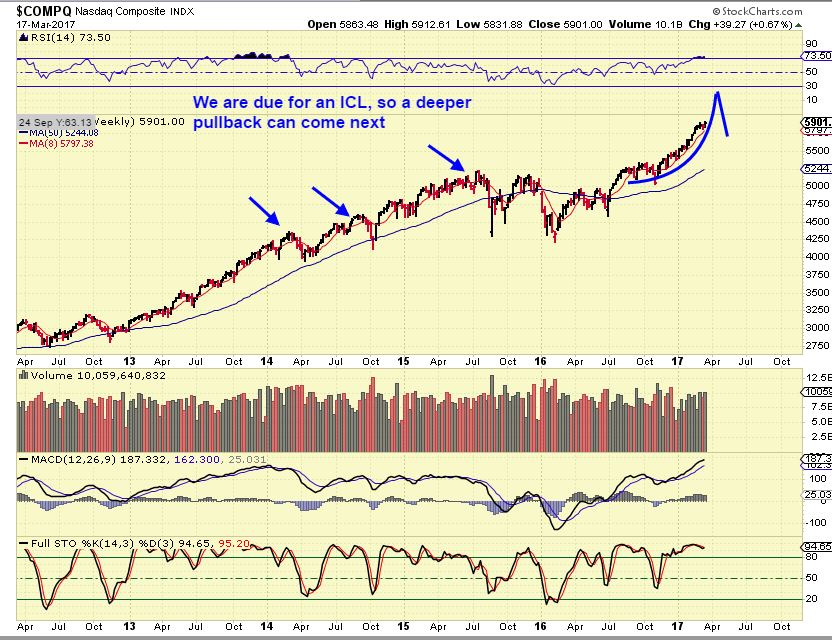
NASDAQ BIG PIC – Yes the markets are running up nicely, but the blue arrows show that normal pullbacks can occur at any time. The markets will soon be due for an ICL after the next run higher, so I wouldn’t MARRY my long positions, use s a ( maybe semi loose) trailing stop.
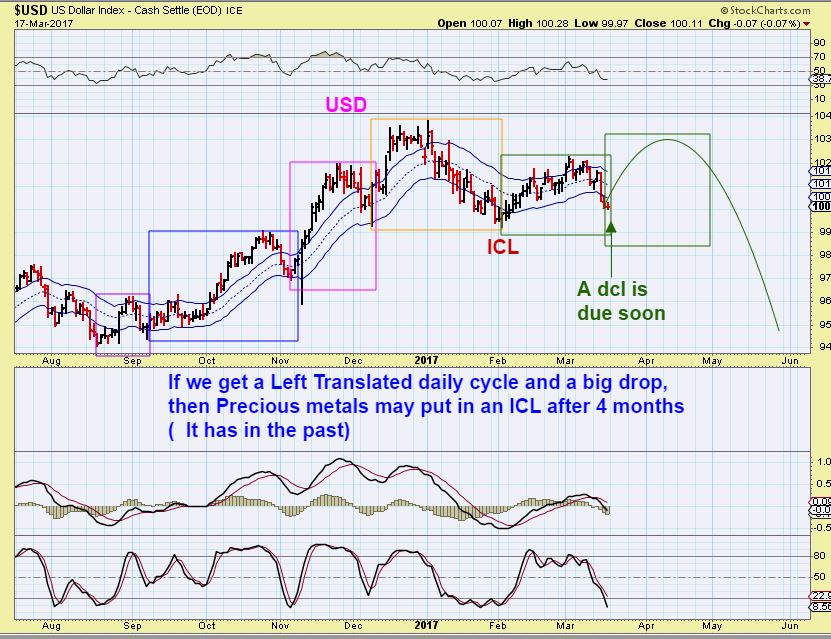
USD – On MARCH 10 I expected a drop into a dcl from here ( Happening now with the FED reaction) and then a run higher ( should be very soon), and then a drop when Gold puts in its ICL. We are still on track, believe it or not.
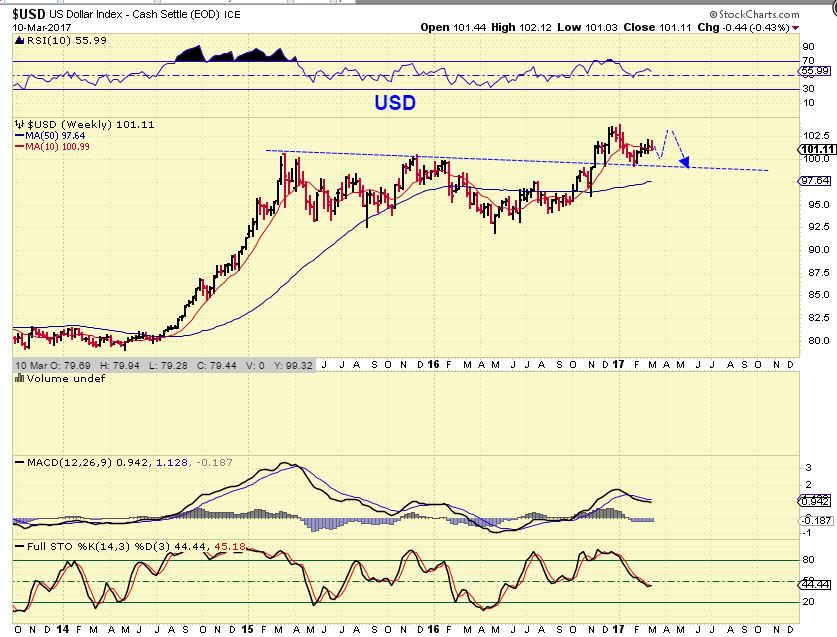
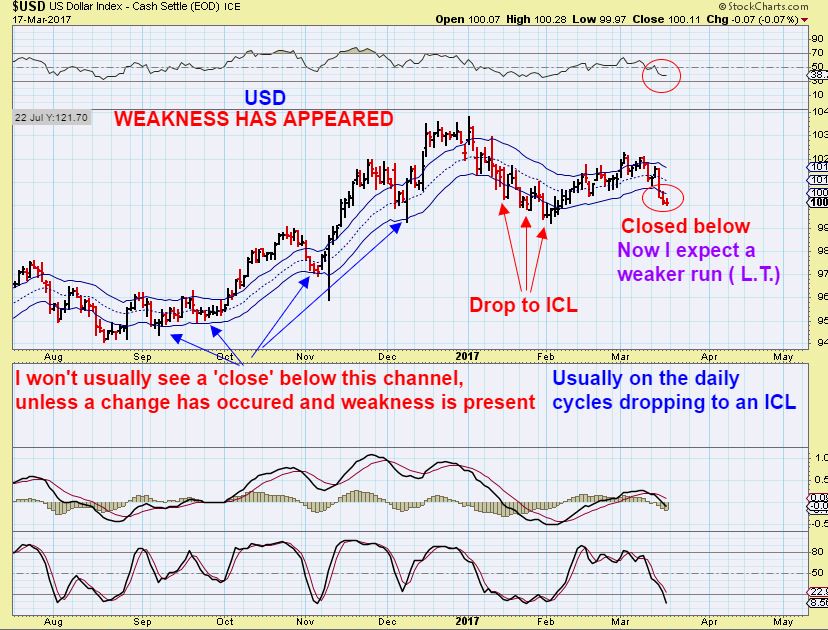
USD MARCH 17 THIS SHOWS THE DROP- Here we have that drop after the Fed. We are due for a dcl anytime now in the USD actually, this daily cycle has been long ( Like 30 days) .
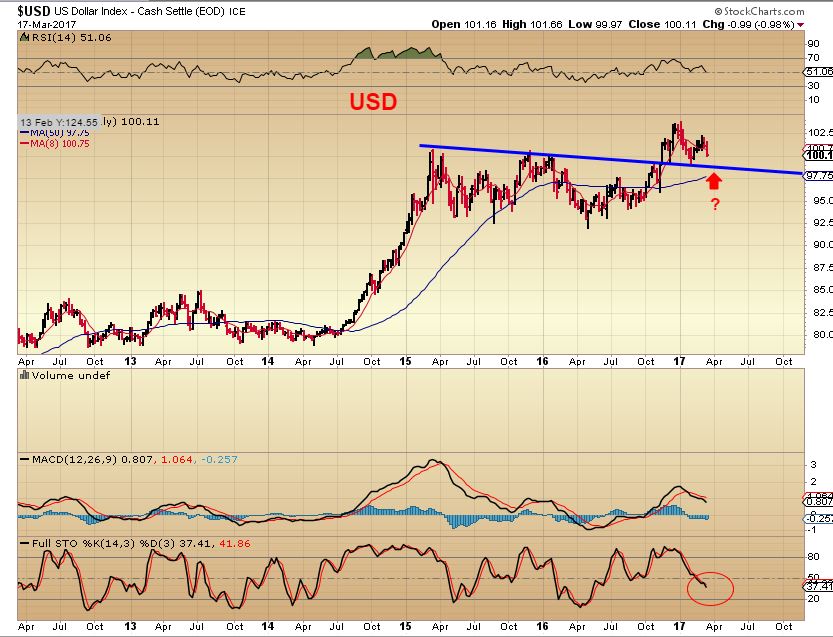
USD – Tech analysis hows a wedge could pop the USD out of a dcl soon. DCL IS DUE NOW.

NOTE : THIS chart caught my eye as a ‘sign of weakness’ – I usually do not see the USD CLOSE below this channel this early in the cycle, it is a sign of weakness for me. So now we are due for a dcl, but the next ‘bounce’ may not be spectacular in my opinion, it may form as L.T. Read the chart. I’ll discuss more when I discuss Gold.
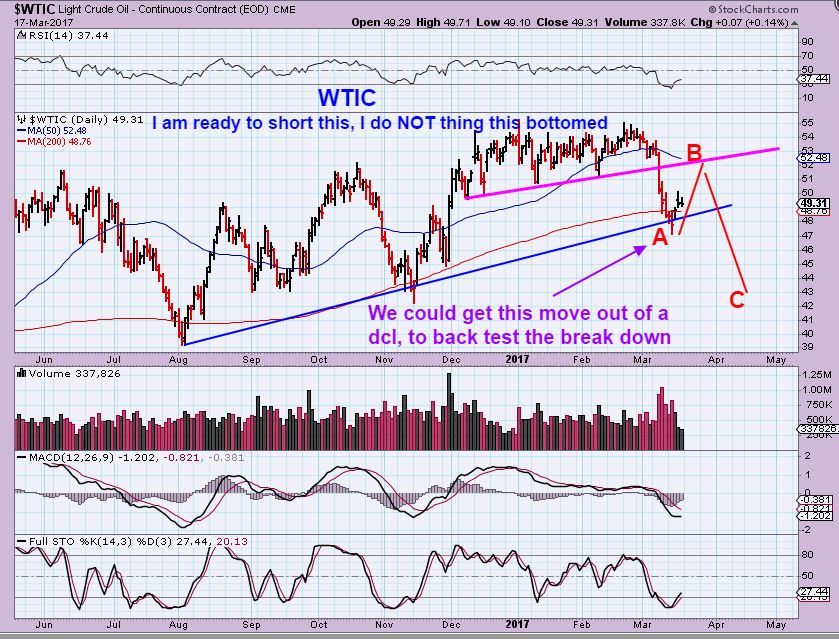
WTIC – I called for a temporary bottom here last week, but I do NOT think that this is THE LOWS yet. Some of my readers bought it say that they believe it IS THE BOTTOM. That is fine, but I do not, so may I suggest that one would use stops and then all is good…
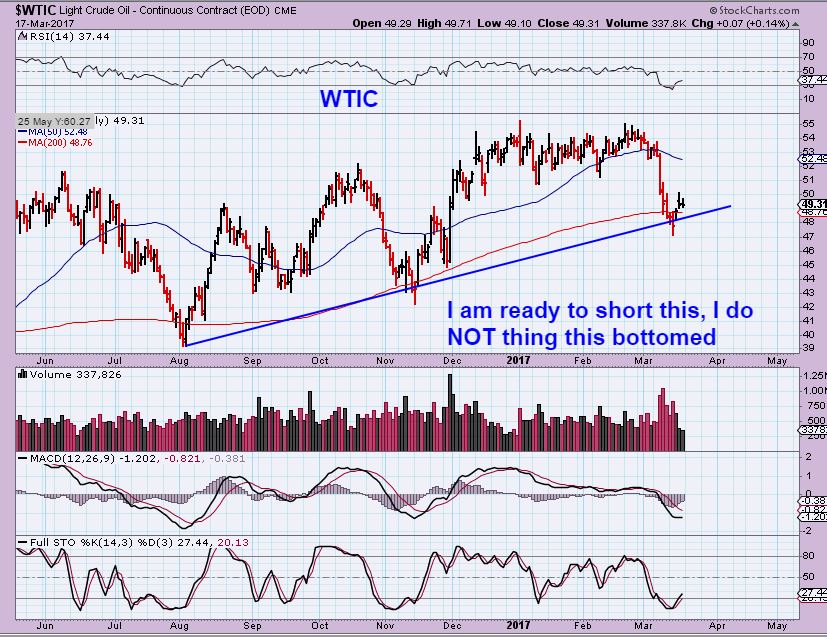
I dont know if the ‘bounce’ is finished, but read my chart. I actually am thinking of trying to short Oil. Is it ready yet though, this early in the daily cycle?…
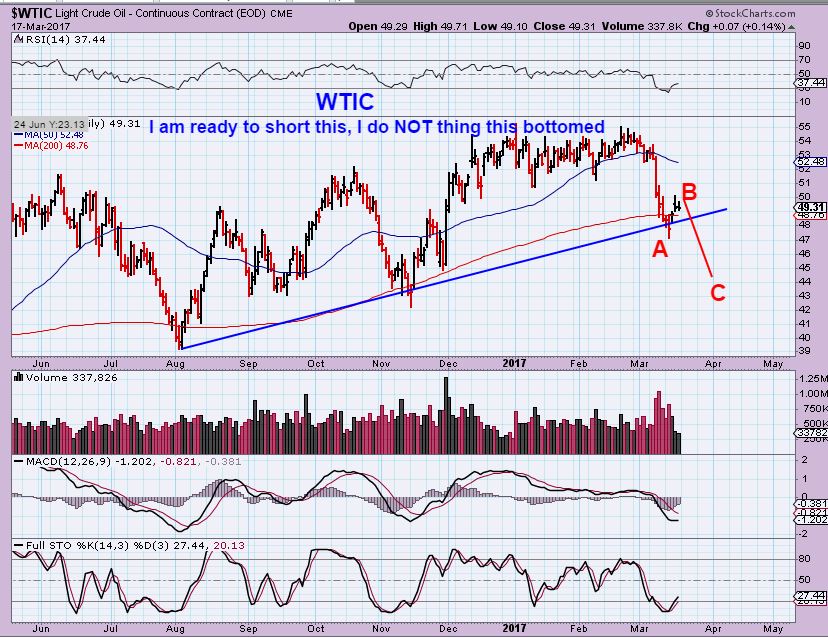
WTIC – We MIGHT even back test the break down on a strong bounce, since its only day 3.
NATGAS – NATTY has been bullish and I still think this is fine.
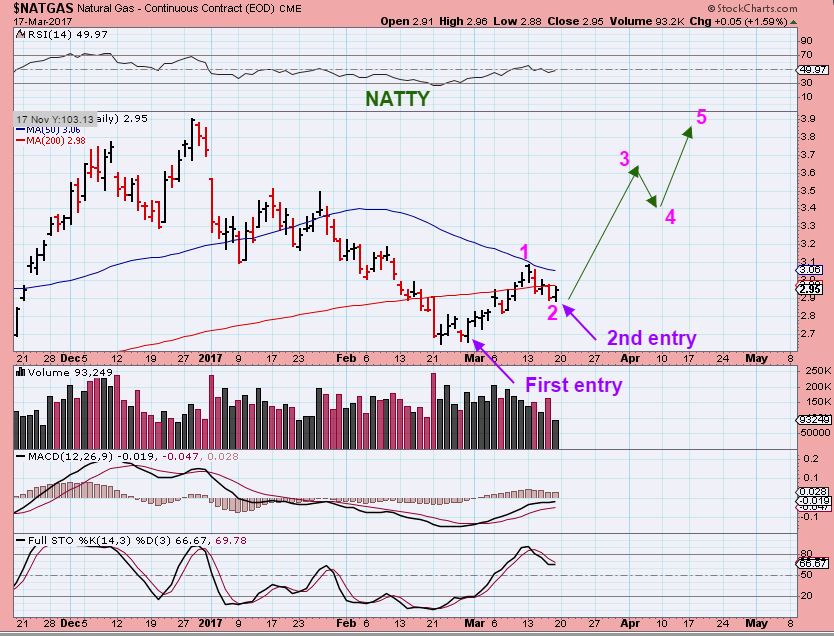
A reasonable stop should be in place just in case, but I still like the set up ( physical or mental stop).

GOLD & MINERS
EDIT: I just looked at the GOLD COT – That is a Bullish COT. The Miners looked ugly in ways that you will see. It continues to be a confusing time that needs monitoring going forward.
NOTE: There are still still differences between GOLDs setup ( And Silver) and the MINERS set up. Gold does have a more bullish set up, so will it drag the Miners higher with it? GOLDS COT looks more BULLISH, and so does the YEN. I like that for a Bullish Gold set up. What about the MINERS? They do have a weaker set up, are they showing weakness that Gold & Silver will eventually be affected by? Let’s discuss what is in front of us, and then I will discuss a few ideas of what we could expect. We need to navigate through the murky waters to get to the BIG PLAY that is coming our way soon.
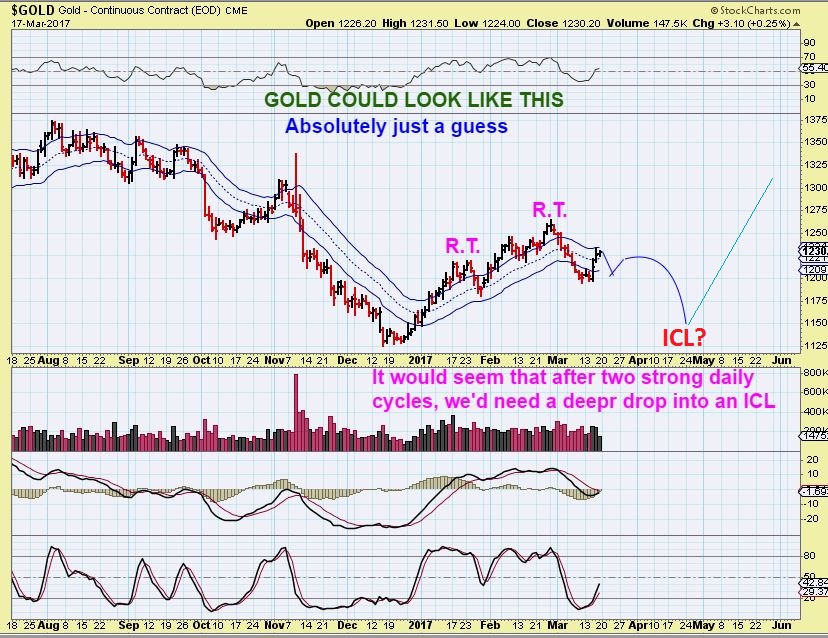
GOLD – Gold is on day 5 of a new daily cycle. There is a LOT to consider here, and this is why I said that GOLD is more BULLISH.
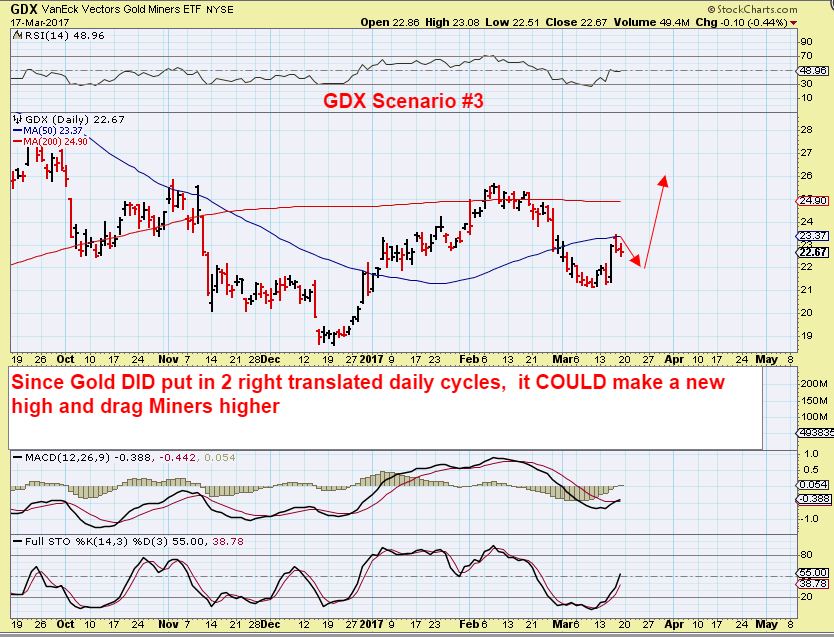
GOLD put in 2 right translated daily cycles, so we would expect the 3rd daily cycle to be able to make new highs, And I expected Miners to follow, but they never bounced during that 2nd daily cycle. They dropped. Now in Gold, the pull back was deep and I’m wondering if it will just get to the 200sma again in this daily cycle. IF THE USD puts in a dcl, I have to wonder….will Gold just form a H&S and top here, or can it run to the 200sma and top out there? We’ll see.

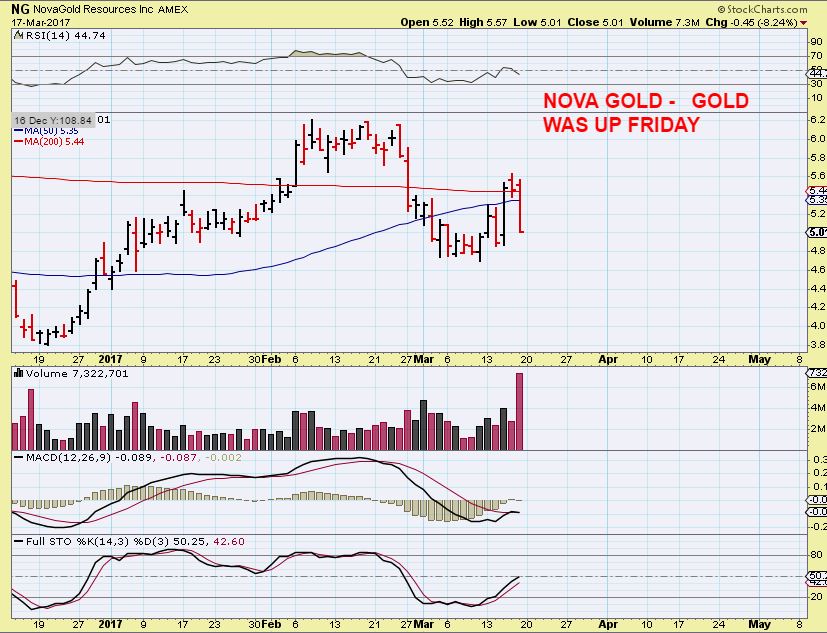
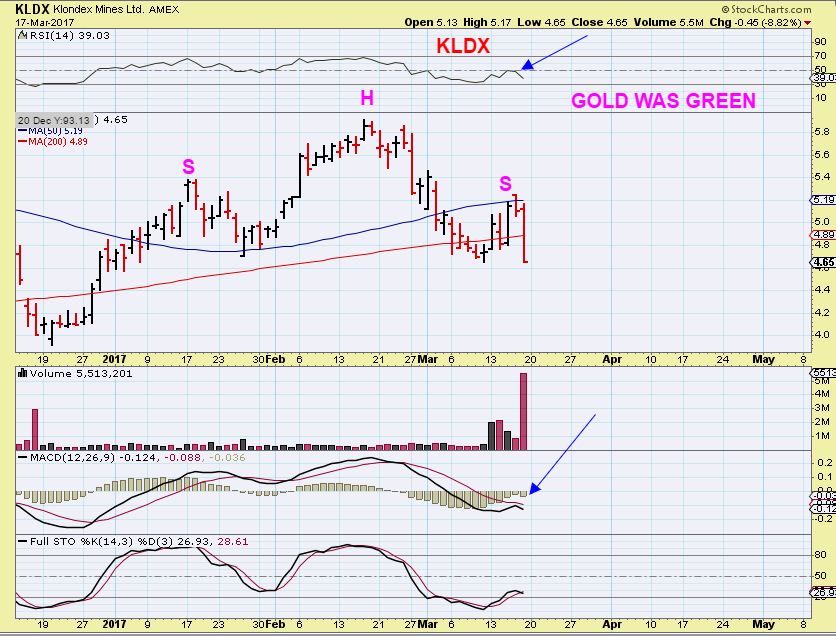
KLDX – GOLD was green, down 8%
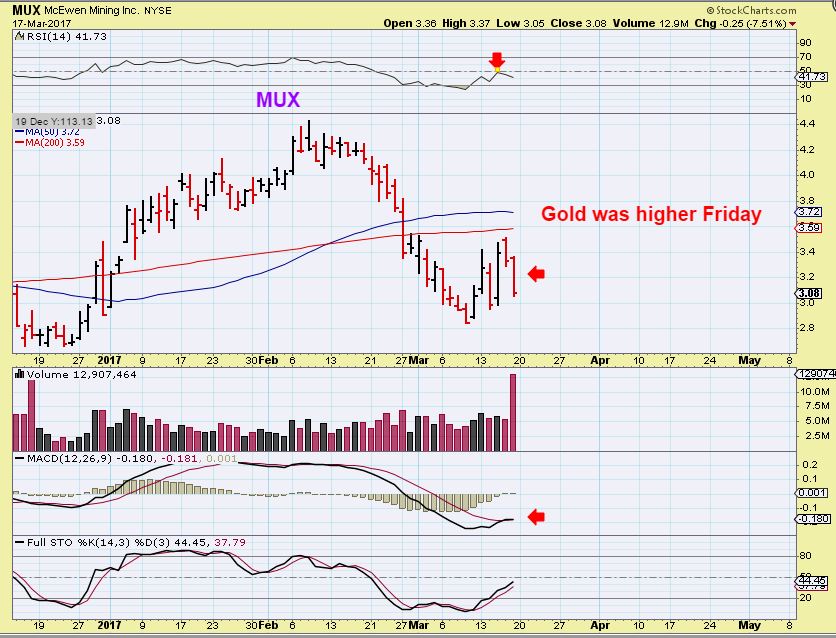
MUX – Gold was green, down 7.5%
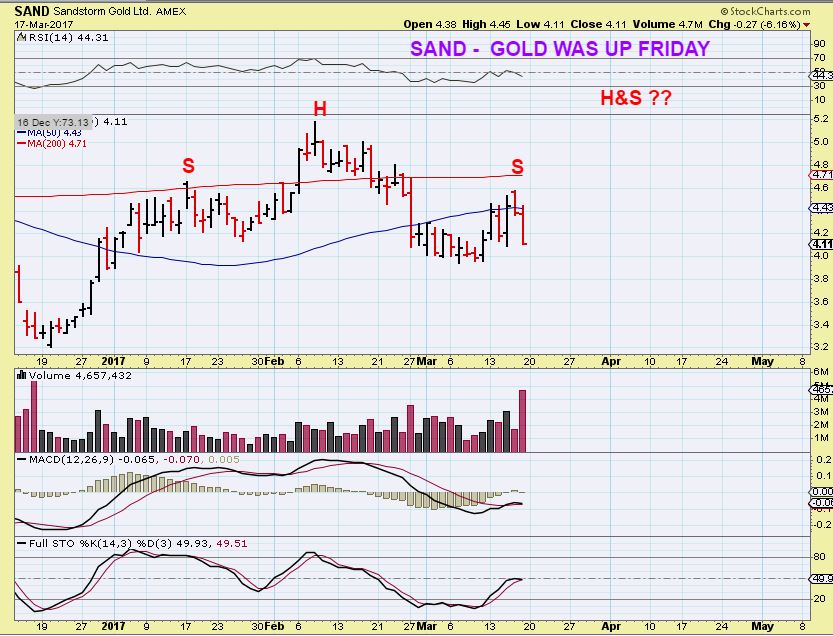
SAND – Gold was green
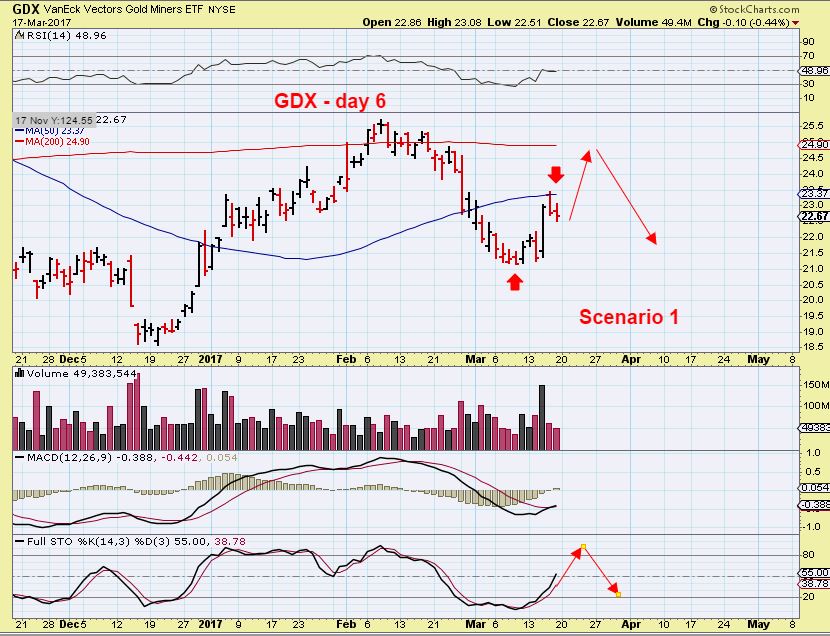
GDX – After a deep sell off, we had a strong bounce on Fed Wednesday and no follow through on Thursday and Friday. Scenario #1 is that miners move higher from here if Gold does, but they will probably still peak L.T. on day 9-12.
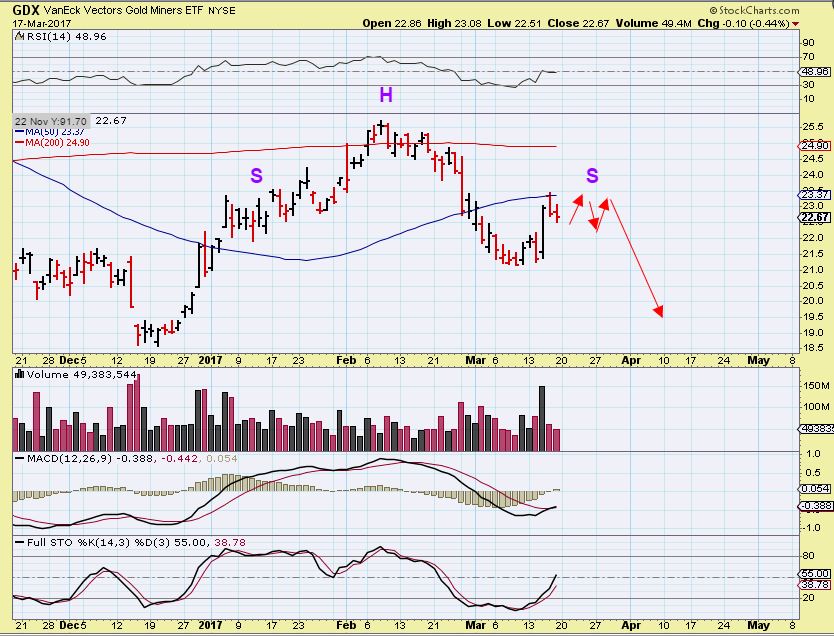
GDX SCENARIO #2– A sideways pause of weakness that creates a H&S, and the USD bounce will drop miners.
GDX SCENARIO #3 – More bullish….Since GOLD did put in 2 R.T. Daily cycles, if they push to new highs, miners COULD also push to new highs ( but NG, SAND, KLDX, MUX, and a few others certainly didn’t show strength on Friday).
Conclusion : We still need to remain alert as this plays out .
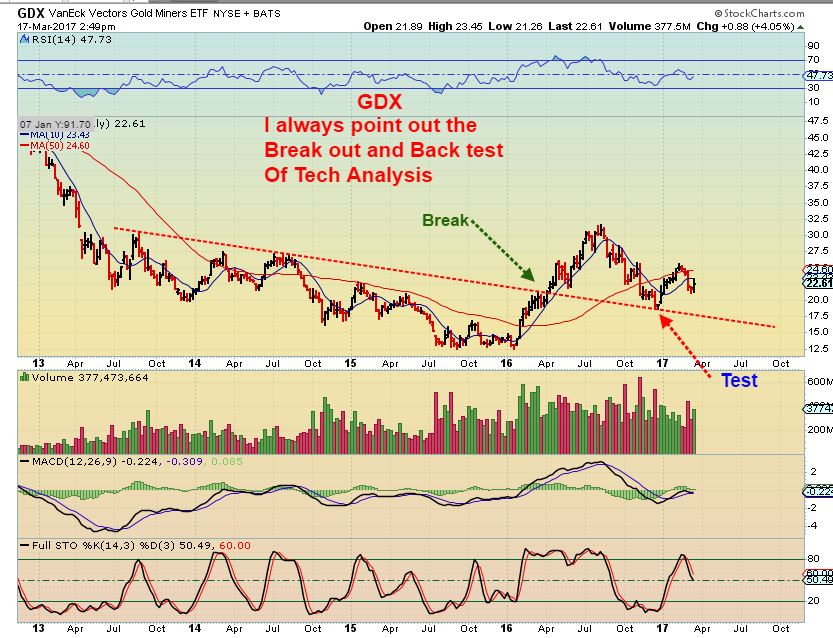
BIG PICTURE GDX
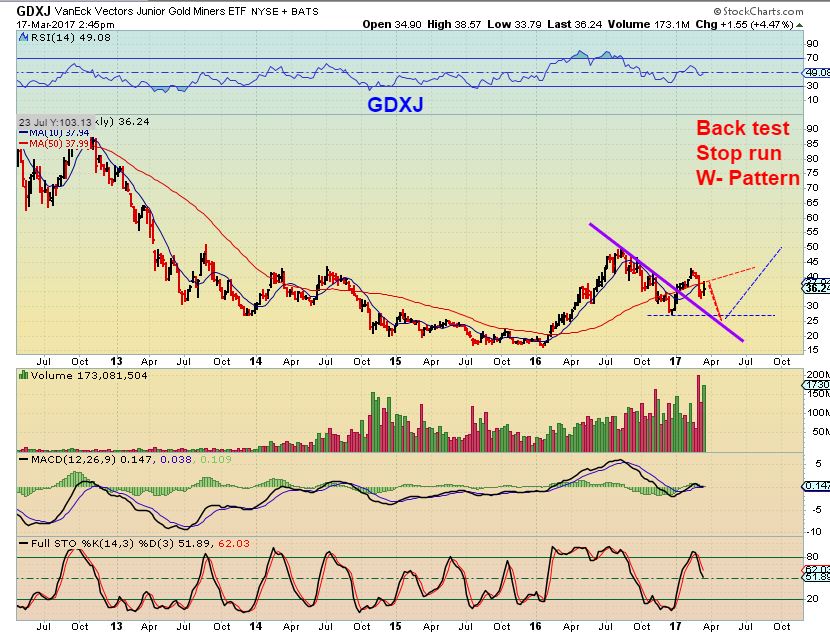
GDX – Do you see the break out & back test on GDX? We see this action often, and in fact, I did call for this back test before it happened last summer. SO it is an example of the common “break out & back test”.
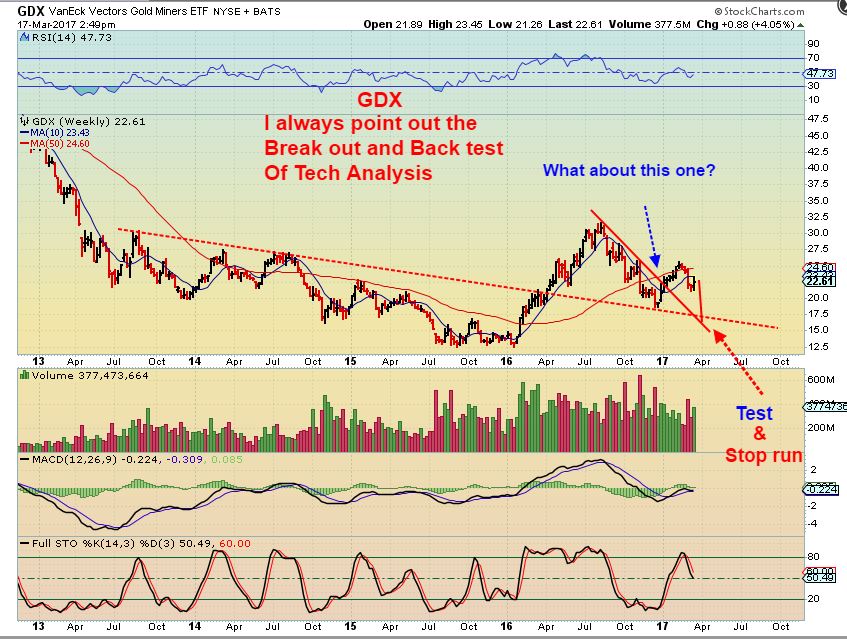
GDX – If we got a rather sudden drop into an ICL now as the USD bounces, we could do another back test of a more recent break out. I know, that looks like too steep of a drop after the FED reaction was so bullish for Gold & Miners, but it is possible.
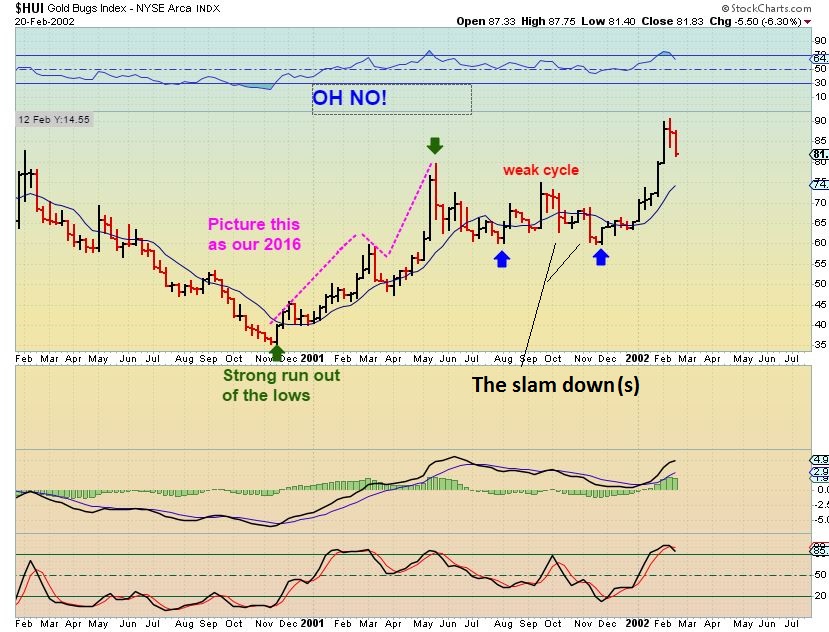
REMEMBER THE W – PATTERN / DOUBLE BOTTOM OUT OF THE LOWS IN 2001? It would be similar to that.
GDXJ – As seen here. This would be the ICL in April or May, in the form of a double bottom or W-Pattern.
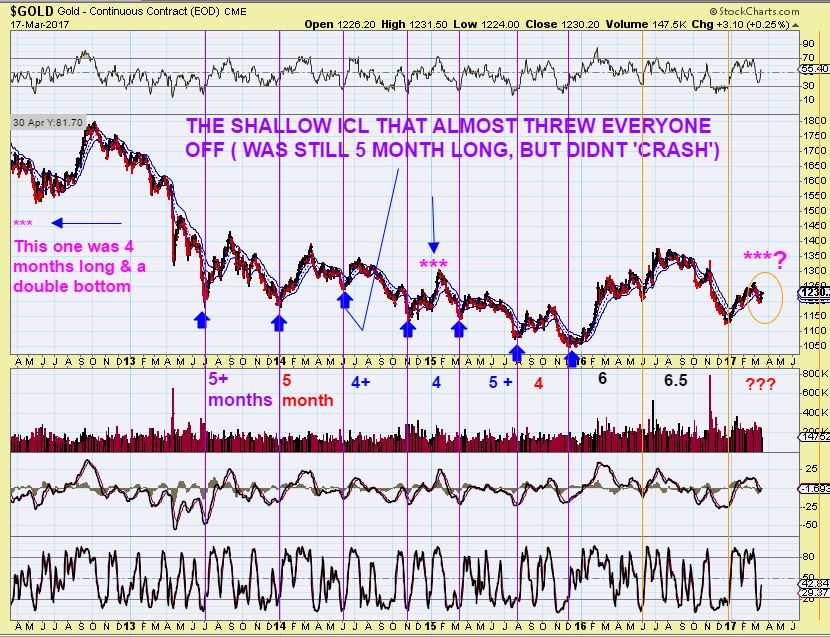
GOLD ICL’s – This is to show a series of GOLD ICLs. Usually 6 months apart, also 5 or 4 months at times. look at this *** on the chart. It was a shot 4 month double bottom after a STEEP run up, and so that matches what we could see next. It happens, but this also was a bear market. I just wanted to show how 4 month ICLs would bring us to April & we could double bottom.
USD – If the USD is weakening after the FED RATE HIKE, and it tops in APRIL, GOLD could BOTTOM in APRIL with an ICL.
GOLD also closed deeper than normal, like the Miners did, even though they put in a R.T. daily cycle. Gold rolling over soon & bottoming in April would be an EXCELLENT buy point.
So after the Fed Rate Hike, we find ourselves pretty much where it looked like we could be in last weeks reports. The general markets look like they want to run higher. WTIC is bouncing, but I’m looking for an opportunity to short it and not go long. NATTY continues to look good so far. Gold & Miners responded well, but we’ll have to see if we get strong follow through next week or will the USD bottom, bounce , and put an end to the GOLD / Miners strength. As we watch this play out, we get a better idea of how to continue to trade it going forward.
One thing that I want to say is that an ICL is an extremely profitable trade to take, whether we are in a Bear market or Bull market in Precious Metals. It is coming and you will make some very good gains at that time, but we cannot rush it- it will set itself up in its own due time. We will find some trades before then, but keeping in mind that an ICL is due in Gold , Silver, and Miners in the near future is helpful. I keep current trades smaller in size, waiting in Cash for Miners to present a proper set up. We will continue to monitor things and ready ourselves to take that trade.
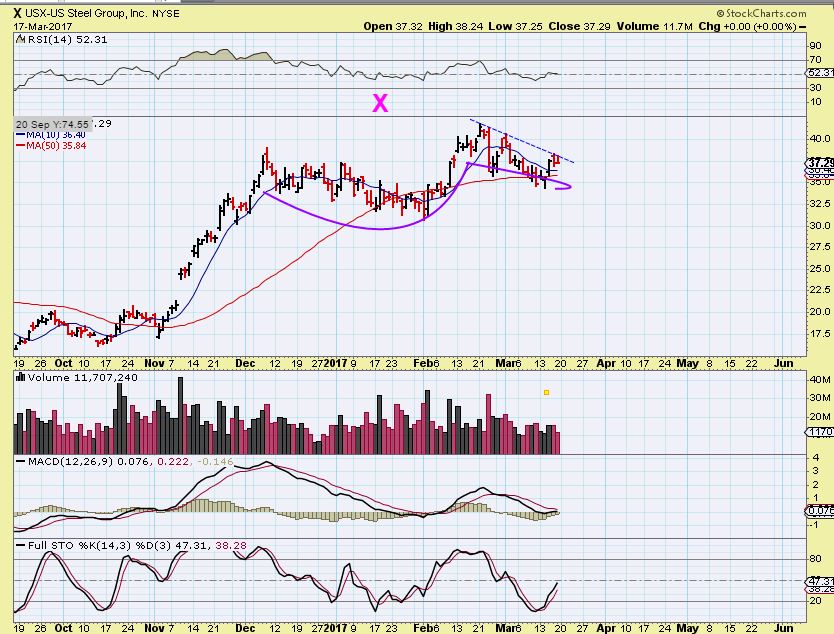
I know that some people get bored when we don’t present bullish trade set ups to take each and every day, but we are currently in a period of time when Choppiness and market volatility make trades difficult. The General markets have been pulling back, so many trades are not breaking out higher ( CLF, X, AKS, TGB, VALE, WRN, etc etc . It happens during consolidation periods. I do understand that feeling of wanting to trade set ups daily, but in such times of market volatility or consolidation you can find 10 proper looking trade set ups and only 5 out of 10 work, while the rest just continue to chop around. Currently, trade set ups are taking longer to play out, and that is frustrating, but that may change when the Markets start running higher again. Even so, the biggest % gains will likely be made coming out of the lows of an ICL in Precious Metals. It will be worth the wait for those that have funds to invest at that time, so lets keep that in mind between now and the time that the ICL presents itself. We want to have funds on hand to ride a nice run higher in the Precious Metals when it comes.
.
~ALEX
.
URRE WEEKLY – I mentioned this recently and I do still own it. The weekly chart shows that URRE is finding support on the 50 ma. I like it as a low risk buy, but I cannot say exactly when this base will break out and run.

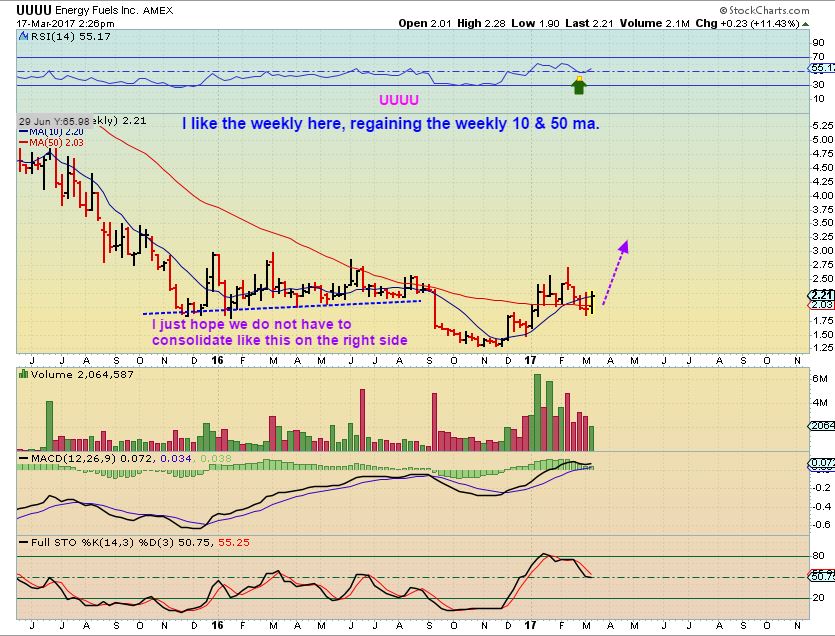
UUUU WEEKLY ZOOMED IN- It does look set up to move higher. On a daily chart it is dancing around the 50sma and it could be considered low risk if you use a stop around the 50sma ( with wiggle room).
NAK – Back in Feb with NAK at $1.65, I was pointing out that the 200sma may be a good area to keep an eye on as a place to start a position in a 1-2-3-4-5 move down. I was going to be doing that.

NAK – The weekly chart found support and a reversal on the 50ma. The 200sma area has been discussed in the weekly reports too. Price was bouncing around that area. Even a small bounce is a pretty big gain. The low last week was $1.06 and it ran up to $1.28. A 38% bounce is $2.00

CGIX – I posted this on Fridays report at $2.50 . I said that I was probably going to buy it and had owned it before ( You can read about it in Fridays report). Risky as a Biotech stock, but this base shows great potential if it gets running. I mentioned Friday morning in the comments that I had bought it on a gap open and a gap fill.
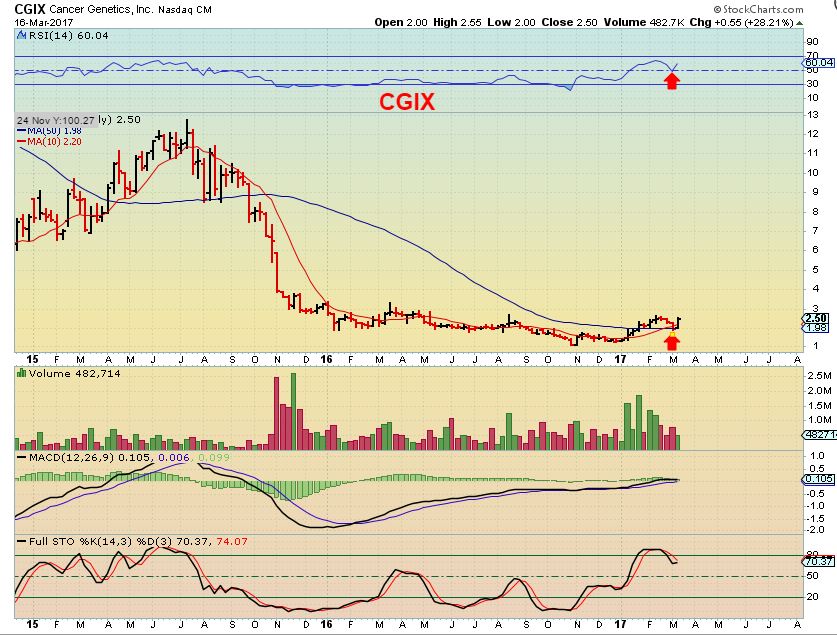
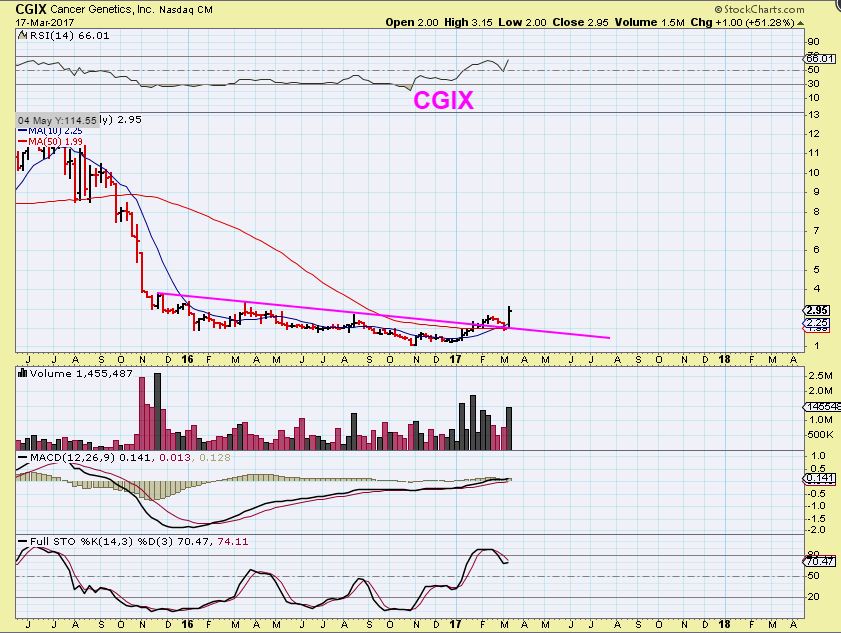
CGIX – It took off and ran to $3.15 that day, closing at $2.95. This weekly chart now looks to be breaking out. We’ll see if we can get the follow through next week.
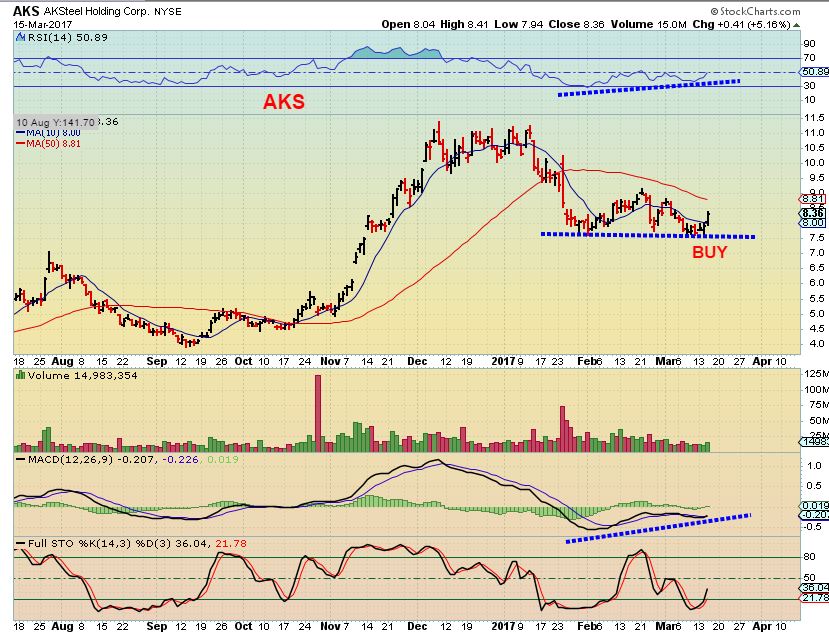
X – Some of these set ups like AKS, X, CLF, VALE, TGB have been stalling and choppy as mentioned above. They may run when the Markets break out & run higher.
AKS – This chart is from last week
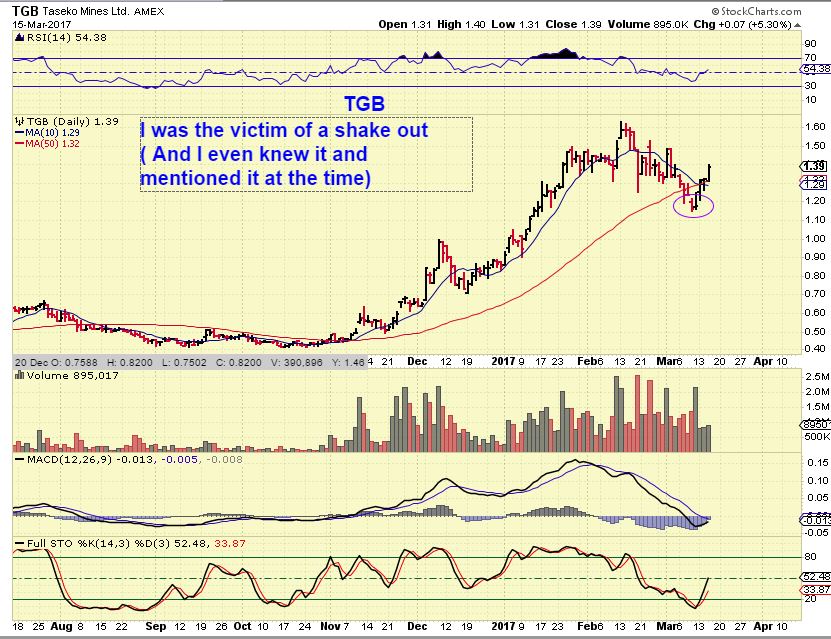
TGB – MARCH 15 and the set up it still looks good. It is just not breaking higher yet.


GOLDS COT is quite Bullish looking . Odd.
Heard SGE lead higher so London had to play catch up.
Thanks Alex. lots to think about!
Should be an interesting week.
Hopefully clarifying things a bit more, I’d like to see GOLD & MINERS Sync up.
Fri was gdxj rebalance so that’s a contributing reason in all liklihood to the odd action in some jrs. Luckily for me agi was strong and hopefully it continues this week.
Can you say a bit more about this? How often does this take place? Is there a reason why this would cause underperformance?
I imagine that at least part of the weakness in miners in the last couple days is the high fear level resulting from the recent drops. So it may not really be bearish, but if I am right, then it will mean high volatility near term.
Often after Miners take a dive & Gold moves higher, I see strong short covering in Miners, but so far we got one strong day of that possibility on the Fed Rate Hike. Not much follow through yet, and I’m hoping that this week will give us a bit more.
Alex, nice report. I am curious about the number of DC’s gold/miners should have in an IC. Mid April would put it at 3 DCs in the current IC – is that unusually low? Dont they normally have 4 or 5 DC’s? In murky times like this, I do think that your technical analysis is incredibly valuable. Thx.
Hi Rob
Yes Usually 4 daily cycles or 5. 3 from here would lead us out to 4 months, and I have seen that in the past several times. 4 months from icl to icl, as shown in the GOLD ICLS chart in the report. Dec to April would be 4 months.
Wilders lost in Netherlands vote so Euro strengthened. I think Merkel visit was to advise her that
the dollar is going weaker and everyone needs to take care of their debts. We may all be surprised
if Le Pen loses in April and the Euro strengthens further . . . . metal over due for rise pulling miners
with it. The USA depression may have some cashing out their miner portfolios just to survive for
liquidity – need to prepare in every way.
The USA is in a depression, causing some to sell Miners?
yes – people need their cash even at losses.
Question: Ron Rosen uses something called when charting the DOW Quarterly
– Momentum (13) 8089
It shows lower highs when the DOW is rising lately in this last blow off of Wave 5.
I still think the DOW top is in or March is the last month it is rising.
I think I missed the question,
but I think the next run higher will be this cycle top, and then a drop into an ICL, maybe that answered it .
NatGas poping, trend change https://uploads.disquscdn.com/images/a08b9b81a8372b156aa9e18711e7447cd1b3da76ca244e719923be8303d13c5d.jpg
Go natty!
its pooping?
First target reached on CGIX
CHIX FILLET?
: )
I cant believe you saw that I wrote CHIX at first, I noticed it and fixed it within 2 seconds.
Like below where you wrote that NATGAS is poping 🙂
Poping? I don’t know what you are talking about? 🙂
One extra O or P really changes interpretation there.
Ha, sure does. I speed tipe and don’t look for mis speled werds. Kan u tell?
great job…. ;o)
Finally have some trade set up following through. Its been a choppy market the past couple of weeks.
ahhh yesss …. and thank you perspicacious, pertinacious professor of the charts, for bringing said setups to our attention…..;)
Thanks for your studious attention and kind responses to said set ups.
I hope they become fruitful
… already are … hopped aboard Friday 😉
https://uploads.disquscdn.com/images/794165dc1bcb95a9e715c85036ad856630f8f187313a30f88684dfb1d9170577.gif
Hi Alex, just wanted to say thanks for setting up this great community. You do a great job, happy subscriber!
Thank you Chartapprentice – I appreciate that 🙂
Baytrade and Steve Tytler, USO approaching that 10.10 wick from last week.
NAK taking off with nice volume
On board this time. Bought the 200ma like you suggested.
Nice- it really does have strong volume today. The past couple of days it had 4 million all day, it has 2 million in the first 1/2 hr. Could be partly shorts covering, but even a bounce here gets good. It is already up from $1.06 to $1.47. That is big %-wise
;o) nice….
Great call on this one Alex. Nice trap and you nailed it.
Thx Miller
There was good divergence in that trap 🙂
great report professorOftheCharts ;o)
Bull flag forming on UUUU
Minuscule volume on the selling too.
I am thinking of adding to current UUUU position if it tags the 10sma, but this is close enough ( I do have to make sure that I am watching things clearly, because I am bored and I dont ant to trade out of boredom).
That said, I do think that UUUU is a light volume sell off to the 10sma, so I will add. – 🙂
I need to see a change in direction on the 5 min chart.
I bought some UUUU, let me know if you see cracks
Bounced off of the 10 sma this morning, so it still looks ok to me. Use that as a gauge
JO is perking up! You in Ken?
SO…thinking out loud here….. Gold is up ( Again) MIners are don again. So that isnt healthy looking, HOWEVER….
AS A TRADER A short term trader at this point in case this really is going to just quickly roll over, I would say that both GDX & GDXJ could be forming mini bull flags above the 10 sma after a big surge on Fed Wednesday.
EVEN THOUGH I said weeks ago that I thought we’d probably get a bounce tot he 50sma as a back test, and we’ve had that ( AND THAT COULD BE IT), I am still in my trade ( I took a JNUG trade as GDXJ crossed back above the 10sma on FED WED. It was a day trade/ short trade and I probably should have closed it on the tag of the 50sma, but I held and I am going to add to that trade a bit since it is up, in case this is a mini bull flag and Gold makes a run for the 200sma. GDX GDXJ MIGHT break through the 50sma on a false break out, and I can lighten up there.
If it drops from here, the risk is that I lose the gains that I made from Fed Wed onward, but if it takes out the lows I will flip to DUST or JDST, because that will be a failed dcl. . REFRESH.
https://uploads.disquscdn.com/images/738720b1e77ddb9e6c5ba191afbb15d2fba46d34b4fc27a69e8614c5444db878.jpg
Valuable info Alex, thanks for Sharing.
Based on my usual posts, it is about as risky as it gets. It looks like a bull flag, but the miners are acting rather weak and it is Golds 3rd daily cycle….I’d expect downside soon, so gonna stay really frosty on this leveraged trade.
Getting out of trades, is where I think most of us need your help and experience.
Amen, brother.
I think I will always be working on that too…It is due tot he fact that when I trade is going well, and I dont sell 1/2 on the first target, I do not feel that that is greed. But they say Fear and Greed run the markets, and it is very hard to teach or train yourself to sell on the way up. It just feels like it is going to keep going, and we think in terms of “If it keeps going, I will make $XX.XX on this trade”
PERFECT EXAMPLE:
With CGIX – I bought 5000 shares just for a trade at $2.60 area. Dont you think I should have sold 1/2 at $3.20 – Since that is my first target area? yes I should have, but I look at the weekly chart and I say, “What if this is the break out that really runs this one? Maybe I should add?” as it ran to $3.40!! Now CGIX is at $3.00. I missed my first sell point …..due to greed , I guess.
So even I am working on selling. I am better at it when I an looking at things within a cycles frame work.
Buy the ICL and sell 1/2 in the 2nd or 3rd daily cycle peak, but after a very nice run from Dec to Early february, that ‘peak’ was early & thus weak in Miners so far.
It’s an ongoing battle.
CGIX $2.90 now : ) ( Was $3.40 and I didnt sell anything. usually I will sell a % , either 1/4, 1/3, maybe 1/2.
$2.09 is the 50% fibo, I’ll see what happens there. Already thru the 38.2%
I posted a chart above – my target on that chart would be a 38.2% pull back, but I didnt add that on the chart or it would be too cluttered looking.
Its probably nest to have a target on your charts as a reminder to your self to sell a %. I d that sometimes. It helps. Sometimes.
Good idea – in certain set ups.
Thanks, Alex. You are a restless soul!
In response to RONS NAK comment, which he removed before I could reply 🙂
Refresh for a chart from last week.
NAK also broke that trend line
that I drew as a wedge, so that breaks the short term down trend &
confirms your thinking . If it breaks below said trendline / wedge…I
reserve the right to call it a false break out too – lol
https://uploads.disquscdn.com/images/a24d42177904c07a6a2950fe78d34d4790272af1afaadcfe71943cfeaa4db49f.jpg
what was the question…
Rob came on and gave a very good comment about “looking like a trend change, because x moving average crossed above xx moving average , etc. So he said it was a change of trend.
I started to post the trend line break of the wedge as a confirmation of his trend break , and he deleted it.
Rob, Rob, Rob. 🙂
It was simply a bad joke…My Bad. I am so sorry. It was in reference to someone else, not about your trade. Alex, I have sent you an email, but I apologize to the board and to you. A thousand apologies – it was a stupid mistake and I meant no harm…which, after thinking about it, I deleted it. I will think before I post from now on.
I knew what you were saying – you had that if this…I change my mind to this ending : )
It was clear, but it was also kind of accurate & funny – lol
Maria should apologize. #CG
LOL ……
Go sit in time out now …. https://uploads.disquscdn.com/images/a1fd693672bdb915e44a4eb3b9cbc61e6e172a5af1fc92f25aca9d05ca9975b6.jpg
lol .. who is ron?
refresh, It shouldnt say Ron 🙂
But if you must know, I have an Uncle Ronnie
Now I feel like sh*t. Please pretend it didnt happen, all. 🙁
https://uploads.disquscdn.com/images/029bcf0befd4785759742325926db79a32f0af68dcadeec31f34b82bc7f88259.gif
… ha ha… bad rob
would it make u feel better if i posted a pic from lake placid?
*smirk
Refresh
So this is how I was looking at CGIX . I had a $3.20 target , and higher ones using Fib #’s , but I did not expect $3.40 target to get tagged so rapidly and to give it up so rapidly. The first run higher may be finished at this point.
SO if we get this nice orderly pullback, I will be posting it again as a buy- that weekend chart in todays and last weeks reports looks very good.
https://uploads.disquscdn.com/images/0f223126253e5efb131c10ed6888cba9627026d2492ee08ac68c640b3eee03d5.jpg
very nice
CNBX went down to the 50 DMA and is trying to bounce up …
It did, CNBX tagged the EMA 50.
CNBX also tagged the 50 sma & 50sma and is stuck between those 2 Mas and the 10sma overhead.
Sorry, my question is Alex do you find that Momentum (13) 8089 a reliable chart
measurement to use?
I dont use it , I havent back tested it
CF I mentioned OVAS last week. Take a look. Entry 1.55 stop for me under the 20sma
Yes, Looks good. I’d prefer more volume today, but it can pick up in the next few days.
Ive been meaning to ask u about that.. I notice some of the plays we get alerted to (primarily miners and metals) will have almost NO vol at all… quick example and not that theyve been alerted recently, but XRA (I played that) and WRN etc…
It needs to increase if they break & run higher or it is ( In my mind) a lack of real buying pressure and buying can dry up if it doesn’t increase.
Alex, I’m holding NUGT and JNUG from 8.97 and 6.74 respectively. When do I give up? I’m thinking if/when GDX drops below 22. Does that make sense?
Pretty much, that is the 10sma area.
I look at a chart of GLD ( 2 month) and I look at a chart of GDX ( 2 month ) – they are very different side by side, so if I dont see a change in Miners soon, I would just sell the position and keep the gains, rather than wait and stop out.
It looks like Gold may be rising up with light volume & miners are just holding on. It does resemble a bull flag, but I dont get a strong feeling for the good here.
Thanks!
URA looks to be turning down..
Where’s the chater on NAK? Up 13%. Everybody holding here?
Yup, holding
Thanx Bill. Best I can tell ALex is thinking at least the 38%
I have NAK too.
Sorry – I was away, I am holding and yes, in the report here is a chance we get a nice run to $2.00. Could use a trailing stop , as long as it doesnt gap down 🙂
Might be able to play it like I did last time miners took a dive and NAK on a horse: Long NAK and short the rest via JDST. Worked great for a week or two
Buyer’s coming into JNUG here at EOD…
To hold til tomorrow or to sell, that is the question for me now…
I sold, so that probably means you should hold /;^)
haha! had to leave right at close…I sold some right before I left…..I’ll buy some back tomorrow if it acts right …:P
You really cant tell, but I posted earlier today that I was buying it as a bull flag play, I am holding it and would think that GDX GDXJ may retest that 200sma. I may sell there.
Yeah, I saw that you posted that earlier….that’s why I held til end of day at least….sold some, still have some in another acct….but I’ll buy back tomorrow for another pop if it looks right 🙂
GDXJ
Really pick up a head of steam after I sold it for a day trade. Not complaining, just saying. 🙂
I’m holding UGAZ, JNUG, NAK into tomorrow if anyone is wondering
Regular unleveraged holdings like UUUU, CNAB, etc also . NAK is acting leveraged 🙂
.. u mentioned the unmentionables …. :-O
I KNOW- crazy, huh? … scalping is one of the only things working these past few days.
Yes I was wondering, thanx
NAK! Whoo!! Ended up 3x JNUG today. What?!
More fun with “signal trades” … the AH wick from Friday in GDXJ hit today.
I’d love to say that I’m playing along, but I made the classic mistake of setting my stops too tight on Friday and I got stopped out of my JNUG and missed the rally today. I get the “Idiot of the Day” award. 🙁
https://uploads.disquscdn.com/images/a537f34075a96f9e21623682221042be047f1a7e9ab56475ed55abba69f6ba61.png
dang… here i thought we were going to make it through an entire day old school style …. ;o)
#TinFoilHats
*smirk
Sorry
no apology necessary 😉
I’m just an old school technical kinda gal … no tinfoil hats for me … ;o)
Then where is your overlay chart or E.W. chart for GDX Ma Weeh Ah?
😉 yes i know ive been slacking… ill get on it daddy …
mine look like urs .. ;o) now that u r an EW chartist….
giggle
#ClosetEW
I call it an Alex wave, it goes 5 up and 3 back.
Why, did someone named Elliot see that too – I didnt realize that- LOL
yes .. Ron .. .Ron Elliott
… this is my style ‘hat’ …
ha ha ha
https://uploads.disquscdn.com/images/da85fe8f9ee9ec8fbda0171c4e5a935f8913407244019d57fd914762423a2c54.jpg
Nice, a 10 gallon hat ( Or is that a 50 gallon hat)
Reminds me of the old Turd Furgeson gold website I used to peruse back in the day.
Kind of funny – i thought that the hand on Mr. Blues arm was yours, like you were clutching him by the bicep. Then I saw what would have been your 3rd arm at your waist -LOL
Magic
Just to be clear, I don’t actually trade based on those candles but I find them interesting to watch.
Evans from The Fed spoke .. spooked the markets, market down, I sold my Jnug early before the run up ..and it got smacked down from 7.27 now to 7.02 AH…. With gold moving up higher junior miners look sluggish. Alex is right , time to be cautious. Wait for ICL for safe trade. Been here for awhile since Dec . My first post.
welcome….. to the crazy train 😉
Hey, nice to hear from you David, and you probably rode that ICL higher from December to Feb huh?
The run from an ICL can make your year that much better, but you need to have funds to play 🙂
Good advice.
I also follow EW with Cycles… Bennett (Likesmoney) and Husrt cycles with varying methods to track sentiment. Most are in consenus…. Gold should top here with miners for a week as USD hits its dcl ..then US dollar rolls over …. as USD tops, Gold/miners bottom temporarily and we have a little run until April15 or later till end of the month for ICL in gold…… Yellen speaks Thursday PMI out on Friday….on the sidelines for metals by wednesday at the latest….
NOTE: I have noticed that when something runs higher into the close like GDX & GDXJ did today, you can often sell them in after hrs for more than the closing bid/ask if Gold drifts higher tonight. You will see both begin to rise after 4:15ish…. IF GOLD CONTINUES TO RISE IN A.H.
I say ‘Usually’, not always.
This is just in case someone held on and is worried about a gap down tomorrow and would like to sell. You can keep an eye on that. To sell, sometimes you just have to put your sell at the ‘bid’, and your out before you know it.
I am taking my chances and holding at this point.
So when I started watching, JNUG BID/ASK was $6.97 / $6.98 around 4 o4 P.M.
Currently it has creeped up to Bid $7.07 / Ask $7.08
You could sell at $7.07 by putting in a limit after hrs at $7.07- but also it may just keep climbing.
hmmm …. oh my … that would be just terrible if it gapped up huge in the morning …..
*said no one ever
;o) giddyup
I’m staying with my measly 25% invested, looking to buy more miners when and if they get smashed, even if it occurs from higher prices.
… here is my old natty chart posted earlier with support/resistance line … aka – my rendition of crazy .. ;o)
ken … sog .. other Elliottwavers… please do comment on the count.. nothing in stone.. just my first count…
check out how CLOSELY the pattern is repeating.. not sure if it will duplicate … but it’s stark reminder to me that what happened on the last impulse up …. hmmmmm …
https://www.tradingview.com/x/My3ZwrF5/
Maria, cool. What is the yellow pattern? I cant figure out sorry.
giggle.. here… this might help…(below)
that is just an ‘exact copy’ of the candlesticks from Jan 2016 and pasted them onto the current move…
look at all the ‘red’ touches … so far the pattern is a near exact replica … sooo .. I am questioning .. hmmm… are we now repeating the impulse move UP ..
ie. are we in 1, 2 … of a giant wave to come????
does that make it worse? LOL … sometimes it’s difficult to corral my thoughts and push them down the tunnel from my brain to my fingertips ;o)
https://www.tradingview.com/x/Vus8o651/
Maria, very cool. The huge move started mid-May 2016. Nice observation, and I will watch this going forward. How did you find this?
with my super duper xray eyes … scanning for patterns that sometimes repeat …;o)
Maria, we are in a new daily cycle in Ng confirmed today. So we should get a good run here . It will top out end if April early May. In terms of EW we are going to get ICL with bottom of wave 2 in end of July . That is when you willget the big wave 3 run up. Now we have a b c movement . Hope it helps.
very nice .. thank u… can u show me a chart? what do u expect for a high of ‘b’ …
Alex, I’m looking at some of the solars’ weekly charts now and seems like some look like they might be ready to move a bit (JASO), some have a decent base (VSLR) and others look like stinky meatballs (FSLR). Got any solars on your watchlist that have piqued your interest of late?
Gold getting dumped tonight
I just saw that. Ugh. Wed last week was solid. But I need some more time on this ‘bounce’. Want to make out more of the recent selloff back. Many of my “core” positions are WAY to in the red for my liking.
Double ugh…I have way too many metal positions red.
My JNUG is alright but I have a couple of recent “loser” miners really holding me back. 🙁
Northern Dynasty Provides Update on EPA Discussions
Files Joint Motion with EPA to Extend Stay of Proceedings to May 4, 2017
VANCOUVER – March 20, 2017 – Northern Dynasty Minerals Ltd. (TSX: NDM; NYSE MKT: NAK) (“Northern Dynasty” or the “Company”) announces that its wholly-owned subsidiary, Alaska-based Pebble Limited Partnership (“Pebble Partnership” or “PLP”) and the US Environmental Protection Agency (“EPA”) have filed a Joint Motion in federal court to extend a stay of proceedings in ongoing litigation under the Federal Advisory Committee Act (“FACA”) to May 4, 2017 in the interest of resolving the matter.
The Company has made substantial progress in recent discussions with the EPA and intends to continue negotiating the matter directly, rather than through mediation. Government representatives are actively engaged in these discussions and, along with the Pebble Partnership, are focused on achieving a resolution that will be agreeable to both parties. In the meantime, the Court’s Preliminary Injunction of November 25, 2014, will remain in effect for the duration of any stay.
This seems like a good chart to me. https://uploads.disquscdn.com/images/b0746e995772ba9115bd3ad0c74334651485e7ba3f1db6660dffeb86b0126d4f.jpg
I like the chart too / Energy ( they did just do a 1:20 reverse split in Jan though)
Gold fighting back a bit from the big dump it took about 9PM Eastern last night. Issue is with DXY down .5% and breaking below century mark, why is gold down in tandem? Not good.