
Post Fed Explosions
We got a Fed rate decision, and we got some Fed Decision follow through. It clears things up in the short tern time frame and makes it easier to see what is going on,. Let’s see what Wednesday brought our way.
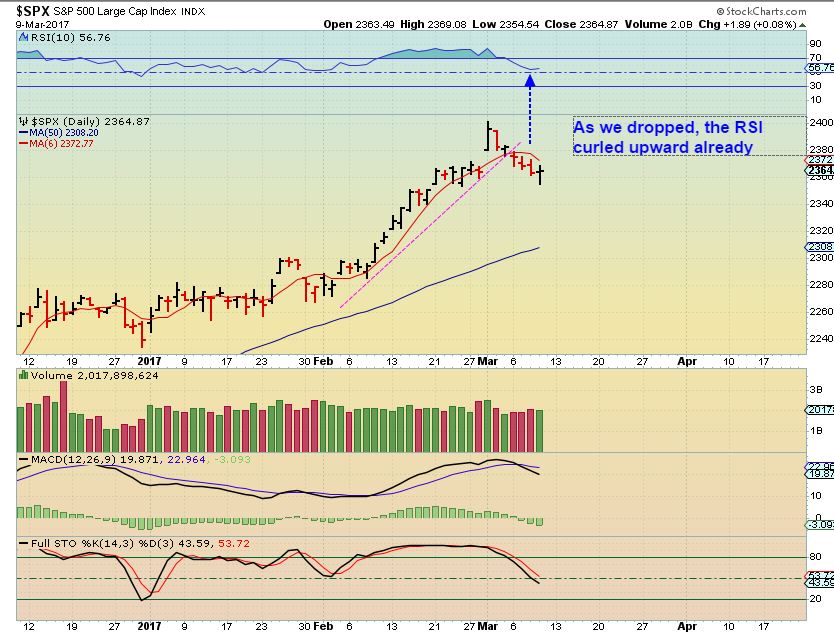
SPX March 9 – I was looking for a shallow DCL The RSI started curling upward while price was dropping…
SPX MARCH 10 – A swing formed and the dcl was due and likely in place.
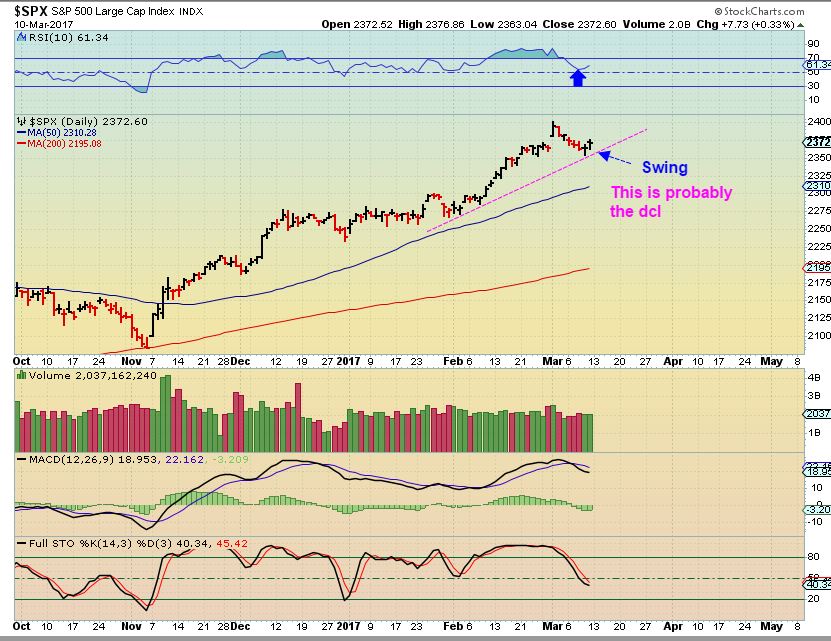
Now we have a confirmed DCL, as seen here
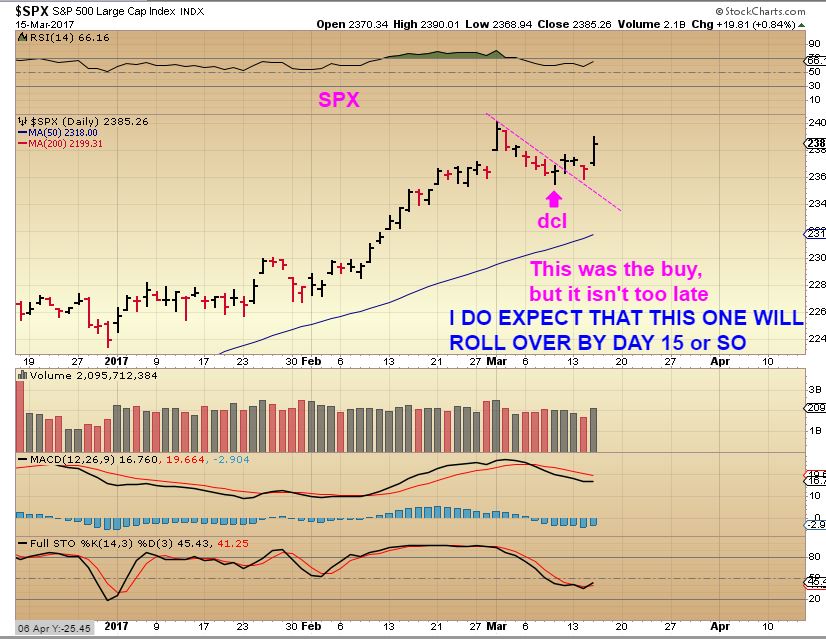
SPX WEDNESDAY MARCH 15th – I expect this to be a left translated daily cycle, so it could peak in 2 weeks or so, so be aware of that if you went long ( Some trade TQQQ, UPRO, or other leveraged vehicles, and I don’t consider them all that risky, since their movement is limited daily). $2500?
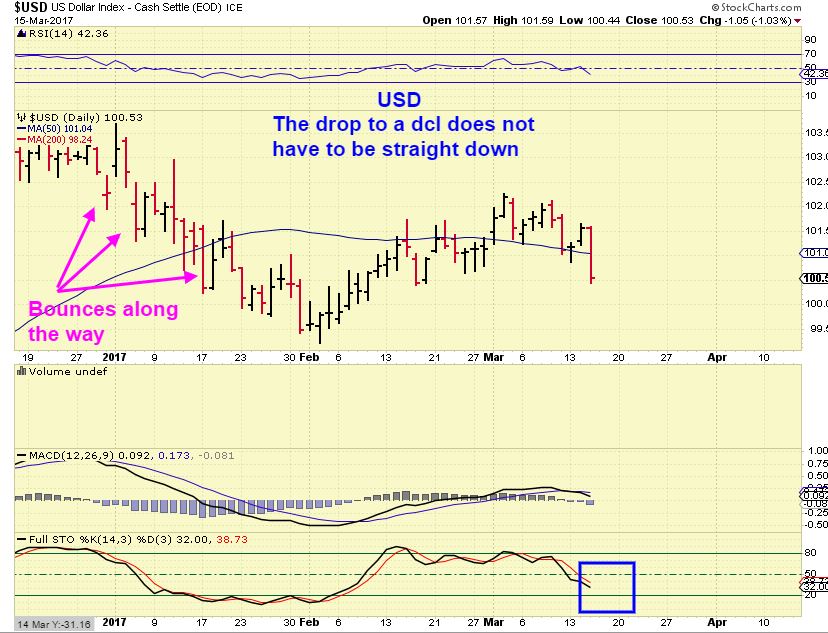
USD MARCH 10th – Expecting a drop to a dcl, and then a good bounce, I drew this for the weekend report.
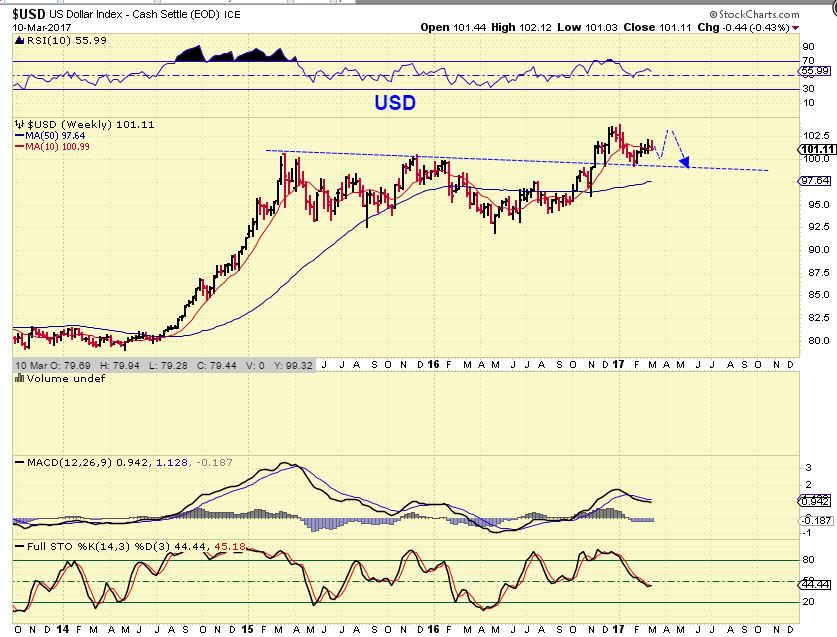
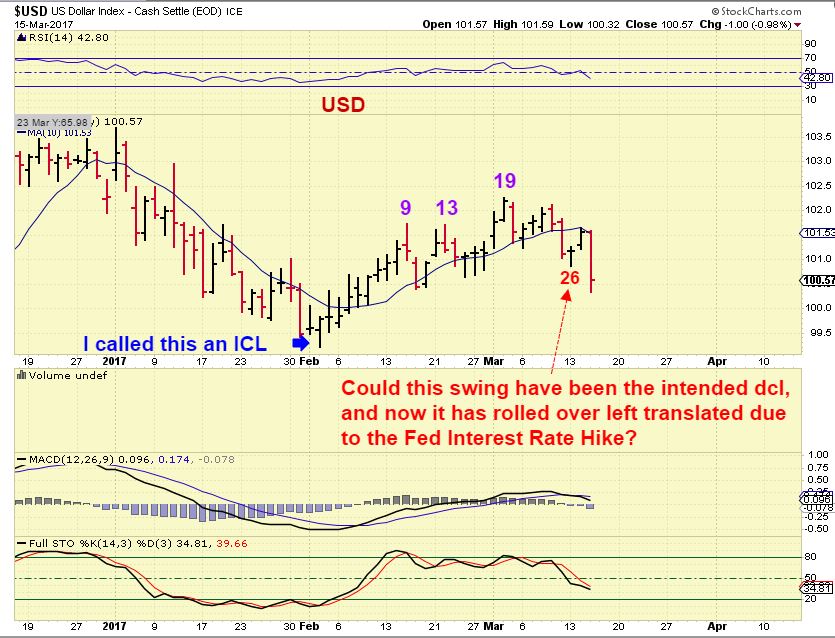
USD FED WEDNESDAY – The USD is due for a dcl, but that wasn’t one that started on Monday. The FED rate hike did not provide a confirmed swing low with follow through from Monday and Tuesdays move higher. The USD lost the 50sma.
NOTE ON THE USD:
USD – The usd usually bottoms by now, so should I be open to the idea that MAYBE the USD was putting in the dcl at day 26 and the Fed crushed it? When I looked at this I started thinking “what if..?”, but if this is GOLDs 3rd daily cycle, it should drop into an ICL in the next month or two. If this Dollar did put in a dcl it would be on day 3 of a 20+ day drop, and Golds 3rd daily cycle seems like it would be extra strong, so I tend to doubt it. More in the weekend report. Gold was also in the timing for a dcl, it would be on day 3 of a new 3rd daily cycle that should top in roughly 2 weeks.
NOTE: I do NOT like to ‘guess’ and ‘hope’ and ‘form a bias’ in any way when I am considering future action in the markets, but I will entertain a plausible idea and keep an open mind and a cautious eye on a possible rapid change like that. I have been saying since before the Dec lows that I thought the USD would eventually roll over in 2017 and Gold would rally strongly , so we just need to see how things play out with this interest rate hike .
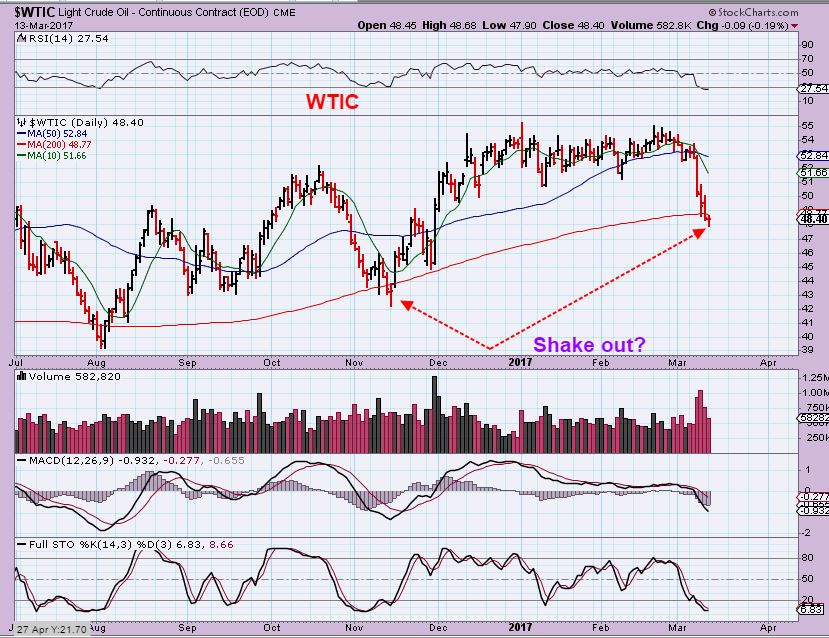
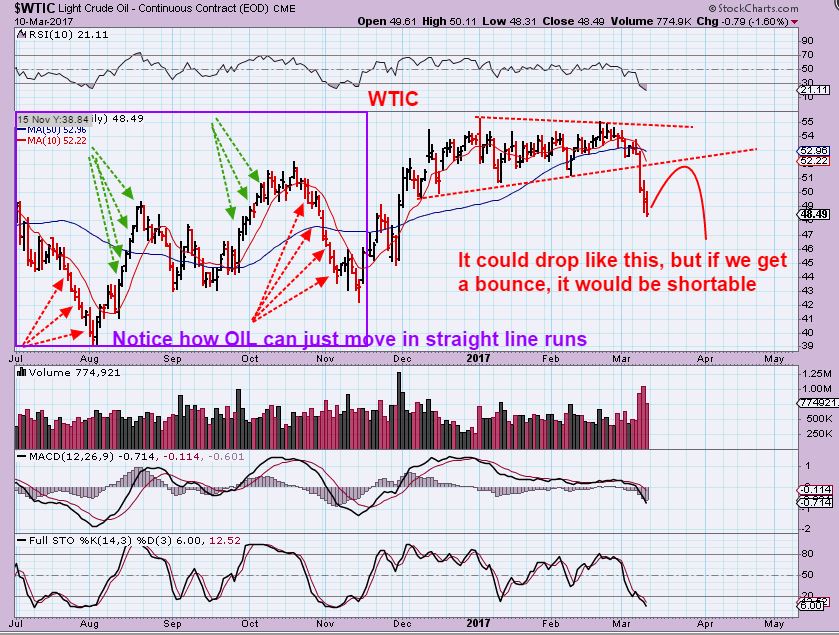
WTIC – My MARCH 13 chart – I pointed to a possible shake out and a low in Oil? We have seen that in the last 2 lows.
WTIC – recovered the 200sma. I have not changed my mind on Oil howver, and that was…
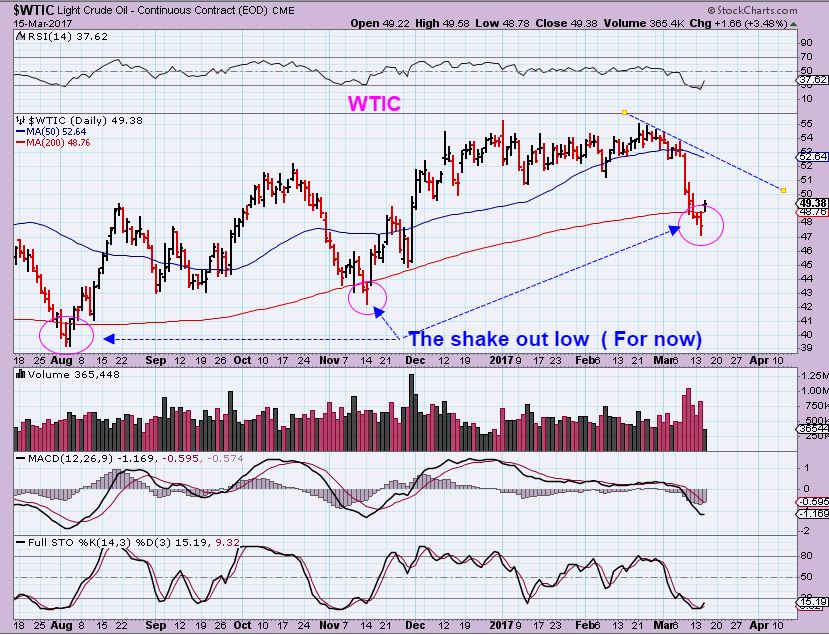
This could be a short-able bounce. I will explain more in the weekend report, but I actually already have explained this in prior reports. I’m saying this again because I have had readers tell me that they think these are THE LOWS for OIL and want to go long until Oil hits $70. I disagree, but that is perfectly fine, you can go long if you honor stops.
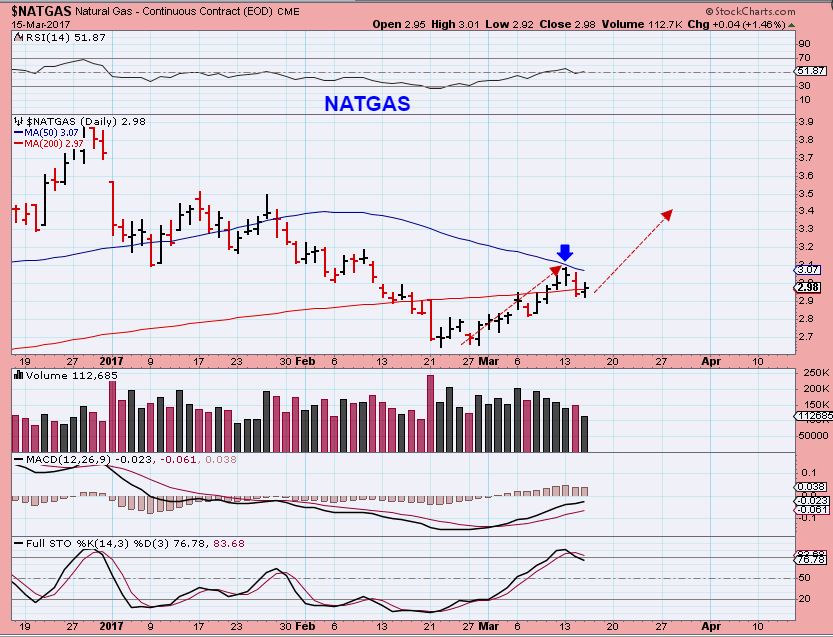
NATGAS – I mentioned that I liked the set up in Natgas at the lows in late Feb and mentioned on March 10 that a stop would help.
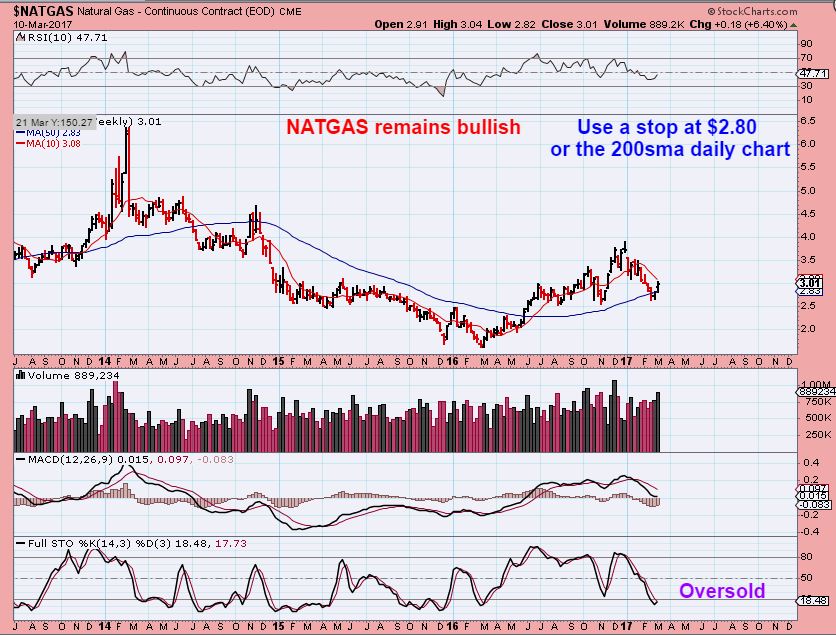
NATGAS – Wow, Natty almost hit that $2.80 area ( my stop above), but then reversed higher. I hope to see immediate follow through after this dip.
.
GOLD & MINERS
.
This was the intraday action after the Fed Interest rate hike.

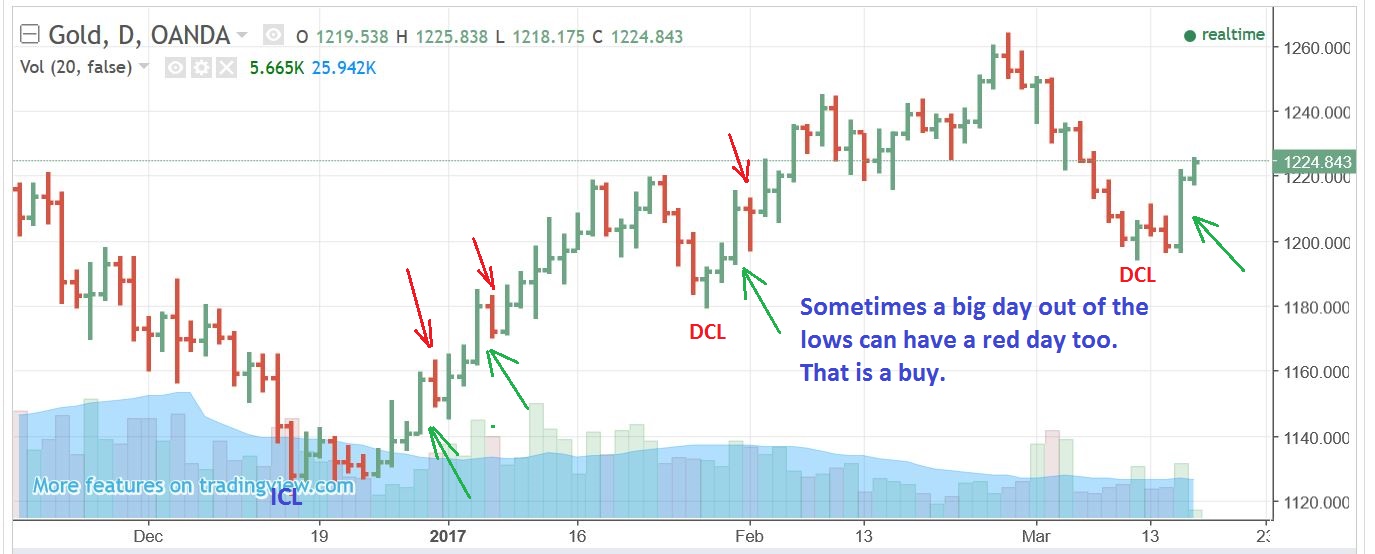
GOLD – This was Golds reaction on a daily chart, and this would be day 3 of a new daily cycle. If Thursday is RED, is it a bad sign? A sign of weakness? A head fake? Or normal profit taking?…
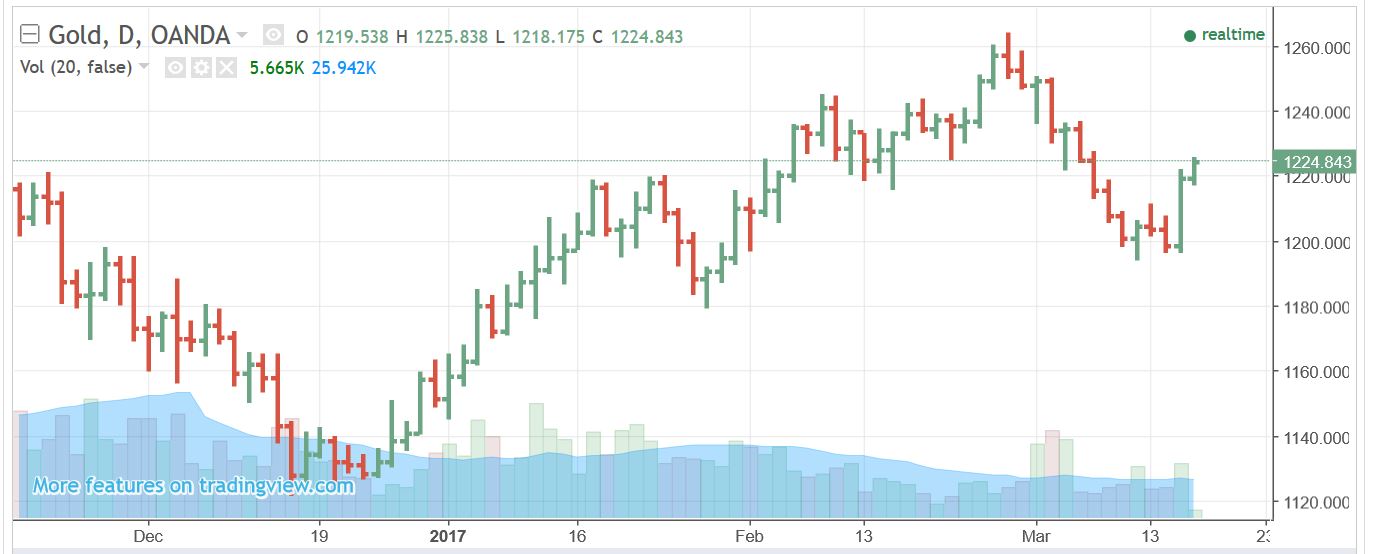
Notice that sometimes a strong day is followed by a red day but price can still go higher over time. If Gold sold down Thursday, it could be normal profit taking early in a new daily cycle.
GOLD – I will need to discuss this in the weekend report, but this is to attempt to remember short term & longer term expectations .
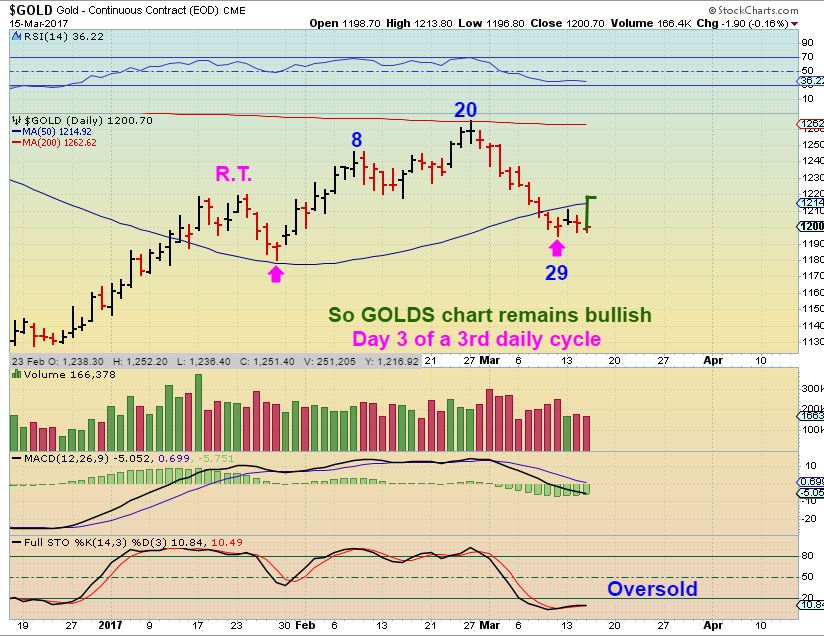
I had to draw the surge in price on this next chart below, because Stockcharts was showing that Gold closed down $1.90? This chart shows the continuing process of this intermediate cycle, and can keep up from getting TOO bullish until we see this play out. REMEBER that I am expecting an ICL in April or May, and this seems too early to be an ICL ( But a FED HIKE might shake things up- time is the best story teller). Let’s look at reminders:
1. We know that Miners sold off hard and formed a left translated 2nd daily cycle, so we would expect a downtrend in miners. Miners should not make new highs.
2. Gold did not do that, and that has been the conundrum. Let’s discuss what Gold and Silver have done and what expectations could be.
GOLD – Gold itself has 2 right translated daily cycles, so with that, you would expect the 3rd daily cycle to break to new highs. Will Gold break the 200sma? Miners were weak through February and the USD was strong, so this added to the puzzle. This drop below the 50 sma started following the ugliness of the Miners and the USD was looking strong. Now the USD took a hit, and Gold surged. At the start of a new daily cycle under these conditions, I would still take a position and watch how this plays out, WITH A SHORT TERM TRADE IN VIEW. SOME may want to wait for an ICL later this spring, I THINK that this is too early for an ICL in Miners.
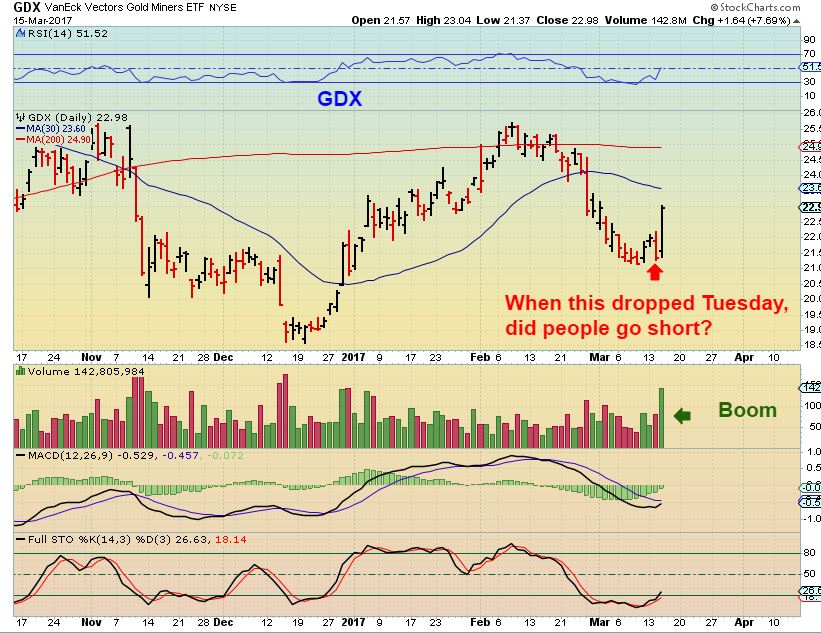
As confusing as the Miners large drop was, look at that surge today with the Fed Rate Hike.
7.6% for GDX with 142 million in volume is huge. It is still oversold, so taking a position in oversold Miners seems fairly safe and we can watch this going forward cautiously. Tuesdays drop (red arrow) may have encouraged people to think that Shorting was the next step, see the chart, so part of this could be short covering.
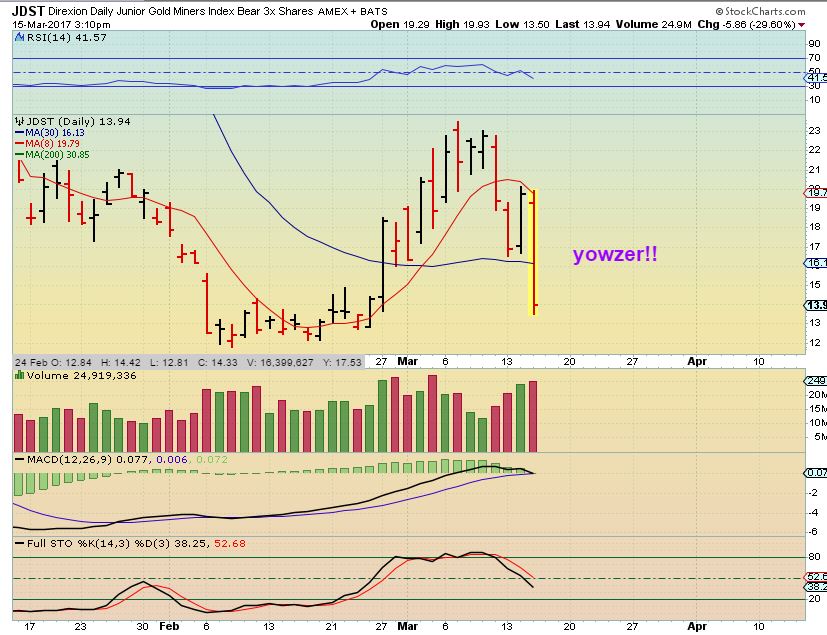
Many expected Miners to just drop, so I posted this chart of JDST and mentioned that this reversal may have looked bullish, but a FED DAY can flip this right around. Both BULL and Bears needed to be cautious with the recent set up going into the Fed Mtg.
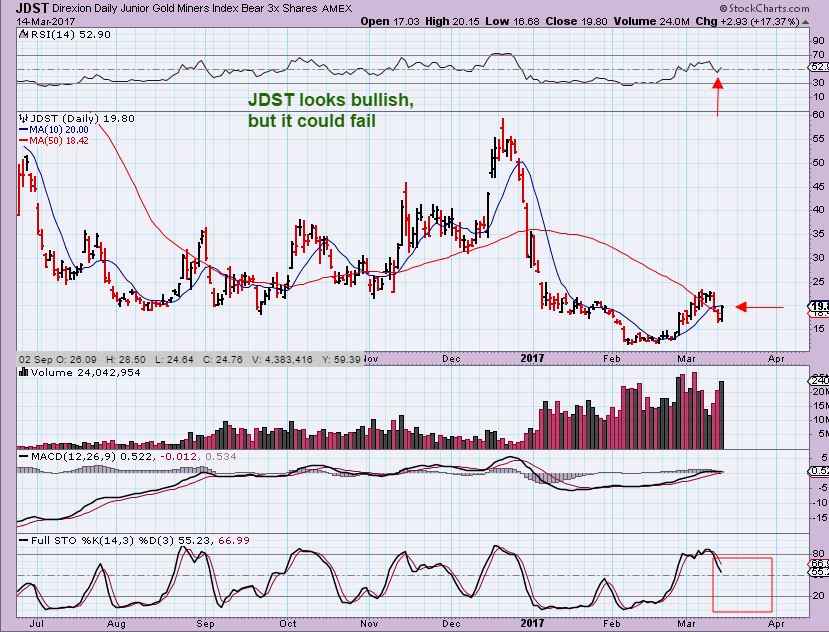
JDST was down 30% at 3:10 p.m. and closed down 34%! Holding JDST for the last 4 days just about got cut in half. Another reminder that even bullish looking 3X ETF set ups are dangerous to buy & hold.
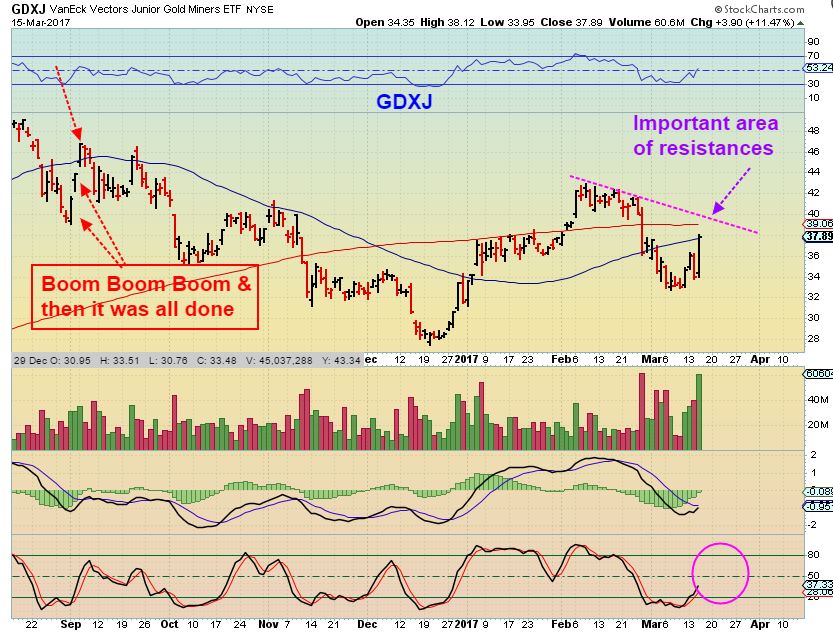
GDXJ – I’m going to add another Cautionary note, even though this looks excellent. Bear market rallies are often short covering and look excellent too, so going forward I remain alert and cautious. MY STOP is Fed lows and I will raise it over time. At this point we see a confirmed swing low in GOLD , SILVER, and MINERS so buying positions is likely a good trade for at least a week or so, but let me point out that bear market rally last September. 3 huge bullish looking days – Boom Boom Boom out of a dcl and the top was in. We will watch how this plays out, resistance is shown overhead in the chart.
Obviously, the Rate Hike made clear that the DCL due in Gold & Miners is now in. Many will not turn extremely bullish and think that the precious metals can run to the moon with Fed Rate hikes. We know that a 3rd daily cycle can peak L.T. and that could be around day 8-12, so let’s watch how things play out and I’ll cover more in the weekend report ( we have time). Some individual Miners are still near lows and may be worth a scalp. Enjoy your trading Thursday & Friday.
.
~ALEX
.
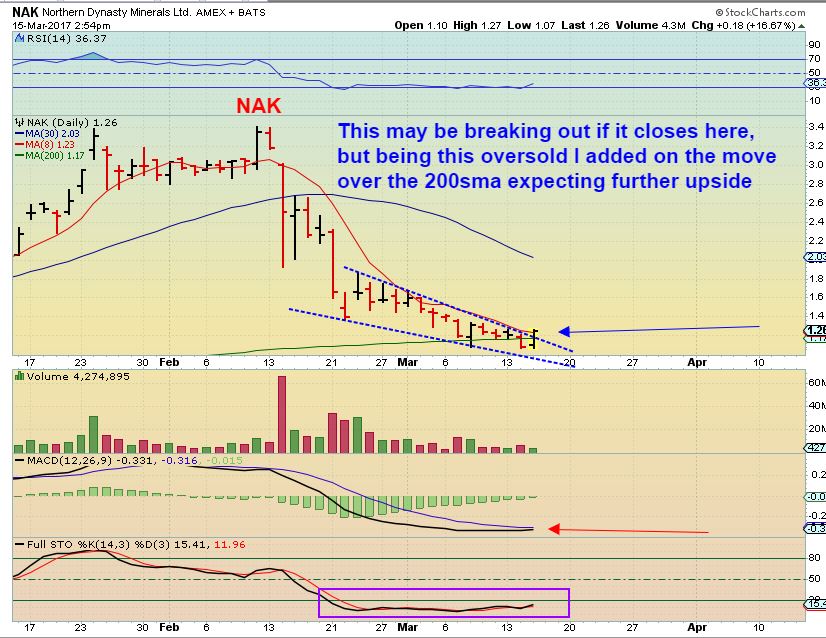
NAK- NAK started breaking higher from that falling wedge that I pointed out, regaining the 200sma.
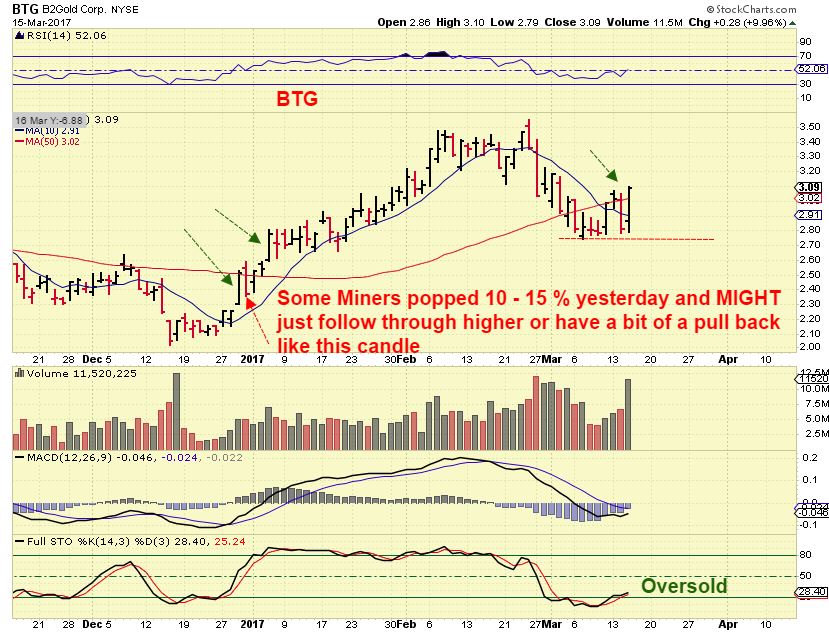
BTG – Many individual Miners shot up 10-15%. They CAN just run higher in a few ‘short covering’ type days in Miners, or you can see a red day, as shown. The trades in Miners are only to be viewed as trades for the next 6- 8 days or so and then we need to really review things .
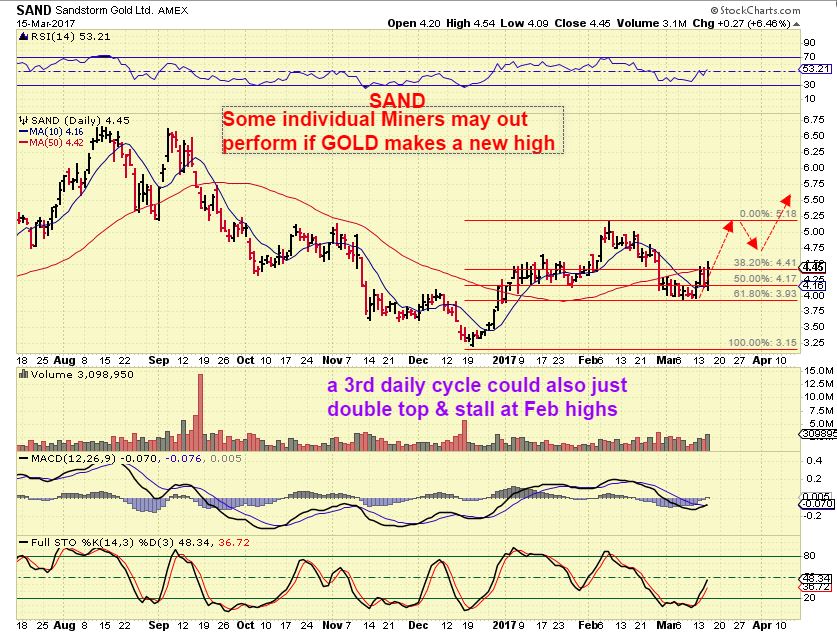
SAND – At a 3rd DCL, I might take a position and expect only a double top with FEB highs, but it is still a decent quick ‘trade’.
People always ask me, “DID YOU BUY?”. It is important to know that I dont just jump in because price pops, I usually am watching many things and one of those things is, “How is it acting on a 5 minute, 15 minute, 30 minute time frame too.” I watch for smaller time signs of strength or a false rally. This rally did NOT look false ayt any point after the Fed Rate Hike. Let’s take a look at JNUG ( GDX< GDXJ< and MANY MINERS Looked this way) for example.
I often show my thinking here on my intra-day charts when I’m look for a possible entry , and this is another example. This is JUNG and it was slowly climbing higher all morning long. I was gone all day helping family, so when I got home at 1 p.m. – I looked for signs of what the day already showed. It was a Fed day, so it could end in any direction, but we had an orderly rising channel going into 2 p.m. Price then broke out higher at 2 p.m. ( That can be a ‘buy’ with a mental stop at your blue channel in case it was a false pop. Then it stalled and bull flagged, that can be an easy entry. BUY The flag, and sell if it breaks down. GDXJ ( and JNUG) just continued higher until the close.

Then Switching back to the daily chart showed a very strong day on the Fed Rate Hike. When I say that we could get a pull back today, it can be a back test of that flag believe it or not, so I still watch smaller time frames with my daily chart. THAT is how I trade short term.
OTHER TRADE POSSIBILITIES
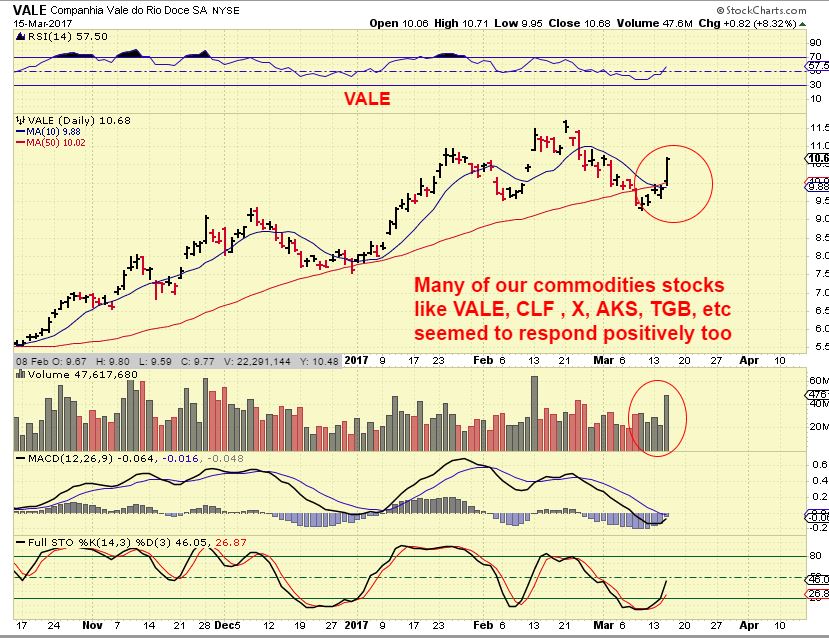
VALE – With the General markets now set to go higher, many of the commodities seemed to have perked up. Some might view these as safer than Miners in a 3rd daily cycle, so the choice is there. Please read the chart.
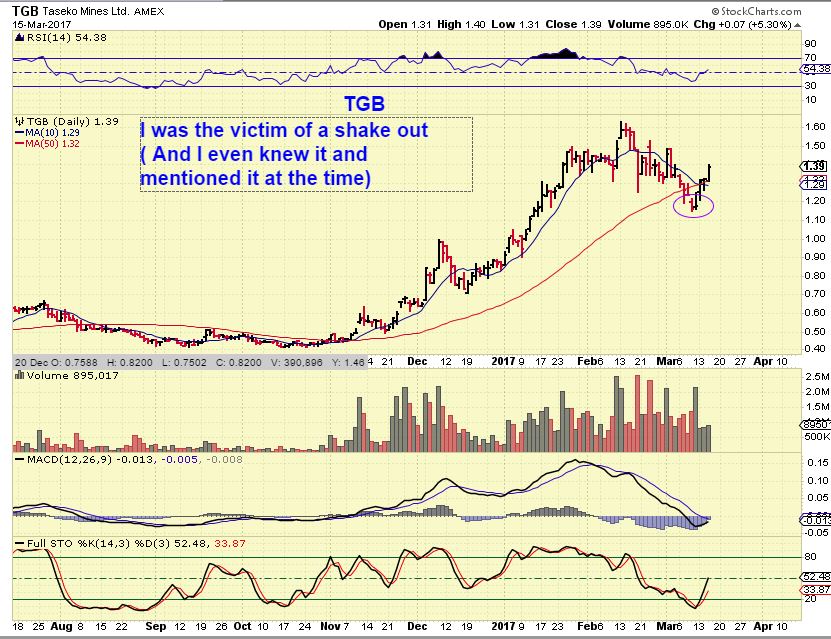
TGB – I drew a bottom trend line and price landed on it under the 50sma. I said, “This could be the low, but I have to sell because we are under the 50sma for 2 days”, and yes- I sold the low on a shake out. THAT doesn’t stop me from saying, This could be a good trade over then next week or two. It just went from $1.15 to $1.40. 🙂
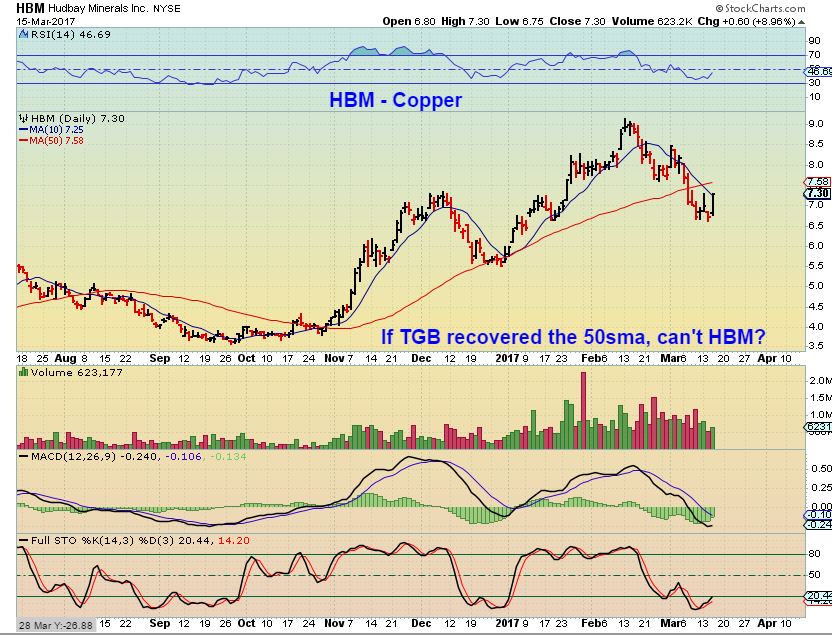
HBM – Buy with a stop at recent lows thinking that it will recover like TGB ( Copper stocks) OR , wait and buy as it crosses the 200sma.
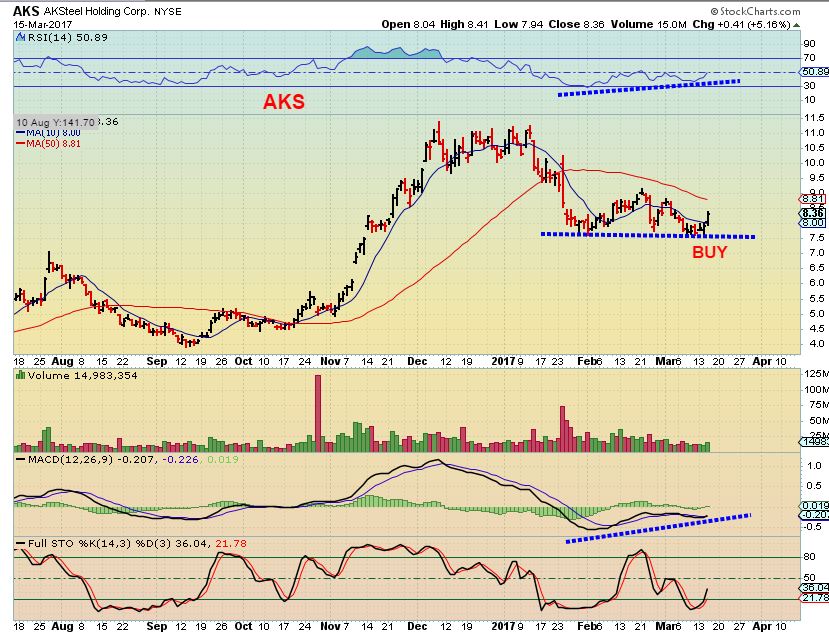
AKS – good divergence


Thx Alex! I was out with my boys skiing upper state NY so I missed all the fun action! Do you see a possibility of a blow off top in the general markets or an orderly rise to a LT cycle? Really want to jump in (miners) but I’ll do my darnedest to wait for the ICL…emotional trades never seem to work for me.
Could be either or both at the same time.
I went to look up KGC as I was scrolling through my Miners list, and I typed in KCG. WOW what a difference 🙂
I added one more chart to the END of this report, that I forgot to upload earlier. Please scroll up
Alex, We haven’t seen a move like this one in gold for this whole intermediate cycle – this rally seems strong for a 3rd daily cycle? Perhaps Gary S. is correct and we have started a new IC in metals? it would match with a failed dollar cycle? thanks.
People get emotional when they see something that looks exciting. I’ve seen that emotional reaction over and over and over bite certain ones in the butt, because they blurr their vision with guessing. Anything is possible with markets, but guessing that an ICL took place after 3 months would be a first time ever having an ICL come after 2 right translated daily cycles in Gold. As far as I can see, yesterdays POP was great, but many were short and it could be short covering mixed with buying that fades out..
So lets look back, any BIG surges come to mind that came at the start of a daily cycle low and actually were just days from Topping? I’ve seen plenty.
Refresh
https://uploads.disquscdn.com/images/0d9851e1e5716792dd1bcbae9959a2da7a3cc69b7bd7c4917cc5b148da543c4f.jpg
Quite right – thanks for keeping my emotions in check 🙂
I’m really just always trying to keep MINE in check 🙂
Who doesnt love a good strong rally and want to jump all in and just let it ride for weeks? – I DO!
BUt on the chart above, if you even just look at the 2 little red arrows, those were late in a cycle , they were great pops, but they lasted 2 days and buying & holding those would result in losses, so I just always try to patiently take trades as they present themselves, but remain as cautious as I was in the weekend report with all that we have just seen.
That 1 day large slam down in Miners was a week ago Monday, and everyone HATED Miners all of a sudden, and said they wouldn’t trade them until the end of May. Now those same traders are in JNUG.
The markets are very good at swaying people quickly. ; – ) I’ll take it step by step at this point.
Thanks, Alex. I’m trying not to chase. 🙂 Every time I got too enthusiastic, I got burned. No exception.
I’m trading it, but I have to approach it as just a trade set up, and cautious as we enter a 3rd daily cycle.
Lets say a stock jumps from $8 – $10 and then rolls over, you catch a good trade, maybe you kept $8 to $9.50. If it jumps $8 to $10 – you sell and then it keeps going to $12 and something really bullish took place & changed with the Rate hike, it could then pull back from $12 to $10 & you get back in where you got out & you have a bit more conviction going forward
The reason that I dont think “Something changed in a big way” with the Miners and the rate hike is that the rate hike was almost 100% expected and hinted at by the Fed. The selling going into it was a dcl, and now a nice reaction, but I dont see anything fundamental as changing. Time will tell and we’ll try to play things out to our benefit.
If an ICL is coming later this spring, HUE benefit of buying that one and just riding it for weeks and weeks. That will be a great trade! If this turned into a very short cycled drop into an ICL yesterday—-we will know that soon enough too, and still have weeks and weeks to ride it higher, so it will be a win – one way or the other 🙂
Thanks, Alex. I will be a day trader for a while. 🙂
Thx Alex!
I’m new to cycles, thanks for the clear explanations!
Love your frankness and explaining your thought process as you approach these markets.
Looks like gold is starting to stretch it’s legs up about $13 as I post.
Good news for dip buyers: GDXJ/JNUG shaping up to be a “sell” (down price trend) at the open. Not quite there yet, but moving in that direction.
Steve, please let us know asap. 🙂 I will watch it myself. Thanks a lot.
As of now, the “sell” signal is NOT on as price is moving up pre-market. Have to wait for the open to see what happens. https://uploads.disquscdn.com/images/b6e7b0d926bb619c0cd4f0fca50a1eeecfb5d4273885b0e834e0cf6b8b5705eb.gif
Massive “signal trade” candle this morning in JDST with a high of $17.90 which is the Fed news break-out area from yesterday. This would indicate the Boyz are REALLY going to try and slam JNUG hard today, as yesterday’s AH “signal trade” candles indicated. Grab your popcorn, should be a good show today.
https://uploads.disquscdn.com/images/b6e7b0d926bb619c0cd4f0fca50a1eeecfb5d4273885b0e834e0cf6b8b5705eb.gif
https://uploads.disquscdn.com/images/2b8e90d2f15e83c6d0f5f4b1c124b5899f99065e748691b5e6866163778e86c7.png
it’s happening. 🙂
Another “signal trade” candle this morning for NUGT. I’m expecting “slam-o-rama” in miners today.
https://uploads.disquscdn.com/images/707f047afc3832091ea3621ce17c10d1fc7a9ec94d02d1fc061fb3bf45716716.png a
GDXJ/JNUG now a “sell” on my 15 min chart … here we go!
Wow, unbelievable.
Actually, this is quite common after a BIG up day in miners.
Stay frosty folks!…
GDXJ hit the top of env channel and dropped.. which i would suggest it needs to clear, in order to turn bullish.
check out the bear drop red arrows for comparison.
https://uploads.disquscdn.com/images/194ce7a538fefeedbcce279c4ada3e1383901d84d5f319a8ea97488b02278140.jpg
SOG how are you positioned now? You have had good instincts on miners lately.
i just own NAK & WRN now.. with some UUUU & a lil’ bit of URRE
Hey SOG….what is the price at the top of the channel? 🙂
currently at 38.61
SOG, If you could/wouldn’t mind what device/indicator are you using for the for your env. channel? TIA
4H chart… 65ema… E Env Ch 65/4.6
Just to be clear, I am NOT bearish on miners right now. IMO a fairly deep pullback is expected after a massive rally.
Steve, you’re very clear and helpful. Thank you.
I gotta cut back on the posts … too much coffee! LOL I don’t want to monopolize the comments section. This is Alex’s site!
I like Alex’s advice. But yours is straight-forward for me, who is an amateur. 🙂
Please follow ALEX he is “The Master!” My posts should be considered extra “food for thought” not trading advice.
FYI … I’m playing the “Big Boyz” game … I have limit buy orders for JNUG slightly above yesterday’s signal trade targets of $6.75 and $6.53 Let’s see if they hit today. https://uploads.disquscdn.com/images/b6e7b0d926bb619c0cd4f0fca50a1eeecfb5d4273885b0e834e0cf6b8b5705eb.gif
Nicely done Steve! Keep ’em coming.
Not to suggest this is gonna happen again, as it was a different time & place … buttt… ive always been wary of Fed Day rallies since this little beauty (showing GDXJ) from Sept2013 🙂
i got sucked in, as did the venerable Clive Maund, who i remember declaring the next day, that it was the end of the bear market correction in PMs.. within 2 days, the gains had all but disappeared.
https://uploads.disquscdn.com/images/6c00cc7b24694f33b3d58bf5ee398d648818ac462d25db44185db870461c2418.jpg
Exactly SOG : And what was that….a whipsaw dcl starting the 3rd daily cycle ?? : ) HMMMM
Right where we are now.
I remember that one too, I think almost everyone does that traded daily at that time.
That is why I remain cautious in the middle of an investor cycle and I may trade it, but I allow it to play out without getting emotionally attached. I remember MANY fell in love with that one and rode that thing down
Good point … and I will also add that JNUG still has a bearish price target of $0 on the P&F chart:
http://stockcharts.com/freecharts/pnf.php?c=JNUG,PHTADANRBO
So you should never get too comfortable.
On the other hand, GDXJ has been in an UP trend since March 10 and is currently a “buy” on my daily chart, whereas GDXJ was clearly in a DOWN price trend prior to that Fed day pop. Just my https://uploads.disquscdn.com/images/97b39c0f52bb54d7a81d91ddc8df4b2623e238b4283730b39131f94defe18198.gif
Add to that that you now had a big boy JDST target near $18. Tricky times.
Yeah, I’m pretty heavy in JNUG right now but it’s on a tight leash. I won’t ride it any longer than my charts remain bullish, “playing it day by day” as you always taught me. 🙂
And the 3x etfs do not make it easy 🙂
Maund do not follow, imo. I know a former techie who handled his newsletter and the guy had no money failing terribly at his trades.
Steve…on my 15 min chart JNUG just had a tail down to 6.71. Interesting.
I don’t see that one my trading chart in Schwab. Sneaky bastards! LOL
BTW, just because “they” TRY to force price down does not necessarily mean they will succeed. PM traders are genetically predisposed to BTFD.
I don’t either on two different platforms. Though I saw the one just after close two days ago…
I use Optionsxpress charts [Schwab bought them]…what does yours say the low of the day is?
my chart low is 7.12. Yours?
Me too, LOD for JNUG so far is $7.12
I use 2 platforms. On Merrill but low is listed as 7.12….but on Options Express it says 6.71….but the candle tail is gone now. Over on the left where the general data is listed, it still says 6.71.Wish I knew how to copy it. LOL
Wow. Sneaky bastards is right!!! LOL Maybe they’re signalling each other across different platforms rotating depending on day/time?? Theories are endless 🙂
LOL..So true! But it is infuriating when you see it with your own eyes and the POOF…. it is gone! But this time they left the number reached over on the side, at least for now…”they” will probably erase it any minute just to make me feel I am even more crazy! LOL
Agreed. LOL. can you do a screen shot?
Don’t know how! I just barely figured out how to add my picture here just the other day after a year here with Alex! I am an artist…def not a computer/tech person!
simply hit “PrintScr” button on the upper right corner, and then paste here. 🙂
No such button. I looked. I use opx java streaming individual charts. Sorry.
it’s on your computer, not software.
Thanks YS…I tried. I found how, saved it but when I tried to open the shot I had captured…it won’t allow it as it is not allowed by OPX.
Got it, maybe that’s proprietary 🙂
I think so…but I appreciate the suggestion as I did not know how to take a “screen shot”. I’ll try again later with something less likely to be proprietary.
Ok, let me jump in on the conspiracy board too…
Keep track of what time you saw it ( 11 a.m.?). Maybe each day at 11 a.m. they send out a signal trade target that they erase a minute later. You should refresh every morning at 11 a.m. and get the signal before it fades after a 1 minute.
🙂
LOL Too much work!
Good plan. I’ll keep an eye out just after market close. That’s when my massive wick appeared, then transaction ‘cancelled’, then wick disappeared.
I think it was about 10:30-10:45 judging by when I first posted to Steve.
https://uploads.disquscdn.com/images/b025b6c56d4fc1df9401941db58d2db5808cc15985486ac078a8530bdfef9520.gif
LOL!!! LMAO!!
LOLOLO! Appropriate! Now you know how I feel when you start with your EW ups/downs.
hahahaha!
LOLOLOL
so funny you!
Don’t think Mr Miyagi is going to like the competition https://uploads.disquscdn.com/images/03bc7f9d6a040c3410f59d88885906072d339fb58c0f388ba5a5480842140078.png
Volcanic rumblings on Mt URRE?…
im getting some early warnings on the seismograph, although it could just be a damp squib after that big peak that needed correcting.
Nice double landing on the 200sma. I bought UUUU around its 200sma recently.
I need to go google DAMP SQUIB – lol
hadnt realized it was just an English/Auz expression 🙂
URRE needs some follow thru. Feel like Ive been in this trade for weeks and its jsut been days. lol
im hoping its not a fake out break…
Good morning my dears…..
As this morning I read and take heed….
“A GURU once said before….During the bottoming process in the gold miners, the bulls and the bears will get frustrated and exhausted until such time that they will finally give up and do not want anything to do with it.
Have we seen that? I think that process has just started. A lot of traps will be set in place. If you are smart enough to figure out which direction it is going then you will make money. But nobody can time the market”.
THANK-You for reading it.
Miners (GDXJ/JNUG) have been trading sideways for a couple hours. They are now a “buy” on my 15 min chart, but that signal could easily flip back to a sell, it’s very close right now. Is this all the dip we’re going to get? I added a little more JNUG at $7.35 … but I’m crazy. Don’t follow me!
Thanks for the heads up….I had to be away for a bit and just had my phone…really hard to keep up with phone!
Looking at a daily chart of GDXJ/JNUG this action looks very similar to the 4 trading days of last December 29 – Jan 4. There was a big up day, followed by a big down day, followed by a big up day, followed by a dragon fly doji candle (I had to look up that name) where price opened up but dipped below the previous close by about 3-4% and then rallied back up near the open price by the close. IF my current “buy” signal on miners holds and they rally back up near the opening price by the EOD the pattern would match.
https://uploads.disquscdn.com/images/56e39fdafe018842176bfa7a2529372f3296aa1be227c0c9be1747e3b528849d.jpg
UPDATE: This pattern did not complete as I had no hoped. No “Dragon Fly Doji” for me! However, miners (GDXJ/JNUG) are a solid “buy” (UP price trend) on my daily chart after today’s action, so I feel comfortable being heavily invested in JNUG … for now.
Check out the article on ppp on SA
What is “ppp” Tom or do you have a link?
PPP= primero mining probably
Thanks Nancy I thought it was some publication on SA.
Had earnings: Primero Mining (NYSE:PPP): Q4 EPS of $0.01 beats by $0.05.
Revenue of $52.2M (-26.9% Y/Y) misses by $3.38M.
I can share link when I get a chance PPP is a lagging miner
Miners still trading sideways, very close to rolling back to a “sell” on my 15 min chart.
On a marijuana note…not doing much in these the past days ….but keeping eye on…MNTR seems to want to move today…..popped up 10 cents then fell back, now trying to regain…..seems to be riding the 34 day, trying to recover the 10 day…..CNBX has fallen a great deal as has OWCP…..still watching GBLX, SGMD, EDXC and others….
EDXC was solid yesterday but overall underwater with my MJ stuff, just staying patient waiting for next opportunity.
Yep, same here!
I’m watching again, too. Almost pulled the trigger today. Keep us posted what you think:)
Will do! 🙂
Daily chart is OK, but weekly chart (except maybe volume) looks much better to me. I’m looking at it with 10sma, standard ichi cloud, and PSAR. Looks good. I think I’ll set a limit order for around $2.00 tomorrow and see if it fills.
Does it feel like 10:00 p.m. to anyone else or is it just me? Feels like time is crawling. Time change usually doesn’t affect me but I’m really dragging this week…..this was a commercial, now back to your regularly scheduled programming….:)
Same!!
https://uploads.disquscdn.com/images/fe8b09962523044353955907ff368feb375094cce8f1cd4fb945ffc10c099772.png
Quad witching tomorrow, MMs should be holding things in ranges. http://maximum-pain.com/options/max-pain/
Thanks for the link, that’s a cool site.
Sure..
https://uploads.disquscdn.com/images/3bf99c372ef000510540486fa655ad3517b5d85327d501b949d3df8374b4acc5.jpg
Not unusual for BPGDM to be flat for a few days. As you can see on your chart, it was flat last December 16th through the 28th. During that time, GDXJ dipped and then bounced up, similar to the action we have seen over the past few days.
i follow this chart too rob, initially i thought the same thing but i recall reading there is lag involved. it is not intended to catch exact tops and bottoms but nonetheless it has been pretty spot on since jan of 2016
actually THIS is the BPGDM chart i was commenting on above, my apologies https://uploads.disquscdn.com/images/e0547bdee883667a10321c55cf1164e13d590911f241271ce5479f57e56d2d6b.png
The reason for this is the nature of P&F charts. Take a look at the chart of NEM. For it to become bullish, hence help cause an uptick in the above chart, it would need to get to 38. If all of the golds in GDM were similar, they could all move up a decent amount without the above chart changing at all.
https://uploads.disquscdn.com/images/87a7765492424dc1b2642bba8c04c246489b6d6c2ef50b54371da995e93d95bb.png
You beat me to it!! So much damage done recently that P&F hasn’t had a chance to turn yet. But it will if this action keeps up.
why GDXJ/JNUG is not 3X now?
Interesting, a moment ago both GDXJ and JNUG were down exactly -0.53% I don’t think I’ve ever seen that before.
Another thing puzzles me is that they are going to reverse split jnug and jdst on May 1. That makes me think jdst is going down under 10. 🙂
Look at a longer term chart of JDST and just think if you shorted Jan 2016…
This is about the time that miners should start to rally into the close … IF they are going to end the day with an upswing.
Hello conspiracy guys: Just came back and looked at JNUG chart…another tail on 15 min! This time down to 6.58 and that now shows on that chart as the low of the day. So I went to this area where you can scroll to see the actual trades…here is what I found: time was 15:36:58 for 10,000 and exchange was NBB…? Trades before and after were both 7.49 one 4,000 the other 1,000 on same exchange. What is NBB? Merrill still has low of day at 7.12 like this never happened! This hurts my mind…LOL
Wow. Crazy. Don’t know what NBB is. Can you take a screen shot? If you’re using a PC there should a print screen button on your keyboard (upper right on mine) and then you can paste it here or to a document or wherever. I’d be curious to know if this wick disappears as well…. My charts still show nothing like that. but I’ll keep an eye on the after market trades for bit…
If you are using PC with Windows 7 or 10 you can use the Snipping Tool to capture any part of the screen and save it as a jpeg.
Thanks Conrad. Just got the windows upgrades and a new laptop so didn’t know this. I’ll have to play around some…
It’s how I post all of my charts!!
I tried earlier today and I think it is proprietary info and OPX doesn’t allow it. Conrad…I have no idea what a snipping tool is LOL and I just got upgraded to windows 10 not long ago and am already lost!
Right beside the ‘Start’ button is a spyglass that says ‘Search Windows’ when you hover the mouse over it. Click on it and then start typing SNI…. Snipping Tool will show up. Just click on it and you can take a snapshot of any part of the screen. Great for snipping out parts of text or images or charts …..
thanks
Fun stuff! Like I said before, I post those “signal trades” as I call them primarily for entertainment purposes. But they do hit often enough to make me wonder if it is more than just a coincidence. Very suspicious activity.
NBB is: NBB NORMAN BROADBENT London stock exchange?
I use a free software called JING for the screen captures of my trading screen that I have been posting recently. You can download it for free here:
https://www.techsmith.com/jing.html
It allows you to add text, boxes and arrows when you save the area of the screen you want to capture (as you have seen on my recent posts). It’s very easy to use and you can grab a screen capture of anything that appears on your computer screen and then save it to your desktop as a .png file (similar to a .jpg file). That’s what I have been doing for my Schwab screen captures lately.