The pullback in the general markets remains orderly and rather mild. We are deep in the timing for a swing low dcl.
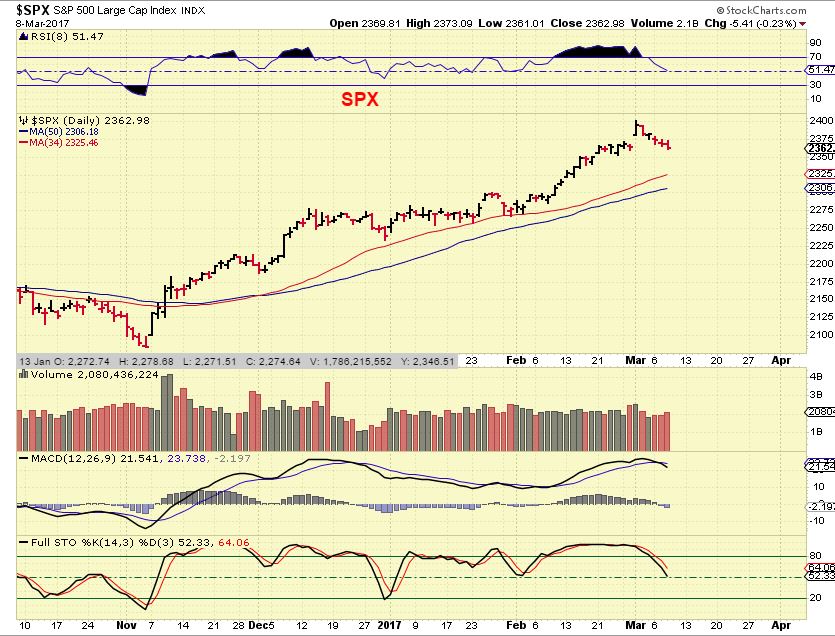
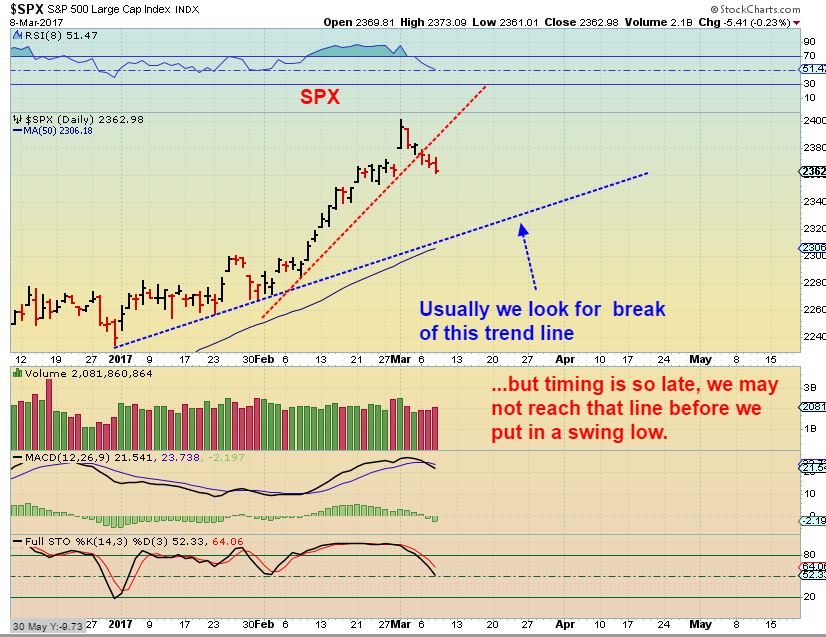
The general markets are in a strong move higher and it can turn into a bullish blow off move. These types of moves are very strong and pullbacks can be shallow. I expect a trendline break as shown yesterday, but in a real blow off move they dont always happen. Instead the trend line can be drawn from the more vertical area, like this. I am going to do further research in this area .
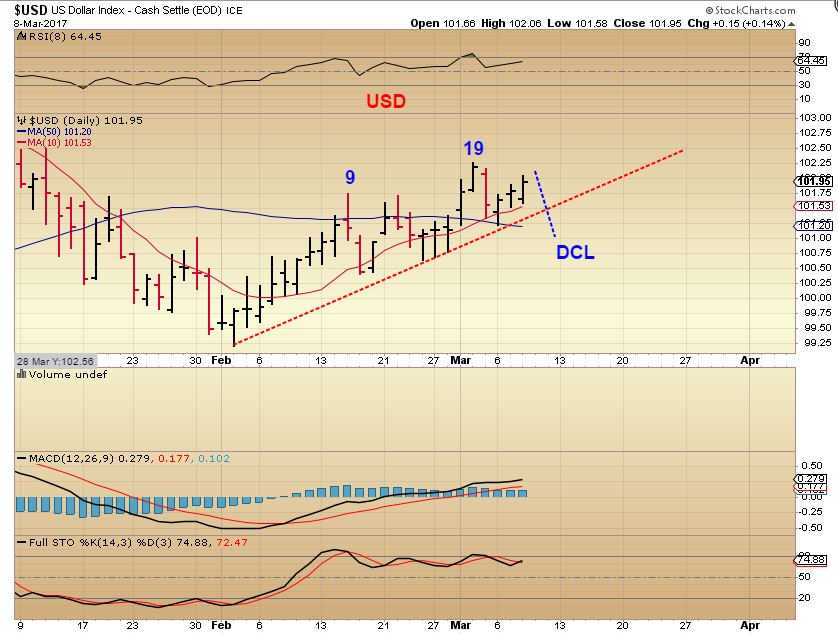
USD – I still expect a dip into a dcl.
WTIC – FINALLY we get that strong move out of this consolidation! I wanted to play whichever direction this went to, but such a strong move is hard to just jump right into, because often you get a quick counter move too. so…
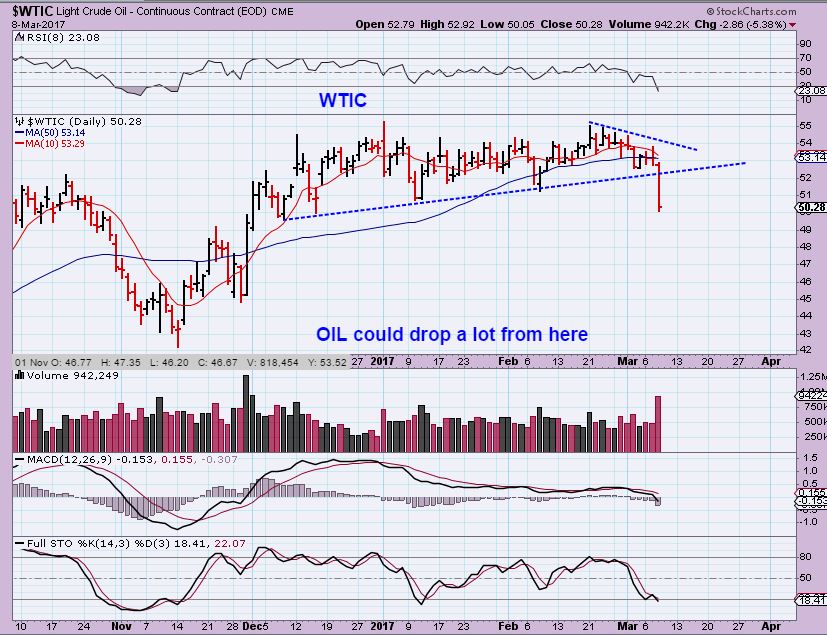
IF Oil bounces here for a quick back test, I will possible take a position in DRIP ( Energy stocks bear) or DWT. I was watching DWT and expected to take a position as soon as Oil broke, but there have been SO MANY false moves lately that I missed a good entry. And…
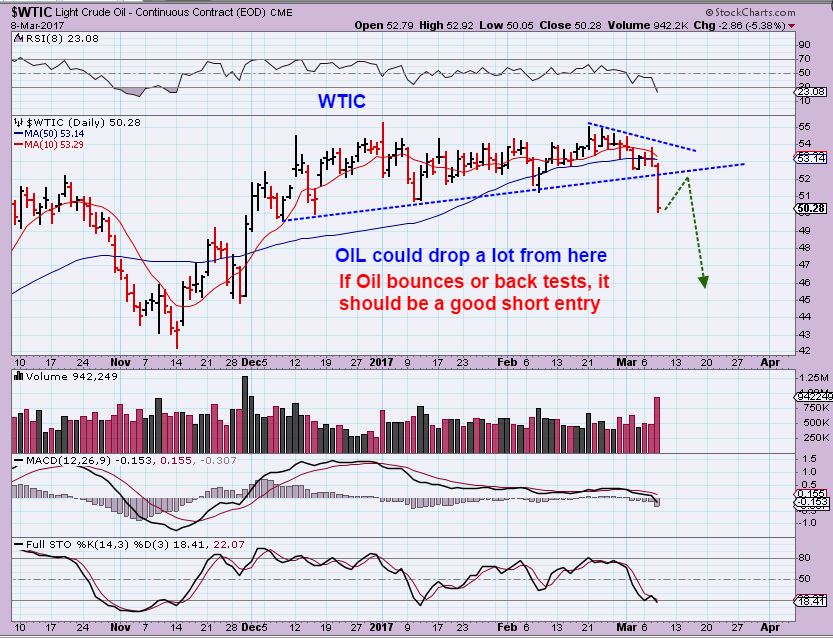
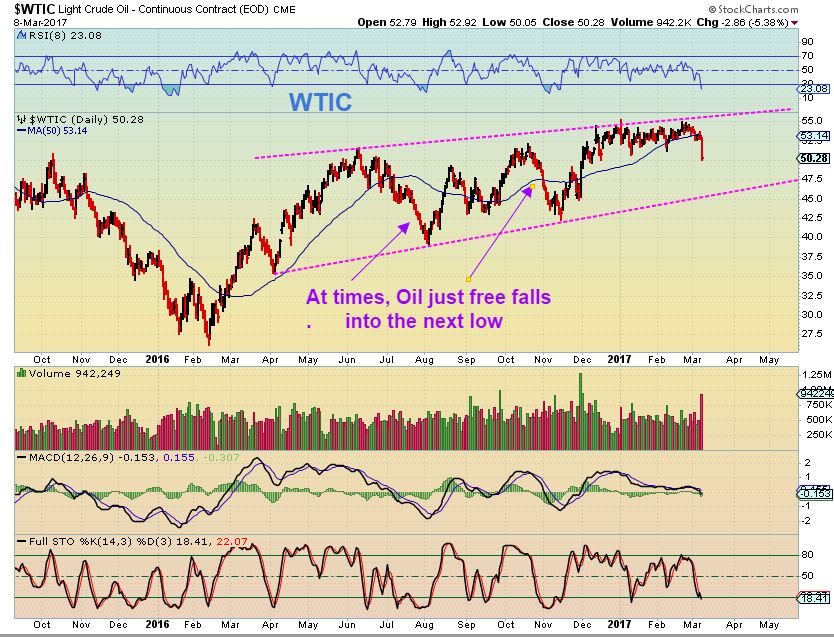
There are times when Oil just gets selling and really accelerates into the lows. This could cascade down after that long consolidation.
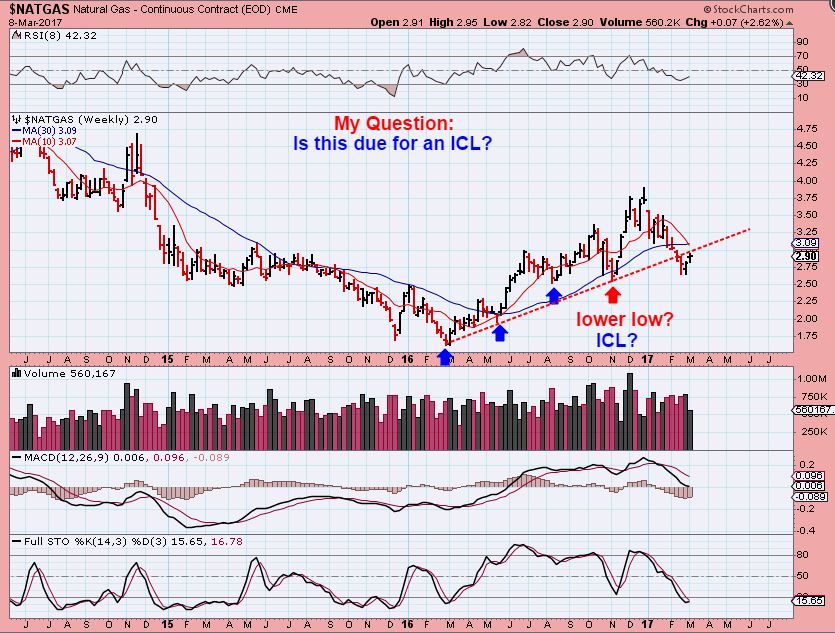
NATGAS – I took a big picture look and got a little concerned about this break down. Why? Mixed signals. I thought that November broke a prior daily cycle low and then formed an ICL . Price then rocketed to new highs in December, but now this dip came all the way back to the lows 3 or 4 months later. ARe we due for another ICL and if so, was this it or could it come at a lower point? I want to see this recover this trend line soon, or I will be concerned about another low coming in.
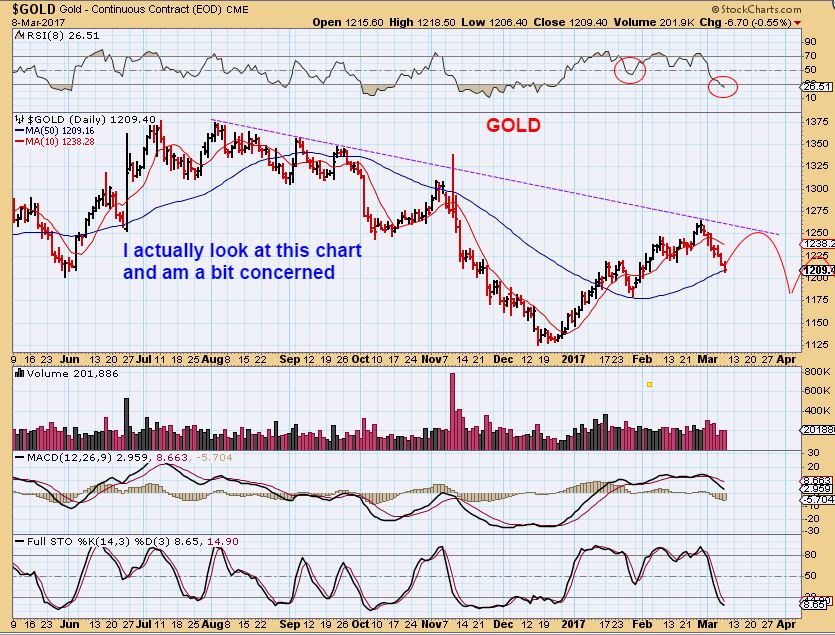
GOLD – Now even Gold is changing to ugly. Look at that RSI. Price put in a higher low than January, but the relative strength is very low. I see other concerns too, so even though we are due for a dcl any day now, I may take a trade when a low is in place for no more than 8 days, because I expect just a bounce – maybe to the magenta line.( Yes, a lower high 🙁
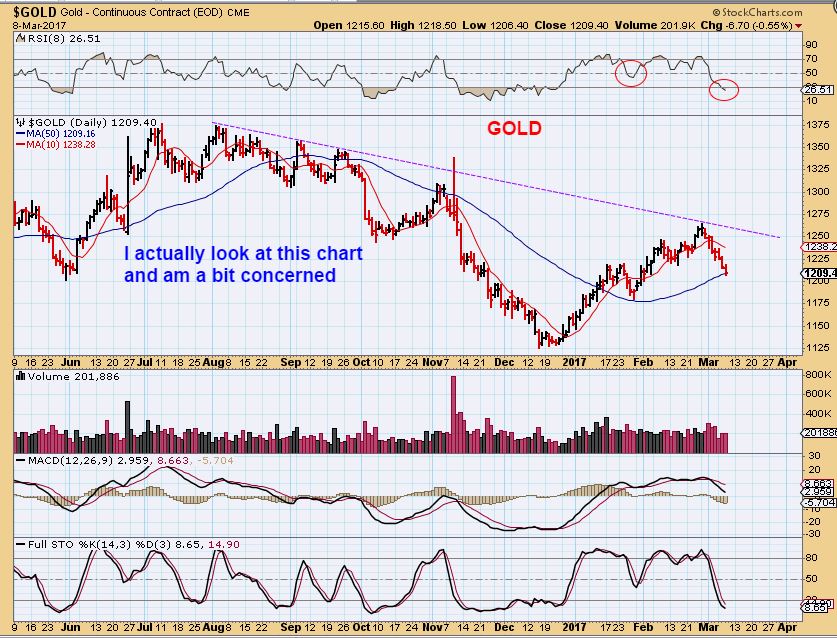
It could look like this
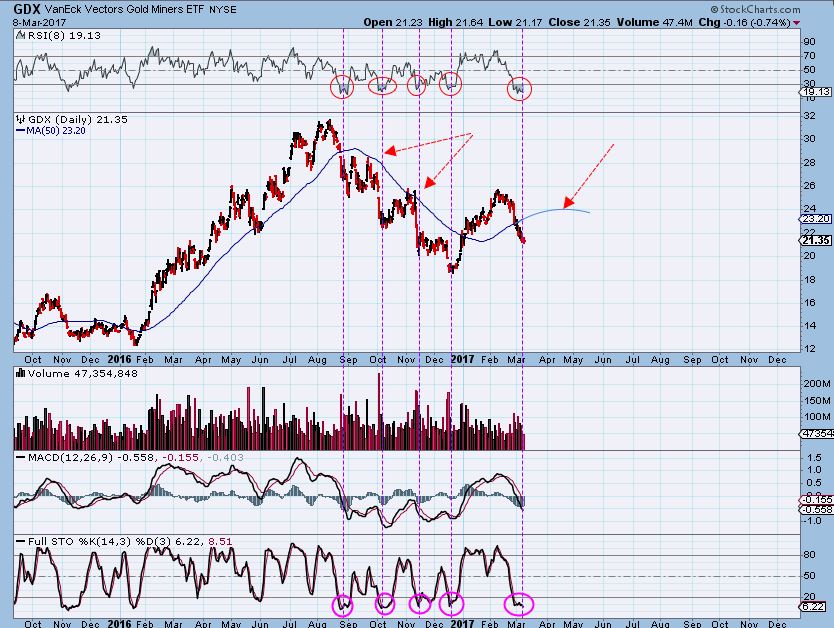
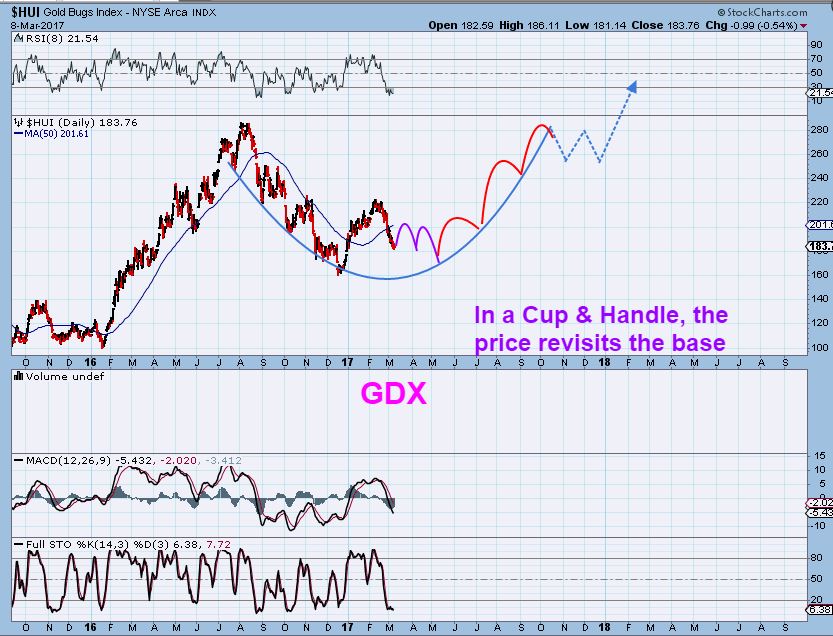
GDX – In the bearish sell off last autumn we got daily cycle lows and a bounce to the 50sma, so that is about all that I am looking for. Experienced traders are eager to play this using NUGT and JNUG- Please know that this bounce could top in 8-12 days.
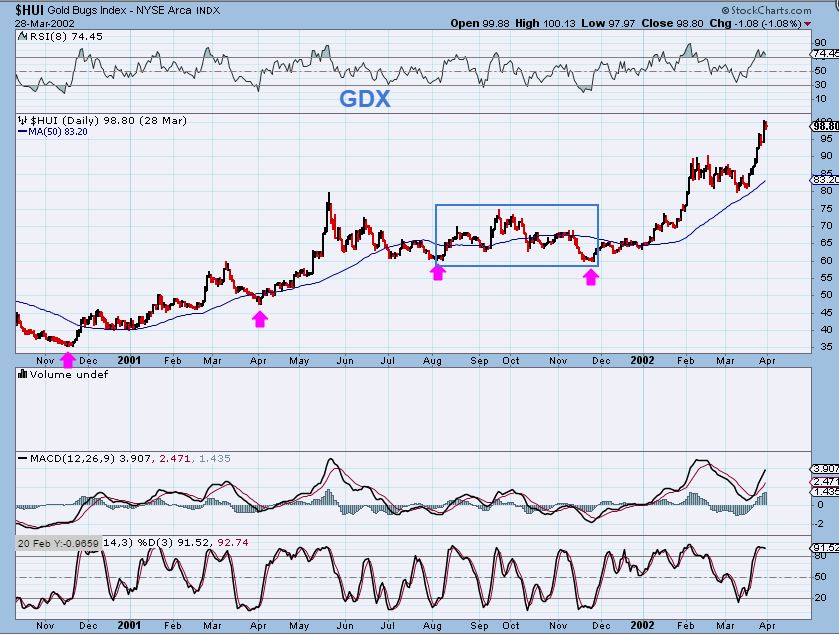
So let’s talk for a minute : I go back to the Bull market in 2002. This was no doubt frustrating, and maybe even puzzling, and so is the Precious metals set up right now, right? Disappointing, and I’m sure that this was too. Look at the Magenta arrows( ICLs). The last November 2001 ICL undercut the prior August 2001 ICL, and that would be like saying that our next ICL could undercut Decembers lows. EVERYONE would be bearish, but then look how it took off higher. Stay with me and we will monitor the Precious Metals and we will get through this and make good money again…
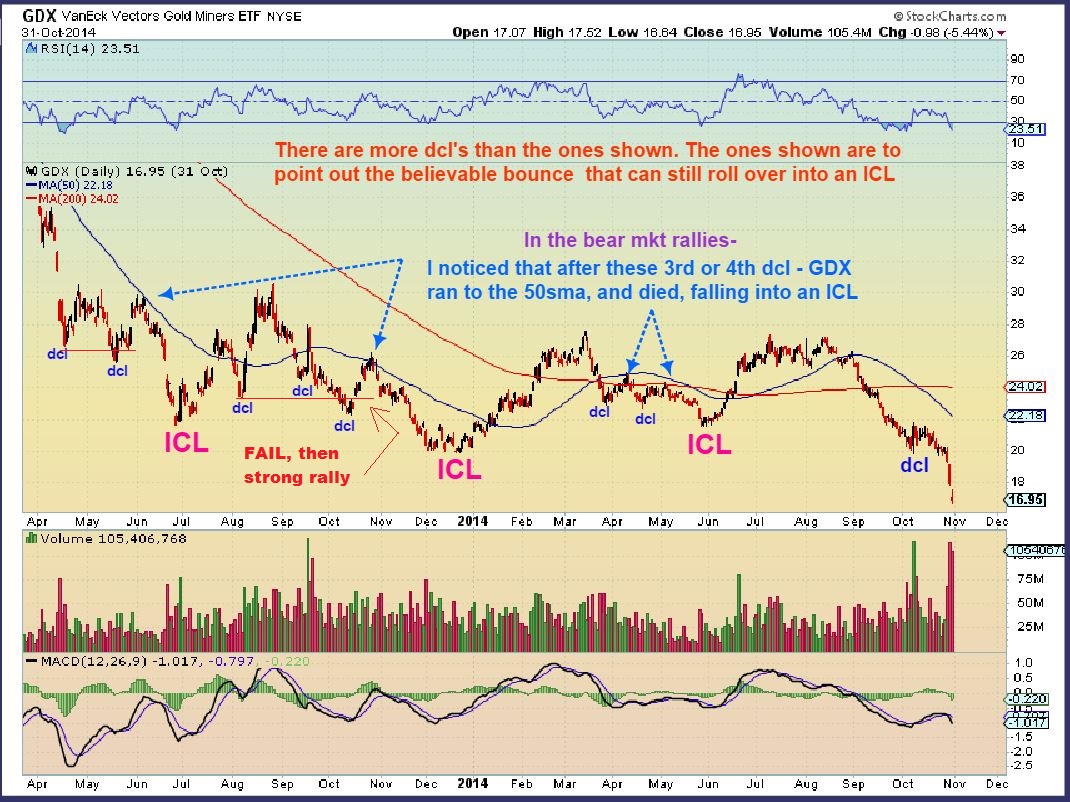
Again the next ICL is going to be very trade-able, whether it is a bull or bear market. Even the Bear Market ICLs rally for weeks ( roughly 2 months), as shown here. Below is an OLD chart in 2014 BEAR MARKET( You can ignore my writing) . Just take a look at each ICL and notice that it rallies for weeks, very believable and then rolls over into an ICL. SO did we just get a bear market Rally in Dec for 2 months? Or do we have what we saw in 2002 in a BULL market? Again, stay with me and we will monitor all of the clues and we will also make very good money for 2 months out of the next ICL. For now…
You and I both know that after a strong run we can get a consolidation that forms a cup & handle or a “W” pattern, so this can still be a bull run, we need to see it through. It will play out and we need to respect and observe how things play out.
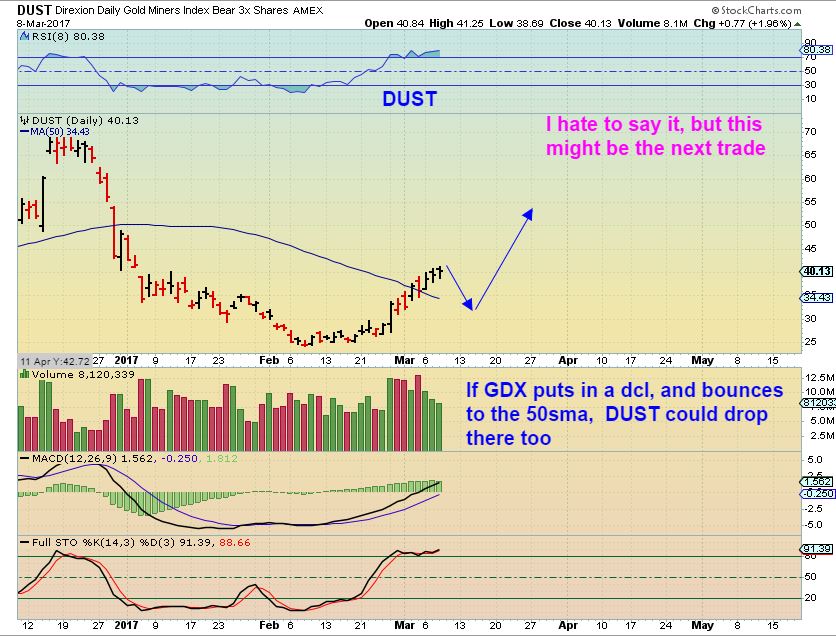
But honestly, I hate to say it, this looks like it may be the next best play after a bounce in the Miners. This would ONLY be for experienced day traders, in front of the screen. These 3x ETFs are SO tricky and difficult. Look at this recent move and it looks easy to ride, right? No, each red day is a day full of doubt, and they came OFTEN. I’m just saying that after this next bounce in Miners, I do expect a sell down into an ICL over time.
SO I Know that many are frustrated with Miners and the Precious Metals action, I am too. We expected a 3 daily cycle run higher into March and inflation and rate hikes to keep this bull running strong. Unfortunately as I have repeatedly shown here, Bull markets also consolidate , throw people off, and they do what they want, not always what we want. I do not see a lot of upside with the current set up, until we get a drop into another ICL. This puzzles me a bit, since I expected a rate hike and some upside after March 15th. Other decent trade ‘set ups’ like CLF and VALE at the 50sma ended up breaking through that 50sma during this market pullback. They may recover when the markets put in a dcl, but so far many ‘set ups’ are not getting immediate follow through.
It is not good to feel that we have to have a bunch of trades on everyday. When the markets are correcting and consolidating, it gets difficult. There are times when everything runs like clock work, and other times when we experience pullbacks, consolidations, and in times like that , patience pays off. Solid trade set ups can occur in pull backs if we’re patient. Currently I’m holding a lot of cash and am watching for a dcl in precious metals , a dcl in the general markets, and a drop in OIL which I would like to trade. I will continue to look for trade set ups, but we may need dcls in place first. We just need to be patient at this time of selling. Let’s see what Thursday brings our way.
~ALEX
March 8th – 
 Friday March 10th
Scroll to top

If we have indeed topped than this daily cycle which should have seen a higher high and didn’t will be right translated and it would be hard to think we don’t make a lower low from dec low giving us a right translated IC which would leave a lot of time to go lower to the next YCL.. pitiful and beyond dissapointing to have given back most of my gains this year. My fault as I felt something was off when we had the divergence and I sat tight. Lesson learned! Guess we have to use this bounce which prob won’t come to sell remaining longs and wait for a better setup.
Its harder to sell than to buy, IMHO.
That is definitely true for me. I did a pretty good job this time but need to improve
You probably meant Left translated in both cases.
You could short the bounce if you do go short . If not, best to wait for the ICL due in May/June , but they can come early. I have seen a few 4 month Intermediate cycles or 4 daily cycles.
alex, jdst/jnug both are going to reverse split on May 1, 2017. I just cannot guess what price will jdst be at that time. Do you have any idea in mind?
No, not a 3x by May
I wouldnt think both are doing a reverse split. I would think one does a split, the other a reverse split.
I just looked it up- you are correct
Good report Alex, I’m with you on being disappointed with the gold miners. I do have a non-leveraged GDX permanent holding but outside that I’ll wait for the dust to clear and (hopefully) re-enter when we get a distinct buying opportunity. If the price of gold is $50 an ounce lower when that opportunity comes, then so be it. Without leverage it will be easier to wait.
Thanks Alex, Cash IS a position……
PLG? Nice TSI crossover…….
I hadn’t looked at PLG since I sold it. It hit 1 penny off of the lows yesterday.
When Gold & Silver bounce, Platinum may too, and PLG probably will with the Miners.
Its looking good so far
Clearly, most golds are suffering as shown by this graph.
https://uploads.disquscdn.com/images/02fe106a59d720fa66b5737cf01cc64dd03305ff80d5d5fa94459269678591da.png
Miners Bullish % – I would have expected it to be lower with many losing 50sma
Yes, buy these reflect bearish P&F signals. Just think if we can get it down to the low teens. Now that would be really scary.
Yes, I know what it represents, and I thought that it would have been lower already 🙂
What is a P&F signal? I like the chart.
http://stockcharts.com/school/doku.php?st=point&id=chart_school:chart_analysis:pnf_charts:pnf_basics
There are many P&F buy or sell signals. To make this issue more complex, the chart I have above is actually a Renko chart of the per cent of a certain set of gold miners that are on buy signals. The highest this chart can get is 100, when all such golds are bullish, and lowest is zero. About 36% of this set of miners are bullish. The next chart is a line chart of the $BPGDM,
http://stockcharts.com/articles/canada/2012/01/gold-optimistic-or-pessimistic-check-the-bpgdm.html?st=bpgdm
Stockcharts.com offers P&F charting.
Thanks for the answer. I’ll keep this.
It stands for Point & Figure
OIL is putting in a reversal so far this morning. I’d like to see a good bounce to go short.
ABX looking like a possible bounce coming. 5-8 day? if gold holds 1205 area otherwise 1180…we’ll see.
looking forward to a short play whenever bounce is over.
thanks for great charts Alex!!!
I have a tough time riding JDST and DUST , even when I know a dcl is due, but I do think that after this coming bounce, the downside will out weigh the bounce ( And I plan on playing the bounce- I guess I like juggling knives??).
Hey Ken – PALAF still halted for 2 days now. I don’t see any news and usually a company will issue a statement when they are halted, but I’m not seeing anything.
Me either….does not bode well.
I took a trade in CLNE yesterday as it crossed above the 50 sma. I am still in that trade, but only because it was a small position that I was going to add on to if it worked out well.
it definitely doesn’t reflect what I entered that trade for . Refresh for 2 charts
Chart 1 was my ‘Buy’
CHart 2 is now … my “Why?” 🙂
https://uploads.disquscdn.com/images/8a5ef5c5dd02340cde3eabaa609307b90987be99a7c80bfbe580dd5d38ded9dc.jpg https://uploads.disquscdn.com/images/2128d3f574897083c5b5b1692c4598bd0e796b98e607beb662fea66b64d19ea5.jpg
Signs of life in miners holding up with gold lower. Decent 5 min recovery candle on GLD just now. Fingers crossed
No bueno
Miners haven’t made new low (yet), but if gold doesn’t hold at 1,200, that could change quickly, I imagine.
Yes, I like miners here with a stop at the weeks lows. Not much downside risk.
Anyone else watching NatGas? Approaching the 200ma. Any thoughts?
They just released the report and if you look at UGAZ on a 5 minute chart- Huge buy hit right on that news.
I’m watching it .
Pop and drop currently on that release
And HUGE drop just now . Huge pop, then a big drop.
I’m always leery of sitting in a position on Thursday with the inventory report due out, especially if it is a leveraged position.
..and there today, rather belatedly, goes XRA… -12%
felt it in me bones 🙂
Alex, Looks like gold is having that running correction that you mentioned yesterday. Things are looking very ugly.
Refresh: The running correction starts with a slam down ( or burst higher in a bullish one).
Then you get a bunch of days were trading range in small.
If it is a running correction, you get another slam at the end,
BUT THEY CAN NULLIFY, so hopefully being at the timing for a dcl will give us a break out & nullify the Pattern ( example shown in the attached chart)
https://uploads.disquscdn.com/images/906900bbcb683b59c40e56fcbd133d6f194cecf5e03178c2b9b13d78351740b8.jpg
Great explanation. Thanks!
I hate ‘hoping’ in a market, but here is a tad of ‘hope’ from the conversation above 🙂
https://uploads.disquscdn.com/images/977b0a09c5269e37e7970c87226e9b6768f066a1bae38708a4fb07288a73b74c.jpg
could be wave 4 starting forming ?
So much with our “love affair’ with XRA.
“The Last Man Standing” has fallen. 🙁
significant line of support here for GDX.
its open (green) & close (red) daily prices.
cascade lower, if that fails?
https://uploads.disquscdn.com/images/844f01c8f43b98820a02026d6668053f6b78aa8a10fb72edc6cb164bc2b767d3.jpg
Please no cascade.
I know, huh? Am with you.
Yes, looks like one of those lines in the sand.
Thanks!
Thanks!
interestingly… the GDXJ equivalent failed early on, but seems to have found support at a convergent point of major lines going back to June
https://uploads.disquscdn.com/images/9400677056bbac9b4272ceedce6938971c3c7f02a0e66f3fa071fe01a99a5c6f.jpg
Cool chart.
NATGAS PLAYS – XCO, SXE, NGS, ( And what happened to CLNE?)
SXE- what a great looking chart.
The others are just coming out of lows
You think this NatGas is just getting started?
I kind of hated to, but I sold TGB for a loss.
It actually looked like it may be at a low, but it is under that 50sma for too long for me to get comfortable. Especially after CLF & VALE broke theirs. I know that it could bounce off of this low , but I need to honor my stop and go to cash. There will be another trade.
refresh
https://uploads.disquscdn.com/images/d65ff443541dc324c72e921eb56d238a78bda9c2edbaa30e25798f367a06b7a0.jpg
Bought more EGI
FWIW,
Safehaven has an article by Enda Glynn on EW wave counts includes Gold at the end of the article.
Actually positive, hope springs eternal.
Just an FYI – So I have started a few rather small starter positions this past week, and many are just not getting follow through. Usually that is a sign that more time is needed, and many things are just not settled down enough. I took the TGB trade mentioned below, Now I’m out. UUUU I still own , but it is lingering below the 50sma now, I took a CLNE trade yesterday as it moved above the 50sma, it dropped back and filled a gap today. I’m still in it for now ( as mentioned below). I bought NAK starter position and will hold that ( unless it just crashes for some reason).
These were all small starter positions, and I would have added to them on the way up, but that didnt happen.
ETC ETC – So I think that things may be settling down with more time, even in Miners before we get a bounce, so I’m just going to try to sit on my hands in Cash ( And current positions) and see what happens. Even the good looking set ups in CLF, HBM, VALE , etc last week when they were above their 50sma have failed- so it is time to be patient.
Although that reversal in VALE looks kind of interesting, huh? – J/K.
I’m going to watch things for right now, maybe trade that low/ bounce in Miners when it comes.
FWIW-
I still own NAK, UUUU, CLNE, – And from weeks or months ago …NWGFF, CNAB, EDXC and mostly cash.
Thanks Alex. makes perfect sense, let the market show its hand.
Consolidations are marked by overlapping waves sooner or later you get tired of getting slapped around!
Yeah, I’ve been caught in a real rip tide swimming in the ocean before, and it kind of feels the same.
You just get dragged deeper & deeper out unless you swim sideways parallel to the shore and wait for that tide to turn in the right direction. I’ve been finding good ‘set ups;, but then swimming against the tide in those positions for a bit.
I was watching some TECH stocks that made nice runs for the pull back, Like YRD, TSEM, MU, 6 month chart of FNSR = cup & handle , VIPS, GOGO, MOMO, CIEN, etc – They all looked great in different ways …
Now look at CIEN ( And maybe YRD & MOMO are dropping more than I’d expect) ..
I was tempted by the base of XONE on a 6 month chart
And YY is a good 8 month daily chart… cup
BY the way, if we get a bounce in OIL, I will short it through a short ETF, because that LOOOONG consolidation
can lead to a nice sell off, and this will be an intermediate drop and I can see this breaking below the magenta wedge drawn on my report today – WTIC chart #3
Alex, thanks for sharing all the above. Its good we know how youre thinking and you covered it all in one paragraph. Which ETF do you like to short OIL? Im currently in DRIP,.
Yes, I like DRIP and SCO, and the one we shouldnt speak of …. DWT
But I missed my entry and amm hoping for a bounce that may or may not come : (
USOIL at the 200ma now.
I’d love a bounce. If the Bulls are in buy the dip mode, it could be a decent bounce , but the selling isnt done yet.
We get a bounce here Im buying DWT
I saw what you wrote before you deleted it 🙂
Yes, Brain cramp. UWTI was the 3x bull, now UWT
DWT for DWTI
Alex
WHICH of the 3X short etf’s you prefer in that matter? any specific one which is the top short you think?
oeps
i m stupid – just saw the same question from Bill below
sorry
No, you just read my post and asked what was on your mind , before scrolling down. No worries.
Why do the letters in your name keep changing? 🙂
I liked DRIP for energy stocks, but XLE has been selling down for a while , so they may bottom before Oil.
SCO is a 2x bear, DWT is the same as UWTI used to be. It doesnt have a lot of chart histiry, so I would assume that if Oil dropped 25%, it could run 75%. I was going to Jump in yesterday and decided to wait for a pullback, but so far it continues higher
Thanks Alex. Your daily advise is really good.
TZA is on the move. and DIA, QQQ, SPY are all down now. IWM is below 50sma.
Takes thick skin right now. Let’s just see what happens mid-March next week . . . . .
Long term holders will do well, imo. You can’t make a mistake in bull market trend and frankly,
will ALL the central banks increased fiat and the continued rise in derivatives and gov debt it
is simple sense that real money and miners will be the place to be. And, since we do not
know when some major jolts will take place just continue in your long positions.
Look at the one year chart for the past 20 years for gold and silver. It looks fine.
Thanks for the broader view. This has been ugly.
Ditto what Nancy said…..holding on to 2 positions that I really want to dump…but they are losses….so I guess I might as well hold on for the ride on those….they’ll come back…just a matter of when….I seem to be so good at selling at the lows so maybe this time I just won’t….:)
You don’t lose until you sell at a loss. Hold until it goes back up and watch
the chart to know when to sell above your buy price.
I am watching the 10 year note at 2.6% – when it hits 3% more is going to
crash and good for metal/miners. Cabal is doing one last big slam down as
they are run out . . . . hold on.
I’ve been watching those rates too….so you think 3% is the rate to watch for on the 10 year? At the rate it’s been moving up these past few days it shouldn’t take long to get there if it keeps going like it has been…..!
Tammie – PS -the ten year is going way higher than 3% and 3% is going to greatly effect some
derivatives, those who bought variable rate loans, etc.
If it’s going to go way higher than 3%…then it seems like will be hard for gold to go up…looking at past charts of when the rates were higher…gold was always opposite….I’d have to look at the charts closer but at first glance that seems to be the case…..
1980 gold top interest rates were 18% from memory
Yup …… Agree Seer !
Looks like NatGas is signaling that it could go higher… or else it’s double-topping. Thoughts, anyone? much appreciated
Anyone else notice the volume on GDXJ yesterday and today? AVG vol is up near 20 million.
Not quite sure what to make of it. Sellers drying up? Buyers non-existent?
Who would sell their miners here? Why? The time to sell was 2 weeks ago, 1 week ago. I could see no sellers, also whose buying? Too much fear.
That’s what I used to believe too…”why here”? Then this year I’ve learned (sometimes) to just hold my nose and let it go–take the lumps. That was 1 week ago with MUX (and it hurt) and here we are…it’s been relentless on MUX…yes it will stop but since I don’t know where I’d prefer to get out now and back in later if it makes sense.
Sure, that makes sense. Why not sell high and buy back lower. But after this draw down, risky. IMHO. Easy for me to say as I am in cash.
Trading summed up in 3 posts above.
me too now mostly…my account moves in hundred dollar increments either way…boring to watch but sure does beat panicking about the direction of price.
It is close……
Alex- Any thoughts here on NatGas? Has it rescued its reputation and regained that trend line you were concerned about? Thanks-
I think NATGAS is acting correctly so far and the inventory report was released this morning, so that is out of the way.
Todays move has put it above the 200sma, but I cant be sure whether or not it would close there.
If I owned it I would be comfortable just raising my stops from my entry ( If you got in a few days ago when I mentioned it moving above the 10sma).
Ugly Day !
Sold XRA & UUUU.
Holding URG, NAK & MUX
Just filled on DNN. (uranium play)
lol! I just got out of my DNN (maybe you bought mine?)…guess that’s what makes it a market:-))
lol….it is a defensible position.
sold XRA also.
VALE is close to a low…..waiting patiently.
Large cap gold Abx, Gg, nem barely budging. Some strength in silver miners too considering the metal. First Majestic, Tahoe, silver standard,Fortuna very respectable.
Volume seems a little lighter across my screen.
I decree an end to the miner correction. We will at least get Alex’s bounce starting sometime tomorrow.
seconded.
8 straight down days for gold. Even during the post election gold smash they couldn’t keep it red for eight straight days. I expect one more smash tonight or tomorrow after 1200 breaks – then a reversal with a strong close.
Lows CDE Dec 22 at $8.72. Today closed at $7.33.
Lows AG Dec 23 at $6.87. Today closed at $7.50
Lows TRX Dec 21 at $.418. Today closed at .441. Closed March 6 at $.404.
Lows VGZ Nov 30 at $.83. Today closed at $.92.
Highs for DUST Dec 15 at $68.01. Today closed at $41.32.
I am keeping a log to see if there is a favorite stock pattern the manipulators use.
Do they have some faves they start lowering or raising first. I have others in my log
and thought I would just throw these out there as data. Looks like the foreign
miners get hammered lower and DUST has more to rise . . .
NAK?
Hi, I joined Chart Freak when NAK was almost topping so I never bought it.
I have not been tracking it except the news on the lawsuits. I would not
buy it with all of that going on.
Great idea. Please share what you find. I think you’re right. And as we said before AG seems to be one favourite hits…
I’m trying to throw a Friday report together for the past few hours, running a bit late. Should be done at 8:25