
March 8th –
Things are lining up as expected now, but one sector may be a little too hot to the touch for non day traders, while others may be looking forward to a fast trade or two. Let’s take a look at these markets…
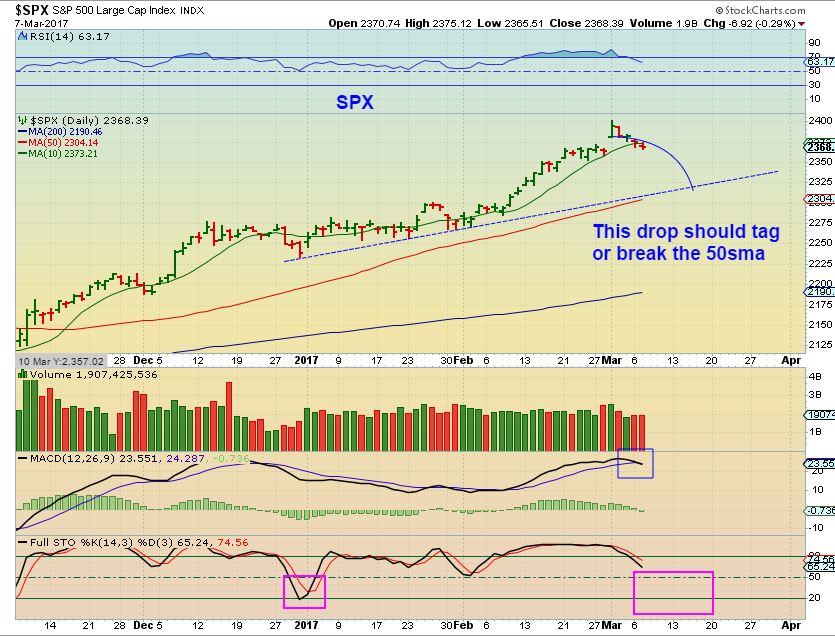
We are finally getting our dip into a daily cycle low after the SPX hit 2400. Expectations from this set up are that it should drop a bit further than many think. This run was so non stop that many thought that it couldn’t drop, but a break of the 10sma this late in the daily cycle should drop it to that trend line. If we do drop there, a buy at the dcl should be rewarding. I WILL MONITOR THIS AS IT UNFOLDS. A blow off type move higher may not pull back that far.
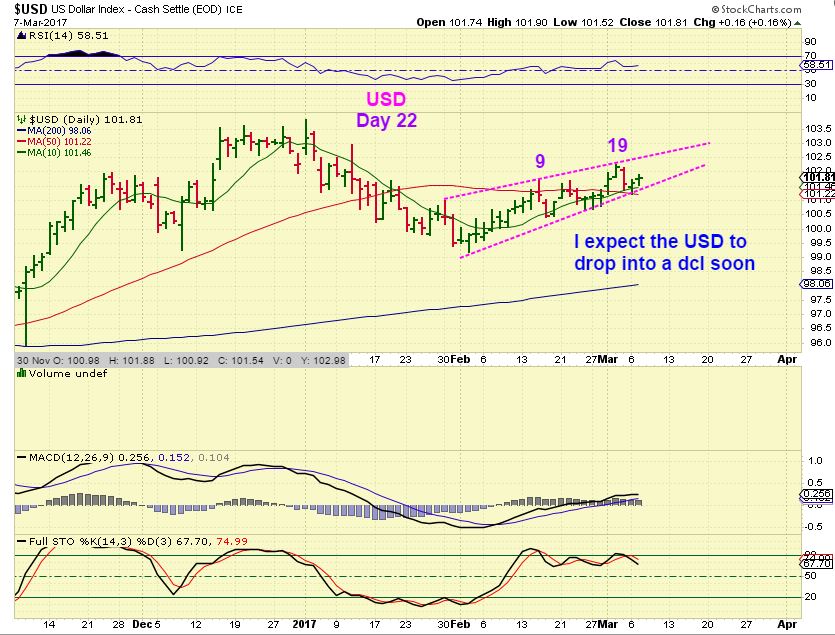
USD – DAY 22 and this also should dip to a dcl too. This should help Gold.
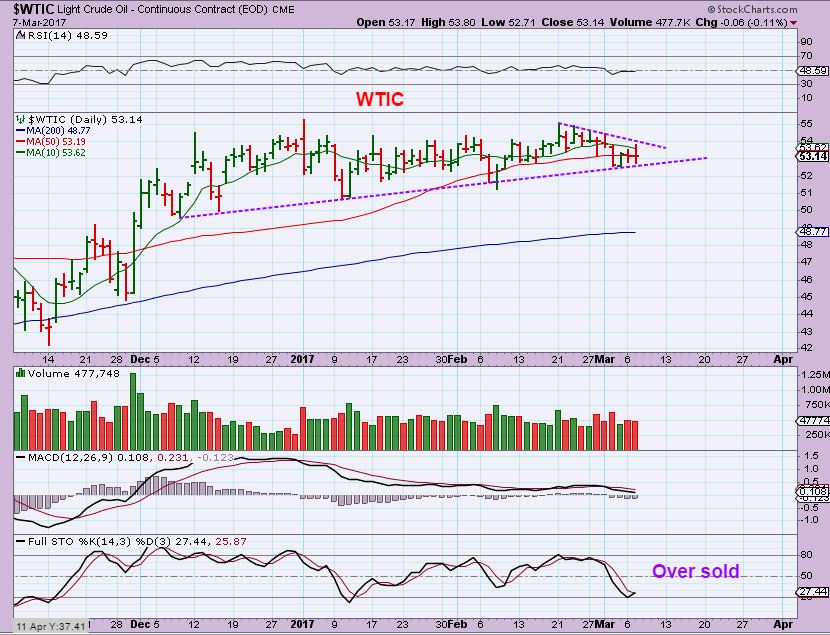
WTIC – This is going to make a pretty big trending move when it finally breaks.
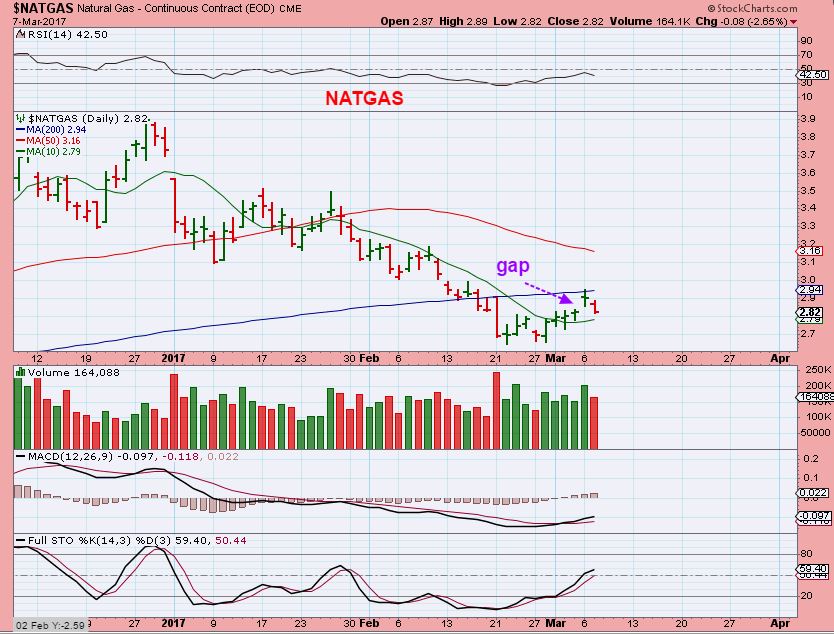
NATGAS – Resistance at the 200 as expected, and now we have a gap fill above the 10sma. A break higher from here would be pretty bullish and could make a nice run, but a break of the lows of Feb 22 would not, and that should be the place to stop out.
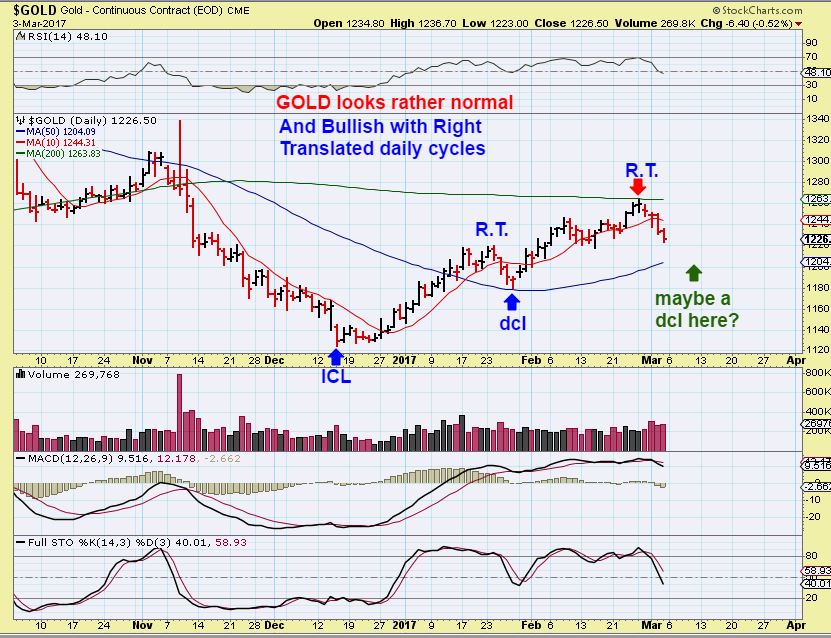
GOLD – This was from March 3rd. We see 2 Bullish right translated cycles, then I was looking for a dip to the 50sma as a good spot for a dcl.
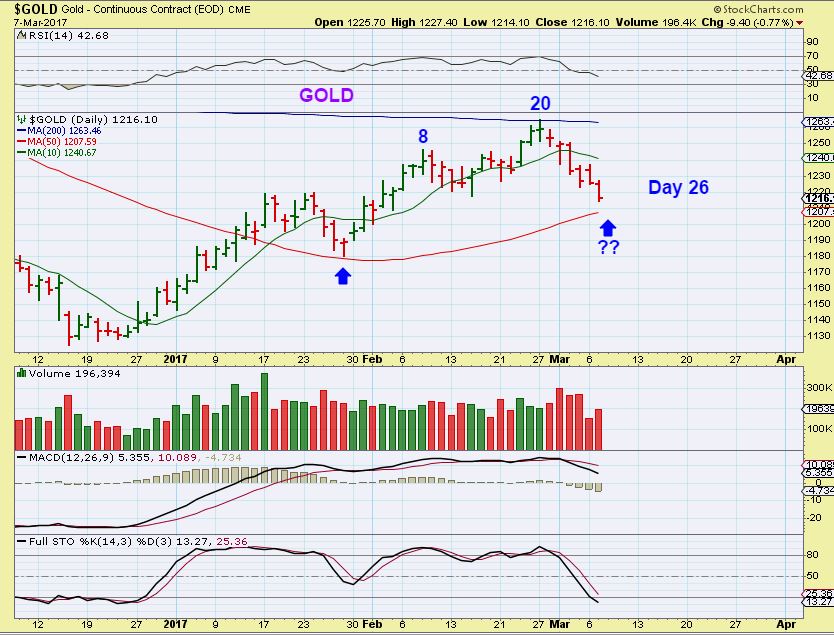
GOLD – Day 26, Gold is in the timing for a dcl and that 50sma is close. The 50sma is where Gold dropped to in Januarys dcl. Gold should then rise up and even make a higher high than that day 20 high. GOLD CAN REVERSE ANYWHERE NEAR the $1210 AREA AND THAT WOULD BE FINE. GOLD did not sell off like the Miners, and Gold is still acting correctly. Will Gold break the 200sma overhead? Will miners follow? We have to wait and see.
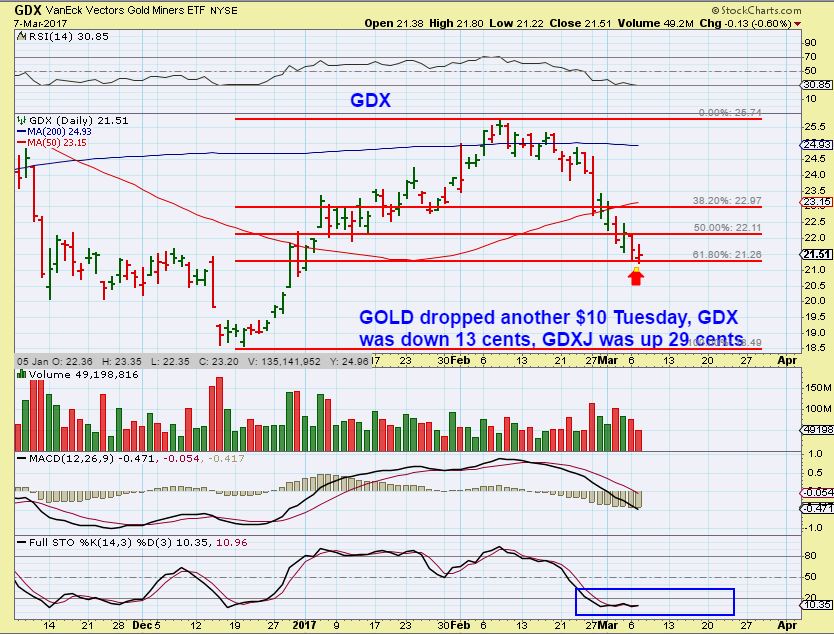
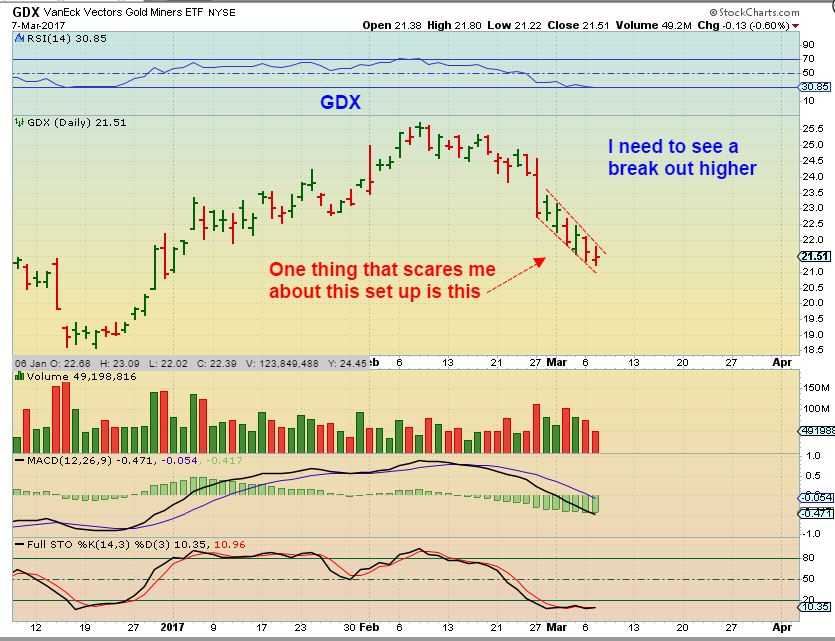
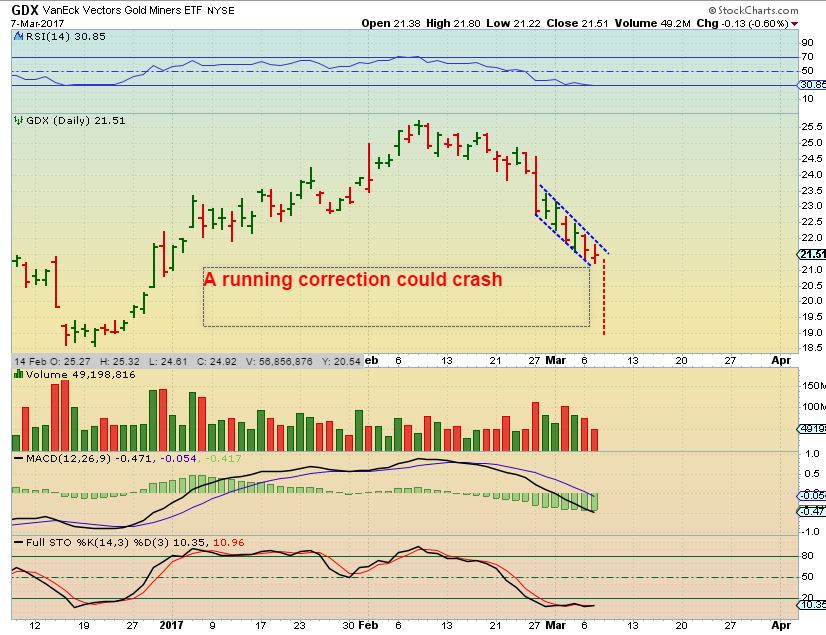
GDX – See the chart, GOLD dropped $10 Tuesday, GDX dropped 13 cents.
GDXJ – Are the Miners ready to break higher? When Gold puts in a dcl, they should, and a move above Tuesdays highs puts a swing in place. I want to see a break out higher from this wedge.
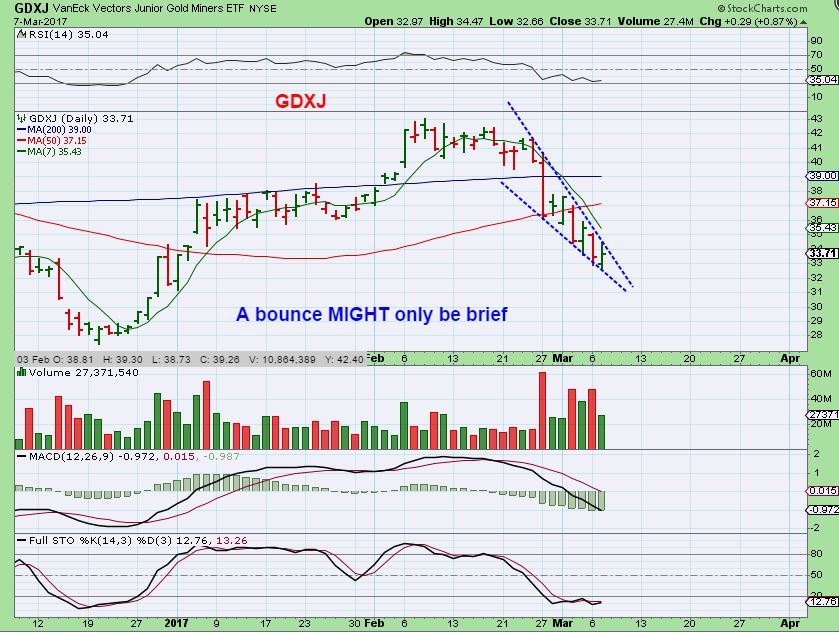
GDXJ – Since Miners fell so much faster than Gold did, it is hard to know if they will take off upside when Gold puts in a dcl, or will they briefly bounce as shown? Cycle timing-wise: This is actually setting up to drop at the Fed Wednesday if it bounces first. That is not what I expected weeks ago, but that seems to be how things are lining up.
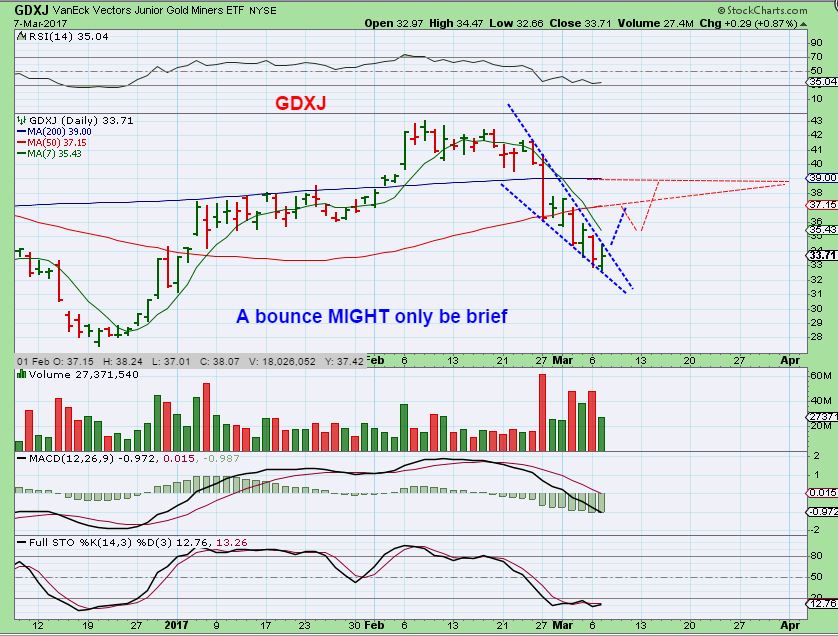
When we get the LOW in MIners, it is a but of a riskier trade simply because of the way MIners dropped recently. The bounce may only last 8 days or so, and we cant tell if it will be weak or not. I KNOW that some here want to trade JNUG or NUGT. DO NOT FALL IN LOVE WITH THAT TRADE. The above chart showing a bounce may be all that we get in Golds 3rd daily cycle. We will know better once the lows are in place.
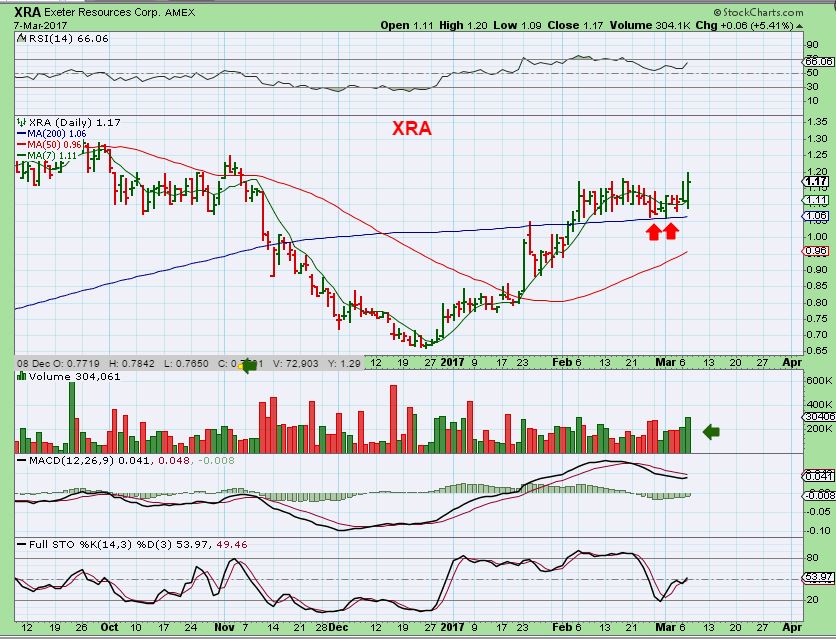
I dont see a lot of good looking set ups in Miners at this point, but doesn’t XRA seem to be defying the odds? If Gold is going to bounce out of a dcl soon, this one might actually be good for a short term trade or buy and hold. The 200sma is a stop. BTG, GORO, GOLD, and a few others are holding up ok, other have been selling off like GDX & GDXJ.
SO I feel that things are lining up or playing out as expected recently. We may watch for a long set up as the SPX, NASDAQ, RUT, ETC, pull back into a dcl. Oil is still consolidating and churning sideways and could start trending for a while when it finally breaks. NATGAS is near the lows and now GOLD, SILVER, and the MINERS are in their timing for a daily cycle low too.
The bounce in this 3rd daily cycle for Gold & Miners may be short lived when it comes. At times they peak ‘left translated’ and that peak might come on day 7 or 8, so when a swing low forms, I will discuss this in detail. Basically, think short term when a swing forms and decide if this trade is for you or not. ALSO some have been feeling uneasy about that steep drop that the Miners took. If you are holding Miners and wanted to sell, this 3rd daily cycle bounce may be the place to unload what you do not want to be holding when this sector eventually rolls over and drops in to the next ICL.
Great news for the patient ones: If you were here in December and were able to make good gains from December to February at the Precious Metals ICL, I think that the possibility for a much longer bullish run at the next ICL is possible. This party got cut a bit short ( 2 months) for Miners. In 2016, the bull run lasted 6 months. An ICL could come early ( in April) or in May, and it could be much better than the one that we just saw this Dec through Feb. I will discuss the reasons why I feel that way in the weekend report. For now, let’s see if Wednesday leads us to out dcl in the Precious Metals..
.
~ALEX
.
IMPORTANT: I wanted to point out something that scares me about this very even, steady sell off in the Miners. We need a break higher out of this consolidation for me to be enticed to try a long trade here. Until this breaks out higher, it is dangerous, because it has the characteristics of a ‘running correction’. I have pointed out ‘Bullish running corrections’ in the past, and I usually always buy them for the eventual POP. IF THIS BREAKS HIGHER SOON, the pattern is nullified.
This chart looks like a possible bearish running correction. Let me explain.
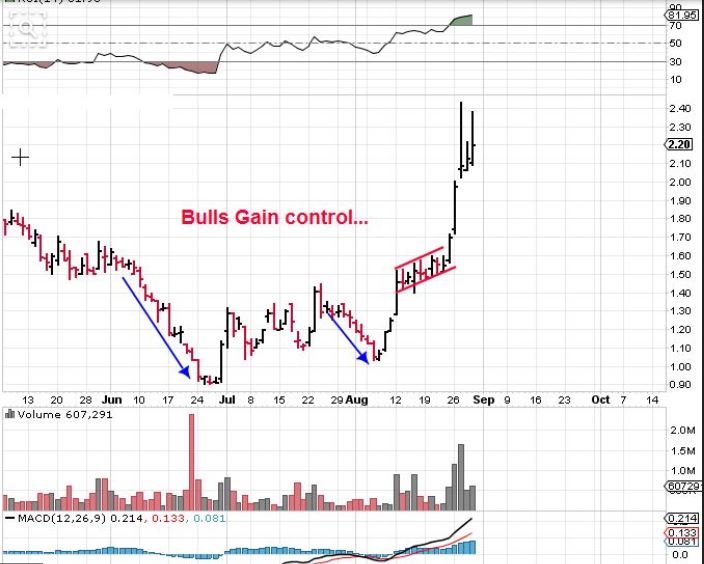
1. Here is an old chart that I used in an older report. A running correction consolidates in the direction that it is strongest.
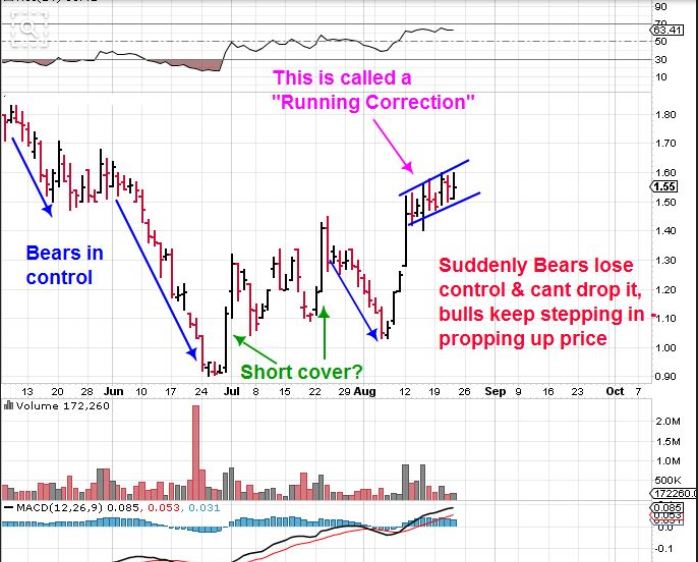
And then BOOM, In a rising running correction, Bulls take control and shorts capitulate. In a Bearish running correction, Bears can take control as longs capitulate.
So if this IS a bearish running correction, it means that some are taking long positions in this down channel…
And they could capitulate ( All bail out at once) and you get this move. SO a break above the upper down channel is important to me. Bulls can then gain control and shorts will close positions in a mini short cover rally.


Alex, thanks for the great updates! Just sitting on hands now…I’ve personally never been successful picking up nickels in front of bulldozers. 🙂
Funny image. Thanks for a little humor. Gold has dropped to 1206.70 this morning and I am glad for the smile.
Thanks for pointing out the danger Alex. The down channel is kind of scary. I know it’s an individual thing, but any helpful thoughts on how to treat core positions here? Thx!
That depends on your goal for core positions. it involves ‘When did you buy and why are they a part of your core?’ Not sure if you read my comment the other day in the comments section when I was asked this question , but I have already discussed that usually the main goal in the US is for lower tax rates. Holding over a year ( Which should only be done in a bull market) lowers tax rates in the US. Some of my ‘core’ holdings have been liquidated, because of individual activity.
FOR EXAMPLE: I held CORE NAK positions from 30 – 40 cents and wanted to hold them for long term. I sold them before the 1 year mark was fulfilled, because circumstances changed and I could see that I would end up with greater gains selling that core at $2.90 than getting a tax break at $1.10
Some positions were bought in JAN 2016 at the ICL/ YCL over a year ago, and those are good gainers in many stocks. Even recently hit CDE, AG, MUX, BTG, etc are still up about 300% from those lows and if the bull is in tact, they should do very well longer term. So the question is why are you holding core & does that reason still apply ( Tax reasons? More of a buy & hold long term investor, etc?) – The bull lows are still in place from Jan 2016 in most Miners.
So one can sell on bounce if they are uncomfortable waiting for the next ICL to see if this is still remains a Bull or Bear. I think that this is a consolidation in a bull market and I would say that the next ICL is going to be a strong buy and another great opportunity to make fast money in Miners. Even in a bear market, that happens.
very helpful, thank you much.
Look what I just found. I didnt even see this yesterday.
.
https://uploads.disquscdn.com/images/359ee007dfb6fff106522dd52b763923295b94ef3ad57b16d5bf772936b8135f.jpg
Gold is at the 50sma, so if it reverses higher later today, that MIGHT be the start of a dcl. VERYunconfirmed at that point.
I avoided posting here the past couple days because I am bearish on miners right now and I didn’t want to “scare” people too much. Now that “The Master” (Alex) has posted warnings not to rush to buy the dip in miners, I will add the miners are STILL in a strong DOWN trend on my charts, so IMO there is more downside ahead. Be VERY careful! For example, the P&F chart of JNUG now has a bearish price target of $0!
http://stockcharts.com/freecharts/pnf.php?c=JNUG,PHTADANRBO
I will not buy any miner positions until the down trend reverses to an UP trend, typically 3-4 days AFTER the “bottom” is in. Last year, I sat in cash from the election until the end of December waiting for a buying opp. I missed out on that big sell off. I have been in all cash since Feb 24 and once again I missed the bulk of the sell-off. I’m more than happy to sit in cash for another month or two waiting for a “safe” buying opp. This time I’m keeping my eye on TQQQ. A few days ago I posted that I wished I had invested in TQQQ rather than JNUG this year and someone pointed out that JNUG had killed TQQQ this YTD. Now check a comparison of JNUG to TQQQ. I am a big believer that the stock market will be very STRONG for the next few years, I think we are back to 1980’s – 1990’s type of bull market in stocks. So I’ll be looking to jump back on the stock train if miners remain weak.
Steve, thanks a lot. This is very helpful. I sold all my gold/silver positions last week. Yes, I’m ready to jump into the spx/qqq.
There is a good chance that we will only get a bounce in Miners if this is the 3rd daily cycle in Gold. If you get a buy after 3 or 4 days, you may want to pass on it. You could be buying a top with a delay like that. This could top Left Translated on day 7 or 8.
A dcl in the markets may look good.
Edit I am not so sure about much more downside on Miners if Gold can put that dcl in place. The running correction type sell off is concerning, but it can become a v bottom if a dcl is put in place, and the timing is good for that. Best to wait for a break higher though.
Yes that is why I said I’m willing to wait or month or two until an “ICL” in miners. I suck at day trading, so I want to wait for a “fat pitch” like the low and reversal last December. I didn’t feel safe to buy GDXJ/JNUG until Dec 27-28 even though they bottomed on Dec 20.
Yes – The next ICL should be a great buy, but at the same time, it is probably going to look ugly for Miners and many will not be able to buy it. I’m hoping to prepare readers here for that Buy. It will at least be several weeks of upside- then we can assess how bullish or weak it looks.
Maybe you can lead with a neon picture that says “BUY NOW”
Good idea, I will find that theme picture and save it now : )
https://uploads.disquscdn.com/images/b5985c35ee442ded5674805e594ff9b280c5ab5e0608705a42a37b80ed553d15.png
lol
Steve, thanks for sharing, yes “Cash” is a position.
NAK bounced off the 200 sma
Too tempting to resist….against better judgement bought a small tranche but tight stops and thinking of making them tighter all ready.
Uraniums look pretty good.
UUUU back over the 50sma
Of all of the URANIUMS – UUUU really looks good above the 50sma, while UEC, URG, DNN, etc are still below the 50sma .
I own UUUU, but it’s not that I am biased, it gapped above the 50sma and looks pretty good
🙂
I only own UUUU, but I’ll be watching to see if the rest want to play along too : )
I think I remember you bought UUUU too, before me yesterday. That was a nice stretch higher yesterday
I bght. URG too….it was lagging in the afternoon….
If ya want some fun try PALAF ….. I do not own.
PALAF was halted this morning.
Woa….do you know why ?
No- It hasnt been open for quite a while. I was looking at all of the Uraniums when I noticed it. It never traded today ( Maybe pre-market, they halted it at 8:30 Eastern)
hmmm
grrr ….
I try so hard…. 😉 JK
i needed more time to study charts…. i cant just jump on the spunky pony ..;o)
such is life
*well.. i take that back…
what exactly is a “spunky pony” ?
and if you do jump on what normally happens?
warning: we may not want to know ! 🙂
… asked and answered ………… 😉
lol
Thank you Alex. Caution is warranted. Side note – EVERYONE is now bearish or mega bearish…..Maybe a decent bounce to sprinkle some doubt into the bearish case and turn that tide again before the final push lower????
Regarding miners of course above….
Yes, A dcl will do that.
GDX of 21.3 should lead to a DCL. We should be able to sell next Friday at GDX 23 hopefully.
Alex, Im in BOIL, a 2x etf of Natgas. I have been watching natgasusd, it hasn’t reached the 200sma yet. Are you using something else to track natgas? You still think the 200ma is the place to exit the trade?
I am in BOIL too. I think Nat gas should at least go to 3.1
I didn’t say to exit the trade at 200sma. I do remember saying that it offers overhead resistance, but that doesnt mean it cant break above it if it remains bullish.
Okay, probably read it somewhere else.
Alex, what’s your take on the chart for X? Sell or hold? Looks oversold to me, 35.15 is probably a good place to set stop (breakout test)? Looks like a harmonic pattern in play that could go lower.
https://www.tradingview.com/x/4M2pHDHD/
I was watching CLF & VALE on that 50sma and I figured it would hold, but both are slightly breaking down, so with X I would have looked at it the same way. It kind of looks like a cup & handle, but I’d probably allow myself to stop out below the 50sma and get back in later if ir recovers. I’d watch others like it ( CLF, VALE, etc) just to see how they act going forward.
I must be learning something. I just made the C&H pattern on the chart. So, might go lower, long term looks promising. Monthly looks like a break above the trend line.
https://www.tradingview.com/x/Pkf23RzW/
Yeah, that is a mammoth base on a monthly if it would just break out & run.
One of my readers wrote to me that they bought CLF, X, VALE way back last February when I recommended them and rode all of that crazy whip saw volatility and is still holding.
Yes, I am jealous. CLF was $1.50 and Vale was near $2.50 when recommended.
X looked so promising, then Trump spoke about only using US STeel and down she went……
u in LABU…?
No, I can’t put a trend on the chart
A trade set up : Refresh
I just bought CLNE- ( Energy but not Oil) I havent found a ton of low risk bullish looking entries, but I like the way CLNE has had a deep sell off and a bit of a bottoming area. A POP and then a gap fill, now back over the 50sma.
I’ll just use the 50sma as my stop area and see if I can get some upside over the next few days.
https://uploads.disquscdn.com/images/8a5ef5c5dd02340cde3eabaa609307b90987be99a7c80bfbe580dd5d38ded9dc.jpg
hmm.. good find… that one’s fun… 😉
Yeah, we’ve taken a ride on CLNE, and PEIX in the past, and I ended up with gains, so this little bottom MIGHT do the same : )
Earnings came out better than expected Yesterday. Estimate (0.09) actual (0.03) still negative.
Thanks – I didnt see that. It just dropped back below the 50sma, but I still like the set up on a daily and weekly.
You watching USOIL? May take CLNE down
Clean Energy Fuels Corp. engages in the provision of natural gas as an
alternative fuel for vehicle fleets in the United States and Canada. It
also designs, builds, operates, serves, and repairs and maintains
fueling stations; and manufactures, sells, and serves non-lubricated
natural gas fueling co…
Ah, sorry. I thought I remembered playing CLNE as an energy stock.
Yes, a bit more NATGAS ( Which natgas could be bullish here)
GOLD 1188? Not a real clean chart, but close. I could see a Bullish Bat pattern (Harmonic) playing out with an 1188 target for GOLD. Yikes.
https://www.tradingview.com/x/LTOBgqFK/
Good news! My Scottrade commission was just lowered to $3.45 per trade. Check with your manager.
wow….very low.
option priceing?
I only do stocks. Check Scottrade for options. Mine started yesterday to my shock and surprise. Price war!!!
thanks. yes exactly….
That’s just about 50% off! Very nice GLMUS
Glmus – Just a shout out to you for suggesting the Worden brothers TC2000 platform. Have had it for a couple of days now. I’m in love. THANKS.
This software is unbelievable. I cook up some very cool custom indicators that likely no one else uses. I never use standard indicators with standard settings either – too slow. As an example, chart True Strength Index set at 2 3. Slap a zero line on it and watch crossovers. If you aren’t in a big hurry, watch weekly charts with this. It should keep you out of trouble. Look at the weekly of JNUG to see how it kept you out of that stock from Aug to Dec. Of course, it will get you in for some great runs too. Check out weekly AG starting Jan 2016 and watch how TSI 2 3 got you in and kept you in until Aug.
Thanks for sharing Gary.
Just thinking out loud.
Was watching YRD, NMM, MOMO for pullbacks and missed all 3 : ( These are fundamentally good
I think YRD is running back to $42
Look at a 3 yr weekly on NMM. Kind of wondering why NM isnt moving the same ( or will it?)
SB has a great base and looks good. I am still thinking that Shippers could be setting up, but the base action gets boring. ( See SALT & SBLK)
and STNG..
Salinas Price simple and clear – March 15 huge crash general equity market
with Fed raising or not raising and the debt ceiling. You can see the Dow
distribution this week maintained steadily at a very low number not to alarm
retail at 21,000. http://usawatchdog.com/noahs-flood-of-cash-coming-hugo-salinas-price/
Thanks Seer. Interesting read.
I don’t know how the day will end, but pull up a chart of NAK and the 200sma. So far, that was rather nice 🙂 We’ll see how it closes
dang… nice little green lollipop …hmmm … that would make this count work …. let say that is ‘4’ of primary 3….
..https://www.tradingview.com/x/SxhemfCZ/
yea i like…nice count !
NQ is interesting…
Alex, JNUG has had some wickedly high volume over the last week or so. Do you believe that this means something, or are 3x ETFs an anomaly?
I ( Just a guess) think that it is a mix of extra activity near lows, because we see a lot of volume at the the lows, but also the shares get so much cheaper in sell offs that ( Lets just say $15,000.00) buys a lot more at $4 than it did at $13. You could get almost triple the amount of shares for the same $15,000.00, so volume might triple?
Again, just a guess
Makes sense. Thanks.
Yep, volume and price linked, have to do the math for the total investment amount for accurate comparisons.
i think lots of day traders treat JNUG as a lottery ticket. they in and out many times a day. 🙂
That’s probably true too. It gives you gains in a few hrs that other stocks take a week to achieve ( And losses )
like yesterday, if you in @5,2, and out @6.1, that’s 18% gain, very enticing. I’m scared now. just watched.
LMRFX lagging Uranium…..
So I grabbed a good chunk of NAK around that 200sma. easy stop out if I feel threatened later : )
Same, filled at 1.216. I lost so much profit at the top but I’m over it. It was a rare instance that got me emotional, good lesson.
Let’s just hope that this reversal at the 200sma sticks and we get a bounce to the 50sma.
Thats only a 100% move, but I’ll take it : )
Salinas Price – scroll down and watch the video interview.
Gets better mid way and to end. I know Greg.
I just watched it – lots to think about – thanks for sharing!
GDX & GDXJ went green
hmmmm … .. AKG
interesting….. “Flip” pattern
https://www.tradingview.com/x/Ok5XiWrb/
how about that GV
Refresh – Are you still holding? I traded it at $3 area and sold, Traded again at $4 area ( they had that hurricane in Florida and I figured it might befit ) Isold it 2x for a small profit. Small positions. It has doubled since then : (
https://uploads.disquscdn.com/images/6011efd0977071be3e2c2197a311ae78074e75a9c164588197fd74962cc44c5e.jpg
No. I just happened across it today when I was looking for future buys.
Yeah, I wish I held on and added as it went higher, but I actually sold it and forgot to keep an eye on it regularly.
Sometimes it’s hard to know which ones will keep going and which are just trades.
Looks like URA got stopped at the 50 day. Gold is pinned under it. Neither scenario ideal : (
I didnt even notice Oil. Is this FINALLY it?
Check out USO & UCO
Downside Target?
I havent looked into it, but the consolidation is huge, they often lead to a strong run.
WLL down 12% at one point
I had actually traded that one recently but stopped out last week for minimal damage. Thank goodness got out when I did.
i got out at 12.31. I’ve hold it for a month, and it didn’t go anywhere, so I dumped it.
BCEI down in the doldrums again..
look at the volatility of that mutha since november +200% -70% +400% -65% !!!
Man, those little guys in energy – crazy. I gave that stuff up last Spring and went back to snorting glue. Much more rewarding and certainly a safer alternative!
AXAS, PQ, SGY, WLL, …….
And then there was XCO ( natgas)
I have Crude over due for an ICL ?
Yes, the drop could be pretty big.
I was going to try to catch DWT – But I dont have any history on it , and its hard for me to trade it this way.
IF oil bounces, I’ll grab some
Ouch!! [only saying that on behalf of any holders]
C’mon gold, NAK is saying it’s time!
Not sure NAK cares about $GC or vice versa. Heard a recent podcast where large investor suggested NAK being traded like an option…on EPA ruling. On the upside he was positive.
I’ve been using it as my tell, so I am hoping that it is telling me good things about gold’s next move. Since it was first down, maybe first up : )
FYI:
ECB Tomorrow & Employment Numbers on Friday, could get interesting !
Not to mention FOMC next Wed. !
Thanks Ken. I look at the ADP jobs numbers which come out 2 days before the official government ones and so those are out today. ADP reports 298,000 jobs created vs 190,000 expected. It’s already being called a ‘blowout’ by CNBC.
Thanks Evan
PALAF still halted – through the entire market day. Thats interesting.
Very ….
Wow! That must be what hit gold near the open. A blowout on Friday would out the chance of rate hike over 90% (per the analysts, not my personal view). That would crush gold in the short term but as Alex has shown multiple times, can be positive longer term.
this morning when ADP number was out at 8:15am EST, GOLD/SILVER immediately took a hit. I’ve been watching this for almost a year now.
Yes, I’ve been watching it too for over a year. Friday will likely not be pretty…
I was gone for a few hours, just got back….thank you NAK 🙂
Really very, very frustrating that we can’t get a bounce yet. Ugh!
sold my JNUG for breakeven.. it was doing my head in.. up and down like a yoyo.
didnt like the downwards move at close either
Looks like Euro is trying to retest the low at 1.05. I think it is going to have to demonstrate that it has bottomed, for gold to take off.
EGI should bounce on the 50 but this is concerning
Couldn’t figure out what exactly was making all the MJ’s go down….finally found this tonight….Canadian govt guy said today they won’t rush to legalize MJ but will take their time…..hence the fall….maybe that just means there will be some really good buys one day…..whenever it’s time to get back in…..I still have a few I wish I didn’t have….here’s the link to the article for those interested…..
http://www.huffingtonpost.ca/2017/03/08/marijuana-stock-prices-canada_n_15239898.html
Disappointed in The Marijuana Index site….they didn’t have anything on this Canadian comment at all, which would have given a heads up if holding mj stocks….think I’ll be doing research for a more reliable source on current news…..the rest of the site is useful but there are holes in the “news” type information on there…