
March 2 Intra-day Changes
We had a 1 day slam down in GDX & GDXJ on Monday, followed by a small, rather insignificant day on Tuesday. Wednesday actually saw a sell off and an intra-day change to a strong reversal. Now the question on many peoples mind is…
.
Did we just have a 1 day slam down, reversal , and now we go higher like we saw in 2003? Or will there be further selling?
The answer , unfortunately, is that we need a little more time to know for sure. There are actually an unusually large number of things in play here that do not seem to line up, so we will discuss that too. First, let’s look at the markets…
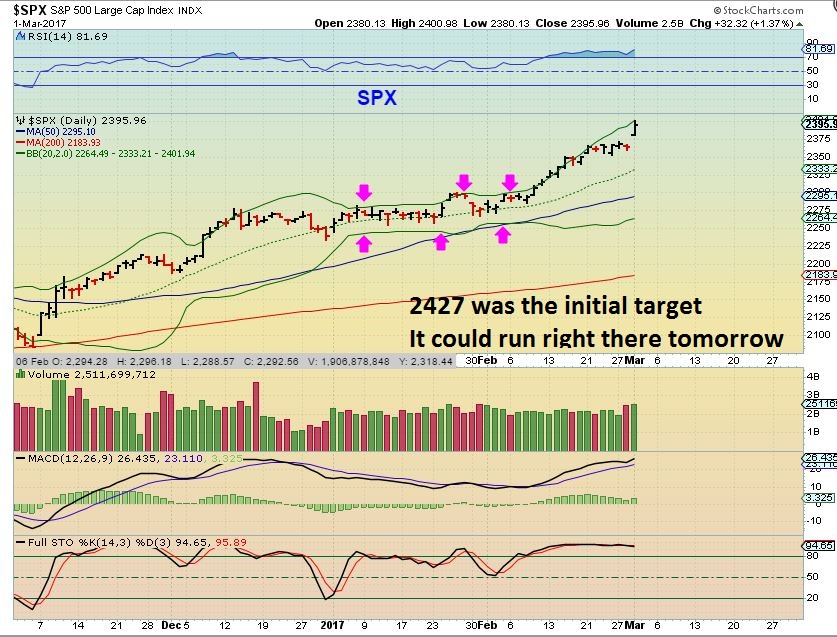
SPX – Quite the surge higher after Trump talked up the economy. 2400 was hit on Wednesday at the bollinger band. The next daily cycle should also hit new highs , since this one will be right translated, so if we ever got a dcl it could be bought. I will monitor the next pullback. If this were to just continue straight up in blow off fashion, the drop would be sharp and fast too.
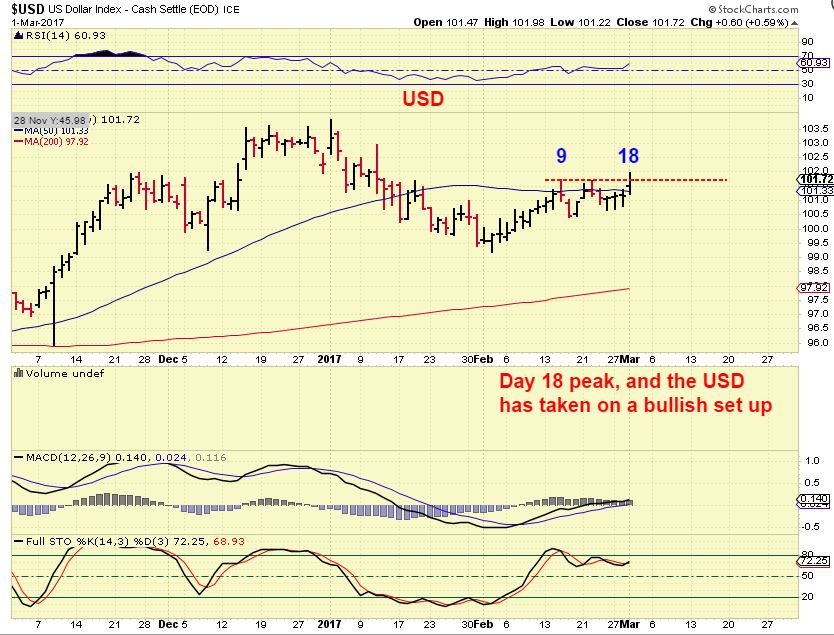
USD – So here it is, the USD actually made a new high, and this has its own implications. It is very bullish for the USD and normally it would have me expecting GOLD to continue to drop today. This also implies that we left behind an ICL in early February, so the USD would only be in its first daily cycle! This is very concerning for Golds bigger picture, unless the Precious Metals decide to run higher with the USD.
WTIC – No change from yesterday
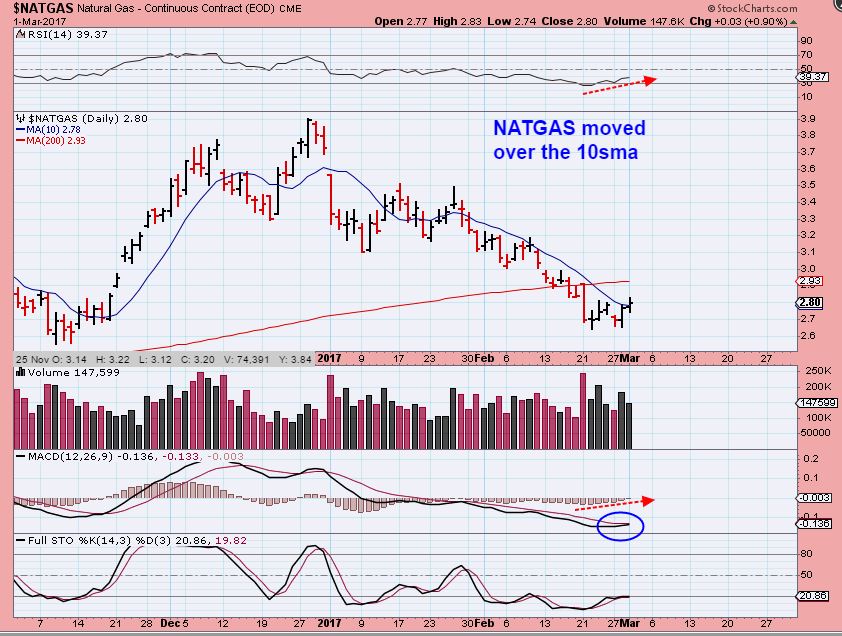
NATGAS – NATGAS did overtake the 10sma and so it has a swing low in place now. It appears to be on day 5 and may be setting up to break above the 200sma. The Inventory report comes out Thursday morning, and THAT might make or break this set up.
.
**The situation in the USD is not a bullish one for GOLD, SILVER, and the Miners, but on Wednesday, they all acted bullishly. To me things are not crystal clear as to how this will play out, because it almost looks like everything wants to go higher. Now I have to wonder if The USD will take off higher and drop the Precious Metals or can they continue to both run higher together after yesterdays reversal? Let’s take a look at what we have, and unfortunately it is a tad confusing.
.
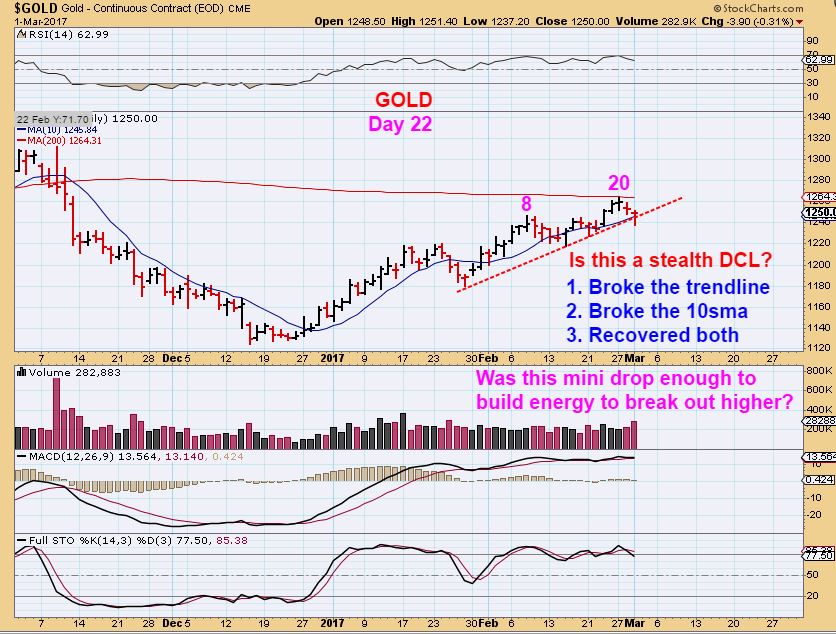
GOLD – Gold peaked on day 20 and that is bullish. It then dropped and recovered. It did what it needs to do to put a dcl in place ( See chart) , but it is not common to see such a shallow dip into a dcl ( Especially with a bullish USD). So what is Gold going to do? Tag the 200sma and drop again into the real dcl? Will it drop to the 50sma, which seemed more likely? Or is it so strong that it could just surge higher despite the USD set up? It is not clear, but so far we have a reversal with $1237.20 as the low. Watch that 1237.20 today.
SILVER – Silver is just bullish at this point, but if it is overbought and due for a dcl, wont it eventually drop back down and tag that 200sma? I would think so.
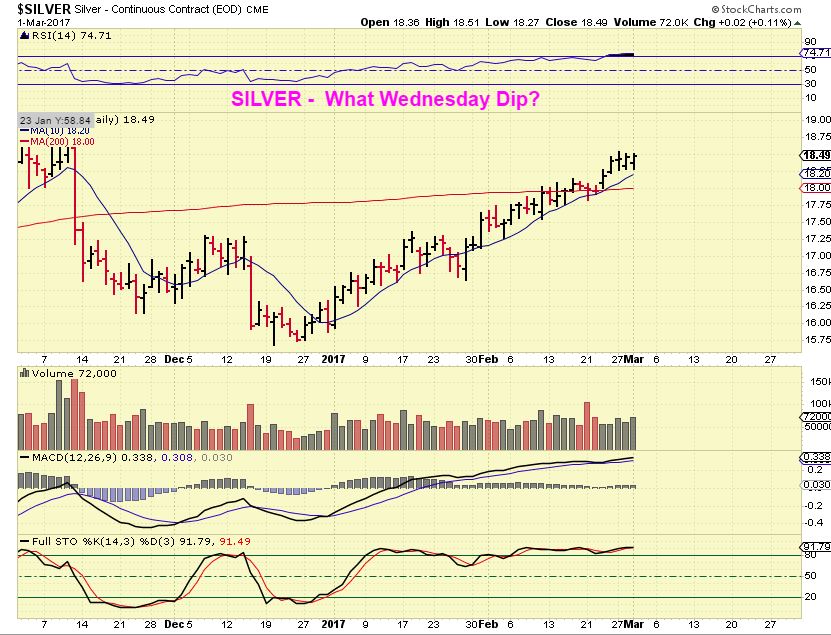
** GOLD is overbought, Silver is overbought, Miners are oversold. Let the uncertainty continue to mount, right? Let’s look at Miners.
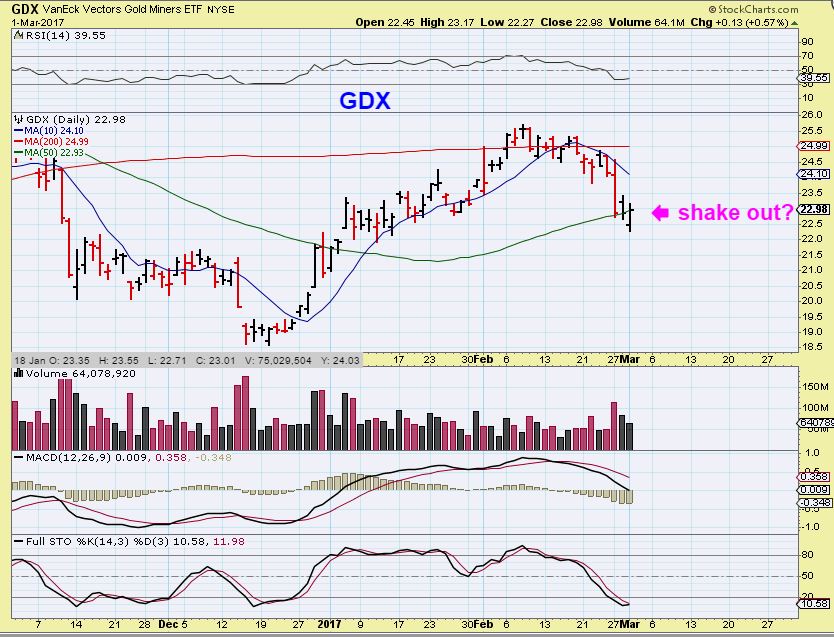
GDX – With all that I said above about the USD starting a new intermediate cycle, and GOLD & SILVER not quite giving us a clear dcl, I dont know if I can trust this reversal, but let me explain more about this situation. It looks Bullish, but anything can happen.
1. In cycle analyses, you would buy a move over Wednesdays high ( $23.17) as an unconfirmed swing at the lows.
2. In Technical analysis – We do see ‘shake outs’ act like this and this is also a ‘buy’ in technical analyses, with a stop below Thursdays candle, so we’ll see how it plays out. I’ll explain that ‘buy’ set up below…
Let me explain the trade in technical analyses.
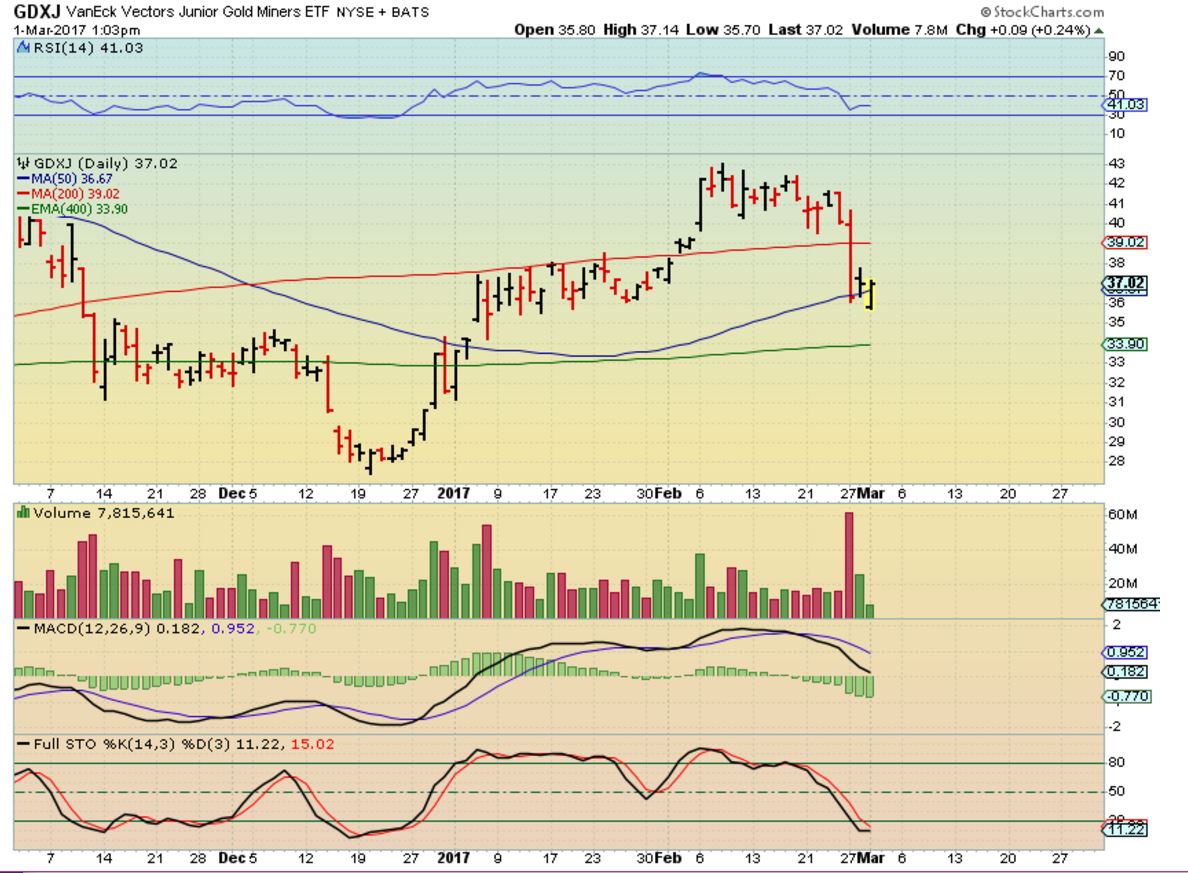
During the day, we were seeing a couple, then a few, then many miners reversing all at once. That would indicate that not just 1 or 2 Miners were being bought, but it was a sector recovery. I was watching this reversal in GDXJ, and this is the set up in progress.
1. In technical analysis, when you have a sell off over a number of days and then you get a reversal candle, you look for it to take back more than 1/2 of the prior days candle. If it does, you can buy it with a stop below the low. ( I am in front of my screen so, if ‘circumstances seem favorable’, I will cheat and buy intra-day and hope that it closes above 1/2 the prior days candle). This is GDXJ at 1 p.m., it was beginning to overtake 1/2 of the candle.
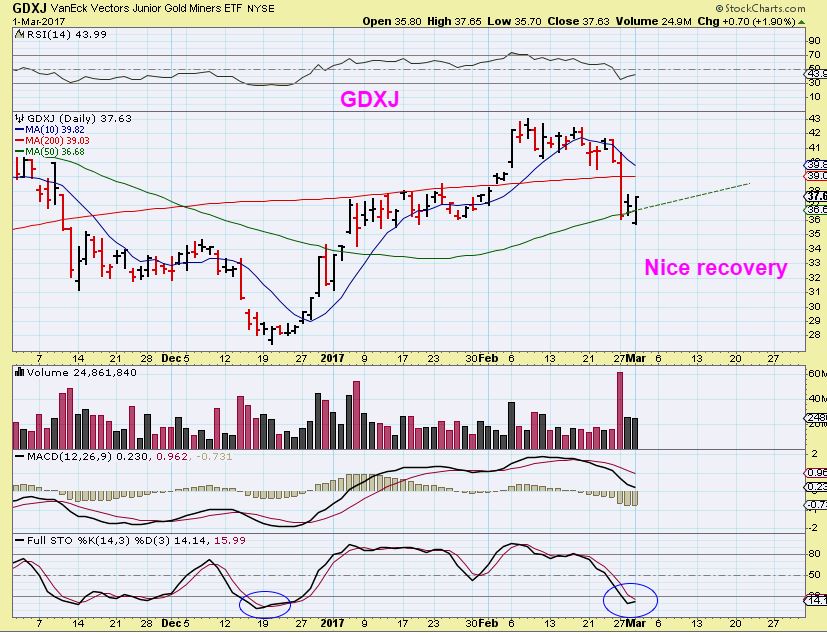
GDXJ 3:24 P.M. –
2. The ‘favorable conditions’ for me were that mid day Gold was recovering & most Miners were too. It seemed that they entire sector was reversing, so I believed GDXJ would hold 1/2 of that candle, and here we see that it was at 3:24 p.m. Now we had 1/2 hr till close, and it could still sell off, so Stay Frosty and watch that trade. ( The note written on the chart applies to Thursday s trading- I wont sell just because there is no follow through or even if we close a little in the red).
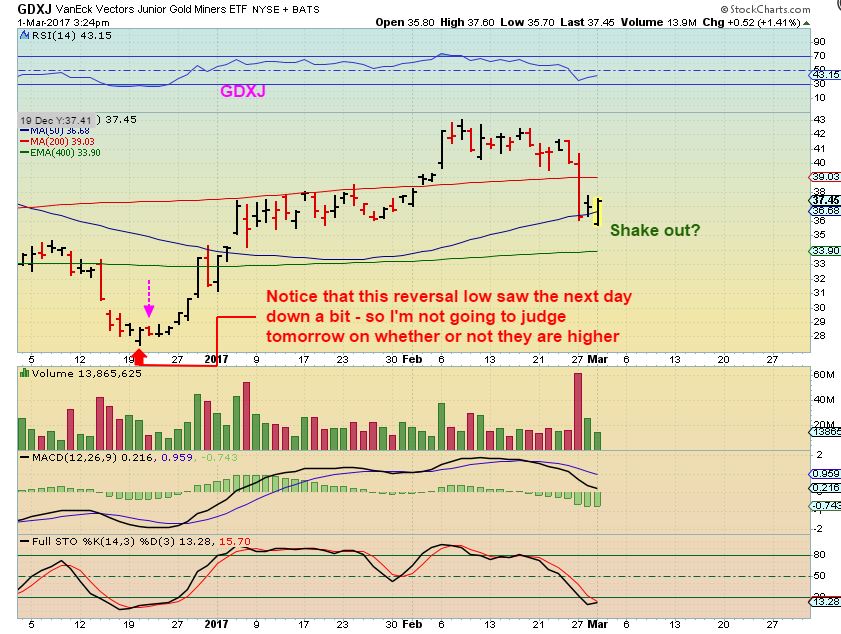
3. GDXJ at the close– We practically got a bullish engulfing in GDXJ. So far so good, but again this is tricky confidence-wise with the USD setting up to go higher and Gold overbought ( was that a stealth dcl? Or is the DCL coming on day 27 in Gold for example?). This is about as uncertain as I have seen things 2 months out of an ICL, but I took a small trade and we’ll see how things shake out here. Tricky.
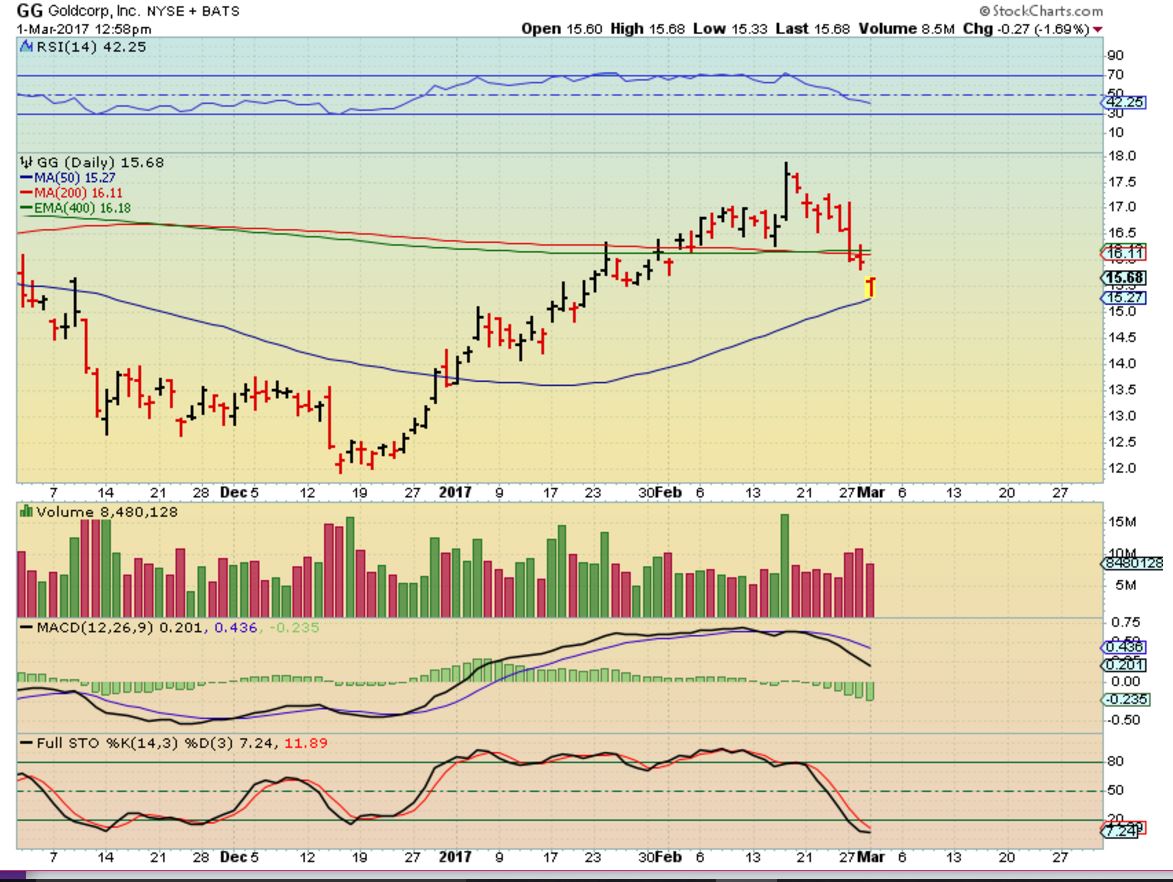
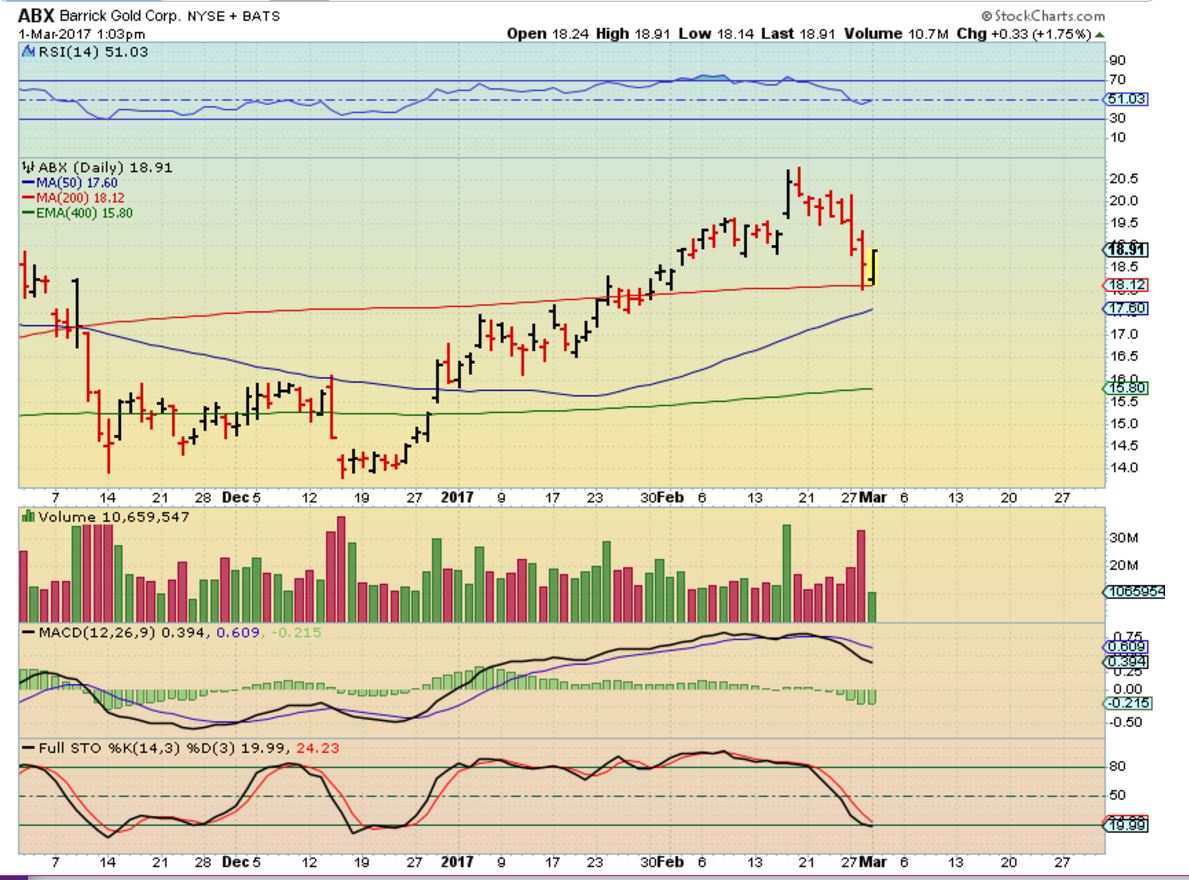
SO GDX & GDXJ are oversold, because they started their drop while Gold & Silver were still climbing. Other Miners are in the oversold area too. We can we look at a few more miners and see if things are lining up right across the sector for a possible reversal higher after that selling recently.
.
GG – Slightly oversold. Dropped right to the 50sma and reversed. It did not close Green like many others, but the support was there and the reversal could get follow through. Higher GG would help GDX.
ABX – Slightly oversold. This is a very nice reversal right on the 200sma. This also would help GDX.
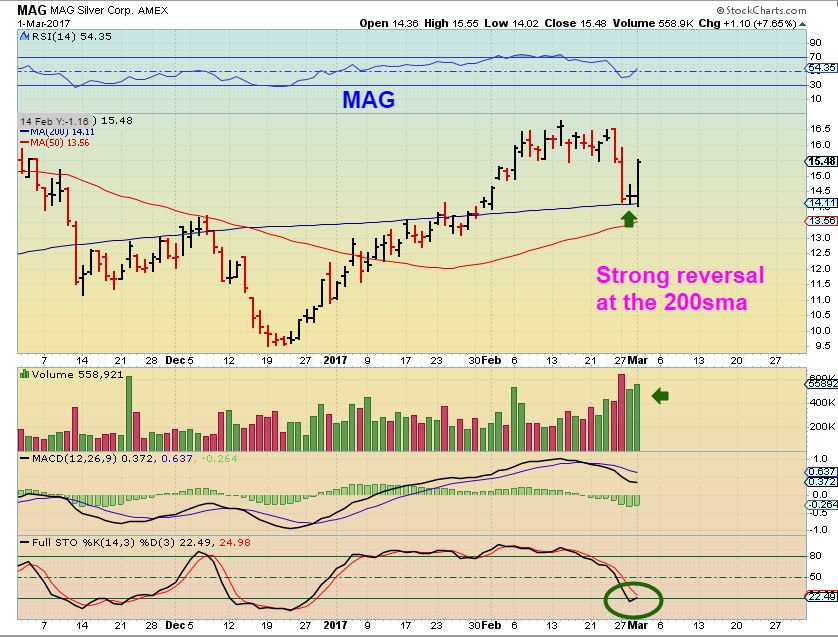
MAG – A very convincing reversal on support.
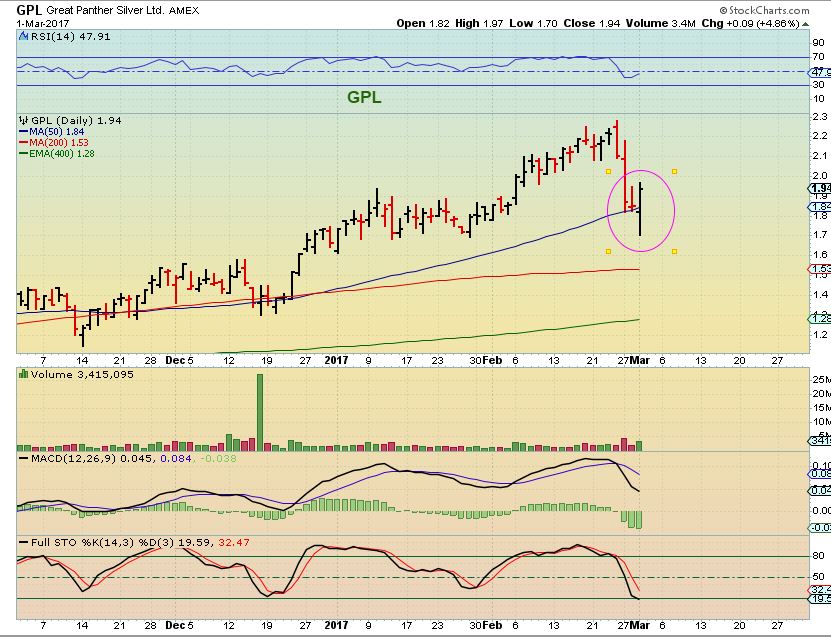
GPL – That was a pretty large drop in 2 days, but GPL lost and re-gained the 50sma Thursday with a nice reversal too. Anyone that had stops at the 50sma lost position.
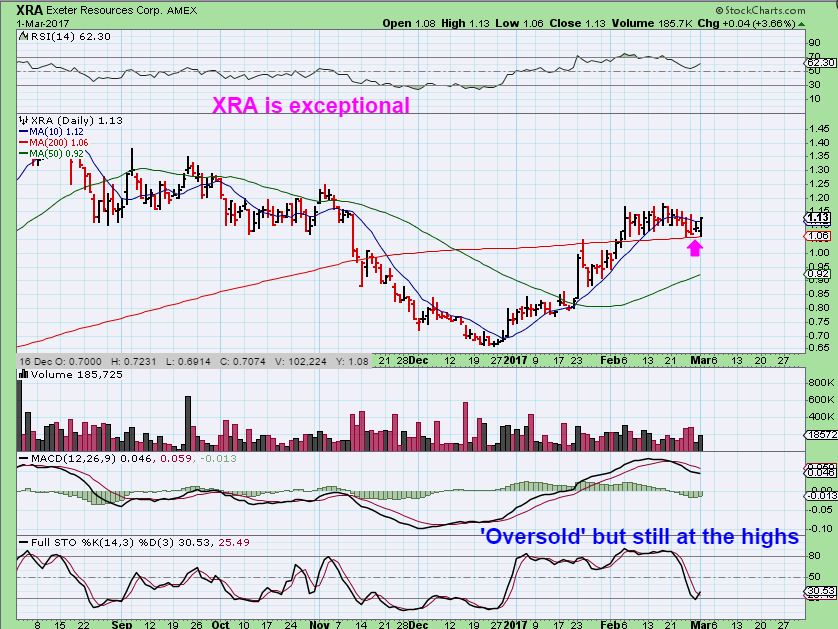
XRA – XRA is actually holding up very well through out the Miners selling off. This was a solid buy on the 200sma, and since it didnt even break down, it may be one that you want to own at a dcl.
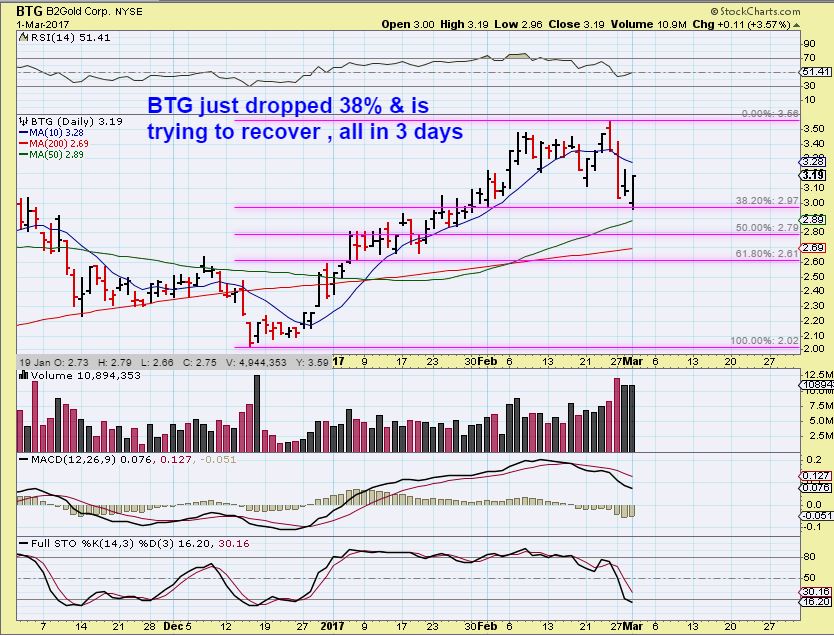
BTG – This is the Miner that held up very well , it was even at 2016 highs last week. Suddenly BTG lost a lot of ground in just a couple of days. Wednesday it too reversed higher at the 38% retrace. Nice volume. I would have liked to have seen a solid tag of the 50sma, but it turned at the 38% level.
Conclusion: There is no other way to say this other, this is an opportunity to buy low(ish) risk, because the stops are fairly close to current prices, but it is a bit riskier than usual due to the set ups. Stops immediately below yesterdays low keep losses small. Potential gains are good if the reversals lead to higher price with some follow through. We discussed risk , however, due to the USD strengthening and the idea that GOLD & SILVER MIGHT still have their DCL ahead of them in the near future, since the day count is in the early 20’s. I could conceivably see Gold bounce to say day 24, and then just drop to day 30 onto the 50sma as a dcl too. We have seen dcls in the early 20 day count, but they are often day 26-30 and deeper than what we saw yesterday. Time will tell, right?
That said, it is up to the reader to decide. Do I start a small position and add if it plays out bullishly? Should I just wait and see if there is follow through, and go heavier when I am more confident? Should I play it safe and just stay on the sidelines in this sector until things finally become more clear, and maybe look for some trades in other areas?
Speaking of that, The Metals stocks got a lift with the talk of infrastructure repair and economic growth attempts. Many stocks like CLF, VALE, X, STLD, HBM, FCX, ETC took off ( some pulled back a bit into the close, but they may be good set ups with a nearby stop). For example:
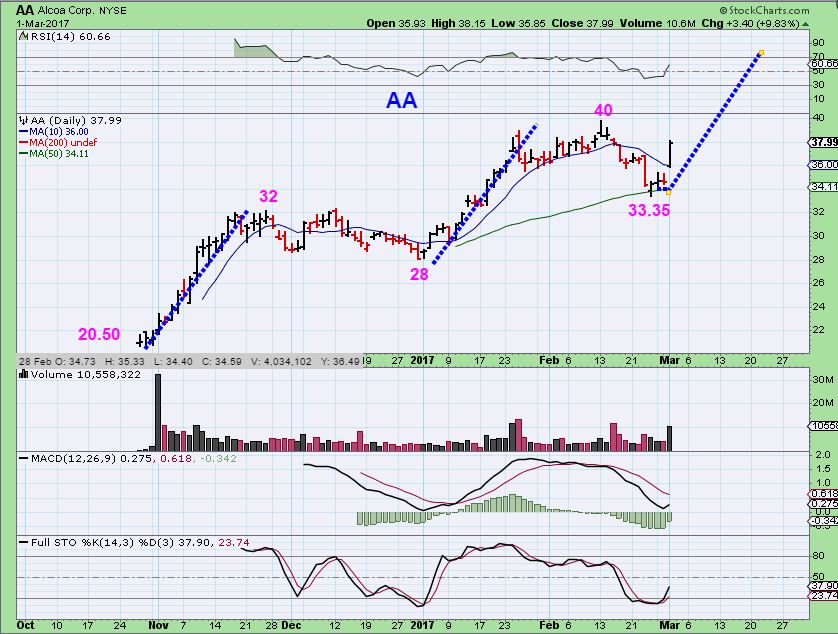
AA – AA popped and held those gains into the close. Since Trump got in office, notice that it has been running strongly for 1 month, then consolidating, running strongly for a month, consolidating…time to run for a month?
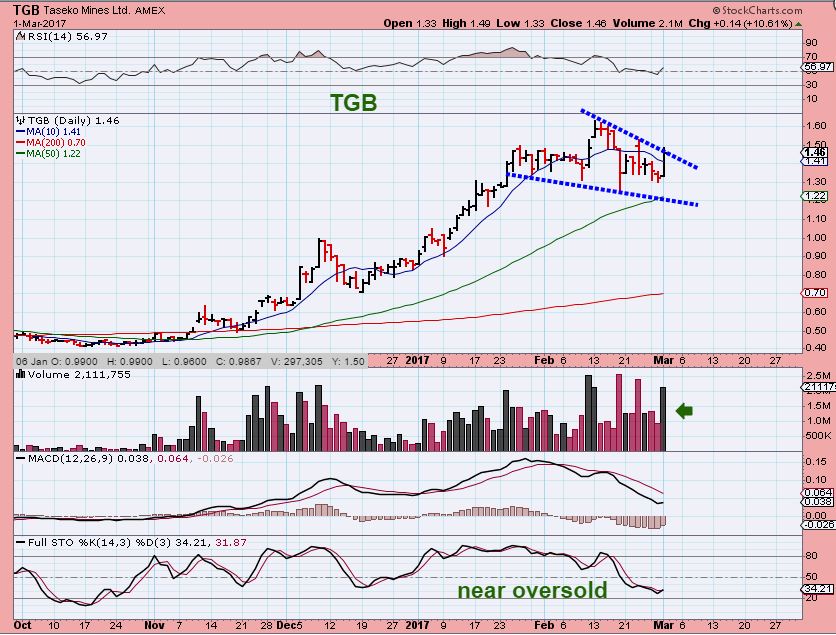
TGB – TGB has been a strong runner and now has had time to consolidate. I bought this one in the morning when it pulled back a bit, and it closed near the highs of the days. This could break out and run from here under these conditions, but normally I would think that it will tag that 50sma inside of this wedge before breaking out. If it breaks out higher, I will add to my position. a drop to the 50sma may also have me adding. I like it as a copper stock and it has done well with the infrastructure talk and inflation.
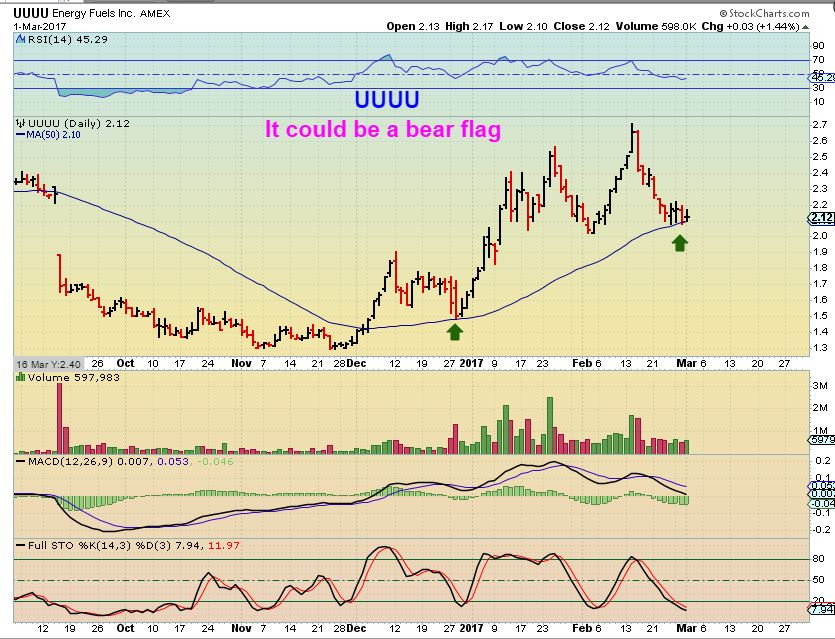
UUUU – This may or may not be ready to just run higher from here, It is on a support level of the 50sma, so a stop could be placed right below that area. It also could be in a consolidation stage and could just bounce around a bit more, but again, it is holding at the 50sma so far. That offers a low risk entry if you have a stop under support.
It is hard to know ‘exactly’ where we are at with Precious Metals and the USD. Gold is near the highs and overbought, the Miners sold off and near oversold. Both reversed Thursday and the USD put in a higher high. Are the lows in place for Miners and that was a dcl? Is it just noise in the middle of a sell off, and the real dcl is ahead as the USD rises a bit more? Tough knowing at this point in time. As things play out further, we will get clarity. So if you are conservative or unable to be in front of the computer, you may want to keep position size small in this area until it plays out a bit more. We may need to look in other areas for some trade set ups that are clearer . Enjoy your Thursday trading.
.


REFRESH – I was looking to add to my CNAB position on a tag of the 50sma as seen here
.
However I’m wondering if MJ stocks will POP today, based on the news that Dems are calling for SESSIONS to step down. He was in talks with Russia as Senator, and denied contact with Russia as a trump associate. The story is at this link
http://www.thedailybeast.com/articles/2017/03/02/why-the-fbi-and-a-special-prosecutor-must-immediately-investigate-attorney-general-jeff-sessions.html
https://uploads.disquscdn.com/images/4acf5e39a841104d149ead2bd7c57c78fc66ad2bef04caf51350650148993bec.jpg
At the time Sessions was a Senator, not a member of Trumps cabinet in an appropriate committee to speak to the Russians. Political Smoke IMHO.
technicality or lie? They will investigate and decide. I read that too , but he denied talking to Russia when asked by Congress.
And, your decision will be made on whether you eyes dart to the right or the left. There was a lot of ambiguity in the testimony. I fear Pelosi and company are playing with a revolution by Joe-six-pack.
Losing Sessions should be bullish for MJs. Also offer more stability. Time will tell.
Hey, check this out. Don’t know if it has a stock symbol:
http://www.marketwatch.com/video/sectorwatch/this-medical-device-scans-your-brain-on-marijuana/320FC472-6DA8-4AE4-8D5D-0465D78EC58C.html?mod=MW_story_top_stories
Is the Daily Beast impartial for the most part ? Just curious never heard of it before……
left-leaning
Thanks Nancy.
Actually, I googled the Session story because it was on a couple of local new stations this morning, and it came up in many news articles when I googled it ( I just grabbed that one, because it didnt have a video attached of him saying that he never talked to Russians when before congress).
I figured posting one with the video might be too lengthy for people here to watch focusing on other things.
try this 🙂
http://www.bing.com/search?q=Jeff+Sessions&filters=tnTID%3a%2281D1EC2E-E4B6-4f4b-AD6E-5C7DDB6784C2%22+tnVersion%3a%221840749%22+segment%3a%22popularnow.carousel%22+tnCol%3a%220%22+tnOrder%3a%223129ed27-03b0-489c-815f-01a8adfcc598%22&FORM=HPNN01
Basically it is everywhere this morning
Thx Alex.. again this really feels in my gut like an engineered distribution/accumulation into strong hands.. I try not to think like this but my gut really thinks we have a thrust higher into April. Shall see.
Hi RM, Did you get an email alert that the new report was out?
Just curious, since Many didnt yet.
No I didn’t. I just typically read it at this time daily 🙂
I agree. I am very suspicious. Don’t feel like the “big boys” have got the positions they want.
Thanks Alex, great report and analysis as always!
Thanks Ziggy!
As I have posted previously, I believe the USD will be strong this year due to Fed rate hikes. Yesterday’s pop in UUP seems to confirm that and as Alex showed in his chart the dollar is just getting started.
Actually, for clarification about what I think-
At this point I believe that the USD will weakness later on – due to interest rate hikes when they arrive. History proves that to be true, The USD is not strong during interest rate hikes, though you will hear people say that. History shows that the USD weakens during rate hike periods. I wrote an entire report about this when rates rose in the past. Look how strong the USD has been in a low interest rate period for the past few years. Maybe I will review this for readers in a future report. Interest rate hikes have weakened the USD and strengthened Gold in the past.
If the USD has entered a new Intermediate cycle, so the first daily cycle or two can go higher, but it could become a left translated intermediate cycle and drop down in time- when those additional rate hikes arrive.
This is just to clarify my view on this, I dont want anyone to be confused about what I think will happen in an interest rate hiking period.
Thanks for the clarification Alex, I was posting my own opinion only.
Thanks Alex for the great report and clarification on the dollar. On the employment report you mention below, are you referring to the ADP jobs number? That is usually out by now (usually the Wednesday before the first Friday) but I don’t see it yet. Then I recalled thinking that I read somewhere that the official one this time won’t be coming out until next Friday. Which I don’t recall it ever seeing put out on the second Friday of the month since I started following it. Has anyone else seen this??
Sorry Evan, I dont know what you are referring to when you say that I mentioned “employment report you mentioned below”? I dont recall mentioning an employment report at all. And when you say that I mentioned it below…do you mean in the report above? I dont see anything in a comment below .
Thx
Sorry Alex, my mistake. I thought you said jobs report below but I was walking and reading at the same time (bad multi tasker I guess:) ) and you said report referring to this report. No I did not get an email as I usually do for your report.
Still, wondering if anyone has heard anything about the jobs number that usually comes out first Friday of the month??
Stay away from traffic, ok? : ) (walking & reading)
Will do!! Lol…
Upon further research, I see what you are saying about the dollar getting weak during periods of higher interest rates. To me, it seems “obvious” that higher interest rates would make the dollar “stronger” than other currencies in this era of negative interest rates, but history has shown that’s not usually what really happens.
Years ago I thought that the USD would benefit from interest rate hikes, because ‘everyone was saying that’.
Then I did a report on it and looked into it to see for myself, and every interest rate hike had the USD pop that day fairly big, and then it was always rolling over and lower a week later, 2 weeks later, and onward.
So I think everyone that says it is bullish for the USD must just be remembering that knee jerk initial reaction of the USD popping on that day. Just a guess, but most do say that it is good for the USD, and maybe that is what they remember.
For a quick example –
we just got a rate hike in Dec 2015 ( Gold bull started again)
We also just got a rate hike last Dec 2016 – The dollar popped, gold dropped and bottomed, we got our ICL right after that rate hike. Off Gold went Dec to Feb and the USD stalled.
Alex, I did not get an email this morning and it was not in the junk mail folder either. Is anyone else having problems? I found it by going to yesterday’s post and found it at top right corner.
See comment to RM earlier
Just got through the comments….sorry.
We hire an auto email alert service, it’s not manual, and at times they ‘fail’, but I will say this….Twitter has never failed to auto tweet the new report. Not once has it failed.
Alex, I got tweet and text alert.
Twitter never fails : )
We are getting 60-70 MPH winds today and occasionally power flickers ( Branches hitting the lines? I Dont know, but there is a chance that I could lose power off and on).
That makes me a tad edgier about my new position that I entered yesterday on that reversal , with Gold down pre-market. I HATE using hard stops, I like mental stops, but if I lose power I either trade by phone or need to put the hard stops in now : (
Bill – You getting these winds down there?
At fairfield county, we have strong wind too. You need to get a standby generator. 🙂
I’m fine with that, I should have been more clear, that doesnt help my internet though . When they go down, I have to wait fro XFINITY to repair
Yes, Very windy here. Will be tough in the line tonight!
Hanging out in the TreeHouse? Bring a kite as a conversation piece 🙂
Ha, Will do
Mentioned yesterday that NWGFF was bouncing right off of the 200sma. Today it popped (So far) .
I added to CNBX = 10 sma
Sessions helping MJ today ? : )
My MJ watchlist is mixed. No real joy yet.
NWGFF – BIG BIG VOLUME in the first 5 minutes.
New report out : NWGFF – Vancouver, British Columbia, Mar 02, 2017 (Filing Services Canada via
Comtex) – New Age Farm Issues $2 Million Contract to Start Site
Preparation for Buildout at its Langley Facility
Alex, you mentioned a natural gas report or number released today. I googled it and not finding it. I realize it’s probably coming out later, but do you have a recommendation for where to check on the report, like a website? Thanks! Bort
I need to look it up- I thought 8:30 or 10. Maybe I’m mistaken
10:30 usually
Thx
Some miners are already below their yesterday lows, GOLD, EXK
EXK earnings driving down, that’s another one going down after earnings
HL now also
This is ex-dividend date…. HL just paid dividend today.
THM, ASM, GSV, PGLC – green or trying so far
Must the glass always be half full : )
USD: (UUP)
Still working on the “b” correct wave up with “c” wave down to come soon.
Also at the 62% Fib Level…….
And it lines up with being late in the daily cycle for the USD : )
Thats what I like to hear…… 🙂
I replied to you with this below too 🙂
http://www.bing.com/search?q=Jeff+Sessions&filters=tnTID%3a%2281D1EC2E-E4B6-4f4b-AD6E-5C7DDB6784C2%22+tnVersion%3a%221840749%22+segment%3a%22popularnow.carousel%22+tnCol%3a%220%22+tnOrder%3a%223129ed27-03b0-489c-815f-01a8adfcc598%22&FORM=HPNN01
Gotcha….no worries…..although I was wondering if it might be a “tell” on your “leanings”. 😉
No response needed….. 🙂
or my ‘investments’
lol
#KissyKissy
lol…dangerous area.
Who was that? A nosy neighbor?
😀
lol
UPDATE FOR THE GLASS 1/2 FULL : )
PZG, TRX, ASM, ( Even AUMN) , CALVF 4%, BALMF , and a few more low volume juniors green
PZG looks like a nice reversal, but no volume : ( AT least it isnt selling off.
Add VGZ and GFI
So if they dropped and are starting to turn green, it could be an indication that the sellers are being shook out and the selling is now weakening. Accumulation may be taking place at each drop.
#MAYBE
Getting a little impatient with UUUU……
Same.
oh i LOVE the bottoming process in miners…
*SaidNoOneEver
😉
Suddenly the daily chart of GDXJ looks like a bear flag : (
I tried to tell you the glass was half empty ; )
when the lows of yesterday break on GDX or GDXJ – the glass may tip over.
I’m still holding till the levee breaks
JDST HEDGE ANYONE : )
I think I perfer to stop out of MUX and EGI purchased yesterday afternoon if they make new lows. ReEnter later….
Me too – I meant for the quick ride down. I had a a-b-c down showing up on the 15 minute chart of GDXJ .
Just ride both and cut one at my stop
Stopped out of JNUG I bought yesterday at my entry point. I still think we get a temporary low here soon.
yep
There has been some real symmetry in golds rise. If you look back at the last correction it lasted 7 days. That’s why I said Yesterday’s move higher was a pop and drop. I am watching for 1323 to buy back in. Could be Today or Tomorrow. The last run higher was around $47 dollars. I expect to get the same move higher. Its been very symmetrical if you look.
FYI .. in case anybody is wondering, I sold my small starter JNUG positions from yesterday. I made the mistake of trying to “front run” my charts by buying before I had a clear “buy” signal on my daily chart. Sometimes that gives me a jump so I can buy closer to the low, but other times it fails. Miners are still in a clear DOWN trend IMO.
That was a ‘wicked’ intraday slam and reversal
Was?
Posting from the future I hope
I am, you’ll see 🙂
All aboard the Delorean!
lol- Watching the GDXJ on a 1 minute chart . Schizo moves
It was… too bad there was no follow thru today.
Does anyone still own IPI?
And posted real time
Prop’s to Chad. My thought’s exactly.
Good luck Chad.
there are more stocks declining then advanced yesterday. that plus gaps everywhere shouldn’t be good for a couple of days
I added to NWGFF – bounced off of the 200sma yesterday & good volume today ( probably accumulation on that news item).
I finally bought some too. Very appealing business model. bort!
Ditto. Bought mine on the Canadian side. Ticker NF…
Thx for the info! Don’t have to lose $$ on exchange now.
sorry just saw this Yes, it’s NF. Been holding steady at 0.165 most of the last few hours… I usually look for the Canadian tickers for the same reason – the exchange rate – and I buy those if the average volume is good. (like over 150 K daily). If volume is not there I go with the US ticker. Many of these companies are Canadian anyway and mirror very closely the US price movements. EG NAK is based in Vancouver and trades in Canada under ticker NDM. Most of them are like this. Just pointing it out in case you didn’t know…
PS – dishy, in case it’s helpful, I have both a USD and CDN$ trading account with RBC and can move money from one to the other (with exchange rate of course) easily. With other platforms apparently you can’t do that. Some of the US dollars were converted in my accounts when the USD and CDN were much closer, so of course that pays off back into CDN$ conversion now that the USD is stronger. So you have to pay attention to that as well.
sorry deshy – autocorrected to ‘dishy’ 🙁
Sorry what’s the ticker?? Not finding it on CDN side…
Good one Chad. I’m thinking the same way. Waiting for now…
Check out Silver – which was holding up very well as seen in this reports chart.
Dropped fast, but so far right onto the 200sma.
To add perspective, the P&F chart of JNUG now has a bearish price target of $3!
http://stockcharts.com/freecharts/pnf.php?c=JNUG,PHTADANRBO
Those P&F chart price targets often do not hit because the charts change as the market changes. But they they hit often enough that I look at them. For example, when miners were still in an UP trend, the P&F chart of JNUG had a bullish price target of $14. JNUG hit an intraday high of $13.03 on Feb 8 before rolling over, so that’s pretty close.
Just more food for thought.
Interesting, thanks Steve. Have you ever used Renko charts?
Never heard of Renko charts … please explain.
Similar to the P & F’s. Based on the same idea anyway, but I find them more visually appealing. I’m also now playing with the Heikin-Ashi style chart. Seems a bit more sophisticated than Renkos. You can see both at stock charts under chart attributes, pull down from ‘chart type’. I’d be interested to know what you think.
Thanks. I don’t follow P&Fcharts very closely, but I check them every once in a while because the price targets hit about 50% of the time in my experience. And often the actual high/low price is remarkably close to the price predicted by the P&F chart. So hard as it may be to believe right now, don’t be surprised if JNUG drops all they way down to $3-4 as predicted by the P&F chart.
Good. Thanks Steve.
IMHO: H-A are better, in fact, excellent. Shortcomings: Can’t see gaps (so put it side by side with a candle chart), may not see some traditional patterns as clearly, and price on the chart may be different than the actual price. None of these are a problem for me.
thanks. I’ll look further into them…
thanks.
Really helpful that, just after a poster show a real time trade. You state the P&F chart you may or may not follow might or might not hit $3. A nuclear missile may or may not hit my dinner table as well, but if it does I went long putin before the close!
It’s feeling like NAK has some relative strength here. How the bear flag is not breaking lower today is surprising- still might, but maybe sellers exhausted. I know I am : )
Ok, maybe there are more sellers
You always have to be careful what you say out loud in this game, huh? I get that often : )
GDXJ POSSIBILITY INTRADAY – I forgot to put ‘5’, but I’m sure that you get the point. $34.80 ish
https://uploads.disquscdn.com/images/e0245b89b3f69f56728fc22d663ae5c32212acf741236625c248dc1782f02faf.jpg
.
And if it isn’t a 1-2-3-4-5 correction, it could be an A-B-C that is finished and the possible bear flag would need to break higher
AND there she goes … Bear flag Just broke down
I’m just showing these from time to time to give example of how I view trades . The 5 may be a temporary bottom / low .
yup
Alex, shall I add or wait?
I’m going to lunch , so I wont be here to answer any short term questions.
I had a possible low at gdxj $34.80’s BUT that only allows for a bounce. It is more of what I would do for quick day trade scalps, not daily chart – if that is understandable.
I was just showing how I trade a drop, a short term bottom target for a bounce, etc – you could grab JNUG for a quick 50 cent pop as a day trader, but it doesnt mean longer term lows. Also I wont be here to see how much it progresses.
So if you bought, you’d need a stop & it is rather higher risk longer term.
Safer to wait for recovery since the USD is rising & GOLD & SILVER are finally correcting.
Yes, I posted above before seeing this. I think it might be the a-b-c; where C is 5 waves down.
On a 2 hr chart looks like some bullish divergences forming on the lower low of 5.
THx!
Its funny- right after I drew & posted that, it did the 5 th wave down and landed at $34.88 – which was my target area written above the chart in my post. Now we’ll see if we get a good bounce
I see the divergence in your chart 🙂
FWIW … my 15 min chart currently looks a lot like the Monday slam down, meaning the worst may be yet to come today. Miners could fall a LOT farther … just a “heads up” NOT a “prediction.” Good trading to all!
Smack down gold and silver in progress…again!
So natural gas inventory is up, but price barely dipped and was even up for a while. Can we assume this is bullish for price going forward, or at least “the bottom is in” type of thing?
Replying to myself *bort!* UNG and UGAZ closed above both the 10sma and 5ema, and PSAR flipped bullish. Volume slightly lower than yesterday, but bulk of past weeks volume good and positive; momentum indicators of various timeframes turning or turned up. Good enough for now, but I didn’t add today.
SLV giving it up today
so is deshy;-). Stopped out of all and waiting on the sidelines.
Yup…me too.
alex, do you think silver is going to be down for more days? I sold everything today, just not fast enough. Based on my instinct, it should be down more.
https://uploads.disquscdn.com/images/41f006ec51a814066a4d56358a6fe24f06ad666cd5321ab3efe0bbab5d272e3b.jpg
Hope springs eternal.
interesting to see some infrastructure selling off a day after, check out CAT, X
CAT getting investigated
GDX
62% retrace of run up from 18.58 to 25.71 = 21.29; roughly at 22 now.
Slo Sto has reset below 20 on the daily chart
2 hr chart shows positive divergence on CCI.
Miners need to step up to the plate pretty soon!
does this mean I can add some position with a stop?
Your call, could go to 74% retrace or totally break down.
Looks like we are in some minute 5 wave down (see Alex’s chart ).
Stop is definitely recommended but we still don’t have a swing low.
UEC down. Now @ 1.36.
I would like to see a little more “apathy” and a little less “hope”
I’m bearish on miners right now. Does that make you feel better? 🙂
thanks, steve. Please let us know when you feel bullish.
I will wait until I have some clear “buy” signals on my daily charts, which typically means I will buy about 3-4 day AFTER the “bottom.” So if you are a “bottom hunter,” don’t wait for word from me!
I’m not a bottom hunter. My issue is that I don’t go heavy when I start to buy.
That’s OK. Start light and add on pullbacks. Use 10 min if you want more action or 60 min if you like less stress.
All the golds I follow are red except for LODE, it is even. GORO is down 9.2% and JNUG is -20%. Bad enough? 🙂 Only those few who clearly out several days back can be happy.
This may go on until the fed meeting this month. Dollar up, bonds down, gold down.
Visually, the next possible support point on the GDXJ chart is around 33.7 or so.
OUCH. Out of ALL my holdings, only 1 stock is green…yay… 1 MJ stock is up…EDXC. It is still a loss but at least up for the day.
Painful…think I will go see a client about a mural. So, are miners HATED enough yet?!
JNUG has clearly become the PM trader’s favorite ETF. Almost 65 million shares of JNUG traded so far today vs. 50 million shares of NUGT, 41 million shares of GDX and 15 million shares of GDXJ.
Interesting.
Biggest gains
Cheapest. Price per share always figures into volume.
This is about the same time of the day that the miner slam down really started to pick up steam on Monday. My 15 min charts are still bearish, so watch out below! Again, this is intended to be a “heads up” to check your own charts and make your own decisions. Please do not make trades based on my posts alone. I’m merely providing info for you to consider. Let Alex be your guide!
TQQQ is much more peaceful. 🙂
Yep, I should have ridden my old friend TQQQ this year. Miners have given back almost all of their gains YTD and some like NAK are negative YTD. Fortunately, I went to cash last week to lock in some miner profits.
Always risky picking a bottom. GDXJ is showing a double bottom on the 5 min chart. GDXJ which is the underlying ETF for JNUG is at the 50% FIbo. You could Buy JNUG at 6.52 stop at 6.48.
I lost a ton of money “picking my bottom” in miners in 2012-2013. Ouch!
Tight stops. Im out.
I have found JNUG almost impossible to trade with a tight stop unless you are day trading. JNUG currently has an ATR (Average True Range) of 1.269 which means it trades within a range of $1.27 intraday bottom to top on a given day. So you need to set your stop about $1.27 under your cost to avoid getting stopped out.
Of course that’s true Steve, Except one place! The bottom….
And there goes JNUG higher without me,
There goes my stop. Painful day.
Did the same but yesterday. I have a small % of my account that’s JNUG/DUST money just for fun
Remember that 1-2-3-4-5 chart of GDXJ intraday 5 minute chart ( Target was hit at $34.80’s, but now the low is broken and it morphs into this 1-2-3-4-5.
The former ‘5’ in hindsight becomes the current ‘3’, and the former ‘3’ is just a bump in the wave 3
That happens to me all the time with E.W. projections. I’m better seeing it in hindsight, but it still works for my day trades.
So now GDXJ target $34.29ish
https://uploads.disquscdn.com/images/a6922b1a83cca995df6c1156256f45421026c09198448a2ca401ca4b36cb6df6.jpg
CF, you didn’t miss it far if it’s turned up. Let’s hope so.
Yes, short term it was close, but on the daily it could bounce and drop again. Its a bit of a messy sector at this point.
NDEV chart is rather interesting.
Alex, I wonder if it provides insurance plans for all the stoned snowboarders I went by in Utah? LOL
FYI … GDX/NUGT is now a “buy” (up trend) on my 15 min chart and GDXJ/JNUG is almost there. Remains to be seen if the dip buyers can rally miners into the close.
Let us know when JNUG hits ‘buy’ on your chart please. What indicators are you using?
I use a 15 min chart for intraday buy/sell decisions … I sold my JNUG early this morning based on the sell signal on my 15 min chart. I will wait for some buy signals on my daily chart (I use a variety of stuff) and when that triggers I will then use a 15 min chart to pick my entry spot on a given day.
15 min chart seems too noisy. Moves to quick for me. I would think the 30 minute chart would be a better choice. Have you tried other time frames?
What time frame do you use for a BUY?
thanks, Steve. GDX used to be my only gold stock. I held it from $26 all the way to $13. 🙁
still thinking GDX may be heading for a rendezvous with lower channel line.
check out the past interactions at the bearmarket corrections.
https://uploads.disquscdn.com/images/fbc94f721b109f94f5611065738fa000a1ad32abed8e53e0fedfa275192372b9.jpg
but what if this is a BULL MARKET?
then it goes up afterwards.
that is the question. FWIW, Michael Belkin still firmly believes it is.
Bull is dead. I’m just going to have to face that fact and move on to invest somewhere else. The story must have fundamentally changed last fall. Can’t really explain how/why but the charts are pretty clear that I’m getting roughed up and doing the wrong thing in the wrong sector.
great chart, thanks for posting.
actually… lookin at those past corrections, maybe a bounce after this week will take us on a path like this..
https://uploads.disquscdn.com/images/d3cd81959e011cdd6fecae62bc070cb1ff76a1fac8fbcd42a156bb9f70aaffea.jpg
I was completely eviscerated today. Haven’t had a day this bad in 2017, we’ll back to the fall miner collapse since it’s been this rough for me. Question for all – I’m floundering a bit here. Been holding my ‘core’ positions old turkey, lingerie tern. But now that plan has failed. I don’t want to sell out right at the bottom, but clearly the “bull” market in PMs is not what I had thought it was. Just eject out of everything here? Hope for a small bounce? The DCL should be here soon so sell out on that expected bounce? Or are we too broken to get much more than a quick bounce into another waterfall. Idk. The good news is that I’ve stopped out of so much recently that I am actually fairly heavy cash. I have that avail to deploy, but not of its just going to keep sinking. I had a plan. But events changed and my plan is broke. Not sure best course of action anymore for core?!?!
FWIW, I got into metals/miners back Jan 2016 (very early in their run, if it is a bull) so my core positions are all in the green, some as high as +161% – e.g. Silvercorp as of this moment, and others in the +40-80% range. Yet I’m still trying to figure out what to do here. Sell and lock in profit, add more, sit tight… This is the most confusing set of data I’ve seen. Sitting here also trying to figure out what to do with it. Maybe buy in more at the swing and use tight stops. But these stops runs are really frustrating. Anyway don’t really have any advice at this point, if I figure something out I’ll let you know, but you’re not alone…
It is ugly and many charts don’t look good. There has been some serious technical damage. I did well on my leveraged stuff and options. Sold that over the past week. Still have a core that I’m taking a hit on. My plan FWIW is I would expect a temporary low in here soon, maybe tomorrow. I’m holding my core and if we can get some sort of up move in the next 1-2 weeks I’ll be reducing my core by 50% and hedging that somewhat. My cycle guy is looking at a temporary low here, a 1-2 week consolidation of the down move, then a further decline to around the end on April. He’s been good. That makes sense to me. Second half of the year should be very good.
that timeline does sound right.
That helps, Carl, thanks a lot. Yes, thank God I sold my JNUG and options last week. Dabbled back in it a bit but not much and have stayed with a decent amount of cash. It took me months to build up the core, I’d hate to give all my gains back and sell out at the bottom, even if it’s temporary.
Rate hike chances seem to be going up rapidly. The last few, gold takes a huge immediate hit then starts to stabilize and eventually power higher. It’s funny that it can go up after rate hikes but that first 24 hours is usually pure evil.
I had it bad today too, but I will not give up my core positions at a low. Sorry you got whacked.
Thanks, Nancy, and sorry you took it on the chin. That’s the issue I am having – ‘don’t give it up to them at the low’. But if this isn’t the low and we keep sliding then it would just compound the issue. Then the 2nd question is, if we get a bounce are we back on track or do we just sell that before the next -40% week? Interesting that we’d get an ICL-type drop this early. Something is wrong, but I can’t put my finger on it yet. GL.
UPDATE: Just got back to my desk, looks like the “buy” on my 15 min charts has reversed. Sorry! Rough day in miners, best to just sit back and watch. https://uploads.disquscdn.com/images/b6e7b0d926bb619c0cd4f0fca50a1eeecfb5d4273885b0e834e0cf6b8b5705eb.gif
I need these MM plays to ship me a full load of their MJ to make it through the next 20 minutes.
Is that a Treehouse beer your enjoying?
I believe this is the 2nd highest volume day ever in JNUG
and it is STILL selling off! What does that tell you?
Second time this week that JNUG has had a down day of 20%+
Last week I was almost 100% invested in JNUG. What a drop.
$2 to $3 JNUG does not seem that far-fetched now.
If the market stayed open a bit longer it would drop to zero right here today!!
EDIT – it is now THE highest volume day ever. From what I’ve been told, high volume days tend to occur at turns – sure hope this turns up
EXK absolutely hammered. Just destroyed. Just wow. Unbelievable
Have that and holding, Not pretty. Still in profit though.
I had been…
Maria or Ken, any wave charts of what we’re seeing in miners? I’ll try again but my previous charts are all now invalidated.
This is quite the smackdown. Feels like it did 5 years ago, utter confusion as i thought this was a new bull market and that led to 5 years of torture. I’ll be curious to see what unfolds going forward
For those who use Scottrade, call your manager and ask for a rate of $4.95 a trade. It is known as competition. I don’t think Ameritrade is with the program yet however.
I will have a small report tomorrow morning. It is only going to discuss what is occurring in precious metals at this time. There are still various possibilities, but I will touch on a few things tomorrow and more in the weekend report.
As for CORE positions, I will discuss in the weekend report the implications of whether or not this is still a BULL MARKET OR IS IT NOW A BEAR MARKET RALLY? What to do in either case.
We are due for a dcl / bounce in the near future- there may be an opportunity to lighten up on positions currently being held if it isnt a strong move higher..
I’ve read some of the comments and it is true – Miners are getting toasted here, but please refresh for a chart .
This chart is 1 week ago today. 1 week ago. This was last Thursdays chart , and this was a great run in Miners. December lows into February. So This has been 1 week of major damage, but before this week, we had a huge run up from Dec into February and it was acting quite bullishly.
I just wanted to share that to show how fast these markets changed. More in the morning report.
https://uploads.disquscdn.com/images/ea3d88a1faa3c0cf7d878e3c86f26af4c3078aa3178c3577bcb4470d41799ffb.jpg
Thanks….we need it. I for one really want to know what you see re: bull still or back to bear. That chart makes it not look too bad.
I am glad I sold EXK on feb 22. Beginners luck still holding.
WOW – I didnt even see that one today .
Bad report.
Their 4th Q report was crap. Made $$ year-over-year but screwed the pooch on 4th Q. Has me a bit worried b/c CDE has been dead money since their report was poorly received. 3x avg volume as well. Wait, hold on real quick…. BARF!!!
Alex,
Here is my take on a Bear Market rally.
Probably too optimistic? Because this would still give us some good future gains.
When I look at a monthly chart on GDXJ, just looks like we should have one more move up atleast equal to the first one or A=C,
If we bottom out at $33.11 on GDXJ, that would be a 62% retrace and with standard EW would project out just a little better than A=C.
Look forward to your morning report!!!!!!! https://uploads.disquscdn.com/images/d3ed16493695b0d5327799c0539dceae61b8568b2152ea528b680f55898cf9d8.jpg
Alex,
As an ultimate fake out maybe we don’t even have wave B done? https://uploads.disquscdn.com/images/fae384966101443c2530232d4505f2ff3023237c1642d4239f13b0329a3bd9e9.jpg
GDX actually retraced 61.8 on daily. And back to 200ma on weekly https://uploads.disquscdn.com/images/e21bd29dc6da4ddaf81382eb24722351f5ca925f6ed9a30f7ba4d1540b9ffa28.png
My account also retraced 61.8% so that’s pretty accurate! But at least it wasn’t 100%!
SPY touched R2 on weekly chart. That was fast. https://uploads.disquscdn.com/images/e4ab91f486a08fac419faf405a54e1871b80122c5708c5949844f549859bd4e0.png
So, this is what a REAL Wave 3 looks like. Not the BS that miners are up to recently. Had my money on the wrong horse. As soon as we can get a bounce, I’m going to do a better job of diversifying.
Updated perspective on GDXJ.
*F5*
https://uploads.disquscdn.com/images/fc19f3c74cfef25474a62533bc9f6365e7da66cfe472275bc1012a48a6521bf1.png
We should all fully expect gold to fall a bit here. Miners absolutely telegraphed it on Monday. I would normally have taken out some puts but was too lazy to (turns out that was a bad decision). But fortunately had already sold my long calls last week. And we’re going to be right translated. On gold, at least. This is only a FIVE MINUTE chart, so ultra-short time frame. Daily looks just fine.
*f5* https://uploads.disquscdn.com/images/5f1c6329262687a80d145218bdcdfd95e5d92787960da4ae42276fbf060957de.png
We’ve added $2 back in the last 20 minutes. Whoo! Let’s hit that miner DCL now! (which will incite tons of questions to CF if we get out on the next bounce. But I know he’s ready for them).
Didn’t get to post earlier but also was stopped out of URRE when it lost support at $1.90 for a bit. Also stopped out of UBNT (tech play) when it lost recent lows. But positions were small with tight stops, so the loss wasn’t too much overall. Rough week, but keeping it real.
If you want miners higher, this gap down is best case scenario
I hope so. Cause I definitely want higher. Does not look good for us at the open here!
Gold is only off a few bucks really from the high. Certainly not enough to warrant a 50% haircut in JNUG. I continue to be completely baffled.
NEW REPORT POSTED-