
March 7th –
Let’s discuss a little bit of what has happened since the weekend report.
NATGAS from the weekend report. This has been a low risk entrywhen it moved above the 10sma, but there is resistance at the 200sma. Notice how NATGAS started out slow and then rallied strongly out of Novembers lows.
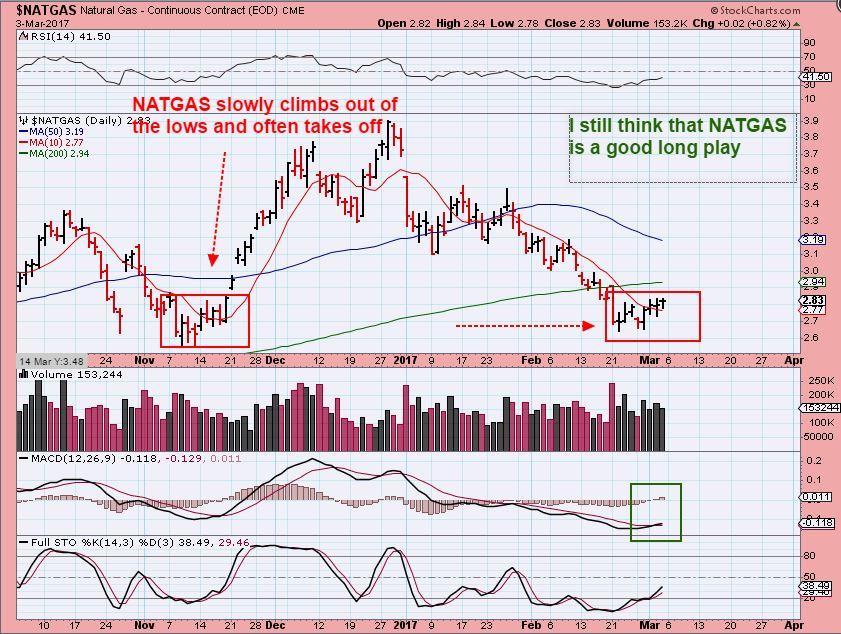
There is one thing that I am considering in the NATGAS area however…
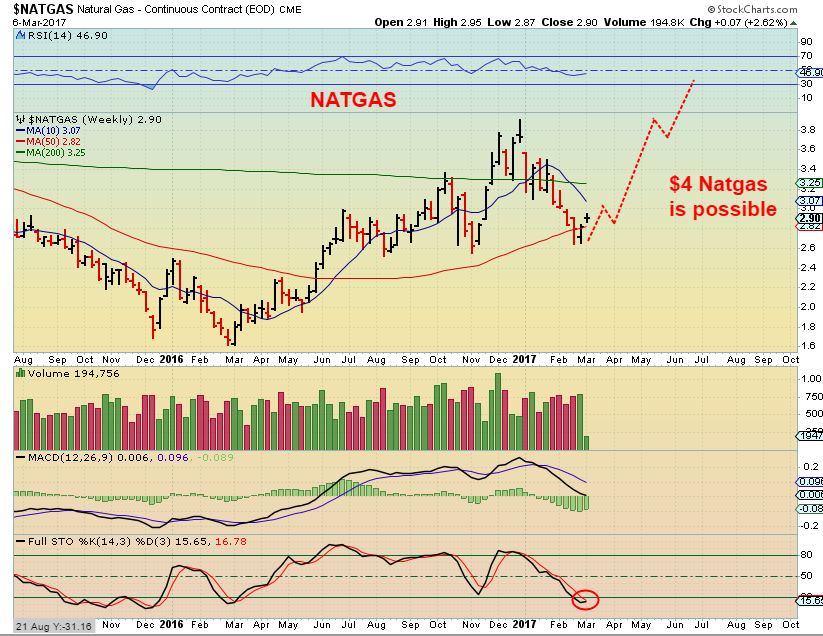
It seems too early for an ICL here, if we had one in November, but we’ll see how it plays out. I looked at the weekly chart and NATGAS has regained the 50 ma and has solid upside possibilities here, if that was an ICL. I would definitely honor a Stop below the recent lows or even the 10sma on the daily chart.
NATGAS is in an area of support too.
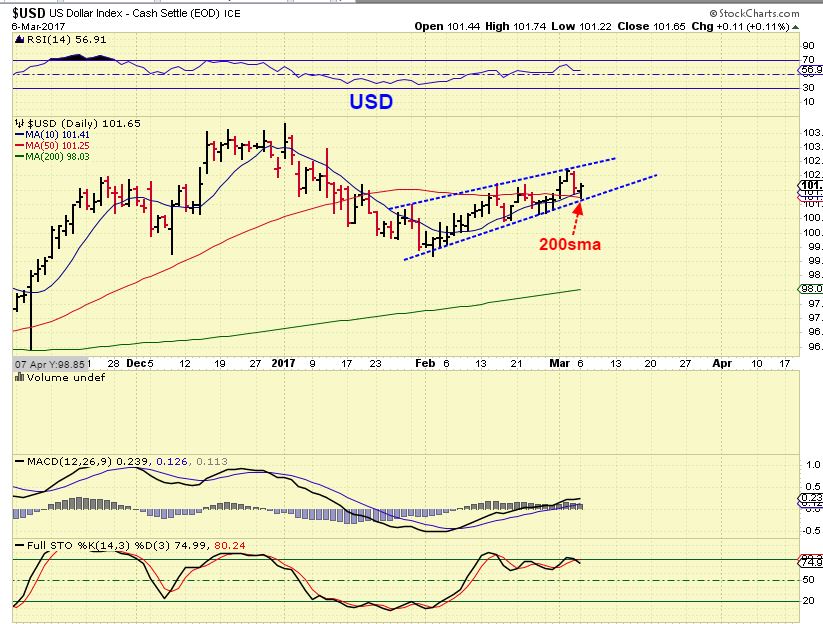
USD – The USD peaked at 102.27 on day 19 and Monday was day 21. We are expecting the USD to roll over soon and drop into a daily cycle low. This should bounce Gold & Miners.
Precious Metals : I think at this point I’ve talked about the big picture view and the shorter term view, but some have lost sight of what I think could happen short term from here. Let me review what I think we could see.
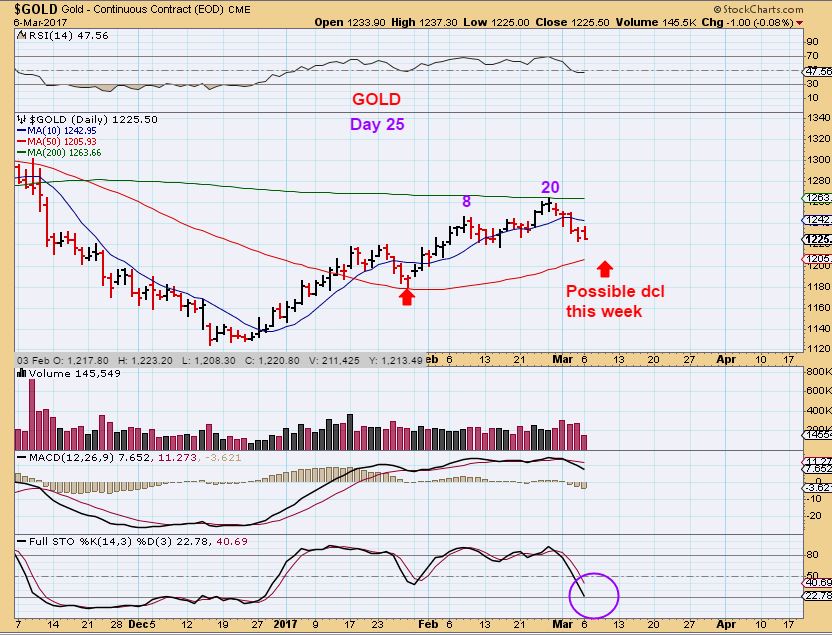
GOLD – Gold is slowly selling off into it’s daily cycle low as the USD rises, and now could be close to putting in that next DCL when the USD drops. This chart was in the weekend report…
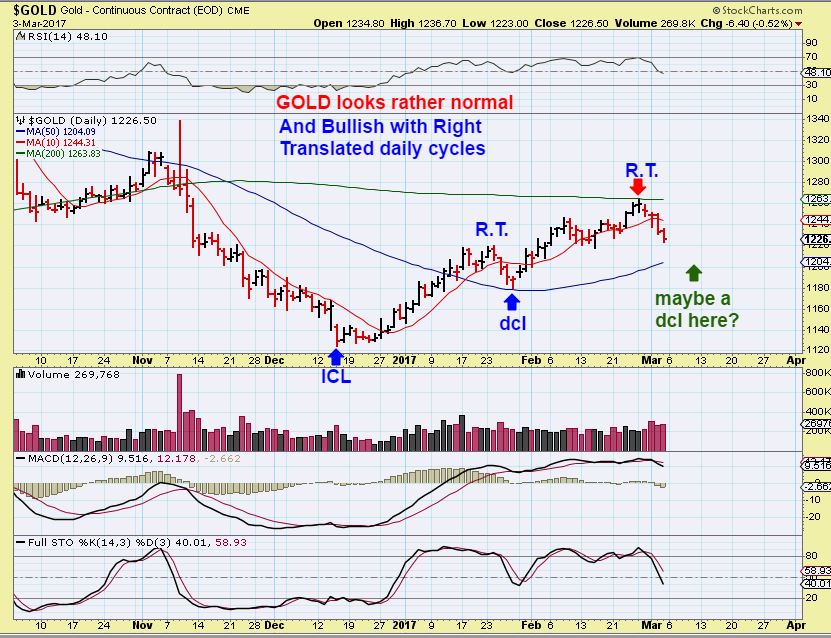
GOLD – 1 day later and Gold is starting to get oversold, but still isn’t dropping as sharply as the Miners are. So far Gold has put in a mild right translated daily cycle. Gold could break above the 200sma and the intermediate cycle could peak on the 3rd dcl. So Gold looks healthy, but those Miners are acting weaker. Lets discuss that difference.
MINERS have been acting very differently from Gold and we need to monitor this. Think about this : Miners peaked in early February & Gold peaked last week. That’s a big difference. I have to view Miners as weaker until that changes, so I am going to give them a weaker outlook for now.
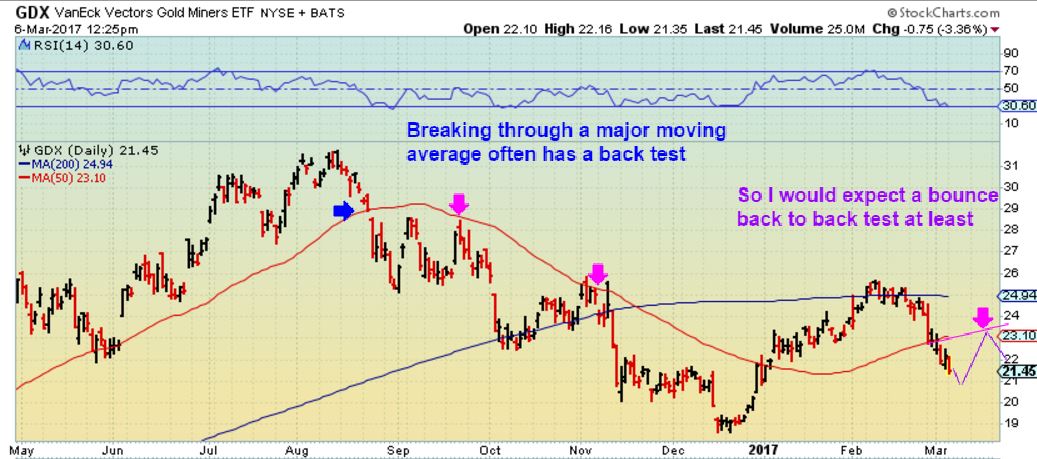
GDX – I captured this on Monday Morning as the Miners were selling off and nearing that 61.8% fib area.
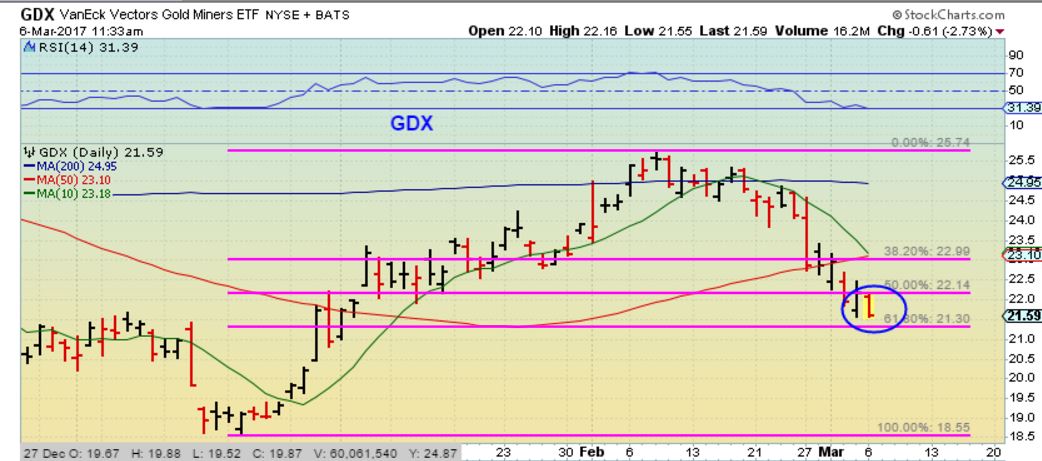
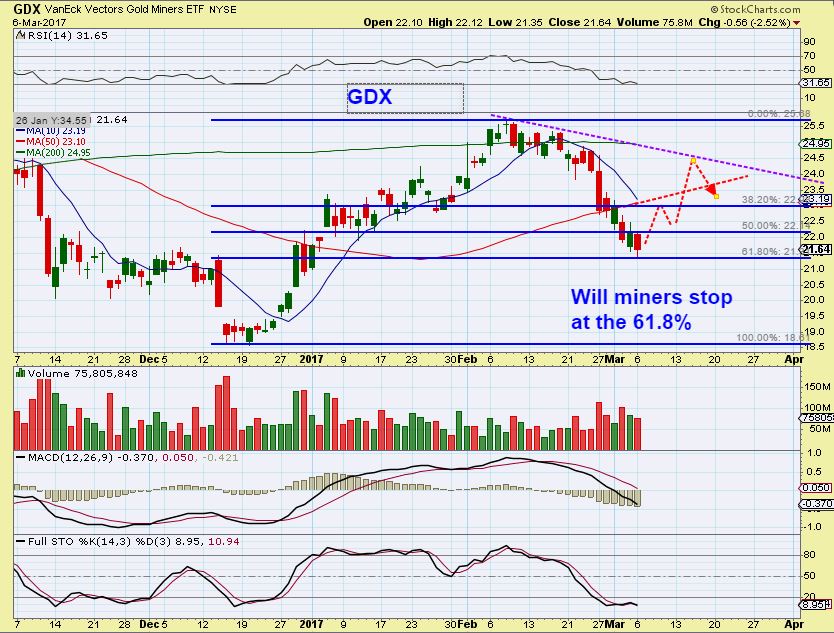
They actually bounced off of that fib area by the close, so maybe Miners will bottom before Gold since they sold off first? When we do get a dcl, I will be monitoring the bounce closely, because as GOLD enters its 3rd daily cycle, it too could have a weaker bounce. Below I have drawn a decent bounce if Gold breaks above the 200sma.
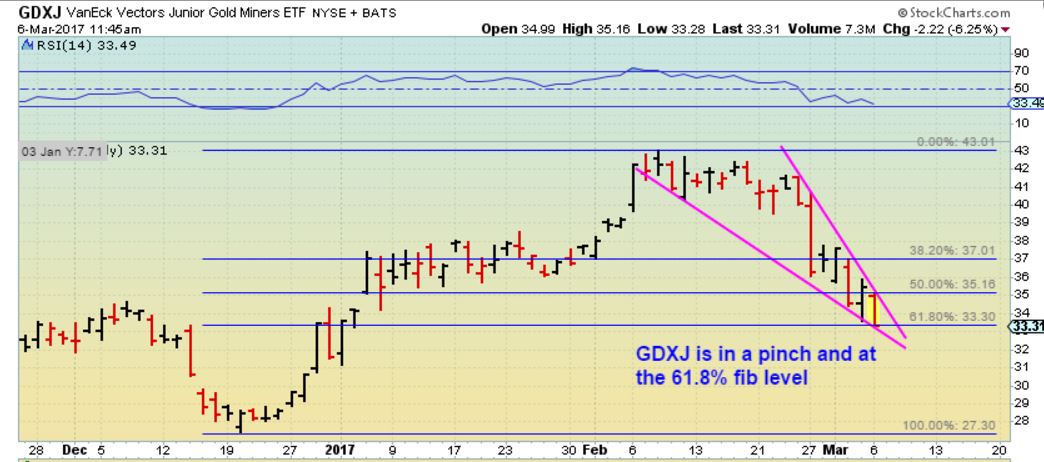
GDXJ – I could see a wedge forming here Monday morning. A break higher would be bullish, but a break down could get even uglier before we see a bounce. Would the 61.8 % Fib hold?
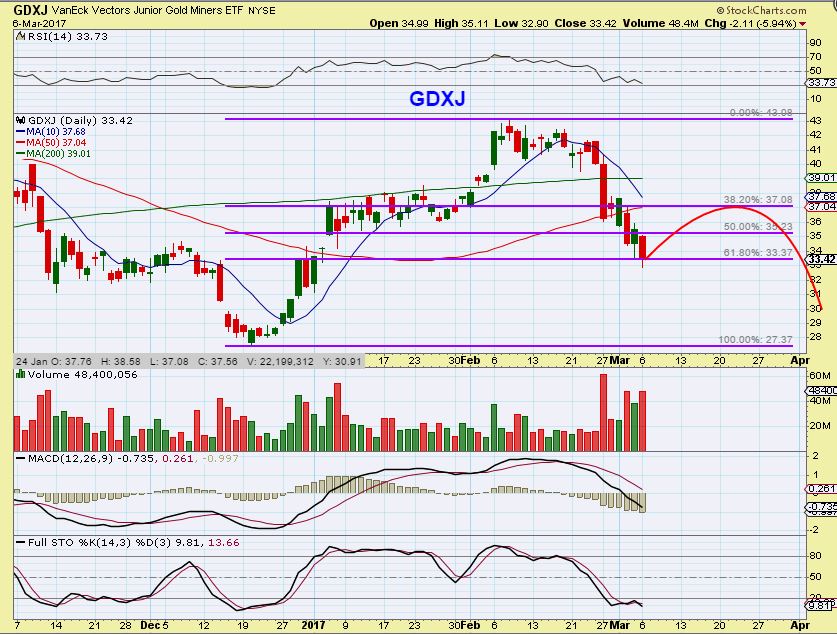
GDXJ – GDXJ bounced into the close and ended off of the lows too. This represents a weaker bounce as Gold enters the 3rd daily cycle. We want to be aware that GOLD eventually rolls into the next ICL down the road. THAT ICL will be a STRONG BUY .
GDX BIG PICTURE – Possibly a 3rd daily cycle bounce back, back testing the 50sma? I will monitor that bounce when it arrives, it could get to the 200sma too.
GDX – Could we see a 3rd and 4th daily cycle drop Miners down to a double bottom in this stage of a bull Market? We could and it also could still be a bull market if it did, as shown this weekend.
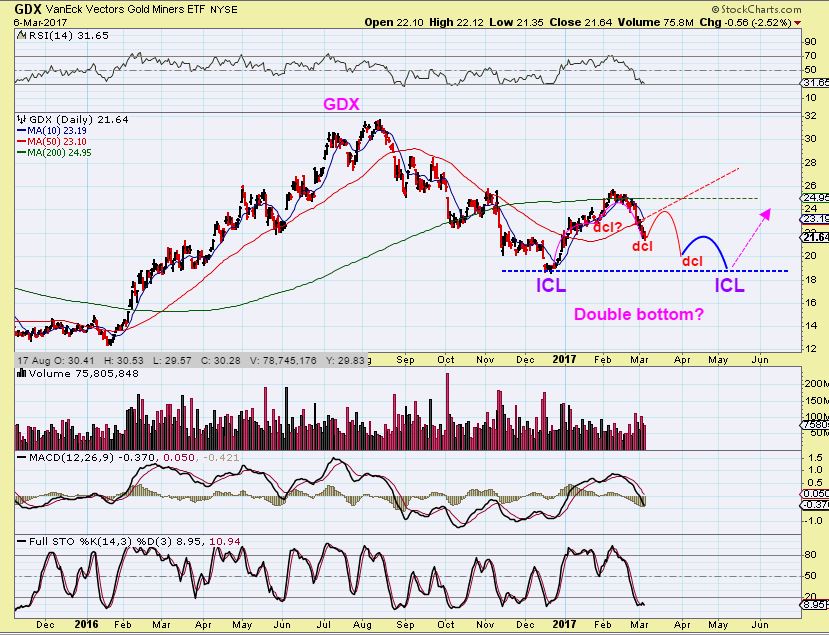
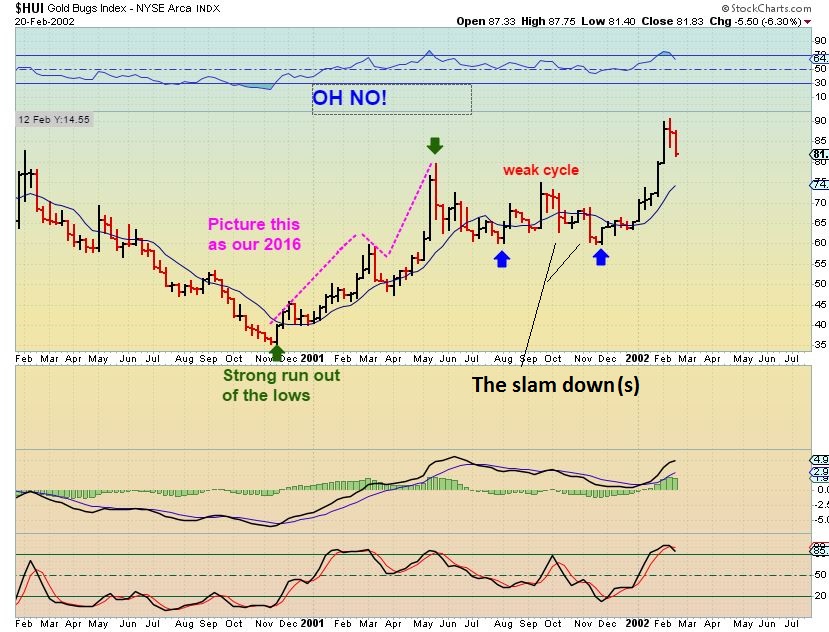
It could look like this. Recall the double bottom shown here in the weekend report. This double bottom was early in the bull market in 2002. Also remember that GOLD did not double bottom, only the Miners did, as shown in the weekend report. Miners still rocketed higher later, so that ICL due roughly in May will be a strong buy.
There was also this anomaly in the weekend report. Miners sold off and broke down rapidly into a double bottom in July 2004, but it was a false break down. Miners took off upside and didn’t look back. So we need to be ready for anything, since so far GOLD is still acting very well.
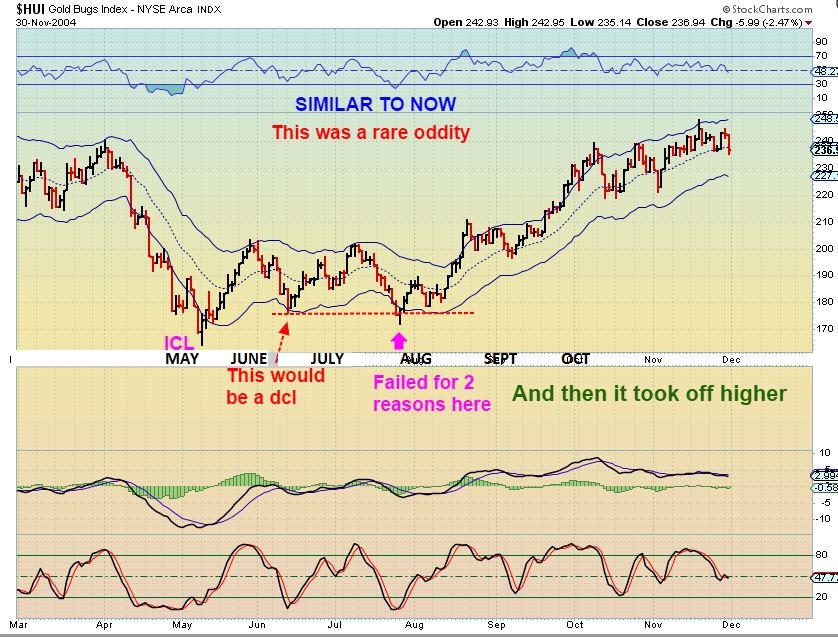
Please note that the above chart shows the HUI was looking weak only 3 months out of the lows. We are now 3 months out of our Dec ICL. And look at that extreme sell off in July for miners, is that similar to what we are seeing now? That looked very bearish, but the Miners then took off higher when Gold went higher. We just need to stay alert and Stay Frosty my friends! It is impossible to know exactly how this will play out, but we will figure it out as things unfold. Thoughts on the general markets and Oil have not changed from the weekend report. I am heavily in Cash waiting for opportunity. Enjoy your Tuesday trading.
~ALEX
.
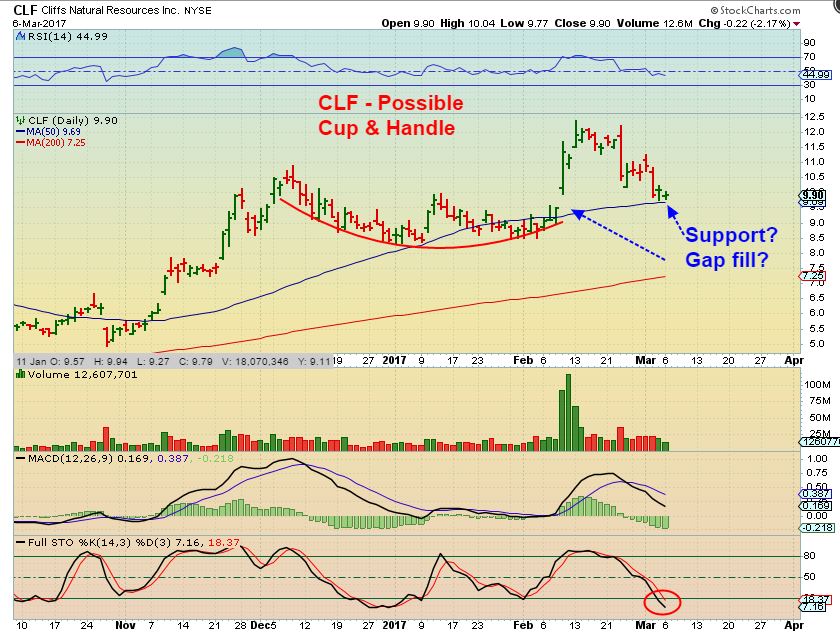
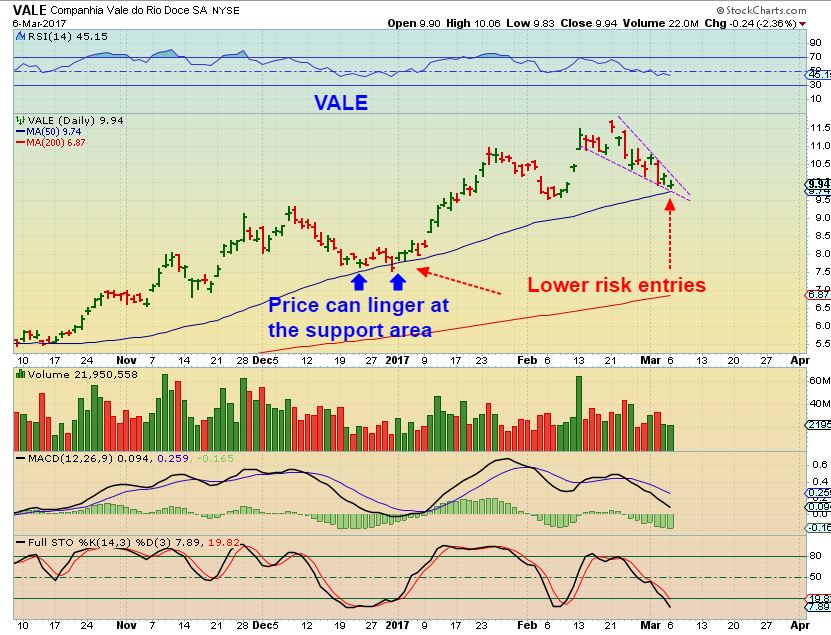
For traders – Look at charts of CLF, VALE, TGB, WRN, HBM, etc. 2 of these are shown below. They seem to be setting up as low risk entries again, as they drop to their 50sma. They can be bought if you are interested in this sector, with a stop below the 50sma , in case the set up fails.
VALE – Notice how Vale lingered at the 50sma back in December before running higher. It even broke the 50sma & recovered a day later, so I would use a semi loose stop, but sell if it doesnt act correctly.
AS A REVIEW: This was a strong run out of the 2008 bear market lows, but the path to the higher prices was not easy, it was a bumpy difficult ride. This series of charts simply shows that strong bull run and what it took to get to the top.
GOLD – A strong bull run in Gold ! EASY MONEY, RIGHT?
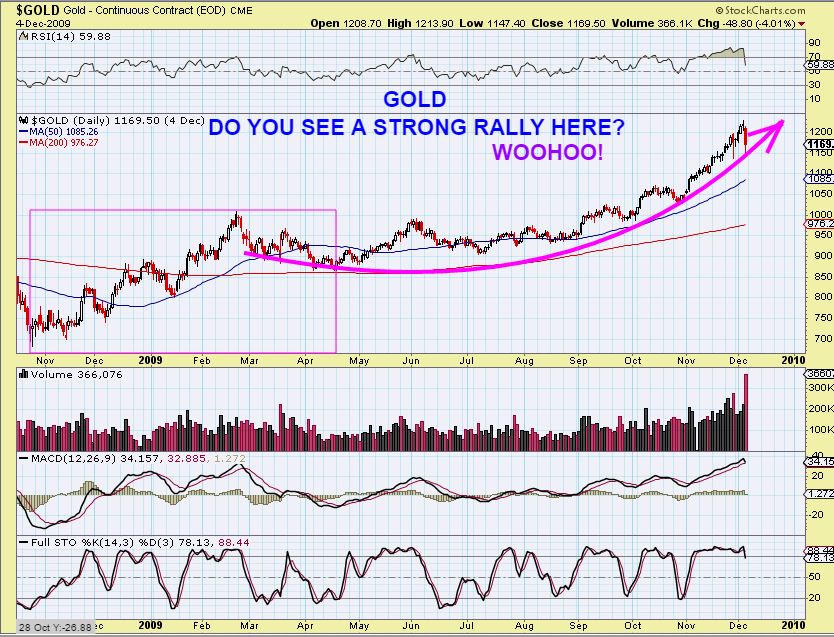
It always looks easy in hindsight, but I want to zoom in on where that ICL started on April 2009 through September. That was actually 5 months of volatility .
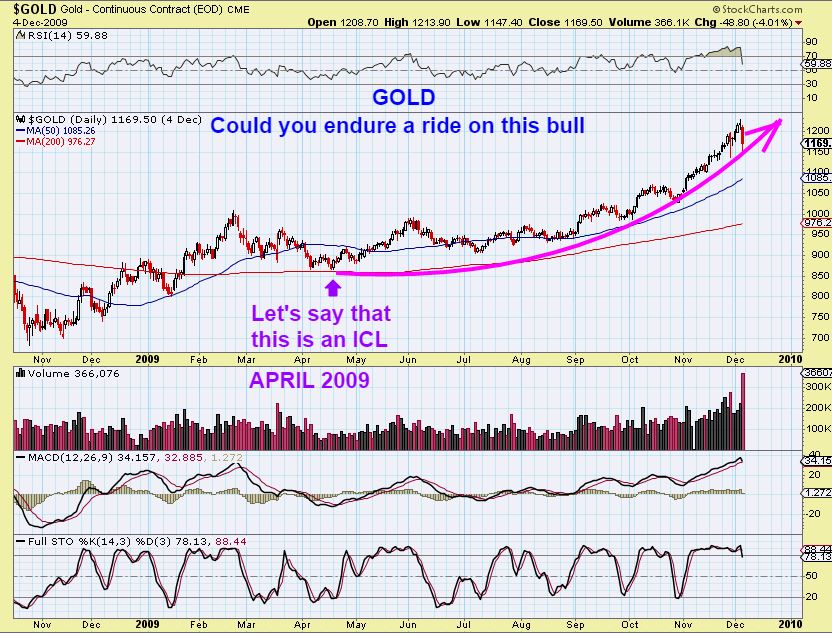
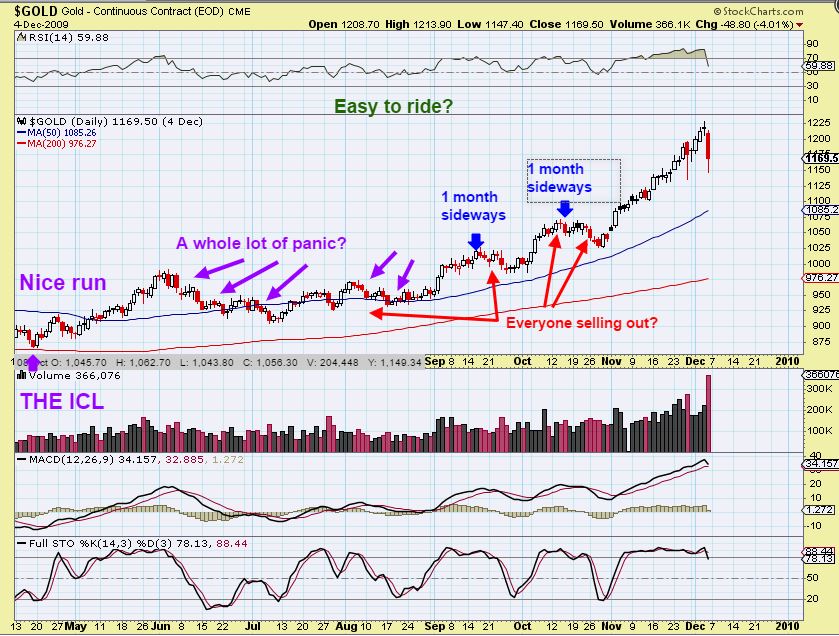
GOLD BULL – This was that April though Sept period. Please read the chart, this could be similar to what we are going through right now. Day after day there was volatility, not an easy ride.
ZOOMING IN ON GOLD DURING THAT SUMMER OF 2009 – Gold is currently having a mild sell off compared to this one. (Miners are obviously not in a mild sell off). My point? Bull runs always look easier in hindsight.
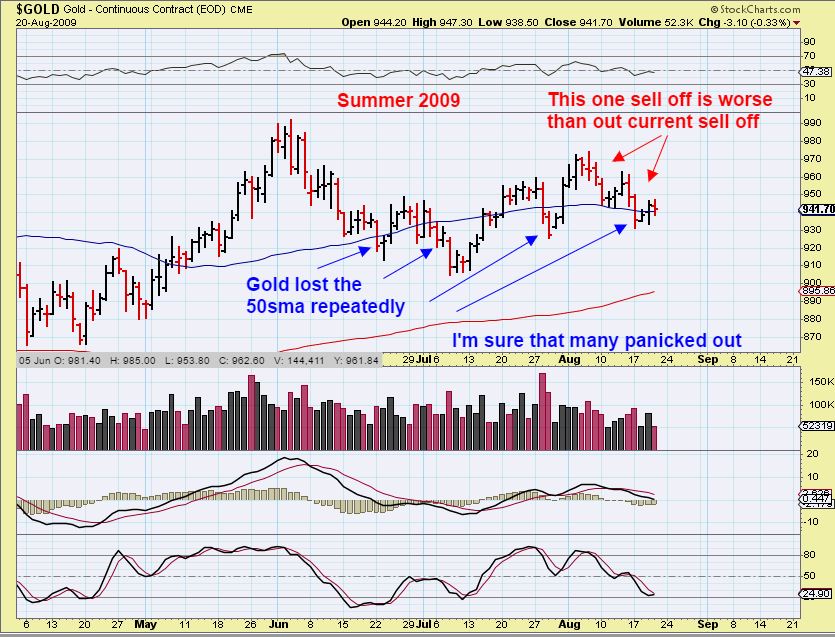
Again, that bumpy, choppy, flat sideways ride from April through September on this chart turned into a nice move higher. I think that 2017 is going to see a strong run higher in the Precious Metals sector, but it may be a bumpy ride of consolidation that leads us into the next ICL. I will obviously be discussing expectations in future reports.


Good stuff
Thx Thomas
Always great to be reminded to keep your ‘eye on the prize’ so that when the opportunity arises we’re not frozen with fear and doubt.
When we first got our ICL in December, the normal ( and exciting ) part s that you usually get 3 strong daily cycles and the PEAK is in the 3rd one. We saw that strong rally in Miners in 2016s run from January and peaked in about April before dipping back to another ICL.
This time Gold looks fine and may peak in the 3rd daily cycle, but Miners gassed out early and may have peaked aftera 2 month rally. So disappointing at this point, because if they cannot come back to life in the 3rd daily cycle of Gold, then next great long trade for miners becomes the next ICL. ( maybe in May)
The good thing is that Miners do run very strongly when they run, and it will be another opportunity to ride a strong rally in Miners, but again, it may not bottom until May again. So right now I am interested in seeing how they bounce out of the next dcl.
The next DCL should be very close.
Side-point wow – look at a 2 year weekly chart of nimble storage ( NMBL) and that is just a huge flat base . These long flat bases build energy to make the next run. It is up almost $4 pre-market and looks like it will run right back up to former price in th $20’s and $30’s over time. Problem is with a $3-$4 gap, I cant just jump in .
u could always jump …………………. off a bridge 😉
hmmm, cynical Maria is starting awfully early this morning.
I like vacation maria better, pops in at 10 a.m. and talks about what a beautiful day it is 🙂
;-D https://uploads.disquscdn.com/images/98cc27d8bfc8915dde5f12323f0139cf5f39136b08e737d72ac0383e82b09713.gif
ps. ME TOO!! I’m having a serious reentry problem….
poor me .. i know ;o)
Well, I can see why – let’s do a comparison
Maria vacation trader – pool side under palm trees while Miners act correctly, run higher and higher out of an ICL, and need minimal attention or babysitting.
vs
Maria at work and Miners selling off and low risk trading set ups are rather minimal. At work time is limited and you are unable to monitor trades as easily.
hmmmm … ahhh yessss… soooo what your’re saying is ….. GO BACK!!! !!!!!
Gotcha!
Thanks!
https://uploads.disquscdn.com/images/70ef30743868a2a42f0aa813b6ecafce0435f9831f9cde746e8a63a8645939b7.png
I think NMBL actually got bought out. That is why it jumped $4 or 48%
Good writeup, definitely helps to keep one in perspective. Thanks
Thx CS
Alex- if we don’t clear 25.91 than the miner IC will have failed and a failed IC would not be good for the long term health.. i know gold will not have failed but it’s a huge warning shot to me in the miners.
hi RM, Not really sure what you mean by ‘failed’, and what are you talking about when you say 25.91.
Also I have actually been putting charts in the reports lately showing MIners dropping to double bottom lows and even breaking to a lower low while Gold held up, and it remained bullish. I’m not saying that that will repeat, but I wanted to show that it has happened in the past.
I know what you have shown but I think relying on that at least for me is a stretch because I try and look at each chart on its own and this IC will have failed if we don’t take out the cycle 1 high of 25.61 sorry is the level I believe. If we go to an IC low now it will be a left translated IC no?
It doesnt ‘fail’ if it doesn’t make new highs.
Yes, it would be left translated
I didnt know what you are talking about because at first you said 25.91, and now you are saying 25.61.
I Assume you mean GDX and the number is 25.71
If you look at the chart of Gold, it can drop all the way to the $1200 area to tag that 50sma and be normal. That is about a $20 drop.
Dropping into a dcl is difficult if one is heavily invested. Leverage is a no-no
Assuming gold doesn’t enter the elevator to $1200 area, the share trading looks and feels different today. Must be support rearing its head? Or greed;)
Yes, for now I see it that way too. Gold keeps slowly dropping lower, and GDX GDXJ ( so far) Have put in a lower low and then tried to move higher, resisting Golds selling.
First one down, first one to bottom maybe?
Now I scroll through individual miners and look for some to turn green and stay there.
PPP, AAU, HMY, GORO, BTG, TKFF again, EGI and a few others seem to be green for now.
that was kinda fun, watching (on 5min chart) what i hope was the final shakeout in JNUG, below 5.28.
…volume was surging, but price went basically nowhere, then recovered
I watched that too. Vilume was surging as it broke the lows from yesterday, but then it reversed higher.
Could be a sign of … ” you sell your shares to me and I’ll buy them up. ” 🙂
it certainly seemed like lots of unloading and some otherwise unknown entity just gobbling them up
Gap fill? Or different. Very interesting morning here.
nice .. :o) im likn BTG…and STNG also CDE SBGL AQMS
what was that you say … WOOHOOOO .. ha ha
urre … tempting
UUUU Too….
Although DNN making a new low today….
hmm .. yea..uuuu is cleaner count… i will wait tho … until “ii” to finish………. been burned TOO many times by the extended monster “C”
uuuu looks to me to be still in an “a” corrective wave of 2…..are your eyes seeing something diffrerent ?
btw….I am waiting also…… 😉
i have it in C … (could be very wrong) ;o)
*I show u mine.. u show me urs ….
*snicker
https://www.tradingview.com/x/5iT3U3yy/
Just me but I do not like your B but……..either way it is close to a low.
interestly …. it’s right on count with “2” correction … hmmmm – could truncate …. ?
https://www.tradingview.com/x/cVkrnlId/
I am thinking URG might be the place to be ?
show me please … I’m a ‘visual’ hands on …learner ;o)
After looking at a few more charts like URA and URG I am liking your count better,….man your good !!! 🙂
Hi Alex. Haven’t commented for a very long time for all kinds of reasons but always here watching, reading and I hope learning! First and foremost I have IMMENSE respect for the quality and depth of your analysis and most definitely some of the most thorough and helpful I have ever come across. As you might recall I am very much in the ‘longer term’ investment camp and therefore tend to take much bigger and longer term views. I am also investing the TOTAL sum of my life’s worth and hence tend to be very conservative. Currently PM’s and not least bullion form a significant element of my invested capital hence I am watching this area like a hawk at the moment! One very important point (at least to me) that I have mentioned previously is that in the four MAJOR bull cycles in gold from the early 70’s, once the bull cycles began, gold NEVER lost it’s long term MA’s. I use EMA’s and typically 200,300 and 400 daily, (40, 60 and 80 week). What has me watching so closely is that in the first major correction into Dec ’16 of what we all believe (believed?) was a MAJOR new bull cycle, gold not only lost those LTMA’s, which we just about regained in February ’17 but we are now losing them again as I write! Based on the data I have this has NEVER happened in any prior MAJOR bull cycle. Finally I would just also mention that from what I can see, all of those excellent examples of tricky but ultimately bullish consolidations in your gold charts above took place ABOVE the 200 sma. The current action is taking place BELOW it. In my book this may be a VERY IMPORTANT difference. Time will tell and who knows maybe this time will be different as quite honestly few normal rules seem to apply now in some many investment areas, so why not gold as well? I am certainly NOT panicking here…quite the opposite and just trying to watch in a calm and collected way but I will be monitoring the action VERY, VERY closely in the weeks ahead and believe gold/silver really have to prove themselves at this point as to whether we really are in a MAJOR new bull cycle or not. But this is simply my personal opinion but one which I have a rather significant financial interest in!!!
Nice analysis, Chris. Thanks. On the bearish side, take a look at the monthly metals.
Hey Chris….. 🙂
Great question…….
Hi Ken. Not so much a question as just what I am seeing and which Alex has potentially already noted for himself. But ultimately we are all responsible for our own investment decisions and this is simply what I am personally monitoring to ultimately form and make my own with rather significant amounts of investment capital.
Under the 200 ema “action” is important imo.
Kinda glad I do not need to answer it…… 😉
I feel the same way Ken. So not giving up yet but hence why I feel the onus of proof is now on the metals. One bit of comfort right now (or confusion) is that silver is actually still above its LTMA’s (currently around $17.25) so in that sense looks to be behaving stronger than gold right now. Tending to think that’s better than the other way around!?
Maybe silver has it’s commercial uses, but I cant remember Silver ever being in a bull market Gold while Gold is in a bear market- so I would say 1 is going to play catch up in the future, be it up or down.
I’m personally rather hoping ‘up’!! 🙂
I dont think it was a question. It was a valid observation.
Certainly a historical question.
History repeats itself.
https://uploads.disquscdn.com/images/de579da675123e48339b81a72688e52ee664c604a5ba9c188976d6db1e5ea2d7.jpg
Agree…..
oh, sorry….There was a chart with that, I forgot to say refresh
Yes I saw….
Correct! 🙂 And only mine…for what that’s worth!! Lol
Some traders I know use strictly the 200 ma, if the “sector” is above Stay long if the 200 ma breaks go to cash……
Thanks Chris. Great point.
HI 🙂
M’Lady. 🙂
Hey Chris – Thanks for writing. Yes, losing those major moving averages was concerning, and on longer term charts I would want them to recover. On the weekly charts I noticed it too, but I cant say that I noticed that they have never ever , in the past major bull markets , lost them.
I have a whole host of charts that I have been gathering, and some are bullish, some are rather neutral at this time, and some are bearish- indicating that we just had a bear market rally.
I cannot put them all in 1 weekend report 🙂
I take the ones that are prudent right now and this week, this month. If I go all out bearish and everyone panic sells, and then we get our DCL and things run higher in the 3rd daily cycle – people may wish that they held on and sold higher. SO I am watching this step by step, I see Bearish overall implications, and also a possible recovery to Bull over time is possible. It all takes time to see how it plays out and also takes a lot of time to just report it.
I have actually spent 6-8 hours minimum on each weekend report alone, gathering charts and putting thoughts together, and writing things down, so it is best for me to analyze and lay it out there as we move forward. We have time, but recent activity MIGHT indicate a bear market rally occurred from Dec to now.
Thanks for your input, I agree.
Truly appreciate those points Alex not least the limit of what you can post being only a FRACTION of all that you will look at. MOST DEFINITELY NOT suggesting hitting any panic buttons and very much the opposite. Stay cool and calm and see how the price action unfolds in the weeks ahead. Maybe I should have privately emailed you instead and I did hesitate about posting but only highlighting what I am currently watching and hoped it might prove helpful to others. IMO this has got incredibly tricky shorter term but as you so rightly say and I fully agree with and am doing…watch this step by step for now and one way or another the bigger picture will become clear once again. But definitely gone a bit misty right now…at least for me it has!! 🙂 And just for the record I also think we may be very close to some kind of low and if so then we’ll assess the price action from there and hopefully get a clearer picture. And like everyone else here I truly do appreciate the herculean effort you put into your analysis and the mind boggling amount of work you will be doing behind the scenes to produce even just one report! I promise yo it is appreciated. 🙂
Thanks for sharing Chris
*Herculean Effort
Nice
:o)
No problem, the comments section helps others, and your comments was kindly written, not in a bad way at all.
Thats fine, I already did some research and posted charts. I think that breaking down now into an ICL below those moving averages could be acceptable, as long as we recover them after the next ICL.
100% agree. It’s the recovering them’ part that I really want to see to feel totally happy once more. But IF…IF…we don’t recover then and properly then I will have some personal and rather important investment decisions to make for my long term strategy. But for now simply patiently watching and waiting to see how things unfold and if truth be told REALY, REALY hoping we do not only regain but start climbing nicely above those LTMA’s once more. 🙂
The bottom is near perhaps even today. When you start feeling uncomfortable it is near.
What I hold onto is that metal and mining shares will be the last standing. If you are wealthy enough
to diversify into some shares then do so. If not, just hold phyzz. Currencies have fallen through the ages and real money continues to appreciate. Imagine how much a numismatic from early days would fetch today . . . I am probably older than most here and I am still in for the long run . . . .
I value “peace” and loving friends and family – keep life in balance. Don’t dwell on what is
wrong or what should be some other way. It is what it is for now and things will return to true
free markets one day . . . .
CHRIS??
So you were thinking that since the 1970s, in 4 major bull cycles in Gold, a Gold bull run NEVER lost the moving averages ( Wkly ema 40, 60, 80).
https://uploads.disquscdn.com/images/6d25e04b26b0bcf62f22f74d2652ff26d2857a8188da540257a43b99c7345bc3.jpg
Hi Alex. This is obviously to some extent interpretation but I see that as two of the four cycles i.e. 2001-08 a MAJOR bull cycle, 08-09 intervening bear (gold dropped 33%!) then 09-11 Major bull cycle. Likewise, 1971 -75 Major bull cycle, ’75-’76 intervening bear (gold dropped 48%) then ’77’- 80 next MAJOR bull cycle. But that is just the way I see it. My personal investment strategy here is to try and play those multi-year cycles and for me and my investment capital, which I take full responsibility for I perceive heightened risk to my long term bull view with the gold price below those LTMA’s which it currently is once more. For the record I still hold ALL my bullion exposure BUT if we DO not regain and stay above those LTMA’s I will have to seriously question that stance. But I fully accept that is MY decision for My capital and I will stand or fall by those decisions. But those LTMA’s are my personal arbiters between bull and bear and right now they simply have me on ‘high alert’ as opposed to flat out bullish which I was until last November. Now I’m watching very carefully to see which way it finally breaks. Personally I think gold should be SIGNIFICANTLY higher for all kinds of reasons but what I think and what markets do can be two VERY different things, which I have frequently learnt the hard way. So this is me simply trying to apply decent money management rules that work for me and my investment horizons but I appreciate wouldn’t suit everyone. But I never intended to create any controversy with my comments and apologies if I have. That was not my intention at all.
All good Chris.
I appreciate your thoughts…..
My big picture view is ( I hate to say ‘hoping’) hoping to see an eventual drop into an ICL in May sometime after another daily cycle or two and then I also would need to see that next rally far out perform what this one did. We would have to recover those moving averages like we did in 2008 and continue higher though 2017, or I’d be questioning everything all over again too.
Of course, I feel that inflation and other factors would feed that Bull for the run through 2017 onward, , but we’ll have to wait and see as usual. 🙂
Rather intriguingly another cycle analyst who I have huge respect for has also highlighted early May for a potentially ‘critical’ intermediate cycle low!! So definitely looks like a bit more waiting and watching to do yet with one or two minor daily cycles in between just to try and ‘toy’ with our emotions until then!! 🙂
Yes, if you look at one of my GDX charts in this report, it was a bigger picture view possibility with a GDX low in May.
Cant tell for sure, but I just drew a 4 daily cycle Cycle in that one.
That one did especially ‘catch my eye’ and for me personally was one I especially appreciated seeing. I know we can only speculate on how the price action might unfold but that was a VERY useful view of how things MIGHT unfold and serves a very useful purpose in honing near term expectations i.e. boring and frustrating shorter term doesn’t mean the bull is broken….maybe just taking a well earned rest before another good run…I hope…which I know is no kind of investment strategy at all!! Hence why I’m trying to develop decent money management rules!! Lol
just FYI, ran across this: http://www.schaeffersresearch.com/content/analysis/2017/03/06/gdx-options-volume-could-sound-alarm-bells
anyone watching NatGas here? (UGAZ)- it has closed yesterday’s gap up. Now bouncing wildly- at least UGAZ is-
Yesterday I moved my stop up from the 14s to 16.10 and was stopped out this morning. In retrospect, I wish I had used the 10sma for the stop zone to let the gap close, but I’m out of the trade now and not sure I’ll reenter here. Maybe if I was watching closely and tried to buy the gap close price.
Actually, the gap close price may be 5 to 10 cents lower than today’s low of 16.05- my current chart won’t tell me simply. Maybe that lower price actually needs to be hit?
Looking at stockcharts, I see the high from two days ago was 16.18 and the low today was 15.85, so I would say the gap closed today. Might re-enter at the close of the “sell” volume stays low. Gap close + not too many sellers + momentum indicators still rising. Would use a stop below the 10sma if I entered again.
Stopped out of UGAZ for a gain, stopped out of JNUG for a loss. Net proceeds: $49. Not as I had envisioned it, but better than riding it down and selling at the bottom like I used to. Plus, $49 is kobe beef territory. I’ll take it! *bort!*
WRN & TGB giving up the 50 sma……
HBM and CLF are too. Maybe the Metals are not quite ready yet. I already own TGB : (
Decision time
I left the copper smelter….. 🙂
I just looked at TGB with FIBS and the 50% area has support. I may need to stop out here.
Kind of bummed…at $1.00
Me too…..
NAK heading for the 200sma 🙂 That may be a nice entry
1.25 was your target.
I may have used fib #’s, but the 200sma is around $1.15 so I may be off if it goes there.
I like the really light volume in this NAK sell off to the 200sma, but I just cant tell what it is going to do when it gets there ( or this may be close enough). Is it going to bounce strongly for a good short term trade? Or will it base out for a while just jumping up & down?
Wither way, I still want a smallish position and just ride it from here with a stop under that 200sma by maybe as much as 10%
Agree…..
I was thinking 1.37 would hold, it did not so I left but I STILL want a piece of that Ground, just not sure how much to pay for it….. 😉
Thats probably what NEM and GG are thinking – lol
lol lol lol
Your right !!
NWGFF Canadian MJ stock……Cf any opinion ?
I own it – my research showed that they had property and development, etc.
Cool….thanks.
Hey – it is breaking below the 50sma. Might want to wait??
Have you found that the MA”s still work well with penny stocks with lower volume ?
At times. CNAB was climbing that 20sma day after day, but at other times I feel price just tries to justify itself by demand and lack of demand. huge moves in some of these CNBX, CNAB, OWCP, NDEV , MNTR, etc
Makes it somewhat tougher technically…..
To the point that I was using ‘spare change’ when I entered EDXC and was just going to buy & hold , boom or bust, and see what happens. Could be a write off loss if things go south, but I almost dont look at those ones.
I watch CNAB a bit more because of the price and swings that it makes, ut I’d really like to see where these end up a year or so from now
Yes me too…. boom or bust on around 9…..very small investment for me I just want to be in the game.
Some green starting to show on my screen!
yay! for JNUG.. its popping back now
Double yay!
Isnt it AMAZING what one green day can do? : )
I think its beautiful, like a stock junkie or something
#addiction ;o)
Alex- any thoughts on the NatGas price action here?- It has basically closed the gap from yesterday’s jump up. Thanx-
It remains the same set up at this point, if it is above the 10sma.
It dropped, filled the gap, above the 10sma is still a low risk entry. You just stop out if it goes against you
just bought 200 shares UGAZ at 16.25.. Nibbling here to see what’s next. Thanks all for ideas and input!
Very light volume selling in UGAZ compared to yesterdays buying – hopefully sellers dry up
Alex, Any thoughts on PLG?
Probably dropping to $1.40 again. Acting like the rest of the Mines, selling off in an overly aggressive manner
I liked this one but has disappointed along with all the rest
NIce report, Alex. Appreciate your latest views on the possibility of GDX’s movement for the rest of this IC. Fingers crossed that the next IC gives us a monster rally.
Hey Rob
yeah, I mean this one was excellent out of the gate Dec into Feb, but when it didn’t re-peak later in the daily cycle, the gains started to evaporate.
I do think that the next one could be a much bigger and longer duration, but we;ll see.
Agree. So much going to hit the news re voting exits in Europe and WH draining swamp.
There has to be more news about the huge global debt and fake Tbills and derivatives . . . . .
More Wikileaks on pedo . . . . scandals . . . real money has to get going!
I sure hope so. Gave back WAY more than I was planning too!
I think back when I wasn’t even looking and not holding stocks, just had my phyzz stored away.
It’s torture watching this daily. Sure helps to have this club for mental support.
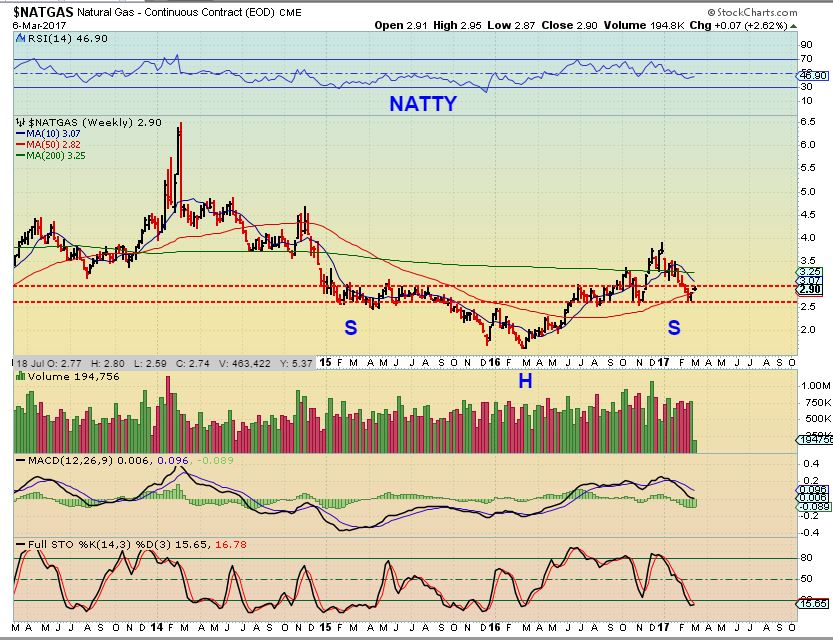
I would like to see a long term chart to today on the weekend report to see the S H S formation better.
Thanks Alex. Can see your intelligence and good memory in your reports!!!
Uraniums getting a lift
Agree Ann….entered UUUU this morning.
URG lagging so ……
Alex, the Atlanta fed today reduced 1st quarter gdp est to 1.3%. That won’t help the inflationary case for gold.
I wonder if that will put any weight on the Fed raising or not raising rates….?
It sounds like they are pretty committed, but raising rates might make it even worse.
or flight to safety into gold . . . . economy bad to worse to crash further . . .
“Yearly” charts very informative . . . all good.
Stewart has good report today
http://www.321gold.com/editorials/thomson_s/thomson_s_030717.html
great stuff. Thanks for sharing
in the previous report at 123 on 2/28 he was buying
good buying range
JDST creeping up the SOS. GDXJ doing similar on the BOW list
Very few MJ’s are green in my watch list….need a tweet from the President saying he will honor states rights….:) Things just seem to be on hold until something happens one way or another….maybe the dam will break all at once and everything will fly….I can dream…:)
MNTR the only one working for me right now….
XRA
beware XRA!111!!11!
might get belated downwards reaction when the indi downtrend line is hit.
obviously a breakout would be good.. but may also be a fake move.. esp. as all other PMs getting whacked of late.
https://uploads.disquscdn.com/images/b3e9a2043b28e315ad4d245e7ce47d30f69444b684149aa62a3cc3d09b9b88a8.jpg
lol… thanks Dadddy#2
im watching this… couldnt tell if that was a 4 or a 1… ;o)
https://www.tradingview.com/x/C3pmeY4w/
could currently be the expanded b-wave of a flat 2.. with a big c-wave down yet to come.
that would bring it back in line with all the other PMs.
at the moment its something of an anomaly.
Too late imo (too many miners oversold now) SOG I see it as a flat 2 beginning a wave 3 possible …. broke out of that flat today….buy ya never know. 🙂
expanded b-waves do breakout of the ‘flat’ and then quickly reverse.
anyhoo.. tomorrow may decide.
since you have it.. i hope it breaks out for ya 🙂
Could get interesting…. 😉
Too many roads…I got lost…….. 😉
I own it….. 🙂
One of the strongest Miners imo
ditto
Did ya pick up some Uranium today ?
no….. still prowling ….. ;o)
meow
ready to pounce !!
I’m diggin my XRA position still.. added heavily a few days back and took some off today. riding house money now
nice… been a steady little green flicker in my acct as well… tightening up stop… dont wanna stick around for 5 … will reenter if i get hit
Gold and Silver finally getting oversold….
NAK sitting just above the 200 DMA, first time since last july. do we bounce here after 4 straight down days?
CDE keeps getting pounded……
i would never have thought when it got pounded to -18% on that first drop day, that it would go on to double the loss to -36%
me either !
yeah, a whole bunch of holy crap! And now EXK can’t get traction. MUX hasn’t gotten pounded but really can’t catch a break either. WTF!
i’m clean out of WTF.. cash only now 🙂
I buy 1,000 share each and every morning last two weeks! I’m sure tomorrow will be another great day for WTF!!
CLF getting close……
I believe we’re at a point now where there is literally ZERO downside here on miners if the BULLISH outlook prevails. The good thing about this expectation is that one will know very quickly if he/she (I am) is wrong. Many individual issues are sitting right at support so stops shouldn’t be far away. This is actually not a bad time to begin following Steve’s work for 15 minute buy signals for those looking for price confirmation.
Zero Risk IF the Bulls Prevail…..Agree !! lol
There is literally 0 to like about the mining charts at this point. They all look putrid to these eyes with gold looking like wants to catch up. Maybe it reverses but until it does I see downside ahead. Hope to be wrong.
there is always downside and upside risk to any position 🙂 As Alex pointed out these can go lower and still be bullish if you review the last couple days report. The weekend report would be good for you to study again.
You are a wise man RG 😉 ( I am biased – lol )
March 15 big day for big correction in general markets and for Nikkei
you really are The Seer