
Feb 18 Weekend Report – Another Big Picture Review
For the weekend report, I often feel the need to review the Bigger Picture to gain perspective. I am going to do that this weekend too. To open this report, I’m going to start with a scare tactic. Yes, that’s odd, but I see it all the time in the markets, and I believe that there is no better way to face your fears than to, well… Face Your Fears.
.
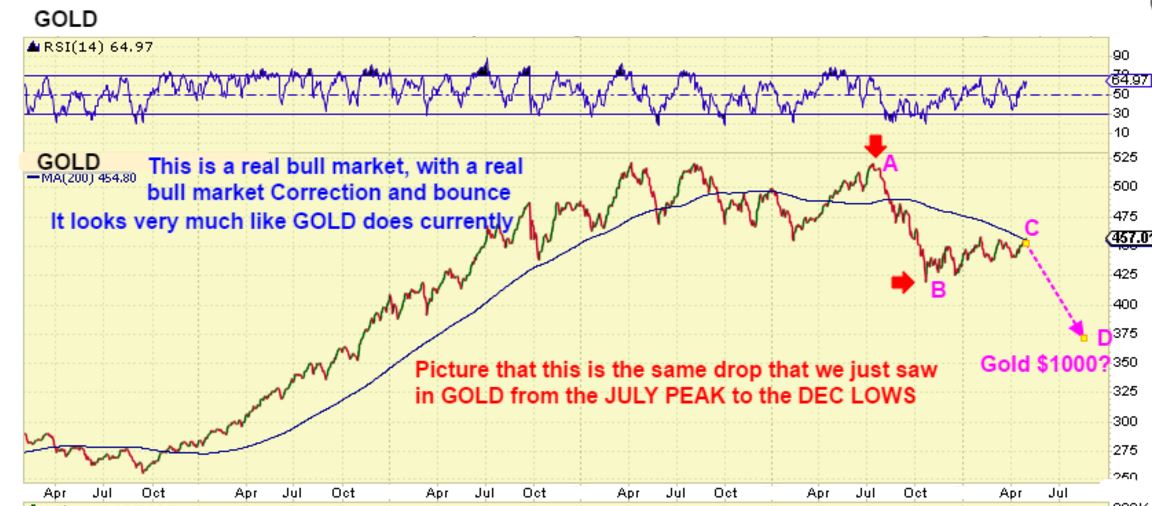
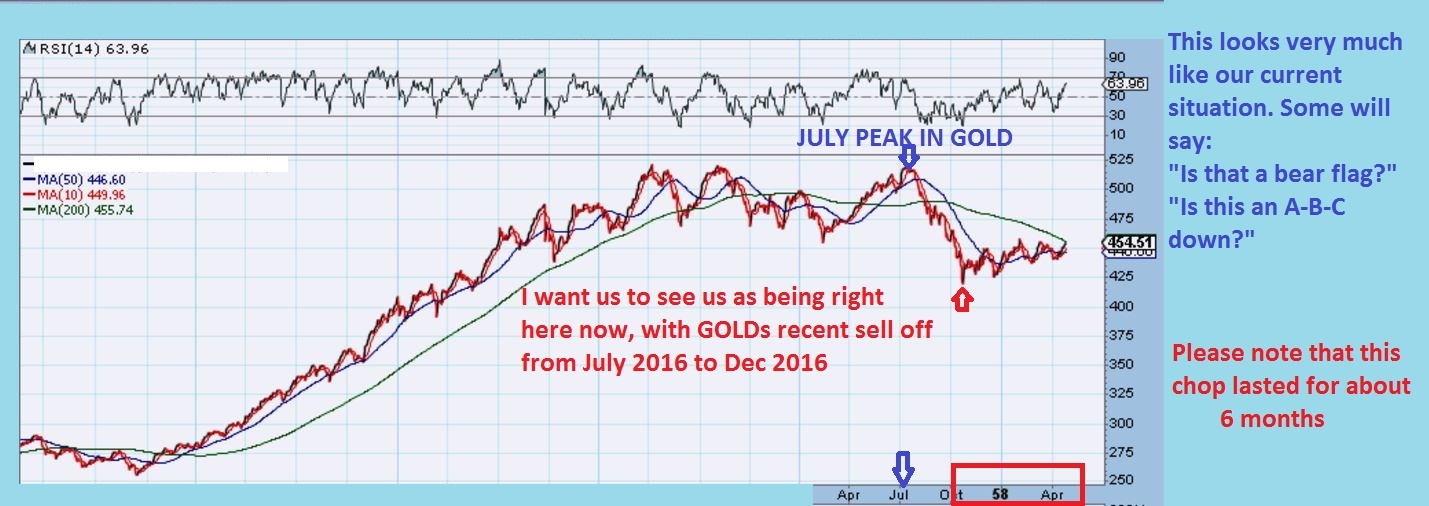
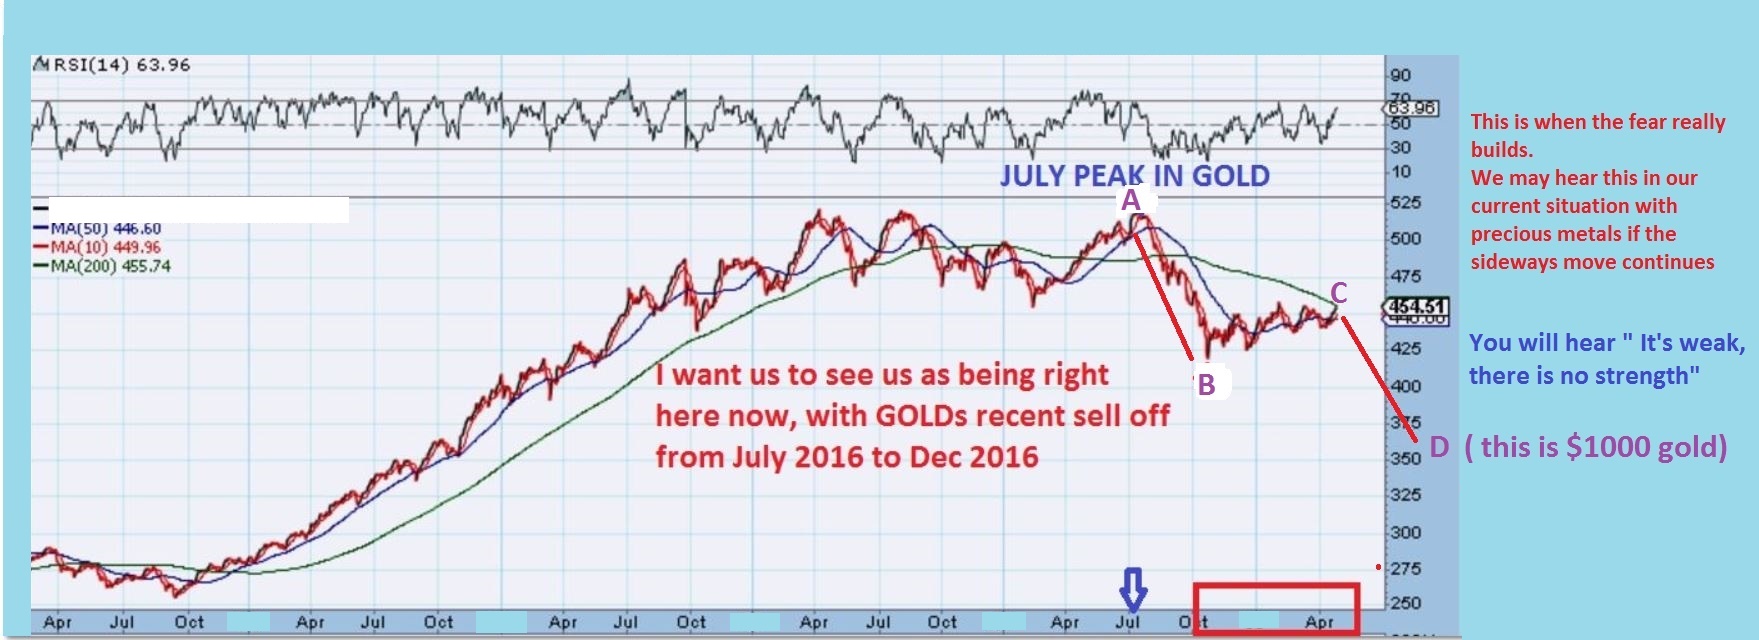
This Chart is an actual Real Bull Market that I have clipped for us to look at. I am calling it Gold ( though it wasn’t) and it has a similar movement to what we just saw when the Miners ran higher in 2016 and peaked in July/ August, and then sold off. The Fear tactic is that we always hear “Gold is in a bear market and must drop below $1000 to re-set.” Well, now I have heard that this was just a bounce and is an A-B-C-D down to $1000 in Gold & will put the Miners into single digits. Please read the chart.
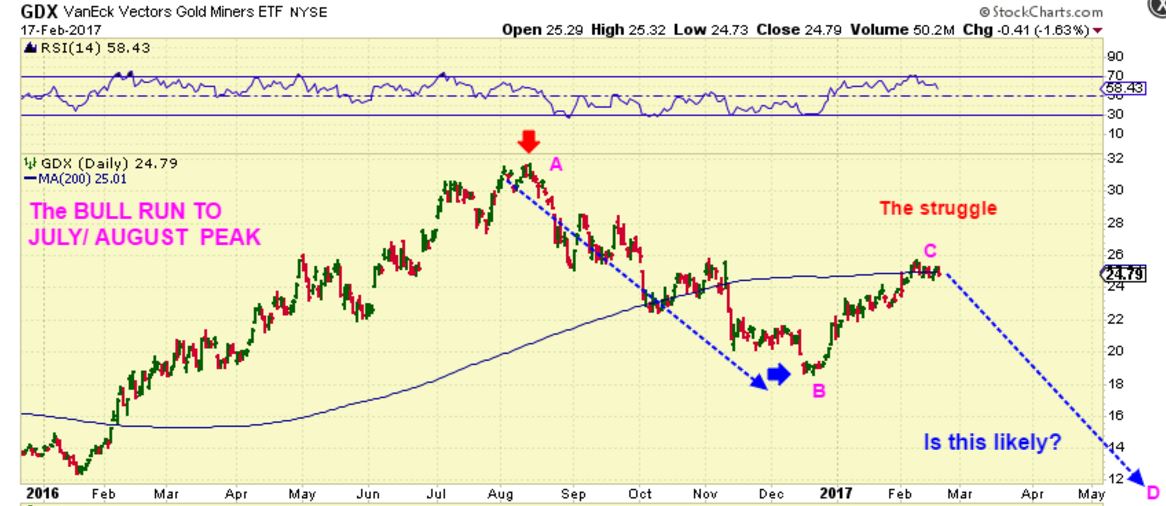
Compare it to GDX currently – We see the big run up in 2016, The peak in July/ August, followed by a strong sell off. All very similar to the above chart. Are we in for a massive sell off? That is what I’m starting to hear again. “GDX has hit resistance and is just too weak to push through.”
Now that I’ve got your attention – lets look at the bigger picture in all sectors of the market, and answer that nagging question that is being raised above.
NOTE: For newer readers – I want to start by saying that this is mainly a review, and much of what we have been anticipating is playing out as expected. That said, please review some of last weeks reports or even last weekends report to get caught up with what my expectations have been in each sector.
.
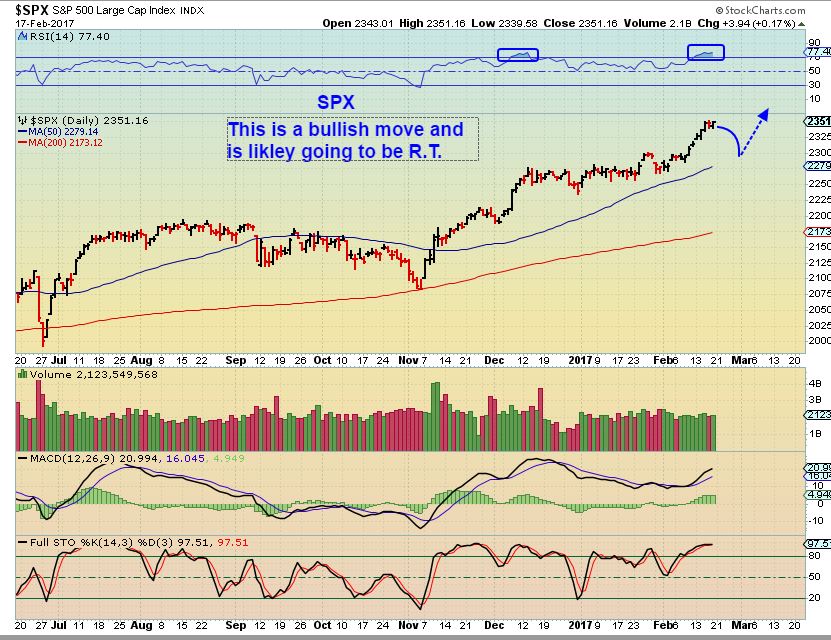
SPX – I have simply mentioned after the recent break out that these types of consolidations can push a market higher as shorts cover and buyers join in. I had a possible 2400ish target and a possible VIX spike coming in the March April area. USE LOOSE TRAILING STOPS in case it suddenly has a crash day, but ride it if you are long. We are near due for a daily cycle low, so I have drawn a possible dip in there.
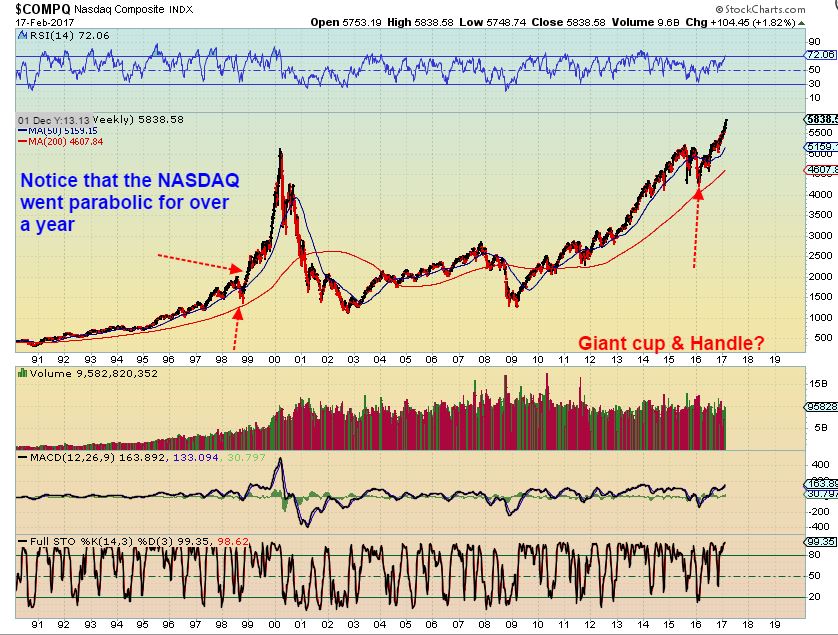
Do you remember that Parabolic NASDAQ blow off run in 1999? I wouldn’t even think of shorting this Bullish behavior.
By the way – Here is an answer to an email question that I thought everyone should understand. This may surprise you . Yes, The general markets have been straight up since Feb 1, with only 1 or 2 down days. Our miners have consolidated some very nice gains from the Dec lows with a bit of sideways action in February, but “Are we wasting time with Miners as the Markets climb higher daily?”, that is the question.
FACT: The perception is that leveraged TQQQ has gone straight up & is beating leveraged Miners like crazy with the February sideways drift. The Reality is that that is not true at all.
Since FEB 1 –
JNUG was up over 50% in Feb alone, and IS STILL UP 30% in Feb alone with consolidation.
TQQQ has gone up almost everyday in Feb, but is only up 12.5%.
.
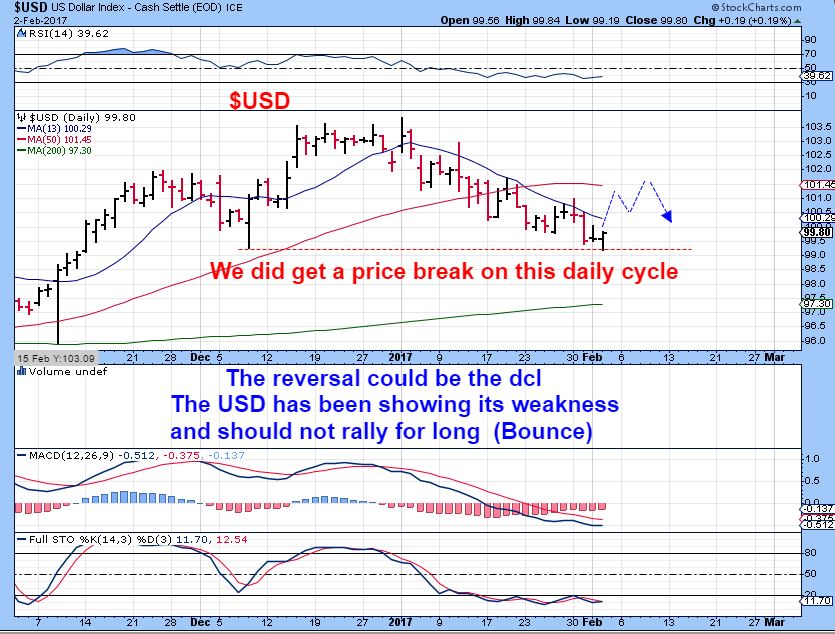
USD – This was my Feb 2nd chart. I expected the USD to be rejected and sell off into a DCL and an ICL. This has been my call for weeks.
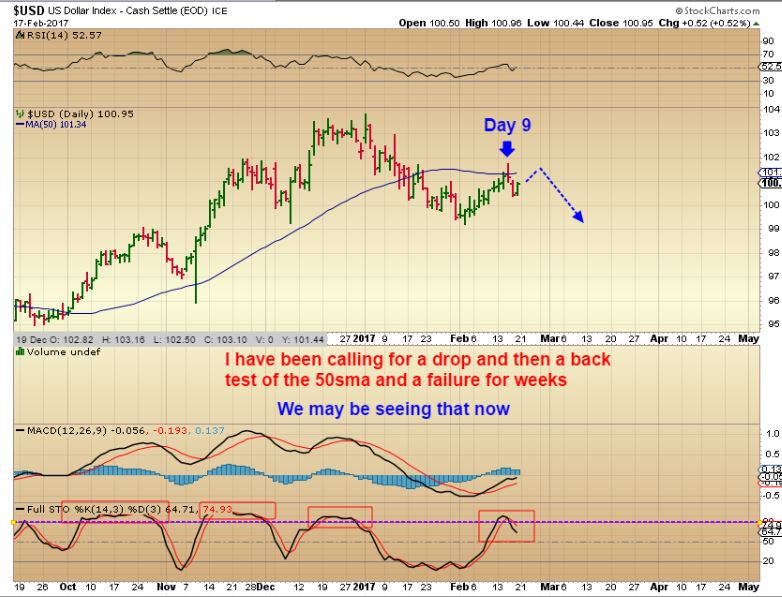
The USD Currently
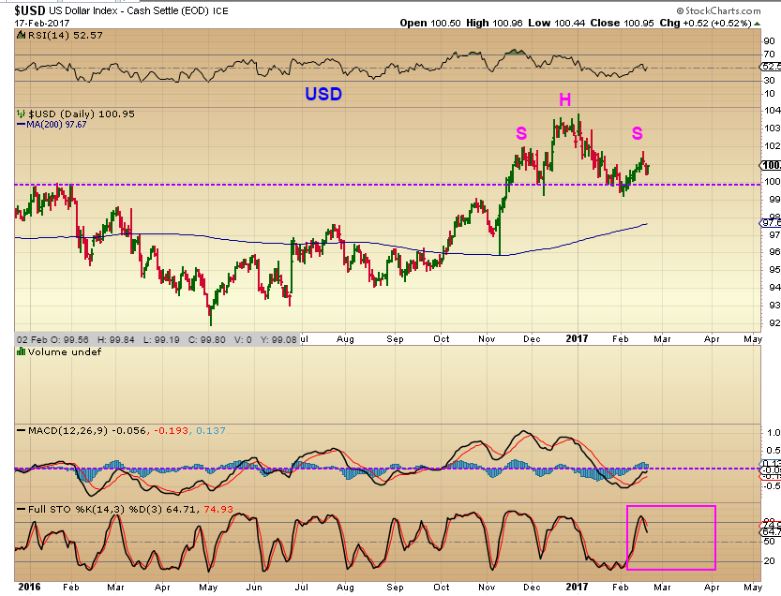
The Bigger picture if it plays out
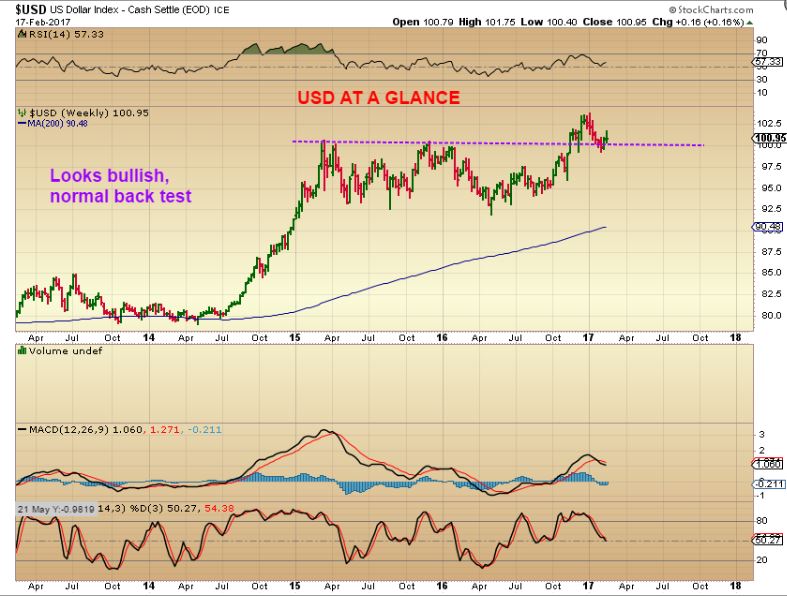
USD WEEKLY – This looks really bullish, so we need to see that break down soon.
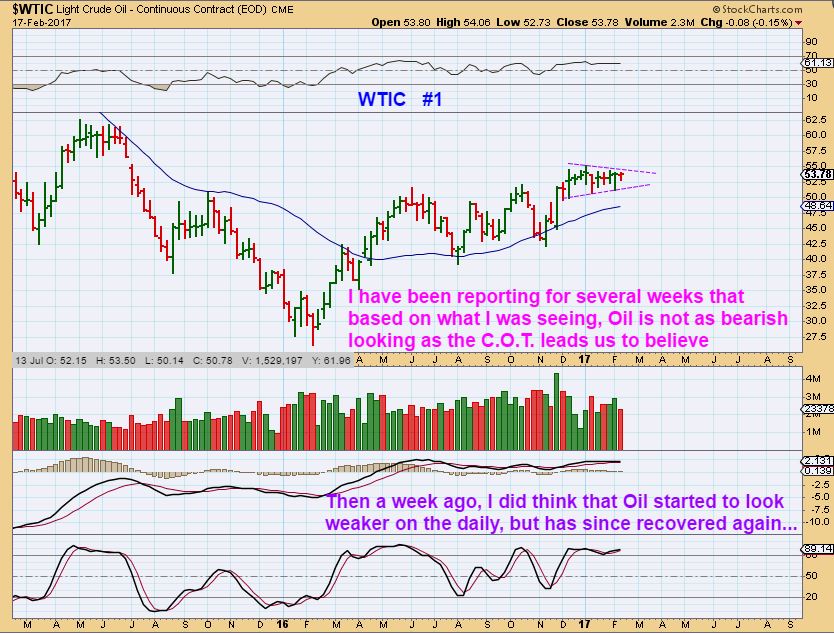
WTIC #1 – The C.O.T.s have been short for weeks, but I mentioned several times that the charts were strong, and COTs are not timing tools. Finally last week I thought we were seeing weakness on the daily charts…
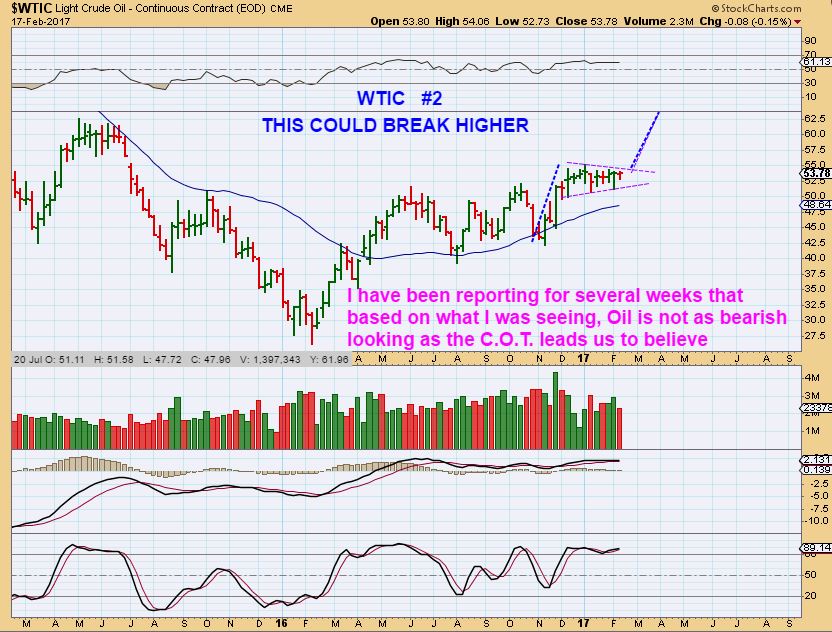
WTIC #2 _ Still at the highs, this actually looks like it wants to move higher. BASICALLY, it is a 50/50 call right now , but it looks bullish.
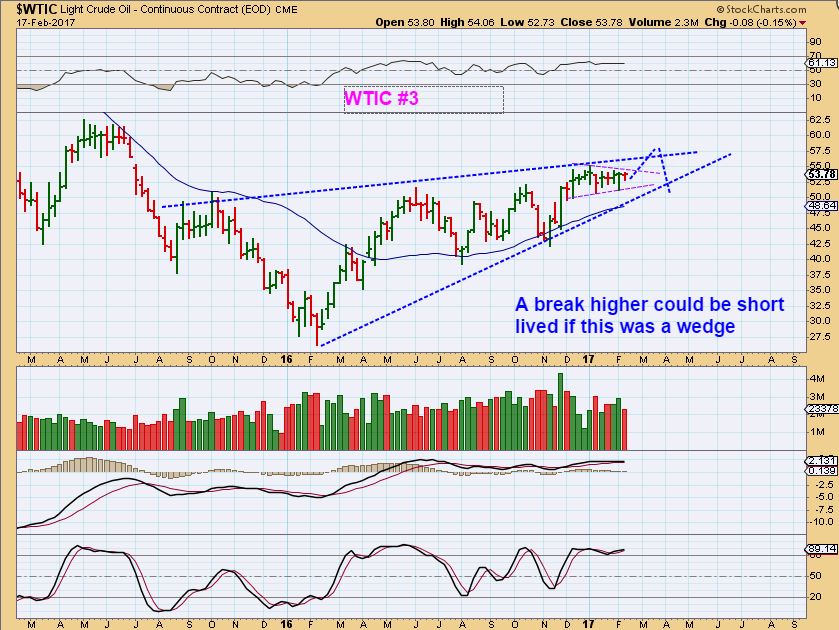
WTIC #3 – A quick break and a drop is what this wedge may be indicating, since Oil could be getting close to a drop into the next ICL.
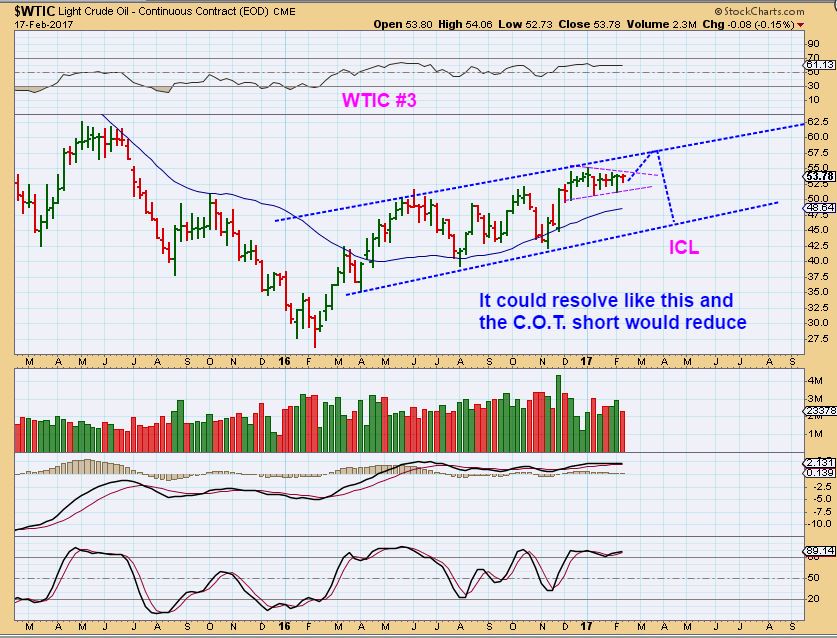
WTIC #4 – And this could straighten out the wedge into a channel. THIS IS NOT ETCHED IN STONE, I AM BASING THIS ON THE LONG SIDEWAYS MOVE, COT, AND PATTERNS ALONG WITH THE TIMING FOR A LOW. This is basically an idea of how things could play out in the big picture, but it is a very tricky read at this point. Oil looks like it wants to break out higher. This could just as easily break out & run like the SPX did, and the COT report would continue to be mocked.
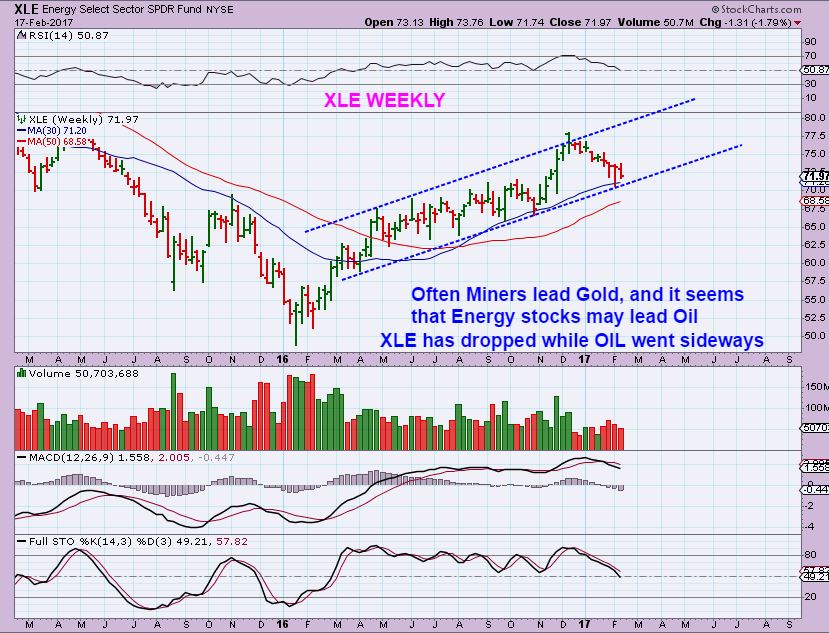
XLE – This also makes OIL look like it could break out higher. Energy stocks seemed to have corrected at this point. No doubt a break out higher in OIL would quickly cause buy set ups to form in this sector, and the XLE is at the lower channel line. A little more time should help us out here.
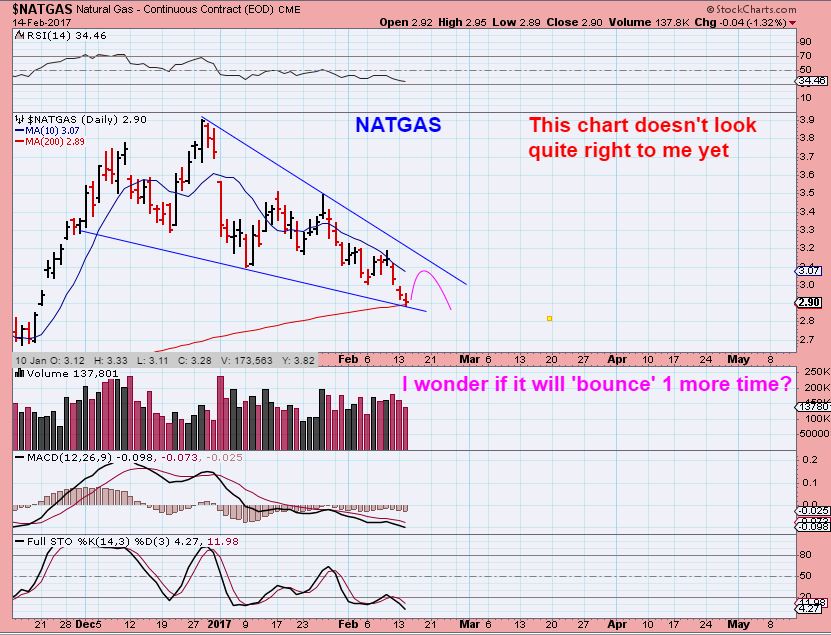
NATGAS – I saw a H&S and wanted to wait for NATGAS to tag the 200sma. I saw no sign of strength worth changing that.
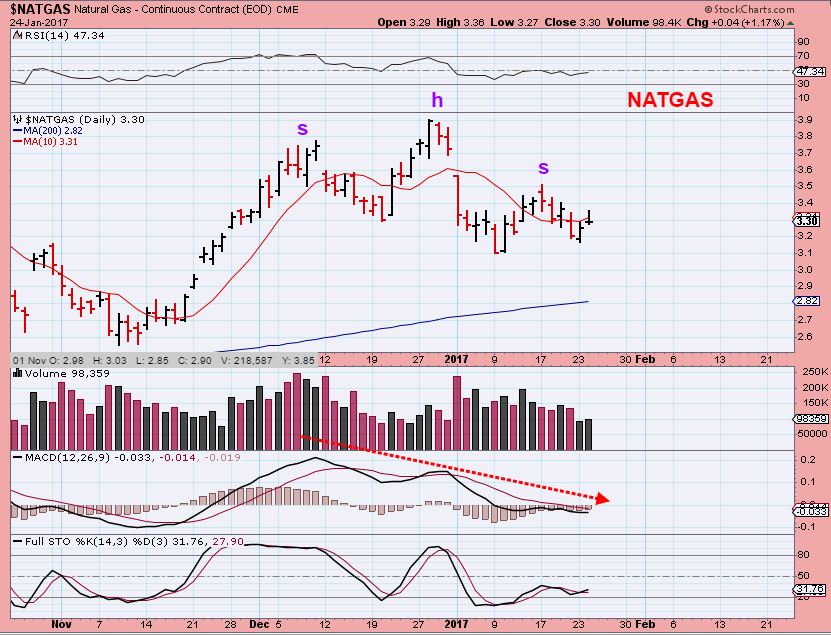
Even when NATGAS hot the 200sma ( my first target), I didn’t like what I was seeing.
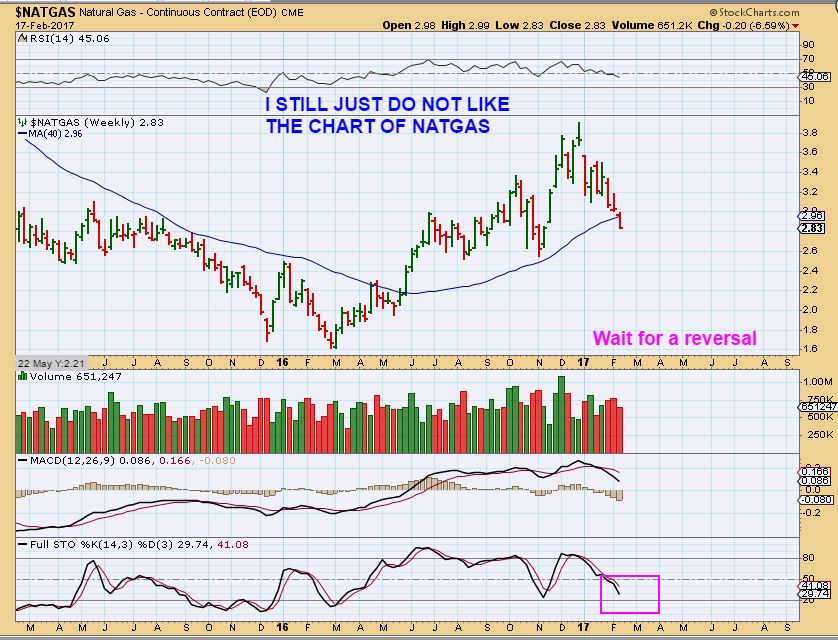
NATGAS WEEKLY – And it bounced and dropped even further, closing at the weekly lows. NATGAS is not lining up bullishly yet.
.
GOLD , SILVER, MINERS
.
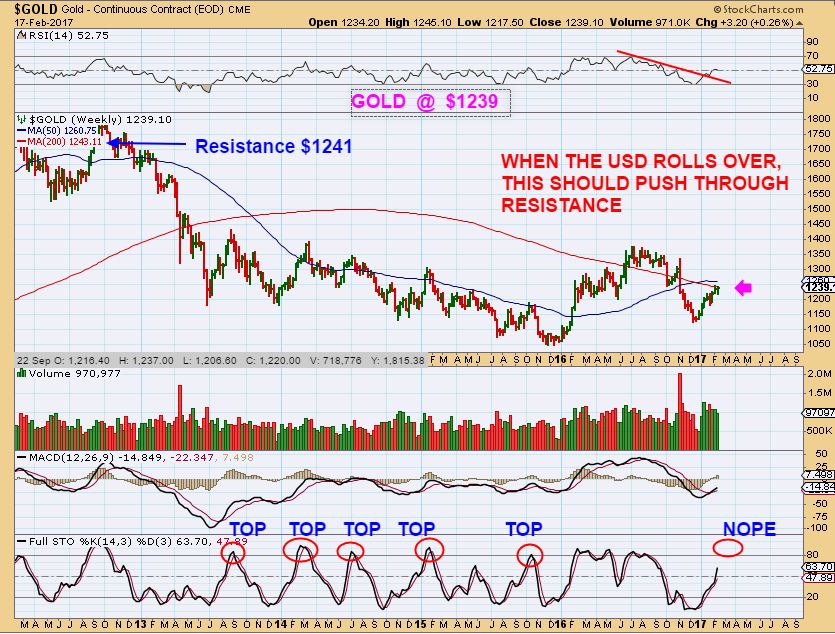
GOLD WEEKLY – A WEEKLY BIG PICTURE shot shows us that GOLD is pushing against resistance of the 10 & 30MA.
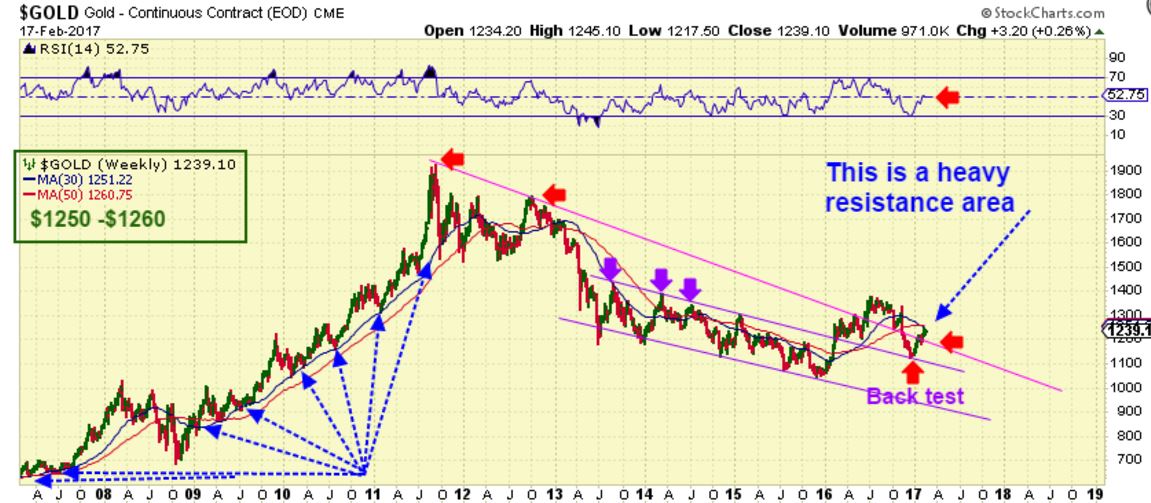
GOLD WEEKLY- Pushing resistance and paused.
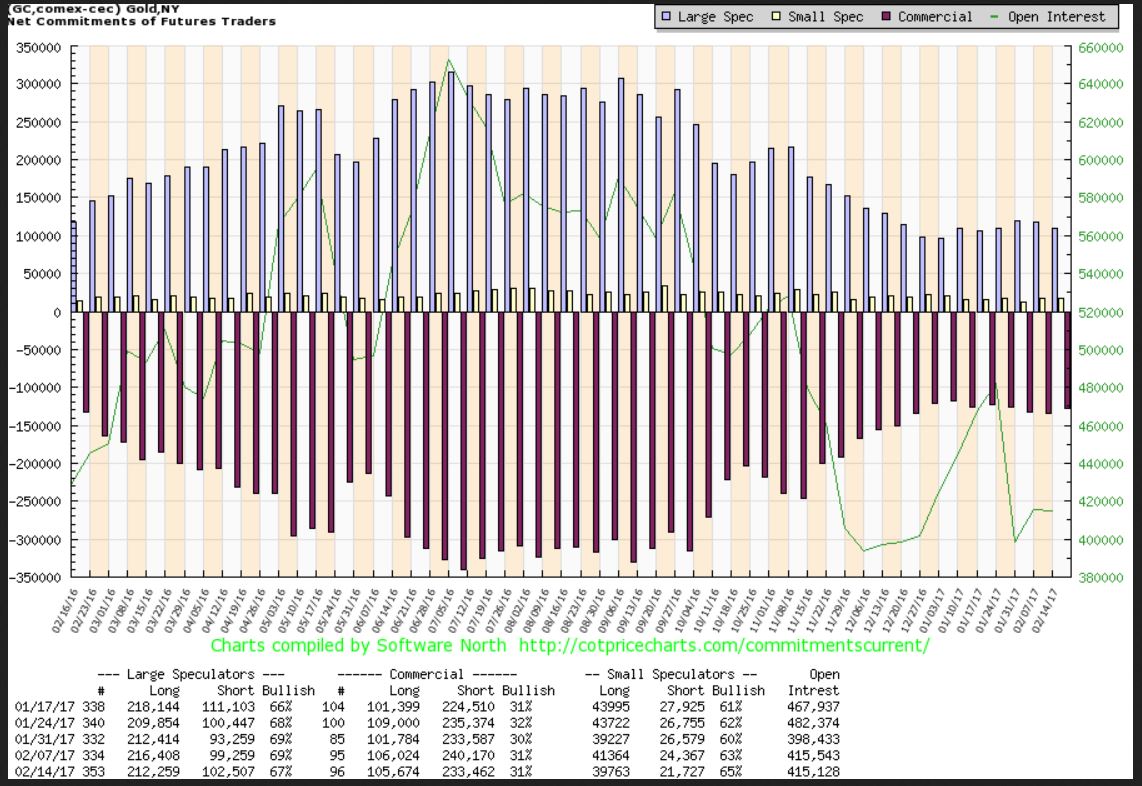
The C.O.T. Is not bearish
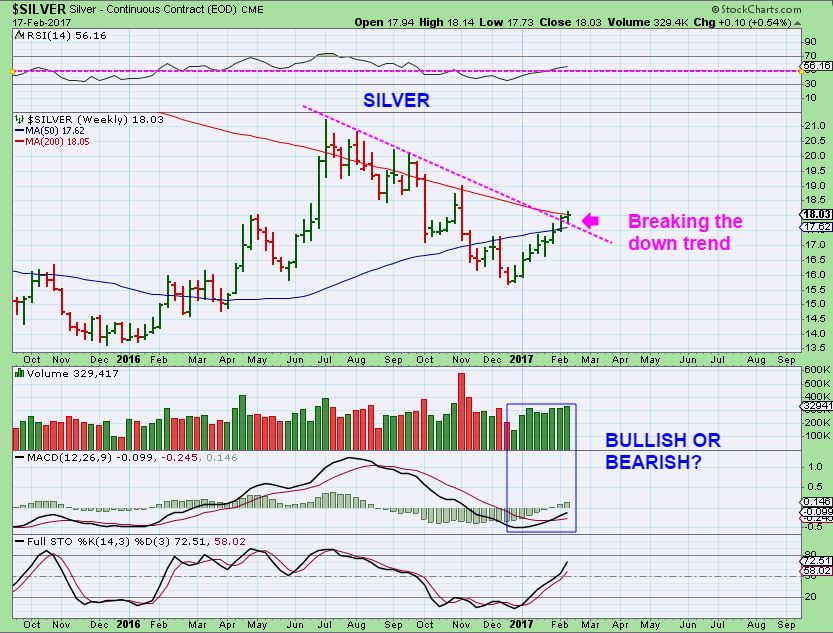
SILVER – This is also pushing against resistance, but it broke above an 8 month downtrend line. Silver is Bullish and NOT overbought on a weekly basis.
GDX DAILY – This consolidation action really unnerves people. Believe it or not, this could crash down to the 50sma and still be bullish. Currently what do you see? Straight up out of the Dec lows and sideways. That is quite bullish with no real sellers for 2 months.
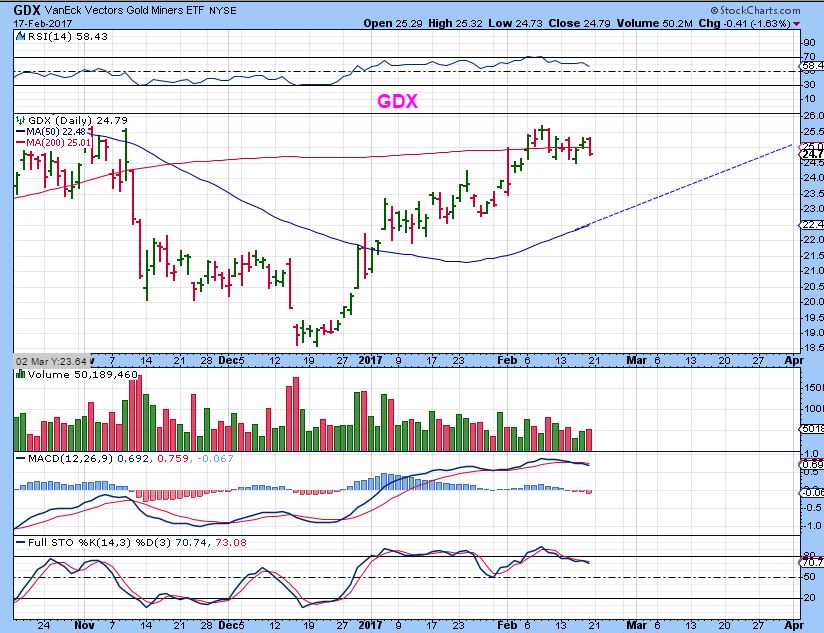
DOES THIS LOOK SIMILAR TO YOU SO FAR IN THE BIG PICTURE!
I’ve got good news and bad news ( And the bad news isn’t really bad news). This ran straight up, just like last January. The bad news, it then consolidated for months and dropped frequently. The good news, that was just a pause in a very strong run from $12 to $32 in 7 months. We are on month 2!
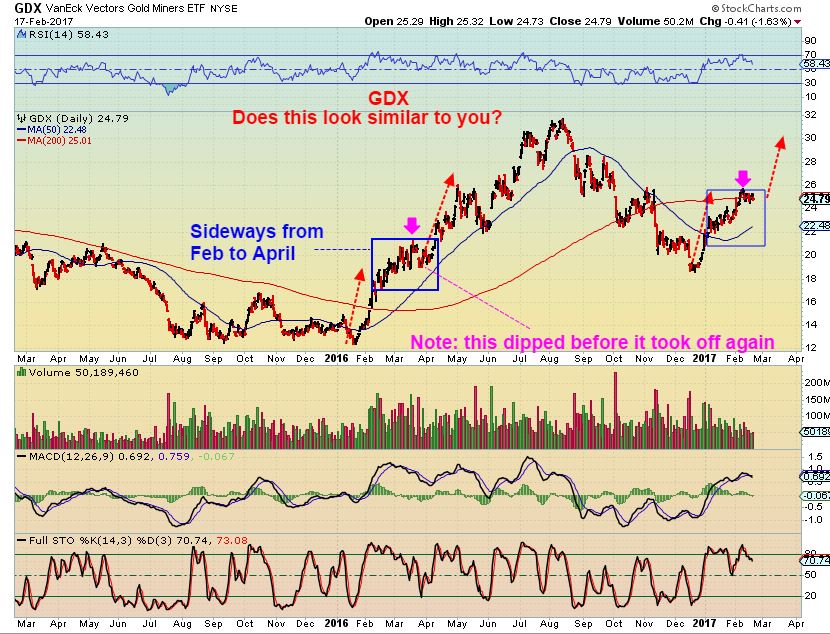
Conclusion to GDX: That Bigger picture chart in GDX above says that we may be on Month 2 of a 7 month run higher, why does everyone get so sad on 1 or 2 down days. If we crash to the 50sma, it is still bullish in my view.
.
Now let’s have some fun, let’s play…
FACE YOUR FEARS!
.
Click on the charts if you need to enlarge them : This was our Bull Market. It crashed down in July and is experiencing resistance at the 200sma. Please read this chart thoroughly…
.
GOLD – Please completely read the chart
GOLD – And A-B-C-D Down? We would now be at ‘C’? Read the chart.
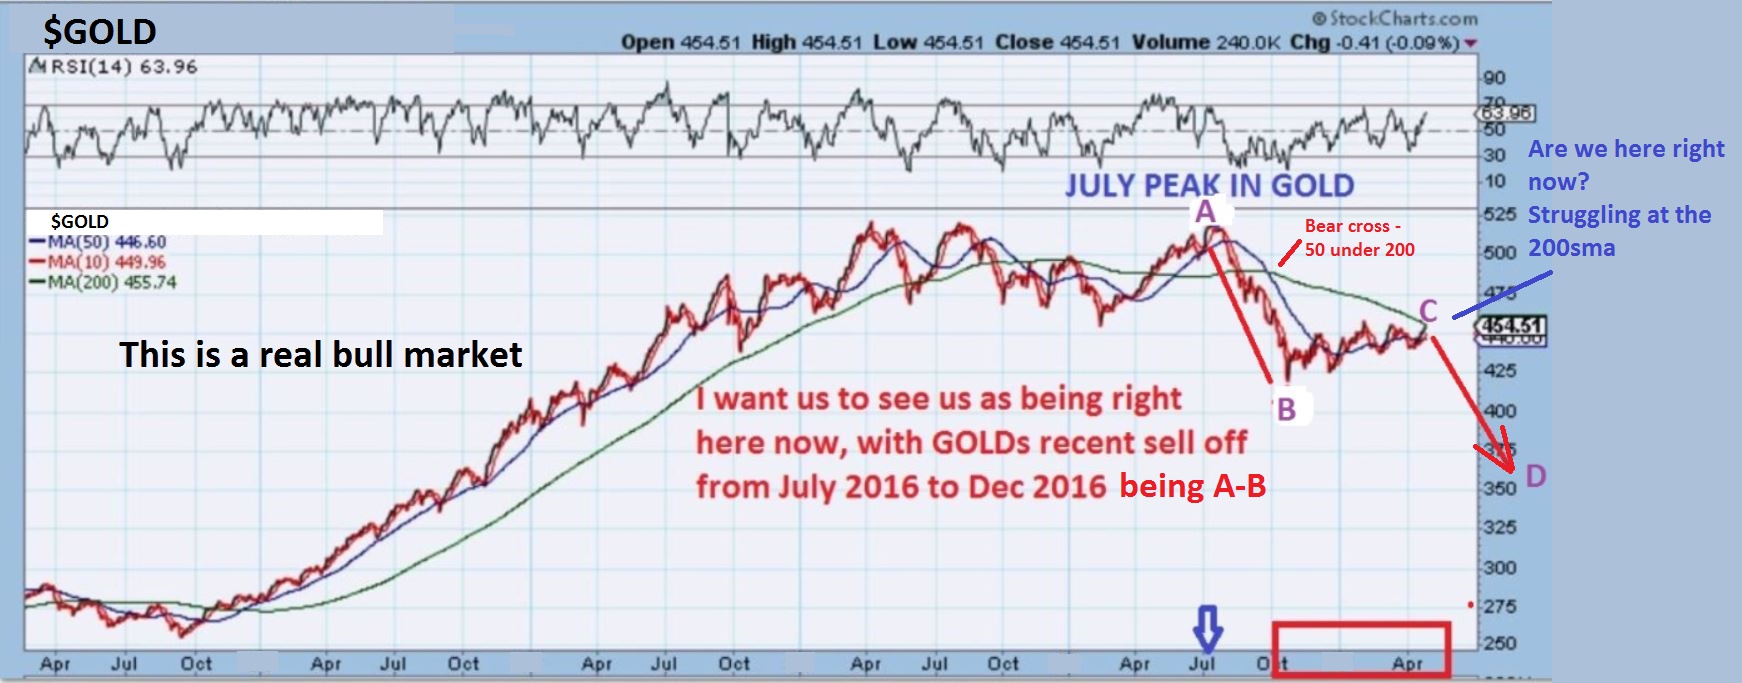
This is the same chart with the A-B-C-D Fearful drop with $Gold $1000 and Miners into single digits. Please read this chart thoroughly…
.
WHOA! It was the bull market in the DOW JONES, and it busted right through that resistance and ran like a champ! What if the Miners do this? Read the chart.
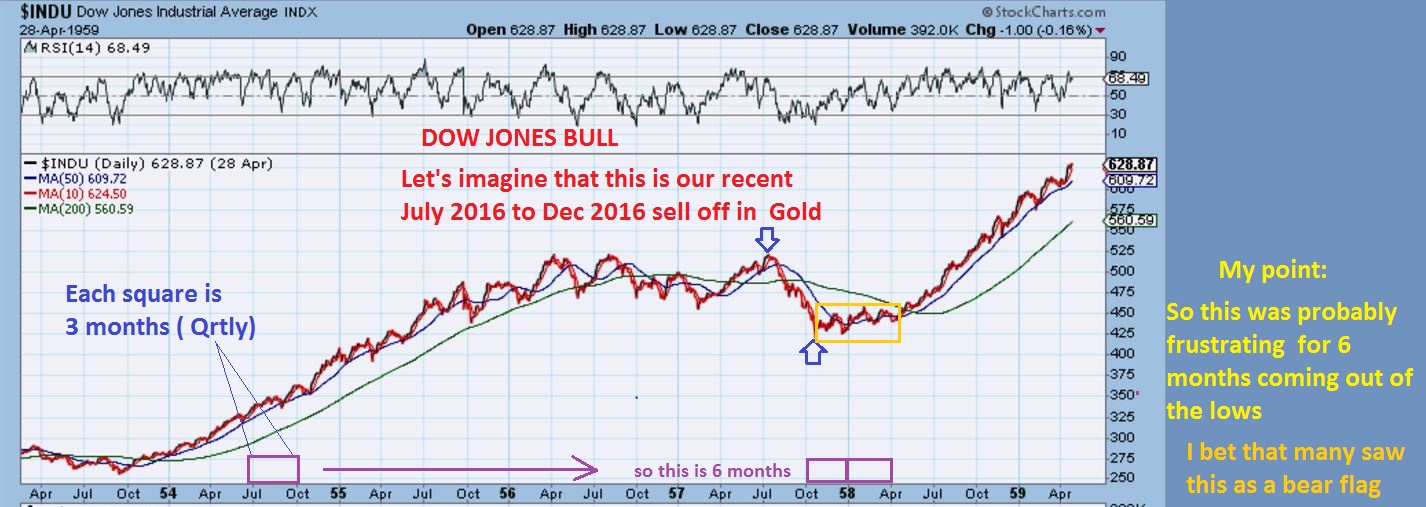
Step back even further and that BIG DEEP correction that I compared to last Sept – December turns out to be the buying opportunity of that time. Those lows were left behind . It was a final Low before the MASSIVE 2 year run higher. When you think about it, we at Chartfreak bought that Dec dip at the lows, and we did not get too cute and try to over trade it at the risk of being left behind. Please read the chart.
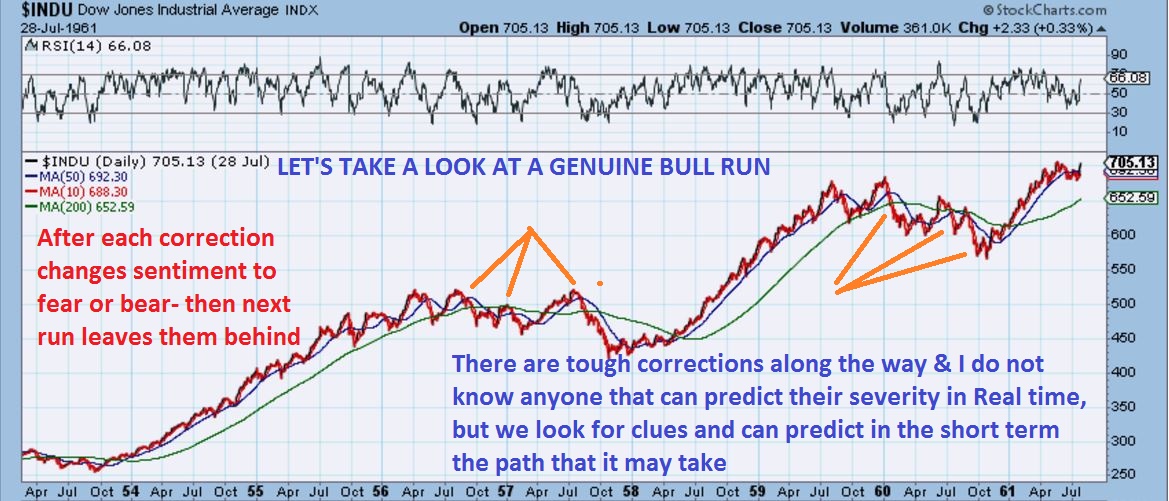
Corrections and sideways consolidations can be scary and also deep at times, but often they are a healthy part of a longer term bull run. When the majority of traders struggle to keep calm during consolidations or selling points ( it could be inexperience, fear, or reading too many bearish reports), they fail to see what is really important and possible. Yes use reasonable stops, but we see here that the market takes off and can leave them behind in doubt, not willing to re-enter if they become too afraid due to fear of Manipulation, The big bad guys just wanting to trip up the little guys, etc. We can make money in these markets too.
THIS is why you will hear that the bull markets often climb a wall of worry.
.
Enjoy your weekend !
.
~ALEX
.
It is 3 day weekend in the US, so no market report is needed on Tuesday morning to cover what happened on Monday, but I want to try to do a short bonus report anyway, if I have time to.


Thanks CF
Picture perfect backtest of breakout in EUR/USD.
EUR/USD up from here???
Also the probable reason for Friday’s pullback in $gold. https://uploads.disquscdn.com/images/3460a630d7b07d7fb6b34c8dad2f93a6942eb3b945adeb399724bbe932b87e72.png
Thanks and I agree.
Thanks. I know you can’t always do it, but I love these early reports!
Thanks for the reassuring report.
Creatively insightful with a little trickery. Nice. Gets me thinking…
There’s a gap at 39ish on GDXJ. A close of that gap this week would stay within the box and create more incredulity (ya, I said it) and hopefully some bearishness. I see what happened last April after a similar consolidation potentially corresponding to an upcoming March breakout as you’ve drawn it.
That is just incredulous! Although the 20sma does line up with that gap too 🙂
Nancy asked me to post these on this report – A few solar charts with some set ups…
https://uploads.disquscdn.com/images/7c955903780db3c0eada80669d365fd3b0981f9f45646761ab08d45562c0e68f.png https://uploads.disquscdn.com/images/9e1c2c2fa34fce8a56d415501690fe745eb73d492050e9d85f6ebf7cccfa2b97.png https://uploads.disquscdn.com/images/f0ec4c2db0a688dfa1577bba46c4dba31a33f4ca006367cc3d9a6a89c338e459.png https://uploads.disquscdn.com/images/0bd204d3a8e5ad69c39097c35ff39a1717e247922d0934d4b88b836eb9e9abe7.png https://uploads.disquscdn.com/images/ee627f60ec69b66f3f2517208656a8c27c46ad3a60088d5bda7a6ebca48c1164.png https://uploads.disquscdn.com/images/d4a0fdc53e9777f9849200c35fb1beecde528cf60e7f2ec44b87a5dba07186b6.png
After LE CHIFFRE pointed it out on Friday, I started to look through my list and watched the solars Friday too.
I think I even commented that SPWR looked pretty good midday. If you look at it intraday, I was watching it just power right up, then it did a little pull back and powered right back up into the close. I decided that I was going to be covering some solars in an early Tuesday report. 🙂
I don’t really like them all at this point, bit when I find a sector that is acting bullishly, it is good to be prepared to trade them if it turns out well.
VSLR has a Long multi month base its breaking out of right now.. Finally breaking above the 50and 200 Thoughts?
Yes, I like it and it is set to be in my report along with SPWR, JASO, CSIQ, TSL, and maybe a couple of others.
Thanks for posting the charts here….I see our Chartfreak was checking them out too. OK, I’ll really lay it on here: “great minds think alike”. LOL. [OK Maria…I’ve put a target on, have at me gurl.]
Excellent Report CF.
May I assume GDX and Gold still in a 2nd DCL in you estimation ?
If so…..do you see a DCL in Early Mid March ?
Thanks Ken
If you look at a chart of GOLD, you see a very clear dip to the 50sma. GDX at that time hardly dipped down if you view them side by side. .
Now going back to the report where I point out GDX and said,
“Does this look similar so far to you?” Where are the visible dips? Tough call, Miners were very strong.
I’m pointing this out because when you look at the Miners run in that chart from Jan to May- you hardly see a dcl.
I may use other methods to analyze miners going forward, like I did last year. Often various MIners act individually anyway. Some take off and run , and others lag and take off later. Maybe this affects the GDX, GDXJ charts.
Yes, I would expect Golds DCL to arrive in March.
If I pressed you and asked if the late Jan dip was a DCL would you agree ? Or could it be in an extended 1st. DCL with the second cycle forth coming.
I have noticed that you have not been showing or discussing cycle theory as in the past and was wondering what your thoughts might be in that regard ?
Look at 2nd DCL in GDXJ. If $40.26 goes, I’ll have to start paring back positions. Quickly.
*F5*
https://uploads.disquscdn.com/images/c01197c5fbefb5ce16539f8026105a1b9c41faca7c1bd46ba03290be456e681a.png
It’s also $1217 for Gold.
There’s that dang 101.5 USD mark showing it’s nasty head again…
Alex, you were right on UGAZ, opening -20% !
Cnab…just marvelous darling…;-)