
Feb 16 – Building Bridges
Sometimes building bridges by means of consolidation pave the way to higher ground. I will discuss that later in the report, after a quick market review.
.
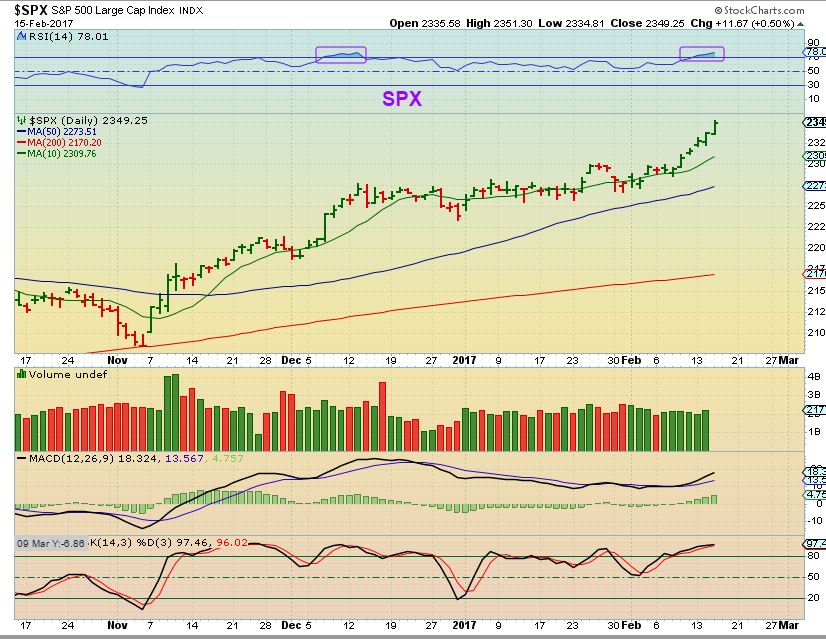
SPX – Again, this is like a melt up phase, and if I were long I would use trailing stops and let it ride. That long bridge of consolidation has built up some energy.
This was eye opening…
.
I have been discussing the VIX Timing, expecting a spike soon and other reasons why I feel that the Markets could experience a pretty good drop, possibly in the spring. Currently I have mentioned using a trailing stop as the markets continue to sprint higher. I also pointed out a target at SPX 2400-ish area. Now look at this…
.
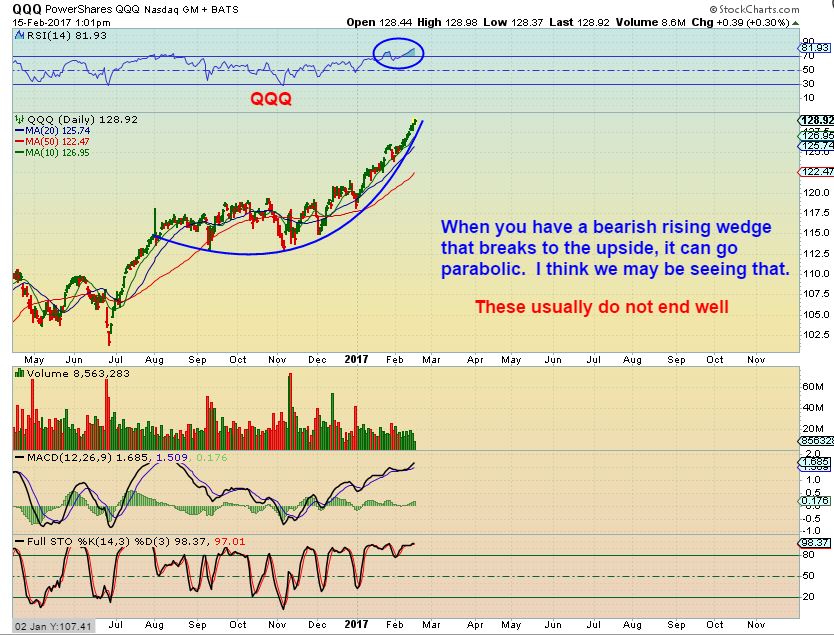
QQQ – The NASDAQ is red hot and could be going parabolic. If you have seen a parabolic rise in the past, they usually run red hot and everyone gets Very Bullish, then they end rather ugly. This is when people will start feeling like they are missing the boat. Emotions take over. Buyers want to just jump in “because I read that the markets are going a lot higher!” This is just a big picture look to keep everyone aware that the trend is the friend ( until it changes). Like NAK, a sudden news event or situation can bring this down quickly when time runs out. For now, It will likely continue to melt upward, so if you are long, stay long and use trailing stops. In a market melt up, this run can keep going.
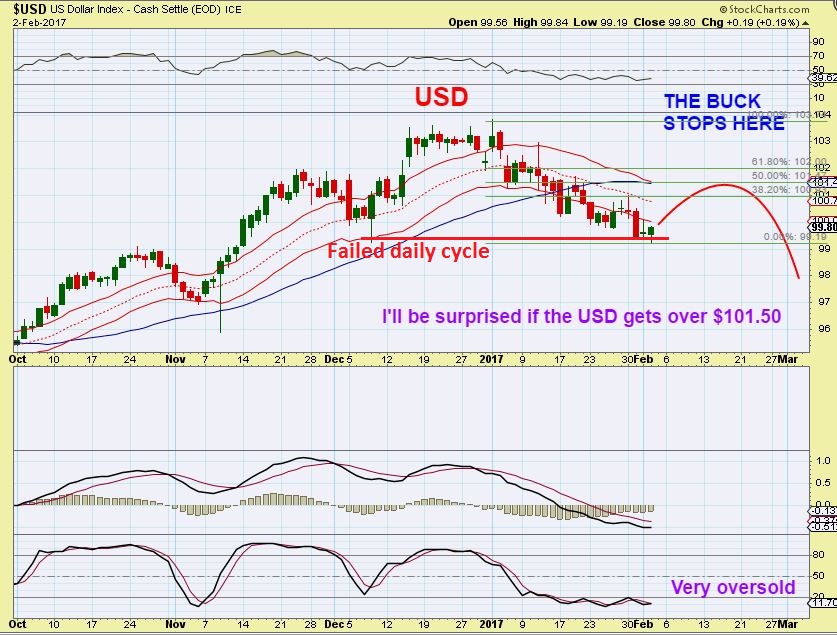
USD – 2 weeks ago I re-stated what I was looking for, and this should boost Gold. A bounce to the 101.50 area was what I was thinking of.
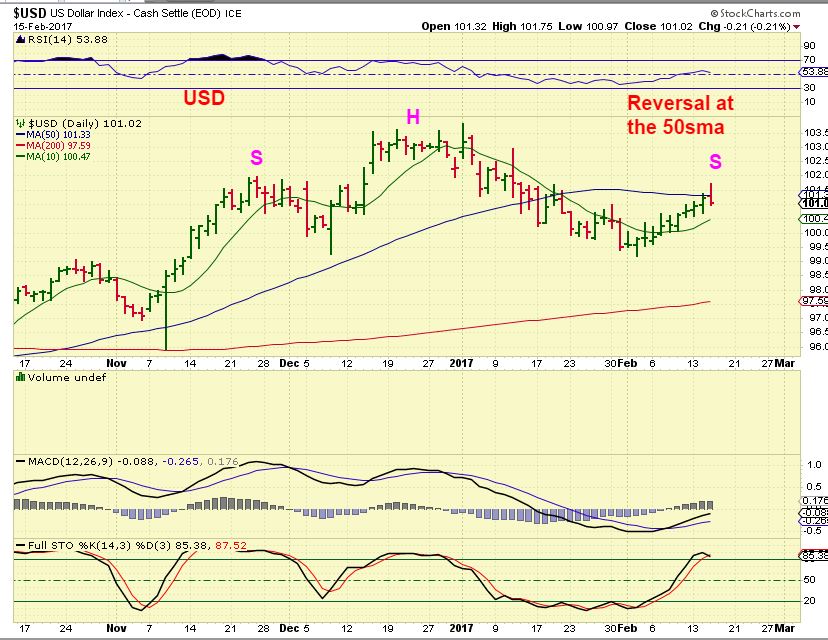
USD FEB 15 – Exactly what I’ve been looking for. The USD broke out & failed ( So far).
Lets see if this holds.
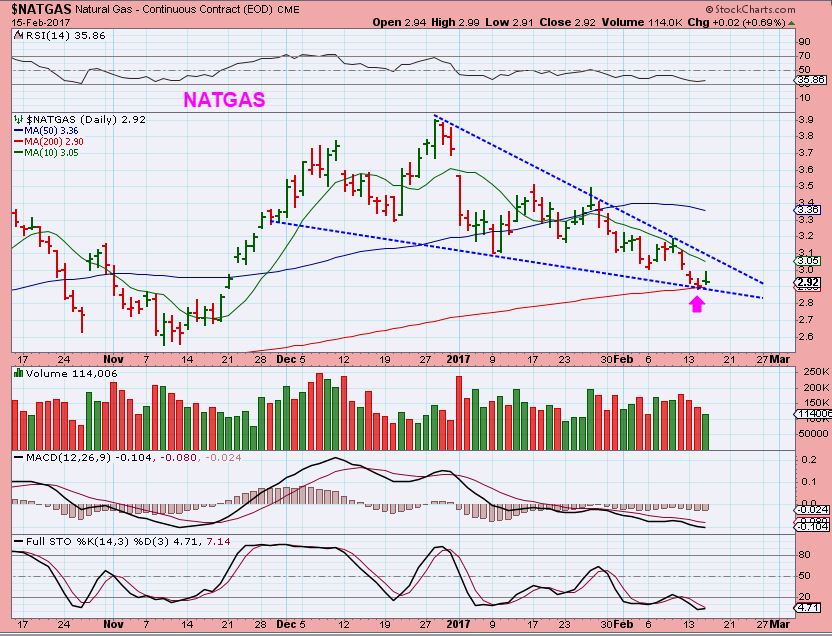
NATGAS – I had 3 NATGAS charts in yesterdays report. I have been watching NATGAS for weeks and expected it to get down as low as the 200sma. Here we are. We’ll see if it bottoms and what kind of bottom we get. See yesterdays report if necessary .
.
GOLD, SILVER, & MINERS
.
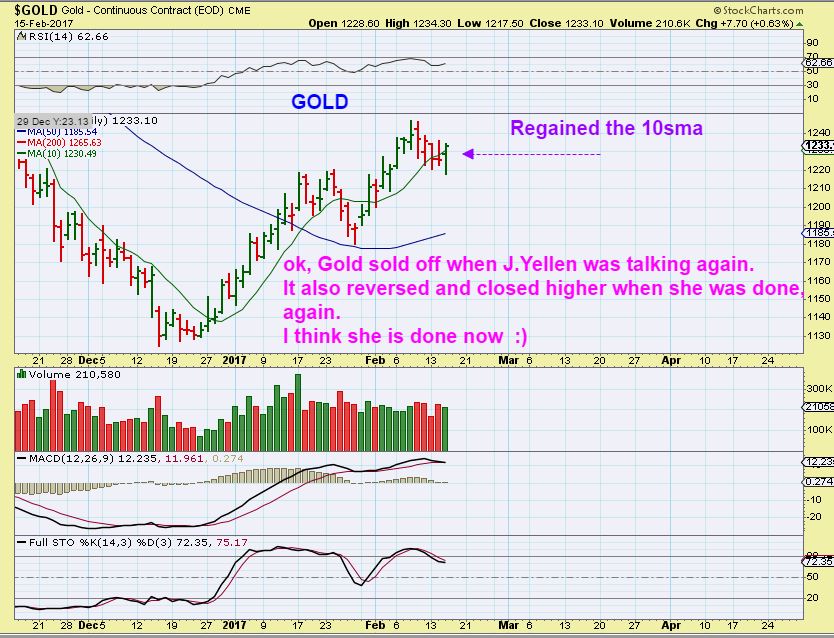
GOLD – This was a nice reversal. Please read the chart. This looks bullish.
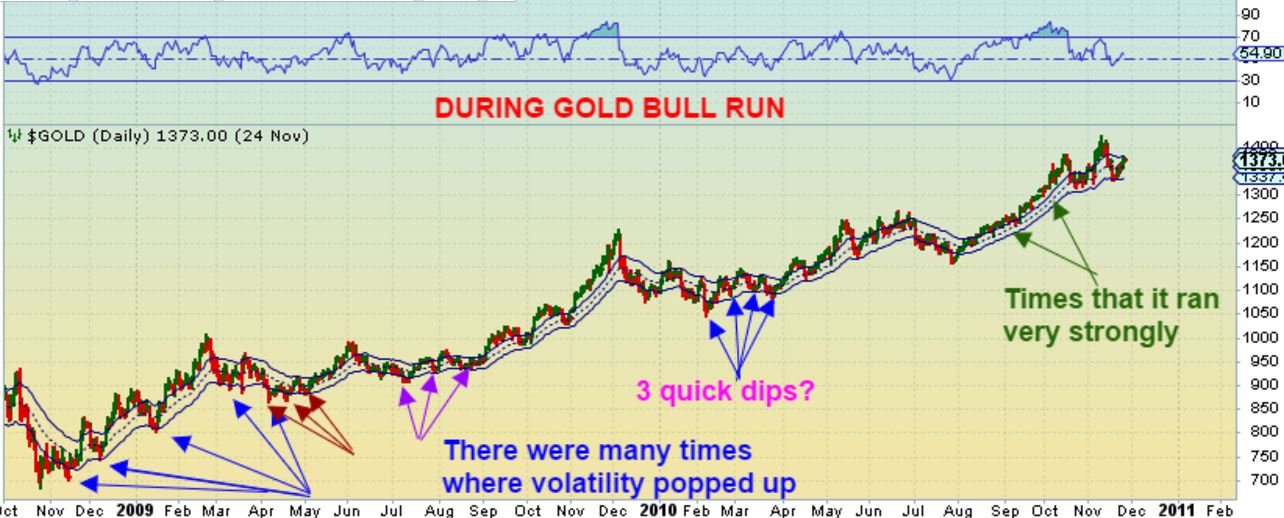
GOLD BUILDS BRIDGES AT TIMES IN SIDEWAYS CONSOLIDATIONS – Please look at how Gold CAN act before a big run. So much talk about wiggles and bounces, but right now Gold & Miners are actually SO MUCH stronger than many are giving it credit. Look at this chart of a bull run out of the 2008 lows.
Would you call this Smooth? A steady climb higher? Fresh gains every day? The only bad position may have been overly leveraged. This was a steady climb higher, but look at all of the dips, some I’ve pointed out, but there were still others. This is a Bull Market.
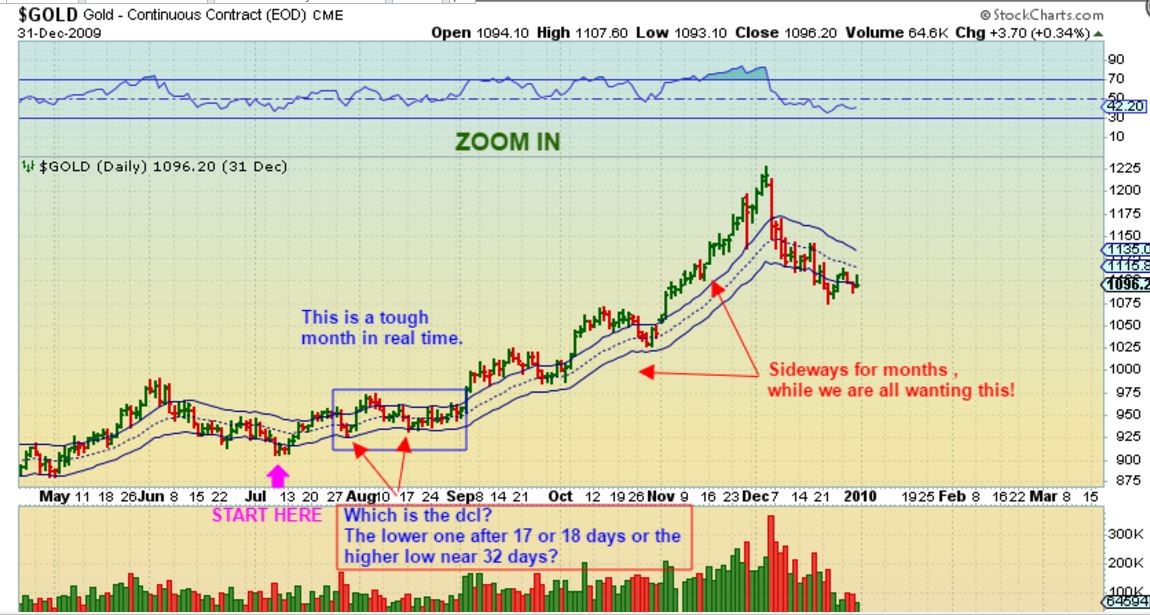
GOLD 2009 ZOOMED IN– Look at the blue box out of the July lows. That looks confusing cycle wise. Where was the DCL? Tough call, and although there was nothing ugly or bearish or weak in this run, it could have looked weak at that point. For inexperienced traders. this is a sideways Bridge building period before an explosive run higher. Again, look at that tough 2 months in the blue box, and then look at the rally for the following months. I say this because some are possibly confusing consolidation for weakness.
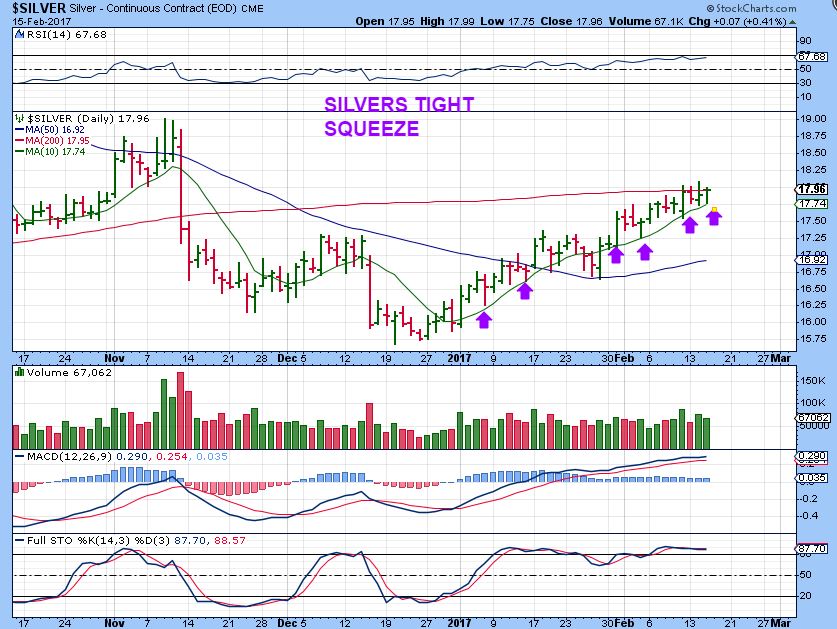
SILVER – Some are even wondering why Silver is so weak, and should we be selling. Day by day it may seem weak, but please see the chart. Is this a weak chart or a strong chart?
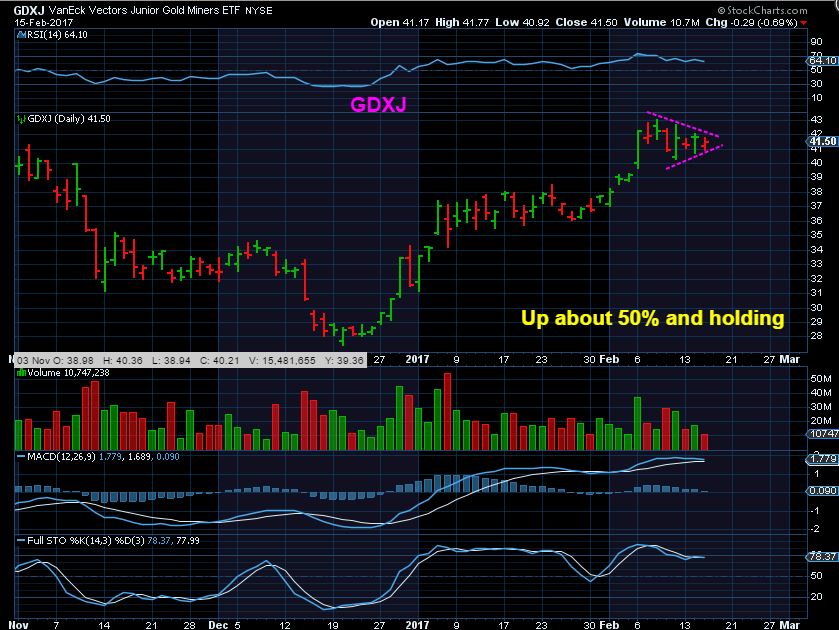
GDXJ – Weak? I keep hearing how weak GDX, GDXJ and Miners are. If you hear that, please pull up a chart immediately and take a look. Again, we have readers from all experience levels here, and we all may use different terms when discussing day to day action.
Someone may say to another in our comments section, “GDX looks weak today”, perhaps because they are looking at 10 minute charts. They are not wrong in that context. It might have a dip intra-day. That doesn’t mean that they think it is ‘weak’ and should be sold off. It may not be relevant to what you may be looking at on a daily basis. Let me just say that GDXJ is not weak in this chart at this point, and no it is not giving a sell signal.
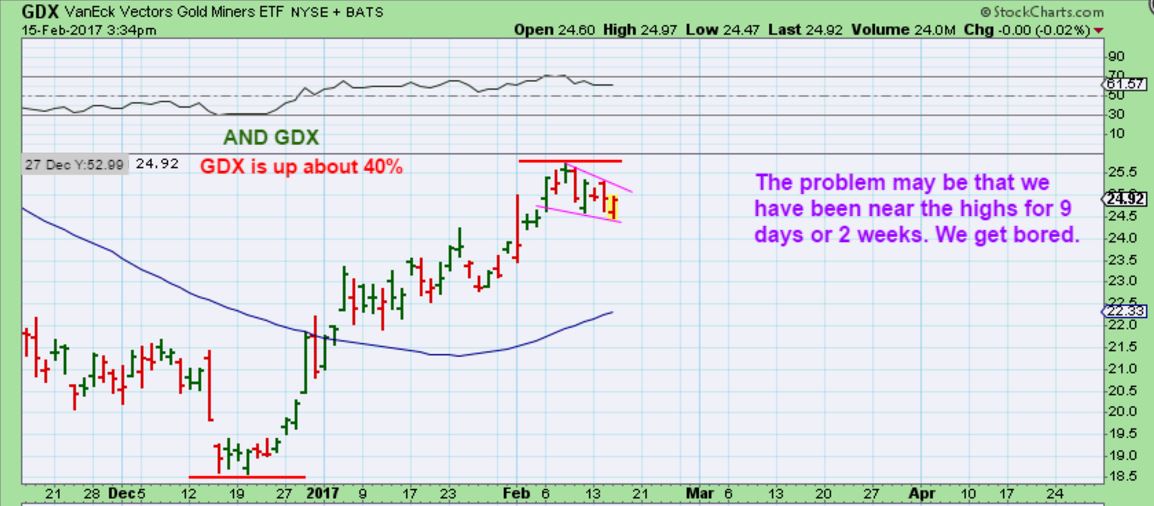
GDX– This could be a BULL FLAG and a break above the upper magenta line could have follow through buying.
.
PERSPECTIVE :
.
At times I receive emails of concern from some thinking that something must have changed. I have a lot of readers here, and for the sake of helping the inexperienced, as well as the experienced, I want to do a quick review. It is Thursday and in the US we have Thursday and Friday trading and then a long weekend. Monday is a holiday . I am getting just a few emails asking , “Should we sell everything now before the weekend? I am hearing that GDX or Miners are really weak. I don’t want to hold over the weekend if it is extra dangerous.”
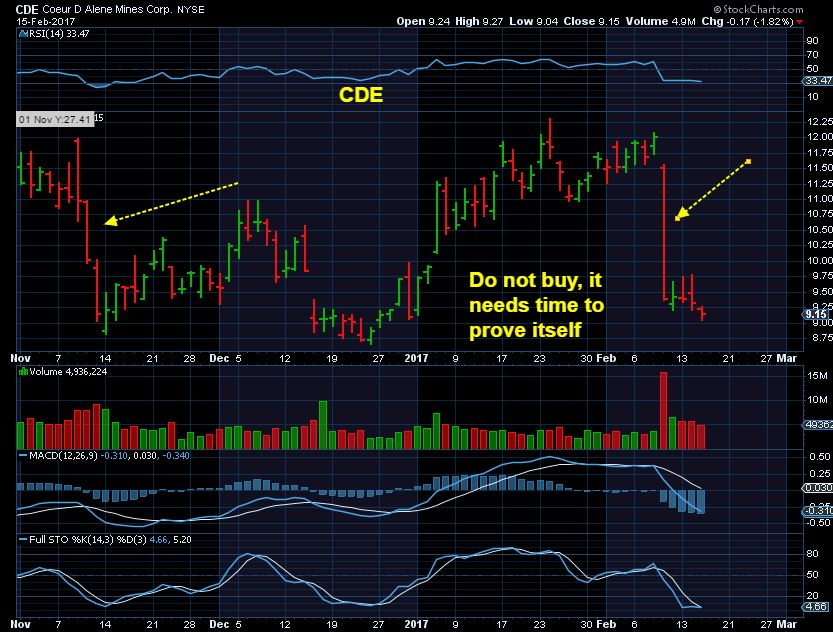
I understand that feeling, but I let me just say that I am not seeing weakness, and this is with 2 days of Fed Testimony. That is why I posted charts of GDX & GDXJ above as strong, and now I want to do a quick review and a short story , all at the same time. To start with, yes, some Miners will experience bad times. CDE got slammed recently and is going to take time to repair that chart. PAAS had a down day after earnings, It was an out performer, we’ll see how it plays out from here. I will discuss NAK too. Charts of GDX & GDXJ remain healthy and bullish so far. Let’s take a small tour .
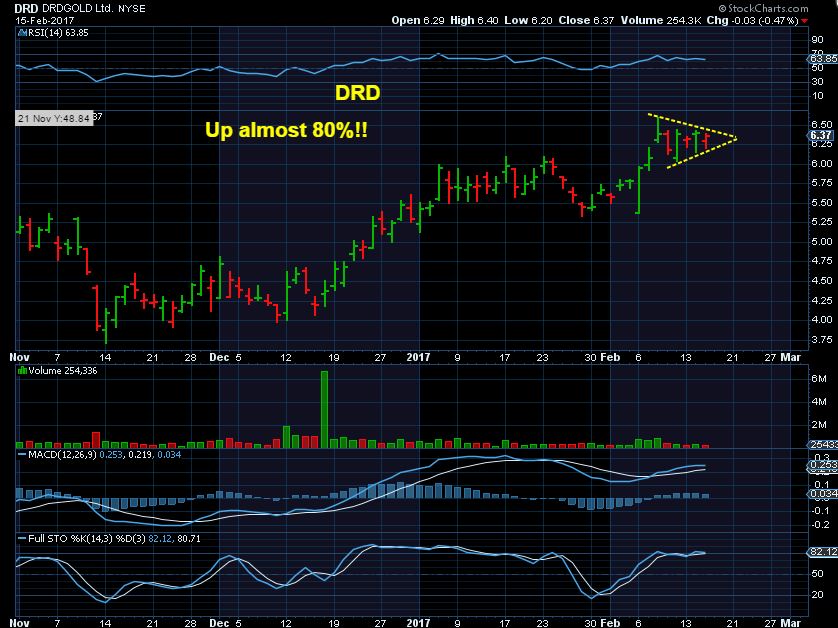
DRD– Up almost 80% in 2 months and holding near the highs. Bullish or bearish.
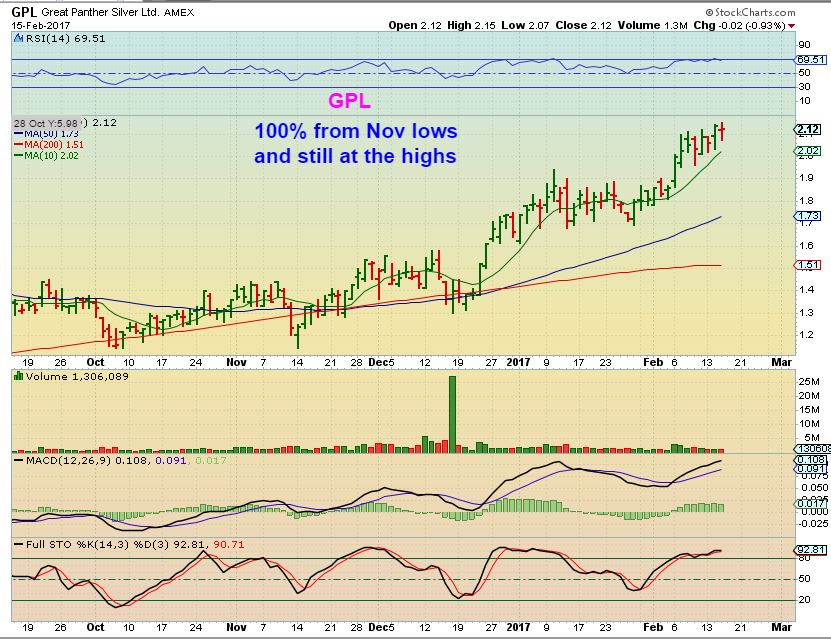
GPL– 100% higher in a couple of months, still at the highs. Bullish or bearish.
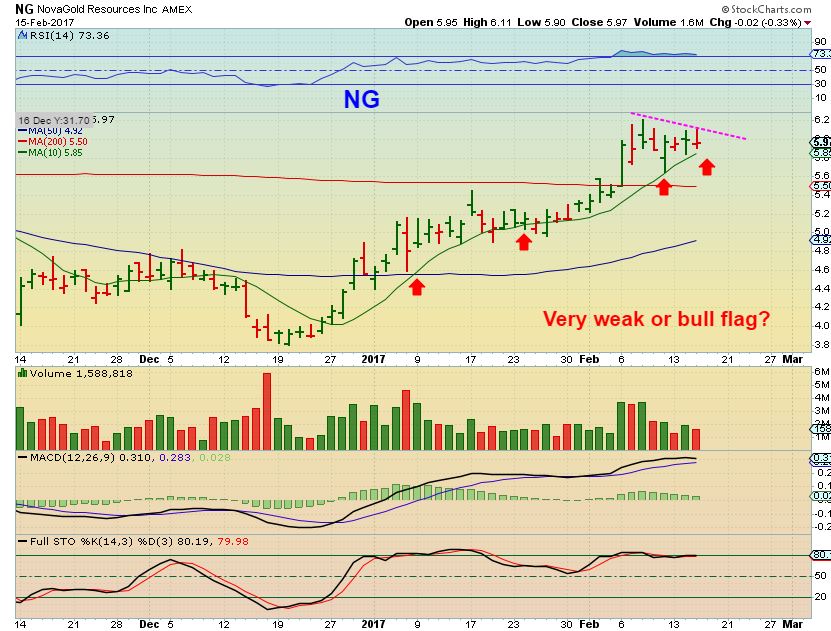
NG – Up 60+% in 2 months, still at the highs. Bullish or Bearish?
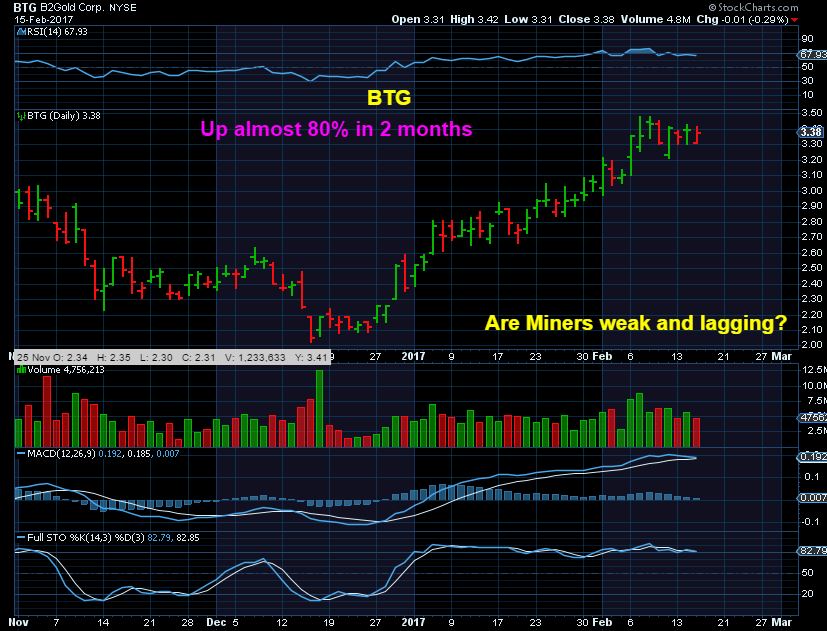
BTG – 80 % gains from Dec lows, still building a bridge, a bull flag. Bullishly strong or bearish and weak?
.
The NASDAQ is getting red hot as mentioned. Now I am getting emails ( just a very small amount, a couple, but just in case others feel the same way, I will address it in a report) asking about huge gains in Tech stocks. They wonder if we are missing it while Miners are weak? So after showing you above that we’ve seen some great gains in the first leg higher , 80% gains in NG, 100% gains in GPL in 3 months, and they are holding gains and threatening to go higher, etc….let’s take a look at the situation.
.
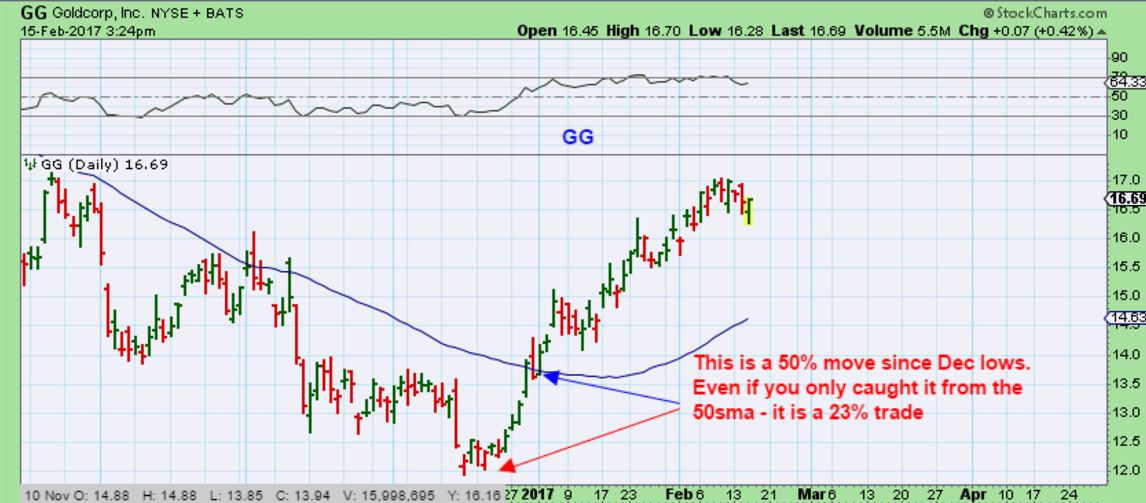
GG – Even GG ran 50% from Dec, and if you caught it after it gained the 50sma to be safe, you have 23% and a reversal Wednesday at the highs.
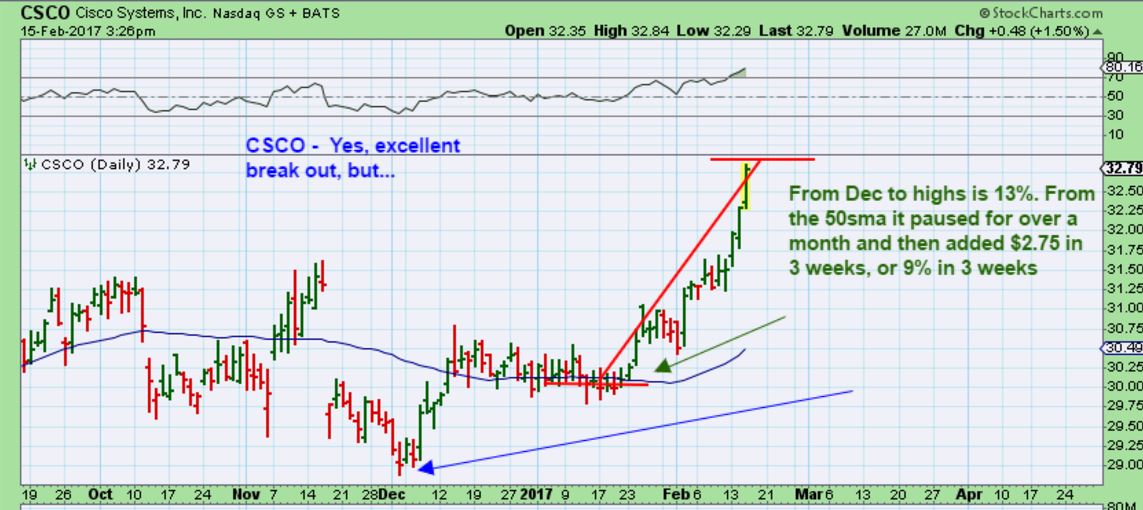
CSCO – ON FIRE? YES! Look at that break out and run higher. However this rip higher is 13% in 2 months from Dec to now. $29 to $32.79 ( GDXJ was $18.50 to $25.50 – GG above was $12 to $17). You are invested in the right sector at this point. Perspective is everything.
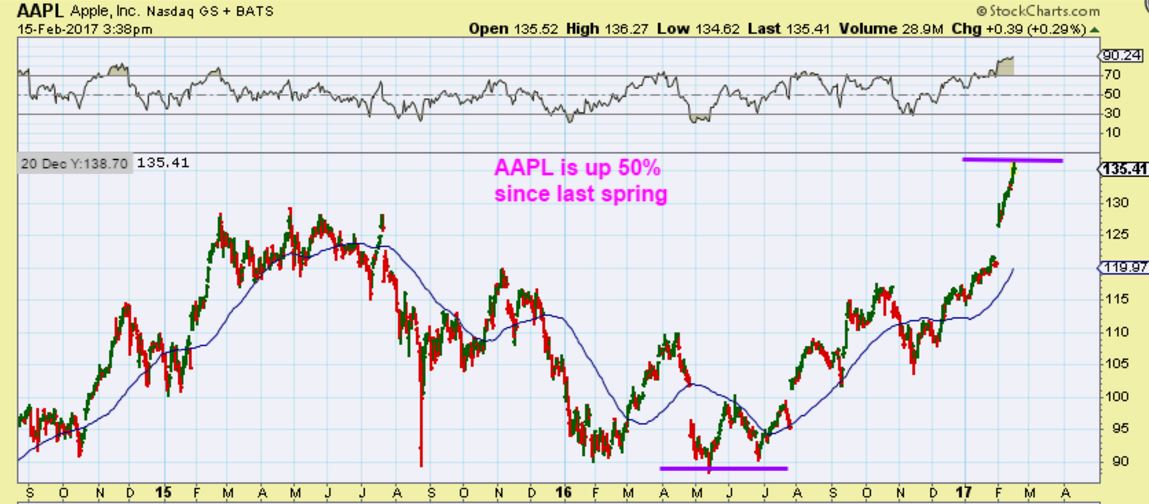
AAPL – Yes, AAPL is awesome and has again hit new highs. Yes, buying it years ago was SO rewarding. Yes, I knew Warren Buffet bought AAPL last year. Now look at this chart. Could you have held through the sell off in 2015? What about the sell off in all of October? So AAPL is up 50% in about a year. Very good, but some of these Miners are up 80-100% in 2 months, and others could be ready to play catch up.
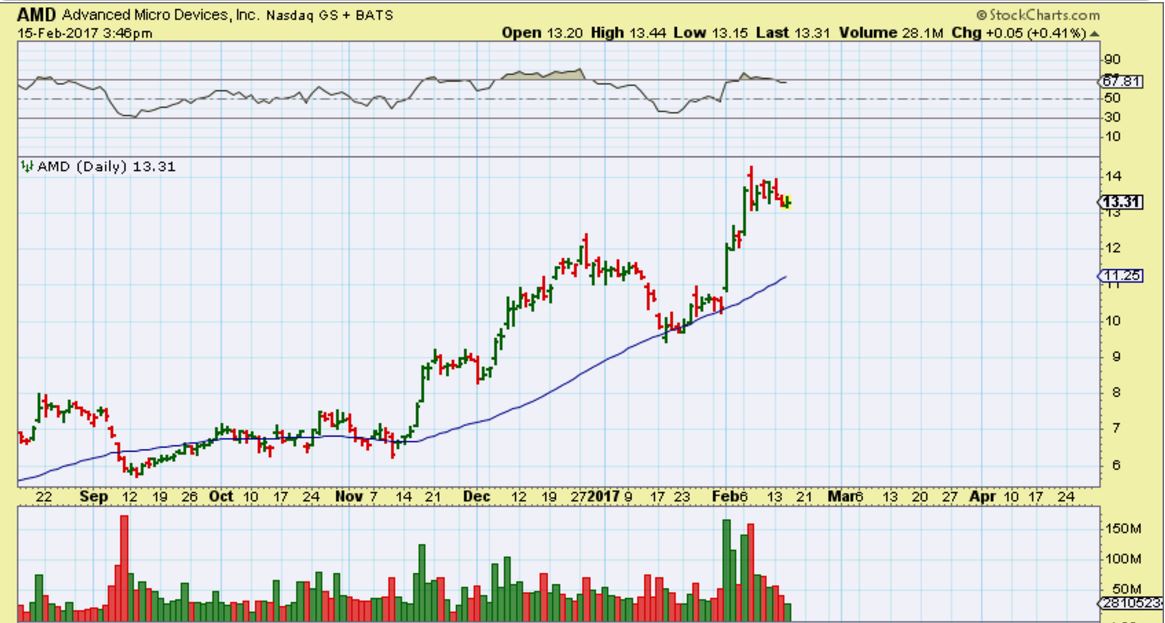
AMD – I actually have been watching AMD, FNSR, TWLO, NVDA, MU, CY, and a few others in my spare time. They are making great gains. So let’s look at those bull runs. Any dips? GDX & GDXJ aren’t dipping lower yet. They went sideways and some feel that they are dead money. Look at the dips that can happen in a normal bull run in AMD for example. I think our Miners are acting VERY WELL.
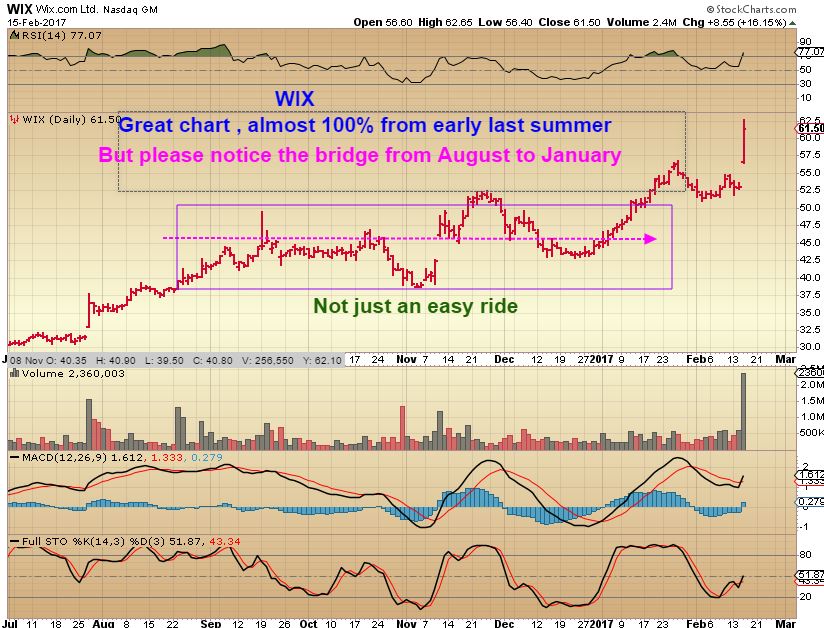
WIX – A great run, almost 100% from early last summer, but was it an easy ride? No. Could you have held on from August to January with 6 months of sideways before yesterdays POP. GDX has only had 7 days of sideways 🙂
So we are seeing good gains in the TECH SECTOR, and I’m sure some stocks there are flying up 50-80% too , but whick ones? And how long does it take to get them there? I know that some Miners here are doing very well and I expect them to continue to do so. The current pause or consolidation , even if it dips lower from here, can build up energy for another run higher, and I do try to stay on top of the sector that we are invested in. Let me just say, so far so good. It actually looks like Bull Flags could be forming.
TRADE REVIEWS
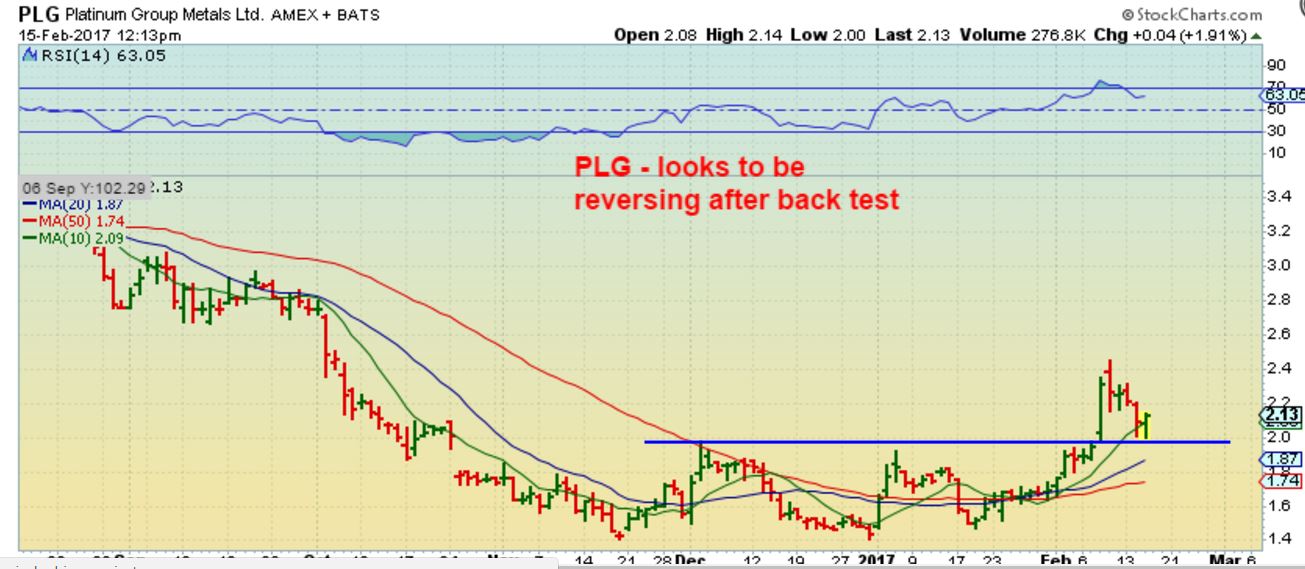
PLG – This is a trade idea that I had in January. I wanted to point out that the normal pullback was a back test and it reversed. This may have been a good place to add.
PLG ran from a $1.60 buy above the 50sma to about 60% higher in 3 weeks. This pullback is normal in my opinion.
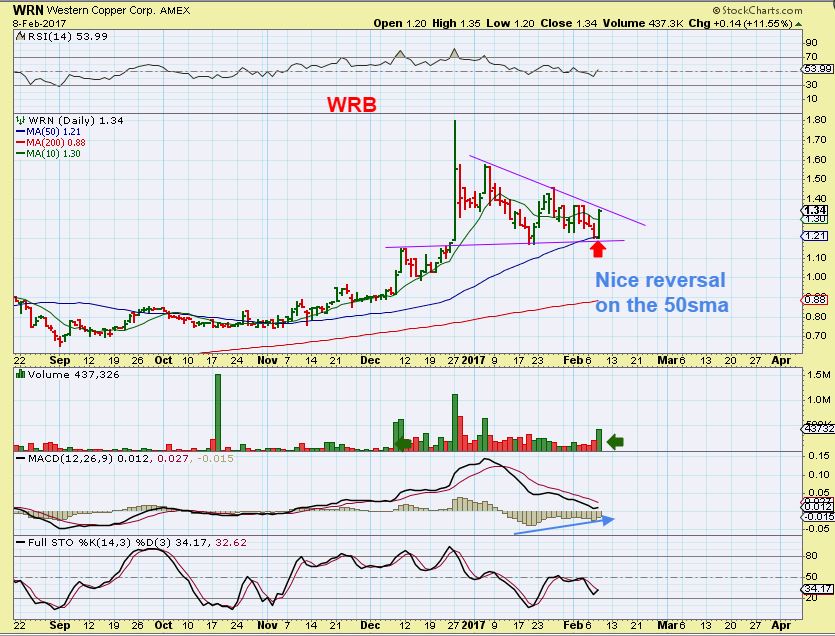
WRN – This buy idea had good potential. I bought the reversal off of the 50sma and posted this in case anyone wanted to buy the break out ( a bullish break out). $1.34
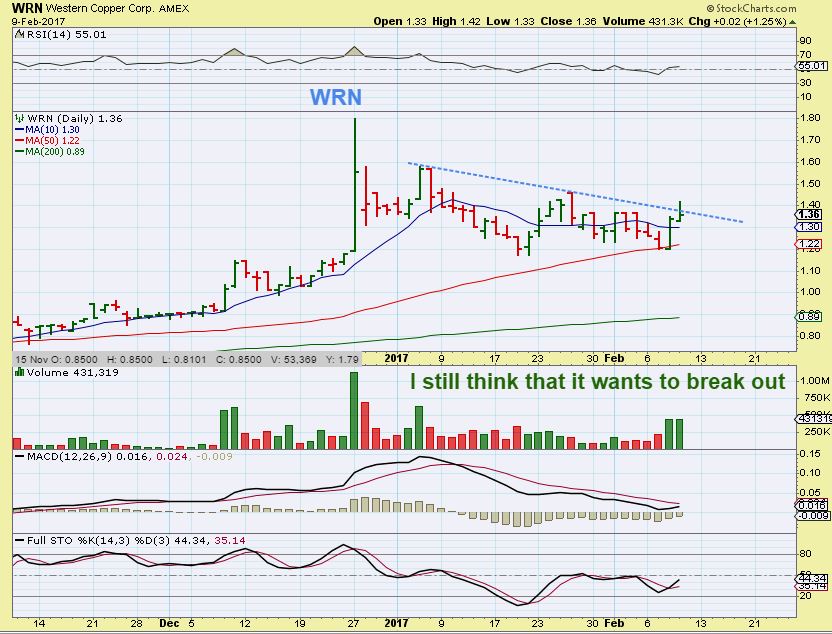
WRN – I posted that this may be 1 last chance at $1.36- read the chart.
Just an update-
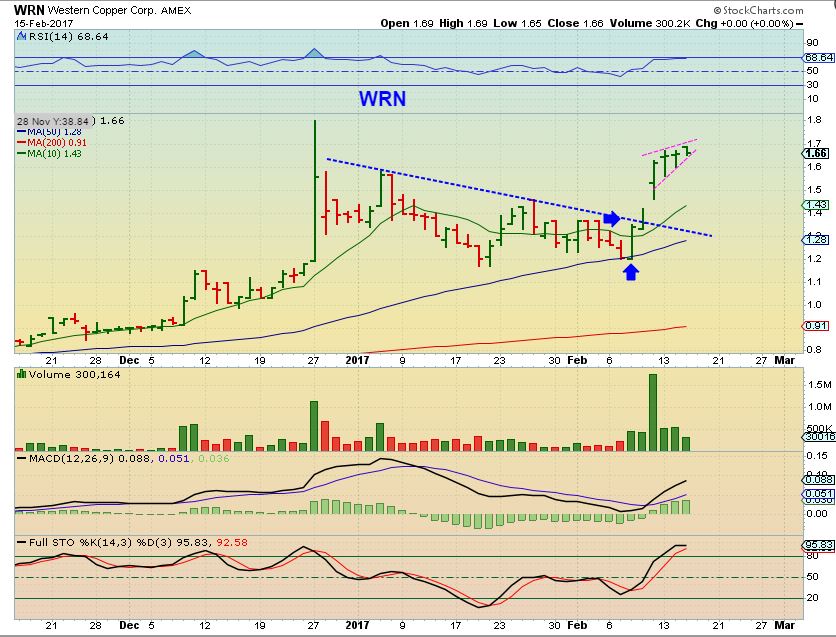
WRN – So, up 25% in days, is this now a bearish rising wedge or bullish? I believe it is bullish and I have not sold my position. IF this breaks down, I will sell and look to re-enter another time ( it may just put on a handle). I actually think that this doesn’t want to sell off, and will POP higher quickly out of this slanted flag. It looks ready to go one way or the other actually.
I had this chart of NAK as a possible path for it to recover if they can stabilize the current media situation. Will it stabilize or will it break down? Time will tell.
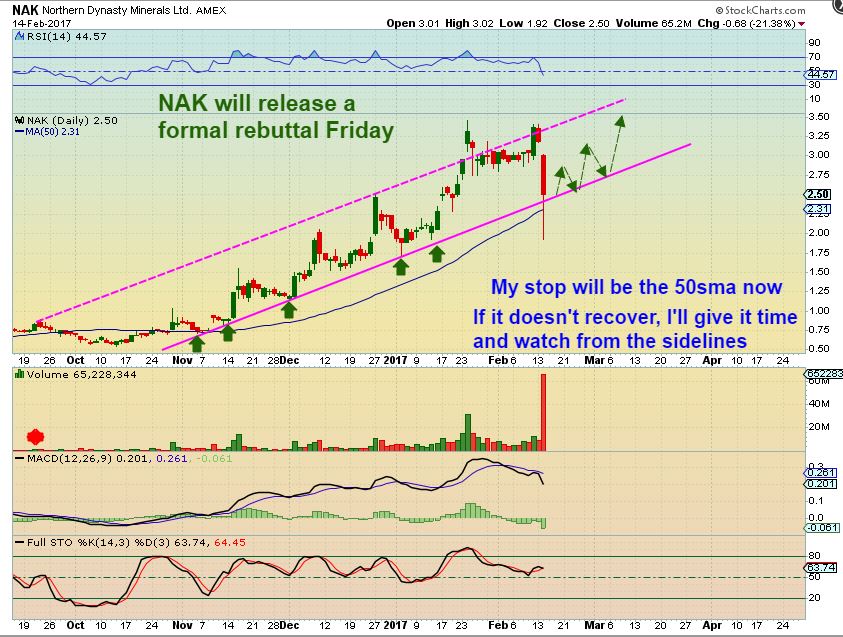
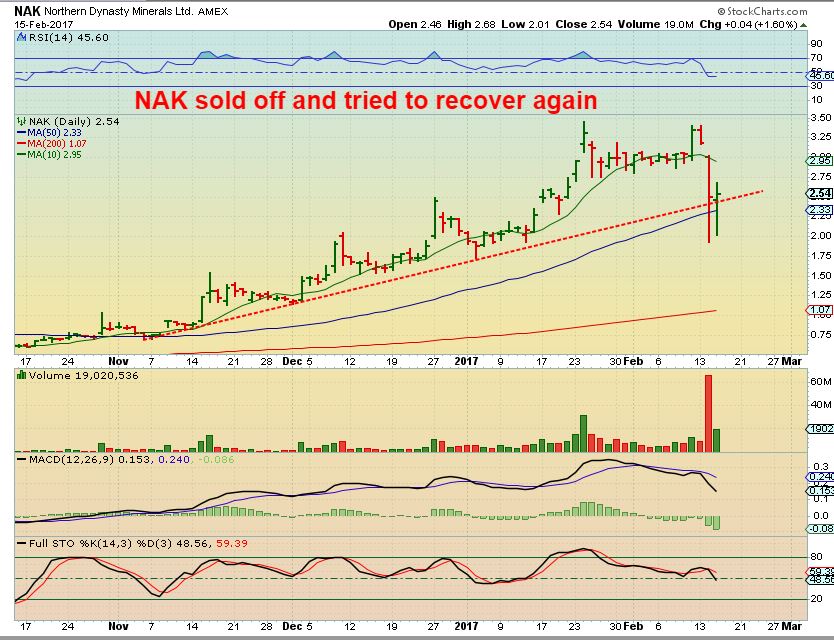
NAK – Think about it, those sell offs in AAPL, AMD, FNSR, etc. etc. in their bull runs were scary too. I mentioned in yesterdays report that people would come home Tuesday and see what happened, and NAK would have a 2nd phase of selling Wed morning. I thought that then shorts may cover, buyers may step in , and it could recover. THAT BEING SAID – I’d watch NAK to sell down Wed morning and then use the 50sma as a mental stop after that. Now the loose selling may be done. NAK is supposed to have a rebuttal to the article written by the Fund Shorting it. It has recovered 2 times. Now I do not expect a lot of selling from here without further bad news.
Look at a chart of CDE vs NAK. When CDE broke down and readers asked me, “Can I buy it?” I said, “I wouldnt touch it. It is a broken chart and will need time to repair itself.” I drew this for you. I did NOT expect CDE to recover, the circumstances were different.
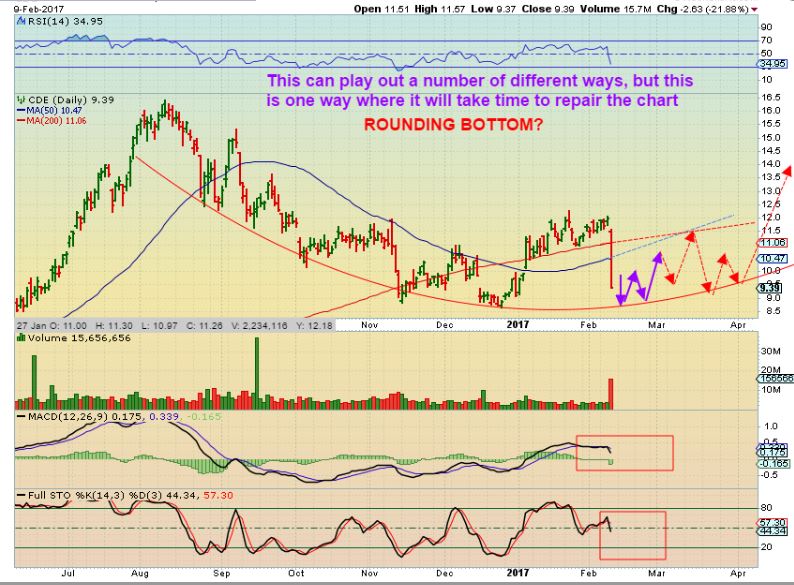
Now look at CDE. It has not recovered, it is struggling. NAK has recovered from both waves of loose selling. It may or may not hold here, but it looks better than CDE. CDE is a broken chart that needs time to earn buyers trust. Buyers seem to believe in NAks potential at this point. Time will answer all of the rest of our questions and opinions.
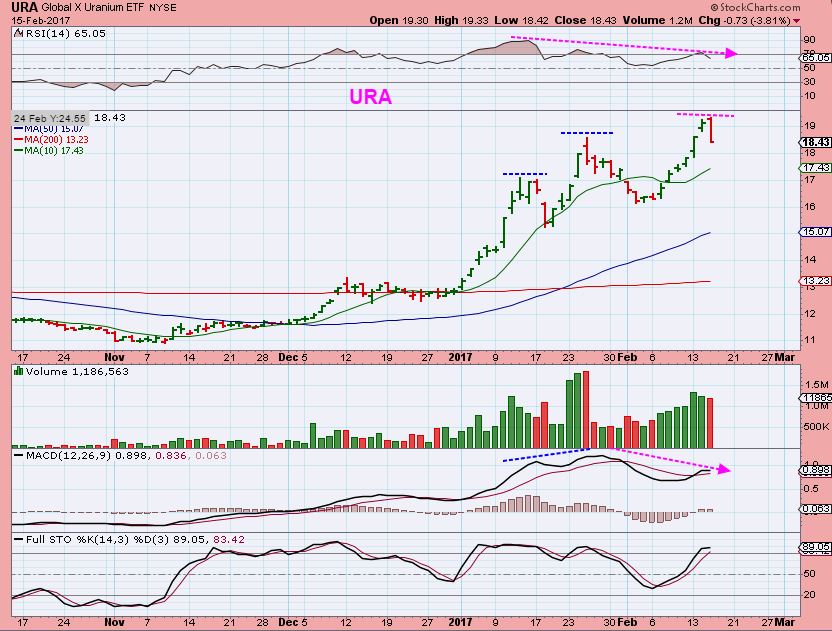
URA – Higher highs with divergence usually lead to a dip. How far? Is the climb done? It is hard to tell. The last peak in January looked like a top, but it wasn’t. Is this, or will it just keep stair stepping higher? …
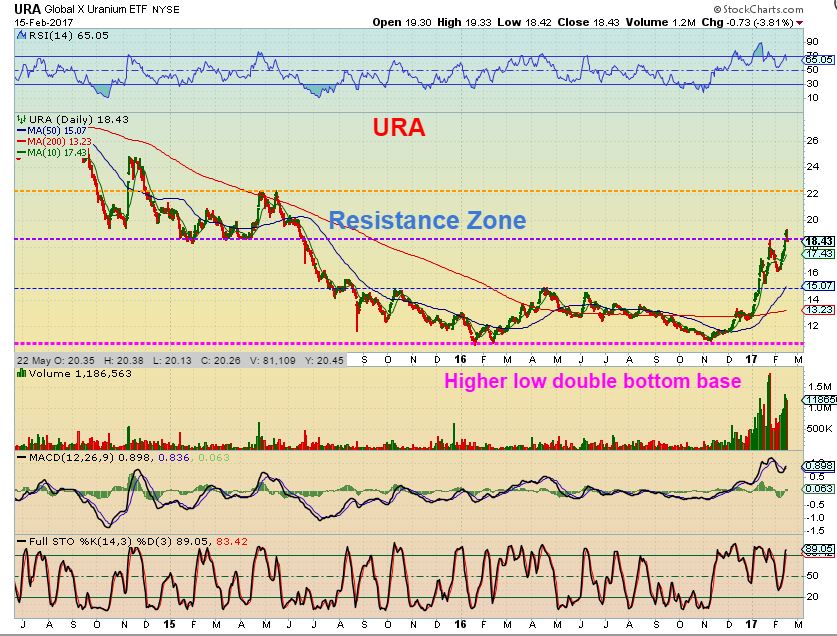
URA LONGER TERM – I believe Uranium has sprung up from a double bottom base with a higher low. It looks to have begun the next Bull market, and the Uranium stocks have been on fire. In time, I think Uranium will continue higher.
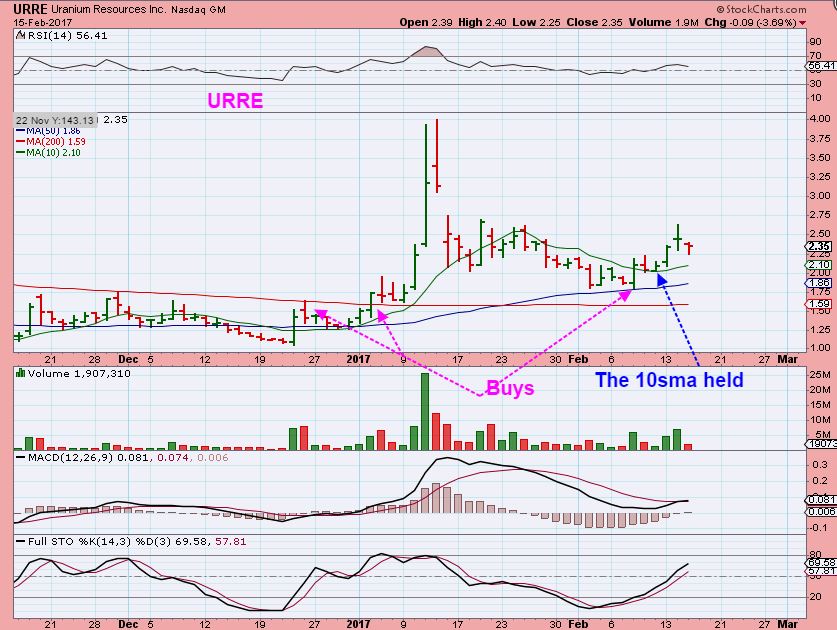
So I took a trade in URRE (Again) recently and posted it here. I’m pretty sure that his is the only Uranium that I recommended as a buy in February, though I really wanted UUUU too. We bought in December and sold that with 100% gains. The next buy was at the 50sma, and then it popped and landed on the 10sma.
Now URRE is up over 30%, what now? I still own it. I am NOT trading this based on URA. UEC, URG, DNN, UUUU charts do look a bit like URA, but this may just move on its own, and I like the base forming that it is doing here. CAN IT dip to the 10sma? Yes it can, but I like it and will hold it as long as it remains bullishly set up. The 10sma should hold.
So again, we had 2 days of FED testimony before Congress, and Miners held up. Doesn’t that alone make them strong, not weak. 🙂 SO I am not thinking of selling at this point. I see what could be bull flags and I’d like to see them break out upside. Let’s allow Thursday and Friday to play out and see if that gives us any more information before the weekend starts. The FED spoke of inflation coming in, and that is good for Metals. I’m still holding all of my Mining positions. We’ll probably see soon enough whether we can or cannot get a higher high in this daily cycle. I think we can move higher, especially if that was the top for the USD.
Enjoy your Thursday and Friday trading, the Markets are closed on Monday in the US. This is the time for you to decide, based on what you see, as to whether or not you want to hold each position through a long 3 day weekend. Look at each position as an individual and decide for yourself by friday if you live in the U.S. I still like what I am seeing, I’m still holding a chunk of NAK that was purchased lower, but I am not adding to that position at this point. I will try to post a small report on Friday morning. Happy trading!
.
~ALEX


Alex, I agree with you completely. I had a pullback to 1215 as a target, we got to one dollar of that Yesterday then had a strong reversal. Overnight gold broke higher out of what looks like a bull flag to me. We are a little overbought now, so a pullback is possible. That might be your last good buying opportunity. I could see Gold 1280 in a few weeks. https://uploads.disquscdn.com/images/9361f7500081adbff2f4250cc6feb49bc668518c8ce2cb5775d1d479d671fe7a.jpg
And many of the Miners shown in the report are technically bull flagging. If this USD rolls over as expected, and Miners resisted 2 days of Yellen testimony, it really does lend to the bullish side of the bigger picture.
EDXC reports 31% revenue increase today
Very nice. Lets see if they buy that recent dip : )
By the way Tammy, I did take a starter position in CNAB.
I like the set up, but it may not be ready to run higher yet, so it is just a starter position, I tend to track them better when a small position is in my account.
I like the set up in MCOA too. Actually – quite a few have decent set ups. Tricky sector though 🙂
Thanks for the heads up on CNAB…I haven’t gotten it yet but watching for sure. What do you think of VNNYF chart? Looks like they just started trading recently…up 2 cents premarket…recent announcement that they’ve had a breakthrough on some research regarding delivery method, time release capsule, etc. and added what sounds like a pretty experienced person to their advisory board…chart looks to me like it could be ready to pop back up to the recent high…what do you think? Only thing is…low volume as of now…..maybe when people start jumping on board that will change quickly….just guessing here….:)
Sorry, I cant read a chart based on only trading for several days. That wont tell you its strength , weaknesses, or personality.
You’d need to trade it based on fundamentals alone – and beware of the accuracy of the data presented.
I am so glad my order finally filled a day ago!
Am having chart trouble this am…on a help line trying to fix. ggggrrrr…. are they up premarket on the good news?
I don’t see any premarket trading in it….lots of the marijuanas don’t move til market opens
Some do trade but what I’ve seen mostly is no movement til open
Same here Tammy , I used to check MCOA , CNBX, EDXC, HEMP, GRNH ( these are ones I’ve owned in the past), and hardly ever saw trading on the ones under $1 premarket .
NDEV CANL, CNBX, and a few others did.
Thanks…yay, I am up $20! lol
Coffee on NANCY!!
But…CNBX looks to be moving premarket….!
Alex, I love these lessons!! Thx so much. As a way of learning is the difference between CDE and NAK sell-off in your thoughts where it closed at eod? breaking the 50dma? All? Something else? The MACD and stoch. look similar (at least to me) Thx!
Hey Deshy, Yes it was a number of things that caused me to look at CDE from day 1 sell off and know that this was not going to rebound without work. The chart itself shows it and …
CDE Closed at the lows on HIGH volume selling. No buyers wanted to come in at those prices. It would seem that Shorts didn’t cover either. Also the drop was due to their earnings report, not a rumor from an outside source. The buyers would probably need to see something encouraging other than “the price just got a lot cheaper’. There is always the idea that future selling may continue . FUNDS often sell in increments. That will take time and the chart needs repair work first.
With NAK, the source was biased from someone that went very heavily short BEFORE releasing the article. He didn’t give real current facts, he didnt prove his case as anything other than opinion ( Though many believed it) , he discussed things from 4 yrs ago or more, past partnerships and assumptions that cost is too much to move forward, but is it?
So when NAK addressed this in the same day – they called the report false and said that they would have more details in a future report. This likely satisfied buyers that the current valuation is based on future prospects and not false hope.
NAK is now positioned with one article bearish from someone that may not know what he is talking about, and 1 article from NAK itself, trying to restate the bullish case. The battle of the BULL & BEARS, and time will tell which one is right. The chart is showing that selling keeps drying up & buying recovers the intraday damage.
super! thx.
So PLEASE do not misunderstand the content of this report. I love reading all of the comments, and hearing ‘traders’ tracking their positions or possible future ‘buys’ or ‘sells’ based on 10 minute, 30 minute, 60 minute charts. Keep up the good work, I do the same, and that is often how I look for an entry…if I see a possible small dip coming on a 60 minute overbought chart with a double top & divergence, I wait for a dip on that time frame to enter a bit lower.
This report is due to the fact that I have newer members signing up all of the time, and at times they may read someones comments saying ” I’m seeing a lot of weakness in GDX over the last few days” – and that comment is from someone that is possibly looking at a 15 minute chart. The newer reader may get concerned – so I get a few emails saying , ” Hey, just wondering if you are selling, people in your comments section are discussing the weakness.” This report can help everyone to get my current bigger picture view and to also understand that others in this comments area are experienced traders , trading at different time frames. if They get a sell signal, it doesn’t mean I got one.
Again, Viewing it in different time frames can be helpful for active traders, and the comments section is full of active traders. Others can and probably do benefit from this conversation, and it is more than welcome here. This report hopefully just helps any newer readers to see the bullishness of precious metals in the bigger picture, and to recognize that some here are looking at shorter term moves.
Newer reader may not have had a chance to read past reports from the entire month of January pointing out my thoughts on this sector, so this report can help get everyone up to speed in that area.
Thanks for the report …i am very very positive today and tomorrow big day for the miner’s :);)
I hope you are correct, seems like a solid conviction, SOLID 🙂
Alex, what do you think of AKG? It is a gold miner in Ghana.
I dont like their chart right now. ( yet)
Alex, an exceptionally helpful report for me, a relative newcomer here. The discussion of the bigger picture view vs. the smaller contexts on the chart is a great point. Also, helpful in relation to this is your discussion in differentiating between weakness and consolidation. Great! Thank you!!
Great Evan, happy to hear that it helps.
At times I realize that I have newer readers here that haven’t had time to go back and read anything that I had written in January. We bought at the December lows here and all through January I have been very bullish, but with the recent sideways move, many are wondering if this is a bad period of weakness, so it needed to updated.
Thanks for being here too : )
Just added a nice chunk of fresh powder to the Accts. Itching to add to existing plays or maybe some new ones… Excited!!
I have tons of fresh powder, but it’s piled up outside my door
Hahahaha, good one CF. My powder is itching to get into something… Just too much to choose from..
So glad I got back into CNBX in my trading acct….up premarket nicely!
PPPP – I own it, released news of stoppage at one of the mines : (
It gapped down and is below the 50sma, so I am going to wait for a bit and watch it. May sell it to simply free up some cash and use it elsewhere. I am not married to this one at all. We were just dating and she seems to be a bit lazy – lol
o brother….. i think i like u better w/ ur rose glasses on …
*smirk
I had a small position here. thanks for letting us know. I just want to know to add on or just sell it. 🙂
I dumped it ( it could recover in time, even later today, but I dont want to wait at this point. Why? If we are breaking out of bull flags, I’ll put this cash somewhere more bullish.
as you know, I have tons of bullet. 🙂 I can wait. Maybe add more when it’s $0.70. only 5000 shares.
Looks like it was the right thing to do so far.
Just got stopped out on that one. Oh well, it frees up cash.
Me too Bob – it is just hanging under the 50sma
and I have better things to do with my funds than hang around : – P
WRN following through on that flag break out
EDIT – Actually, it is just inside of that flags apex still. Needs a tad more UMPH!
Alex, AKG….Ghana gold miner…what do you think?
Wow, how many times did you ask 🙂
I’m just scrolling through again to see if I missed anything. I did answer below and above . I dont like that chart at this point.
I refreshed and now can see you answered. Sorry that I YELLED to get your attention.
Thats ok, I’d expect that from Crystal, she is a school teacher and probably used to some of the kids not paying attention, but an artist? Arent they the silent type 😉
sometimes….lol
u forgot my comment below…. ;o) tehee
You mean like the 1 yesterday asking for a paypal deposit for having a reader say he likes your comments?
Nope _ I ignore yours 🙂
Go CNBX!
lol. Good one…:)
What about EDXC?! They are the ones with the good report! Now I only have a $10 profit and I did not even buy coffee! LOL
Sold my CNBX in trading acct on that move up….still holding in other acct….
It’s now up 100% from where I sold it – lol
Alex, anyone, any thoughts on USLV?
It will follow silver. Chart in the report shows it trying to break above the 200sma
That’s what caught my eye. Thx.
I have tons of uslv. 🙂 My favorite one!
Hey YS, Had tons last year and did well on it. Thinking about taking a bite here as it moves past the 200…
this one made me and burned me. lol. but I still love it.
HI YS, I hate ETN’s come tax time ( long wait for 1099’s ) so I just use AGQ ( ETF ) 2 timer. when I feel froggy in silver.
I hold them mainly in my IRA account. 🙂 and I filed my tax the last minute. but i haven’t filed any tax for ETN yet.
Good thinking, at-a-boy
OWCP hopefully going to break out of that bull flag I see on the 3 and 6 month charts…
Some good volume coming in on VXX. Took a small position.
ALEX! Why won’t you comment? Please….thoughts on AKG Asanko gold in Ghana. Anyone else know of them?
I did comment 1/2 hr ago. my answer was on the first time you asked. I guess you then asked again.
I don’t like the chart .
giggle…
You! Go back to the buffet breakfast and the pool, we are trying to work here! 🙂
lol… i switched resorts… this one pool doesnt open until 10am … what the… i have half a day in by then …
Kinda nippy this morning for the pool?…but that is probably just for us Floridian flat-landers…we are shivering…lol
wow..spoiled.. i sat out in my suit on a towel on a paver BY the pool… w/ my first cup of java…lol started w/ a warmup on…. and slowly shed layers. .the sun is veryyyy warm… brisk air…
I have 18 plants to go put in the ground and have been waiting for a little warming up! Sun is wonderful this morning. Have a fun day.
Actually…That’s how i like it….. Nippy…
Meow
naughty girl
;o)
ABX has happy feet this morn….
Thanks. I did not get the comment. I think I will just reboot…too much problems today with charts and e/g.
With all the second guessing on gold amounting to neutral at best sentiment, I wonder whether we won’t move up $100 in gold in just a few short weeks on the back of a weakening dollar which has now back tested its breakdown and moving lower quite fast.
Sentiment does seem a bit less enthusiastic lately
Thank you Alex for teaching me to have patience (GDXJ) 🙂
Ur welcome – I’m still learning that one myself
Looks like GDXJ expanded the triangle it’s been working in for the last week – at least it’s in the right direction!
https://uploads.disquscdn.com/images/f7705c0df43446998f69e1bfc84ee06c855f90a4921acc9aad62d938f7fb72f0.png
FCX:
Sold…..breaking the 50 sma And the previous low at 15.15.
Small gain…..
WRN seems to be the place to be in copper. All you CF ! 🙂
I have a longer term time frame so I actually bought the break below 15.15. Will be concerned if we break the 14.50 level but definitely out below the December lows. Looking for new highs shortly at least to the 18-20 zone
Yea I did contemplated that 14.50 level Pankef but It’s Not acting correctly imo.
Good luck….
Yeah, FCX dropping below the 50sma, Same thing happened to me with MTL. I sold my MTL for a slight loss , and it popped up 6% this a.m. trying to regain that 50sma. Fickle group.
I still like TGB ( Sold too early) and HBM too, off of the 10 sma seems to be working for them. I don’t know why FCX is stagnant.
Me Either !! lol
Back to the drawing board…..
alex, someone said URRE released sth regarding to the warranty of $0.01. what do you think?
Nat. Gas:
Stopped out -1.5% …. new lower low…..Will try again !!!
CNAB might be trying to break out of a flag? I don’t have it…just watching…
Very light volume..
These MM stocks are crazy !
Double digit moves are normal on a daily basis….I know most are penny stocks but when I pull up the Summary Report my eyes pop…..lol
Trying to get filled on GBLX……..
Filled
I was just looking at that and asking Tammie about it. It is a good set up.
GRNH ? CF
On top of the 50 sma…..
I like it above the 50sma
Which one ? 🙂
Probably both….
GRNH – or do you mean sma or ema? I tend to use the sma if, for example, it is bouncing off of it.
sma GRNH
trying to get filled
One thing that I have found in these MJ stocks if one is just buying a position to hold for a while.
I had one go against me and I had to just hit the bid price to get out of it immediately. It wasn’t a big deal, but these do go 20% one way or the other in a day, so it was like trading JNUG.
Many simply doubled since I did my report on them, and the buy , hold, and forget about it worked rather well Dec through Jan
Accumulating for a longer term hold ……. no stops, all or nothing…… 😉
Honestly, that is what I said until they doubled : )
I just had $600 here, $1000 here, but when they doubled I just thought that I’d cash out and look into them more fundamentally, since my purchases were based strictly on the chart set ups.
It’s funny when you have $600 on 20,000 shares at 3 cents though, and you start thinking, “If this goes to $1.00 – I have $20,000 on a $600 investment! If it goes to $2, I have $40,000. If this goes to $10 in a few yrs!!! : )
That was how the NAK trade was working out, but the swings get CRAZY the higher the price goes .
LOL !!!! I am with ya Brother……
I am looking for one or two to take off as leaders in the sector.
Here is the question: How many do you take the risk with ? That is where Tammie comes into play…Thanks again Tammie !
uvxy 11%! wow
Tammie – off the top of your head, have you heard anything good or interesting about GBLX or MSRT.
I really like the chart for GBLX, and MSRT is trying to hold on to the 50sma with a long consolidation.
GBLX really has the base & upside potential chart-wise. I favor that and will have to do some research on their product or services. Just wondered if you knew anything off the top of your head, since I dont have time to research it right now.
Thx
Yea what he said…..
Since I just got filled in GBLX….. 😉
I own GBLX….waiting for it to move…..it has filed a patent for product for asthma, IBS, arthritis, crohn’s disease, etc…..so am hoping this will be a good one……MSRT seems to be a technology platform where they are giving out info to keep folks educated on what’s going on in the marijuana world….people can load content they discover, keeping up with legislation, etc. ….I’ve been looking at the chart but haven’t traded that one yet – just watching
Also waiting for OWCP to pop out of that flag…..
Thanks tammie….
Oh, GBLX also received certificate to move ahead with their 28k sq ft facility that they have….to grow cannabis….using grow lights….at capacity it can have 1000 grow lights and 4000 plants…
I think the facility is already existing…..they don’t have to build….
MRST Tammie ?
MSRT….tech platform to share information….watching the chart…but haven’t jumped on it since I’ve kind of gone for the ones that have a medical product….but the sharing of information on different strains, legislation, etc. will become more and more important going forward…so…..keeping an eye on it..
sorry i made you retype …..
LOL that’s ok…..it’ll help me remember MSRT hahaha…..think it, speak it, write it….remember it 😛
CNBX seems to be so strong to me…I sold in my trading acct. and one retirement account…holding in another acct…but man, I might wish I had held on longer….just doesn’t seem to want to stop….I will get it again on a pullback for sure….assuming all good news on it..
Agree…seems overbought presently.
Woa…THAT sounds good !
Yeah, especially since they have their own product, patent pending, for the inflammatory diseases…they’ll be able to use their own product instead of source from someone else…
Very Positive ay ? 🙂
Seems like it to me…..:) I know all the marijuana companies out there won’t make it….but….some will…it’s just figuring out the right ones….:)
REFG looks good too…..imo
I would buy CDE here – bloody – time to buy it.
Sorry about the NAK news – I think the class action suit news
will scare away any new investors. Lawsuits take years.
I am also going to give CDE a shot here….tight leash though.
Thanks Seer…..
where did you find NAK class action news?
I saw it Tuesday night, after that report.
Lawyers love to jump on these things & often times are working with the one that writes the report, to try to get a deeper sell off as they are short.
Just came in from planting flowers and saw See’rs note…first I heard of it….I baled out….took MORE profit. NAK was best trade for me since I have been with you for a year, maybe best ever! Certainly the most interesting. I went in/out many times and took profits 6 times. Big smiley face here!
Me too – awesome run for months and I traded at the tops and re-entered which just kept increasing my amount of shares held.
Now we need to find another stairway to heaven like that one was : )
Thats why we Pay you the big bucks for !!!! No pressure… 😉
Time for a ski….blue bird day today…….
Like that stairway to heaven!!! I have watched miners (off and on) and gold/silver (decades) for awhile.
These are not free markets. I think the deep manipulation is showing “they” are going to really rally up and are trying to disguise their accumulation – run or hold miners down as they buy from weak hands – and, I may sell all after the chart wave 3 or 5 up highs and watch and study for awhile . . . . Really been nails on a chalkboard this year . . . . slow rise up and some knock downs . . . .
Man, I thought it was new, as I just saw it. Either way, the music has come to stop with the one. Of course, I was still standing, no chair. But I’ll leave with a hefty profit from trading in and around this one still.
On my iphone stock list when I highlight NAK and scan over to the news page for
it. Multiple news stories out about the class action suit AGAINST NAK. I would sell . . . .
I did so …see below….I had just come in from my garden and saw your post and jumped right on it….so thanks for posting the news. I caught it just as the waterfall was starting.
Whew!!! We watch out for each other here!!
Much appreciated.
I agree with you about the manipulation. I have invested in stocks for many years [now I am trading more] and we are really now a casino. The little guy has the deck stacked against him here just like in Vegas. Alex has been a great help to me to somewhat even the odds. We deal with the computer algorythms [sp?]…they buy in fractions of a cent and in fractions of a second…and we can’t. We have big money manipulating the markets [particularly metals…law punished them lots of $$$ fines recently and they are at it again in my opinion.] And we have our stops visible so big money can run them and knock us out of our positions!
SOLD MY WRN for a good profit. FLAG shown in the report is just starting to break the lower trendline by 1 cent, but I will take the profit for now.
Forgot the chart -refresh
I’m still bullish longer term and this MIGHT NOT sell off, but I’m taking profits
https://uploads.disquscdn.com/images/6c2a0ba37b7f587f832ffbddfea4351a3dbc0a010745d5cfc9bcd8199a75db7f.jpg
Yea Agree…..very nice trade CF !
Alex, what do you think of AGTK chart? Tiny .03 stock…marijuana..been consolidating since November….was .075 back then….just creeping above the 50 dma…announced purchase of 80 acres in Colorado, hoping to cultivate to supply dispensaries all over the state…..not sure how profitable the farming companies will be, haven’t researched details…..but the chart might be ready….?
They all have similar charts, huh? The HUGE run up around the election, and then a long consolidation process.
So the chart looks the same as the others, but I look for them to be above the 50sma , it is a nice set up and if it gets back over the 50sma and starts to run, it can do what the others have, return to Nov highs.
Alex. Any thoughts on URRE here?
URRE – refresh.
I dont think that it is bearish, but it also depends on where you got in and what you can accept for movement, because it is moving around. It could be forming an inverse H&S. I’m holding , but I’m giving back profit . One could sell and just see how it acts going forward.
Will it hold the 50sma? Will it stay above the 10sma?
I’m still in it for now.
https://uploads.disquscdn.com/images/31891b285bd034c3712770c97c071ed3628a3365bd8e4ced498899678ed098e3.jpg
Thanks Alex. I’m holding for now too although it’s putting a big dent in the port. I road it from 2.11 up to 2.64 and now back down again.
yeah, I’d like to see it hold ( or close back above ) the 10sma.
Crap. Stopped out for a loss after seeing a nice gain 2 days ago.
Looks like it may tag that 50sma again : (
Kind of turns a great short term trade into an average gain if I sell here. I still think I may just hold for the long term and see if this takes off in a few days, weeks,
CNBX just wow
ABX (6.8%) and Goldcorp (4.9%) nice pop- GDX a little lethargic in comparison. Copper coming off- which may have been part of the impetus for silver strength late last week. I wonder if the moves above 1240 gold and $18 silver hold.
Feels mixed to me on metals- in spite of big weakness in USD
I admit that after the precious metals held up so nicely with the USD rising for 7 or 8 days,
and then through 2 Yellen days, I thought that when the USD dropped – they’d take off pretty swiftly.
$4 billion mixed shelf offering for ABX. It topped around $20.70. Let’s see how much it gives back. Given ABX focus on debt reduction, would seem a good chunk of this could be equity.
Maybe building support below recent high, before making a run at it?
great report
THX RG
THM:
Added……
WHOA there!! I thought you hated this one lol
Uhhh really ….. lol…..I have held this one for a while.,,, 🙂
Alaskan miner…..with good ground imo
Maybe it wasnt u lol…. I have a love hate with it, but still holding..
Well we are in the same boat matie……. 😉
I’m in that boat too. In the red still.
FFMGF, pretty weekly chart, rounding bottom. needs volume
nice- never heard of it. Good chart.
USAS too, weekly chart…complex IHS https://uploads.disquscdn.com/images/535482d15442611edd0793104adf7071d9b703feee37ebc5045fd3eb49f3d973.png
Sold URRE at 2.08 for a small loss.
The MACD is curling down a bit more today, so it could be weakening, but I’m still watching that 10sma. I’d like to see a small inverse H&S form on a 1 day chart. I have a relatively small position, so I’m holding for a bit longer.
I’ll exit if it gets down to my buy price, such a nice run last week. I Coulda woulda shoulda sold the rally
Im looking at APRI… Anyone got any opinions on this one? I got some powder burning a hole in my pocket.. I like the chart alot…
would someone please break the glass ceiling at $1 for GSS? That is one steep ascending triangle!
I’m still banging the table on HMY, looks like it is starting to move.
Going to grab lunch all, so if I miss a question ( Nancy : ) – Please don’t yell at me – lol
J/k Nancy
OKAY!!![lol]
https://uploads.disquscdn.com/images/0fa802cfb991aef855abb3dd9b13f2c8273e14570030daf2f8e54850d7b24064.png
Not one to play BIOs often, but Im really diggin this chart… Any thoughts out there ?
spotted this morning and took a position. good eye BayTrader 🙂
I was in LABU and sold Tues. Still like bio’s here, but I was up on a leveraged play and simply wanted to ensure I kept the profit! I would trade back in on a pullback. I have only been following ETF recently though.
It’s a good chart, but the Biotechs and Pharma can do whatever they want if they fail a trial, FDC frowns on a side effect, etc – so be careful how you load up.
Nice chart though
Oh wow,, Alex’s CNAB took off!! Wish I’d gotten in earlier today!
As I was going to lunch, my CNAB just broke out and some good volume pouring in. Not sure why, but it is a good looking break out.
haha! Just posted same time you did…I just saw that….!!
boom! wait til you get back from lunch!
Yes, I see that it made it to $1.86 while I was out. And the volume finally came in a bit more too.
So, i.e. I am starting to see a pattern development where the “cabal manipulators” are taking down heavily some top runners. They hit AG, then hit CDE and hit NAK . . . . TRX is being held back . . . so we have to be careful in our trades. Any favorites seem to get hit . . . I believe they have infiltrated the blogs and are watching and planning more hits . . . just a thought in this pattern development. This did not happen in the past like it is today . . .
Or this may be a case where the market is telling us something and has nothing to do with manipulation
I don’t think so
I posted this in yesterday’s comments section but want to post here as well. Alex correctly pointed out that some readers got the wrong idea yesterday when I said GDXJ was “weak.” I should have explained I was just talking about it trading sideways since Feb 6th … but it is still BULLISH on my weekly and monthly charts so I’m staying 100% invested in miners. I will be much more careful in the future with my comments. I watch the daily action to make sure it’s still acting the way I expect, and sometimes it’s frustrating to see sideways chop rather than a steady chug higher. But I use my daily, weekly and monthly charts to look at the overall trend and not let the daily “wiggles” scare me out of my positions. I will avoid commenting on the daily “wiggles” in the future so as not to confuse people. Occasionally, when I see a “buying opp” on a daily dip I will post it as a “heads up” for those who may be interested.
We get it Steve. I did a test of GDX last year v individual miners. I don’t trade GDX any longer as it rose much less v buying individually. GDX and GDXJ are great if you want a group. GDXJ will usually show a trend change first, too.
I don’t know how you said all of that, with GDX & GDXJ making slower gains, without using the tern NUGT or JNUG in there : )
Actually , some individual Miners beating NUGT today %-wise. Those juniors
TKRFF, SGSVF, SA, HMY, BCEKF ( off of the 50sma) , AXU, SAND. All up more than JNUG as I write, not sure about later.
don’t forget FFMGF mentioned by littletimeleft earlier
Thanks for the reminder, Fred – I want that on my list and forgot to add it.
Hey Steve,
I dont think you need to be more careful, it really isnt the way that you said anything, it was just the way it was read 🙂
I have had newer sign ups at the end of January and into February –
they didnt have time to go over past reports and see my bigger picture
view, so they may see posts in here and think that we are all watching
the same thing. If you said you got a daily sell and GDX is weak…and they think you
and I are looking at the same things, they then want to sell. : )
I personally think that some here want you to post what you are seeing the way you have, because of the way you have things set up for the shorter time frame. They may be leveraged and will trade off of your ideas as you post if you get a sell in a shorter time frame.
I just wanted to clarify ( And kind of did in the report) that I’m not trading based on buy & sell at smaller time levels, and wanted to show the bull flags to my newer readers. The reason I would feel I might need to do that is because if I even get 2 or 3 emails saying ” Can you explain why we arent selling if others are getting a daily sell signal and saying it is weak?” – Or – “So and so said the USD looks very strong, it has gone up for 5 straight days, and they think it is very bullish, shouldn’t we sell?” Then I know that there just has to be more than those 2 readers wondering the same thing, but they may not have read my reports from even 2 weeks ago or beyond since they are new.
Do what you do best, I know others here are enjoying all of the various methods of trading entertained here.
OK … here’s an update. Yesterday some may have been nervous when I mentioned that I was seeing some “sell” signals on my daily chart for GDXJ (and JNUG). Those are red flags but not a clear signal to “sell now!” for me. I watch multiple signals on my charts and I don’t post charts here because it’s hard to explain how I analyze different signals in different time frames because it’s a combination of several factors and “feel.” I leave the charts to Alex the “ChartFreak.” Anyway, some of those “sell” (down) signals on my daily chart are now flipping to a “buy” (UP trend) today … as I expected they would based on my longer term charts, weekly and monthly. So GDJX (and JNUG) continues to be very BULLISH as you can see by today’s rally.
Thx, and I believe that you even said that you were not selling, so they were obviously not lined up with other things that you were probably watching.
Check out GG and ABX . Boom!
Yes – I do appreciate all of your input and know that you could be looking at different time frames…..I like you mentioning what you are seeing on short term time frames as well as long – it’s very informative. 🙂
I disagree…..I think we Need more charts shown here on a daily basis mainly because I am “visual”. Start with the longer term charts and go from there.
So Throw some charts up Steve and that goes for you to Y S !! 😉
OK, to give you an idea, here is my daily chart of JNUG: http://stockcharts.com/h-sc/ui?s=JNUG&p=D&yr=0&mn=6&dy=0&id=p06644306992&a=336033591
You’ll notice I use multiple MA’s, and multiple signals. It’s a combination of factors that I look at. As I mentioned previously, I like to watch the cross of the 9 EMA and 10 SMA as a signal of a trend change. It’s not perfect and can give some false signals so it takes experience to know when to worry about it. Yesterday, there was starting to be a bearish cross of the 9 EMA above the 10 SMA so that told me to keep an eye out for a further drop today. Also I like the TSI short term and long term. You can see that the short term TSI has been a “sell” since Feb 9 (black line below the red line) but in an UP trend on the longer term TSI, so that keeps me bullish for now. Another short term signal is the RSI 5 with a 10 EMA average. When the RSI cross above the 10 EMA (as it did today) that is bullish short term. The longer term RSI 14 also had a bullish cross above the 10 EMA today. So I look at mix of signals, some of them conflicting, and make a decision based on a couple year’s experience watching the charts as to which signals I will “believe” at any point in time. Like I said, the charts are not nearly as clear cut and easy to understand as Alex’s charts because of the many possible conflicting signals. Also, notice that I drew a channel and I was watching JNUG consistently make higher highs and higher lows within the channel. It broke out of the channel on Feb 6 and is now back to a similar choppy pattern with higher lows. I’d like to see the Feb 8 high of $13.03 equaled or taken out soon. So there is a lot of stuff going on in each of my charts and rather than try to explain every single thing I’m looking at I just say, “xxx is a buy right now” to keep it simple. Hope this gives everyone an idea of the kind of stuff I look at.
Looks good Steve – Thx
huge for some reason, I had to shrink it down a bit 🙂
I use very big charts because I have lots of MA’s and stuff on them. They are 1600 pixels wide and I have to scroll down a few pages to the bottom. I made a small copy of the top PART of my chart so you can see the TSI and RIS but hard to see unless you zoom in. I just figured out how to upload the copy.
https://uploads.disquscdn.com/images/27ad0d07634c07b88cd3e5e5c6acf9e330af1dcee857df3e18a97677b2b97fd7.png
studying…..
You’ll need a users manual and a pilots license to fly it …not included – lol
lol
That was good, I can click on it and it is good size, thanks
oh i like the RSI 5 w/ the 10 ema….i use the rsi 5 consistently.
Here is a full size (1600 pixel wide) copy of the top of the chart so you can see the MA’s better. https://uploads.disquscdn.com/images/06a271c32cb5268bc96e4c3d6c049623a53c63f043f5255e2948b931e04286d2.png
Dude, that’s a busy chart. Thanks for taking time to explain!
lol just the opposite for me had to enlarge it
Very nice Steve….. I am certainly going to play with the RSI’s w/ 10 ema’s.
Thank you good sir…..
Do Not “keep it simple” !! When you get a signal not only let us know but throw up the chart too….Good stuff !
Yeah, that’s a new technique to me as well, gonna have try give that a try.
As an artist, I am def. visual….so I like to see your charts too!
Thanks for the reminder to keep things in perspective time wise – it’s a good reminder to me. I love reading everyone’s take on things as the charts change and unfold – so many experienced traders on here that I have been learning a lot from…especially CF. 🙂
Please do continue to comment on daily’s from your system steve
Hi Steve,
As an inexperienced investor, I appreciate your comments a lot. You told everyone you’re all in already. That’s actually what I would like to hear.:) I asked Alex the same thing. For me, a coward, I’m only 30% in :). maybe I should take this chance to go all in. 🙂 Last December, some comments really scared me off. I’ve learned my lesson. 🙂 actually I have the same idea as you, only love GDX, GDXJ, NUGT and JNUG. 🙂
Yeah, I was following all that yesterday. I stated that I was disappointed as compared to what I had hoped for in 2nd DCL. And stand by that but like you also said I’m not selling. I will sell or roll out and up options, but that’s completely different due to the time nature.
looks bullish to me not too sure about the fundamentals https://uploads.disquscdn.com/images/d58d91b54c0dc7f0e2de553b84e4682b450825a4c4cbc2905a463c27b57ac656.png
Yowser
Be careful on ETRM. My buddy in another MOMO group, they play this one all the time. It spikes HARD and drops jsut as fast. Its like DRYS.
I just saw that it did a 1:70 reverse split a little over a month ago. Yowser on that too, but like drys ships – it could pop in either direction. A gamble maybe. ( I’m staying away, by the way)
Meaning you agree?
Check out ABX and GG – Shouldnt GDX be ripping higher?
agreed alex, a bit strange…the only one of the 10 ten holdings that is down more than 4% is AEM, earnings miss yesterday. small miners have been much stronger since the beginning of the year (GDX up 38%, GDXJ up 57%). being we are in the 2nd run in this new bull market maybe folks are looking for more bargains?
Yes, and even that has dropped and put in what looks like a reversal candle so far. Maybe tomorrow GDX will break out sharply, but with GG & ABX like that, I expected the same in GDX. They are bigger holdings & NEM is up.
MNTR….they invest in marijuana companies….keeps going up….someone here brought it up several days ago….baytrader? lechiffre? I can’t remember who….it just keeps climbing….I didn’t get any…just watching it for now….sure is soaring…!
CNBX I missed it….it was a buy at the BO at 1.76 grrrr
Yeah, wish I hadn’t sold in my trading acct this morning….wow! Still have in another account….but wow it’s up some .30 since I told it earlier today
REFRESH – It wasn’t a buy at $1.76, it was a buy at 0.72 , when I had it in my report : (
If I knew then what I know now : )
https://uploads.disquscdn.com/images/956f617ec0480b1a2efe7ddd186f3fb94bca6ad1631a08329558a6f0b5feea7c.jpg
Geez…..your right Two opportunities squandered. grrr
Yeah, but they’re all forming the same pattern, it’s weird. They shot to the moon around the elections, drop & base out and then take off back to highs or better,
CNBX , CBIS, CNAB ( tomorrow : ) GBLX ( tomorrow) : ) NWGFF, NDEV,
.
BLOZF (Cannabix Technologies) – never have any news items pop up so I went to look up the company to see what they do….because the stock is up 9% today…….they are a tech company developing tools for law enforcement and workplace to detect THC in the breath…..so any of you folks out there eating the brownies better look out…:) 🙂
investorshub spammed this one again this morning tammie, they started around the 1st of the year as i recall
What do you mean spammed this one again? Sorry for my ignorance….:)
email = spam,
https://uploads.disquscdn.com/images/cafd10fdc8f4764ba9bc73f0f0c8ec38328d4b8976400e82bb1f82fed0bbf369.png
ah I see 🙂
Alex….I went to the website for CNAB…..they have patent pending medicinals (that are already being used), looks like they have quite a product line that is used for a number of different conditions…a whole program where they educate you, get nursing support, on site visitations, managing medical records, etc. – I wonder if someone has news of patents that are about to be given since there is movement now in the stock price….just speculation on my part….I did jump into this after it had gone up some…and it’s up even since then a bit…
Yea I want a piece of this one….soon ! 😉
Tomorrows winners are going to be NWGFF and GBLX – I CALL IT : )
lol…..
Lol… Shotgun!
MNTR today. So gud.
did i hear someone stutter my name in vain?
lol
hi Ken! 🙂
Where have you been SOG ? Geez been missing you…… 😉
ive been influenzad up for past coupla weeks..
prior to that, been trying to perfect my magic indicators, and develop some better system for exiting, than the ‘non-system’ which ive been using previously.
fed up of riding stuff up & down…. might be exciting on a day at the fairground, but no fun when i lose all my profits.
… orrr … even worse.. ride it down without ever having had any profits
That flu has been crazy bad, hope your feeling much better.
Thx Alex.. got my first decent nights’s sleep in ages, last night.
think the worst is over.
I know a few that have had it and they were flat out , beaten up. Glad you’re on the mend!
Aww.. Sorry sog
hiyaM.
you out there in the sun for much longer?
about a week more…. fastest month of my life… dang… 🙁
i will CERTAINLY have a reEntry problem… ;o)
The flu is the worse sorry to hear it…..
May I suggest using the PSAR indicator for a trailing stop….as long as it is below Price….just a thought, I use on occasion.
ta K..
it might be a useful confirmation of the indis im working with.
i’ll experiment a little
Cool…let me know if it works for you ……
Hey SOG! I’ve been wondering about you! Glad you are feeling better!
thx Tommy 😉
🙂
Glad you are back! Hope you are all recovered.
You could use my technique. What for a huge emotional response either up on down and then get a market order ready, close eyes, breathe slow, count to 10 and randomly click sell when ready!
Holy sh!t. Where you been hiding? I was afraid the MPs took all of your shiny to pay for BREXIT!
hi Cas
So it was you that brought up MNTR….I couldn’t remember!
I tried to buy this maybe 8 days ago? I couldn’t get in at my limit price. Never owned it and away it goes
How many of these things can you own, right? Kind of risky to load up, but …
NWGFF is setting up to break out tomorrow. I read their story – they seem legit in Washington.
CNAB is TAKING OFF- I sold my CNBX way too early – with only a 60% gain. That sounds odd, ‘only’ , but it has moved 100+% higher since I sold it! These can be little rockets, BUT DO NOT GO TOO HEAVY IF YOU TAKE A POSITION. THEY GO IN BOTH DIRECTIONS JUST AS FAST.
and I do also like GBLX set up.
I will do a small report tomorrow morning, and these will be in there ( With a Big Fat Disclaimer again) 😉
I am with you. Current holdings for me:
GBLX
EDXC
GRNH
REFG
EDXC actually did a nice bullish reversal off of the 50sma, after selling off this morning.
I own it, so I watched it dip down and then close up.
GBLX also had a nice afternoon.
I have: OWCP GBLX CBIS CVSI CNAB ACOL EDXC…..had CNBX but it was too tempting and sold all today….will get back in if it drops back….
oh and SING…I forgot about it
SING ? What the ?? Don’t have that one…
Take a look at a day 10 chart on this one…?
I am catching up to you Tammie !! 🙂
Wow gurl! You like that MJ stuff! I only just recently got on board with the doggie story EDXC so I have missed most of the fun. Well done.
Oh, there is tons of fun yet to be had, you’re not too late! 🙂
Yeah, she’s pretty much been high since December. I bet her monthly bill just for Doritos is astronomical!
https://uploads.disquscdn.com/images/64a959c0a6f3eb9ba7fe8b339df17e31e3c8e212f2529c75bf1cd40477b75430.png
More my item too…sweet snacks not salty! LOL
Both! hahahaha
https://uploads.disquscdn.com/images/aa5bb2f91641aa50444c1b7790a6ca61429e058642b94e4efa3a02750be2dd0f.png
Did you guy NWGFF or GBLX today or waiting til tomorrow?
I own them
EDXC from way back, CNAB from yesterday and added today, NWGFF & GBLX today.
Thats enough for me for now : )
I would love to know what you think of the ACOL chart…..and SRNA…SRNA trying to recover the 50 day…
Patience is a virtue. When you look at what GG and ABX did off of their flags today.
Hope many others follow the leaders!
For sure
😉
Well, not concerned with my miners although most move down or sideways for me today… I am looking to some new tickers to my book but with so many miners and a few other sectors taking off, I cant seem to decide. I feel like a big kid at baskinrobbins with no employees around… i just dont know where to start… I guess its a good problem to have… Any Ideas? Throw em my way! Ive got today and tomorrow off, so Ive got all the time in the world to play with some charts!
I will put a couple in the report tomorrow, that look set up to go higher. For example : EGO, SAND, EXK, BTG, HMY, they look like they want to move higher. They are not extended, have bull flagged a bit , they just need a push.
GSS VGZ – flat tops
No love for THM ? dang it …….
I like it on the 50sma, and I still own TRX, but they are just lagging and not adding to the party yet.
I do like them. I was going to mention SA a few days back, but it just keeps going, so I feel we missed that. It is moving like HMY.
I did some inquiry into TRX behind the curtain . . . see what comes back . . .
do tell. I love TRX. Got in a tad early so right below break even but I have been adding.. Just waiting for this guy to kick it up and catch up..
Ditto. And yes, please do tell Seer (love the name) …
I’ll be interested to hear any info too…In TRX, still red , but almost green.
It sucks almost as bad as TRX!!
Add XRA to those. It has a nice look.
Im holding all of these in my IRA lol.
great, thanks Alex. Good question Bay Trader. I’m in the same boat…
SAND has been under performing the rest of my portfolio. Still up on it, but need her to get a move on. BTG has been on beast mode.
There are Bulls and there are Bears behind each story, right?
http://seekingalpha.com/article/4045976-bought-back-shares-northern-dynasty
Such a tough call on this thing. Great potential ! Just tell me it is “permitable”. (i dont think that is a word lol)
lol
It’s probably as good as permissible? 🙂
lol true
Does anyone remember when I recommended this?
It was a good set up, but it slowly moved higher and continued to build a rounding base. Check it out today, I think it is ready to fly.
https://uploads.disquscdn.com/images/1a1c70c98a99dcbc673a859db3060f48422916bc3c0787c700a99fb13614406d.jpg
Don’t remember when but yes I do remember you putting it out there…
It stuck with me cause I liked the name 🙂
I was actually going to take that trade, because that furst run up was so relentless, and didn’t for some reason.
They announced earnings and it kind of crashed down this morning, and then ramped up. I think this goes higher.
GMO is another that I wanted to get and missed.
So many trades, so little time
So true…
Just looked at the 1 and 3 month daily charts on CLD. Quite the bullish engulfing candle on those…
GMO looks like it is in a Wave 5 of 1.
Dude, I’d have to have $2M and the ability to monitor 70 positions to take all of these trades. #Overload
I have to say that I am pretty damn happy since joining this team. Im still apart of a MOMO trading group that nails a ton of massive breakout plays as they’re happening, but its getting too tiring trying to keep up. Since joining CF, my IRA acct has been more than happy.
Im currently stuck in one play that seems to be giving me the hardest time – PLUG. Been in since late December at 1.40 when I thought we found bottom and it broke above the 50. Hadnt looked at that acct in quite sometime until recently and the thing had fallen all the way to .85 – its bounced back on what I can see as some “so-so” news with USPS, but aside from this bag, im pretty stoked on being here. I could have sworn I set a stop at 1.20 but I guess I didnt…
Anyway – So much insight here and what appears to be much more TA than spotting these low float runners, I love it.
Now if PLUG would just get me back to break even, Ill be a happy camper. Currently back above the 20sma and 13ema but the 50 seems so far off even though its only a few cents shy…
cant win em all
Thx Bay
And PLUG actually looks like it could be getting ready to go higher again. A little consolidation like a flag forming right now. Hope it works out for you.
WOA! Look at the slam down on CNBX after hours….? Am I seeing that right?? So glad I sold all today even in my retirement account….
Down how much ?
Ok, wow, it went down .79 and now it’s back up .93…wild!
Or….maybe there is something wrong with ameritrade and that slam down to .79 didn’t really happen…..?
Ok, I went to after hours trading and it does look like it slammed down by .79,….my Ameritrade showed that but then went back to showing what it did for the day today…up .91….so…..looks like it is down…..might be good time to get again in morning if conditions are ripe….!
I’m not seeing it.
go to nasdaq after hours trading….
CNAB is also down after hours……11 cents….but these after hours figures are always…..iffy…since things can change so much by in morning…..profit taking…..then folks could start piling in again….never know…
THEN YOU HAVE TO YELL IN ALL CAPS Miss Maria! LOL
TOPS, low floater, moving AH pretty nicely
Regular hrs too, it has a SUPERLONG base ( looks like a canoe ) and busted higher by 37%. Great looking chart.
CBIS….not sure what the long red tails mean sometimes (besides just the low price that was hit), I’m sure some of you folks on here would know….it had two long red candles on 2/9….reaching way down….it seems when I see these that price usually (not always…) wants to drop to that level….since that time CBIS has fallen….and fallen….I’ve been waiting for it to come up…today it hit the bottom of the lowest long red tail from 2/9…. .106 so I’m hoping maybe now it will reverse back up…if it doesn’t then I’ll be selling….I think they have a good product but I can wait and watch from the sidelines if need be – anyone have any insight on these long red tails that appear sometimes?
Hello everyone. I found some positive NAK news and the rebuttal is due out premarket in the A.M. Take care! 🙂 http://www.streetinsider.com/dr/news.php?id=12559754&gfv=1
I sure hope so. Would be good to get out this tranche at even so it doesn’t eat into my previous (and very large!!) profits.
That’s the stuff .
Thanx Johnny
Thanks again! Read that one as soon as you posted! If we get a pop tomorrow, though I’m gonna sell and sit on the sidelines and watch for a bit.
Reading market updates tonight, 1 theme I keep hearing is inflation readings coming in higher than expected from both US and China data.
Gold appears to be following dollar lockstep. Would like to see it decouple and outperform a bit like 2016, that would be awesome. One more 2nd cycle breakout to 2017 highs would do my account just right!!
I posted a positive NAK story below too, earlier today. A different one.
I’ve been saying all along- 2 sides to every story and the one I read that was negative was not backed by fact.
Time will tell
307 comments, wow! Wait, now it’s 308. And it’s not just a bunch of Maria .gifs either!
323!
dang… still watchn TRX repeat that pattern … HMMMMMMMM …..
https://www.tradingview.com/x/QakD7qdt/
I’m stealing this for tomorrows report. I like this one. Thx in advance
WOW
That’s deceiving, that would be a triple from its current price!
Thanks!
More like dang watching TRX bore me to death while losing money…
He better be paying you royalty for all your hard work! 🙂
Go back and check out USD last Feb/March and tell me you don’t see the exact same pattern as now?! If that’s the case then guess what’s next??
*F5*
https://uploads.disquscdn.com/images/1f42717a1e738e5090d9bbe1458702bb89ece331024a705963a7f92c71039e47.png
The rebuttal.
http://finance.yahoo.com/news/northern-dynasty-refutes-short-seller-120000322.html;_ylc=X1MDMTE5Nzc4NDE4NQRfZXgDMQRfeXJpZAM0aWNycTRoY2FkcHVhBGcDZFhWcFpEeHVjejR5WTJObVl6ZzBOQzAzT1RjMkxUTTRNMkl0T1RNMk1TMDFOMkU0TnpOaFpqY3lOVFE4Wm1sbGJHUStibVJ0TG5SdgRsYW5nA2VuLVVTBG9yaWdfbGFuZwNlbgRvcmlnX3JlZ2lvbgNBUgRwb3MDMARyZWdpb24DVVMEc3ltYm9sA05ETS5UTw–?.tsrc=applewf
I POSTED A NEW REPORT, BUT FOR SOME REASON THE EMAIL ALERT HASN’T TRIGGERED YET