
Thursday January 19th- I Don’t Think So
I’m looking at the General markets and I’m rather neutral going into the U.S. inauguration. The Markets rallied very strongly when Trump was announced the winner of the U.S. elections in November, so they could break higher and rally again, but let me point out a couple of bearish signs now.
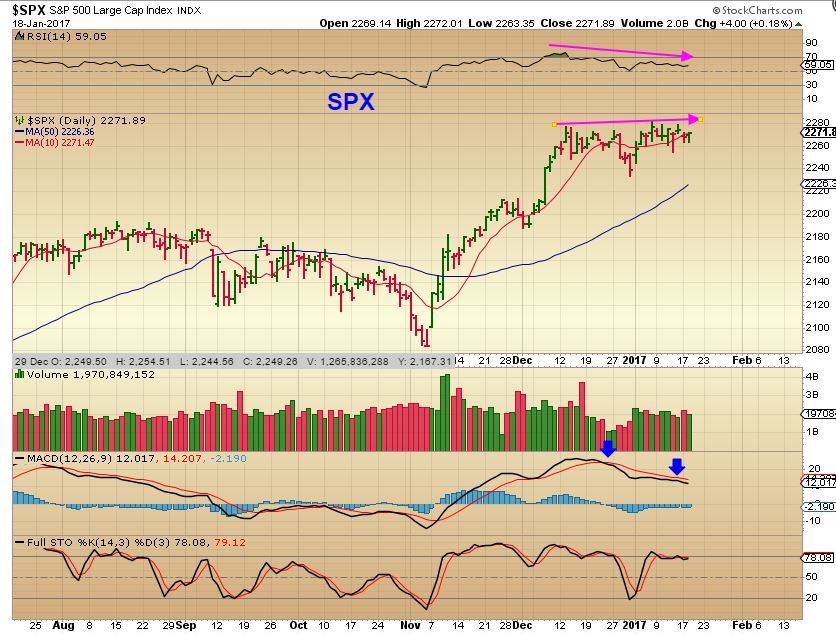
1. The indicators are divergent in the above SPX chart.
2. The VIX is still quite low (although it is now at 14 and no longer at 11)
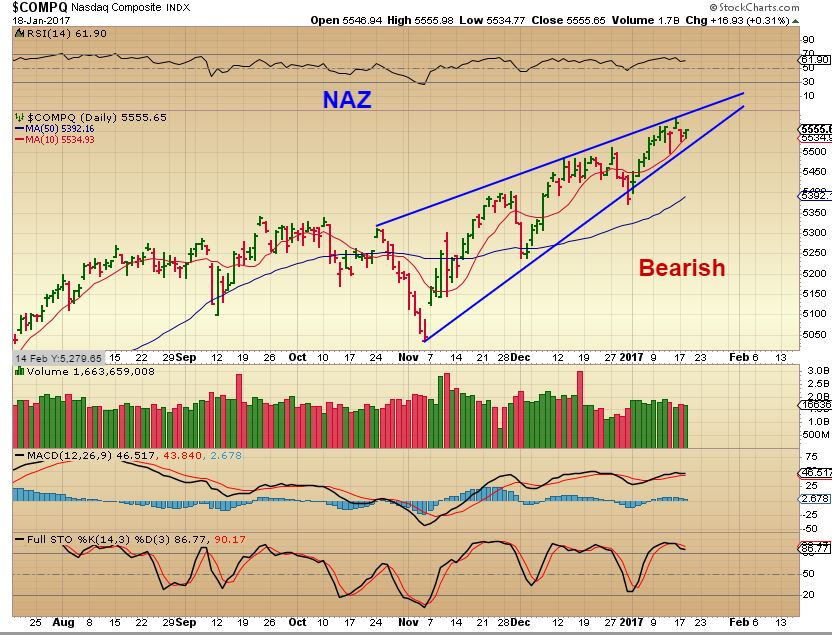
3. The Nasdaq chart below
NASDAQ – I see a bearish Rising wedge.
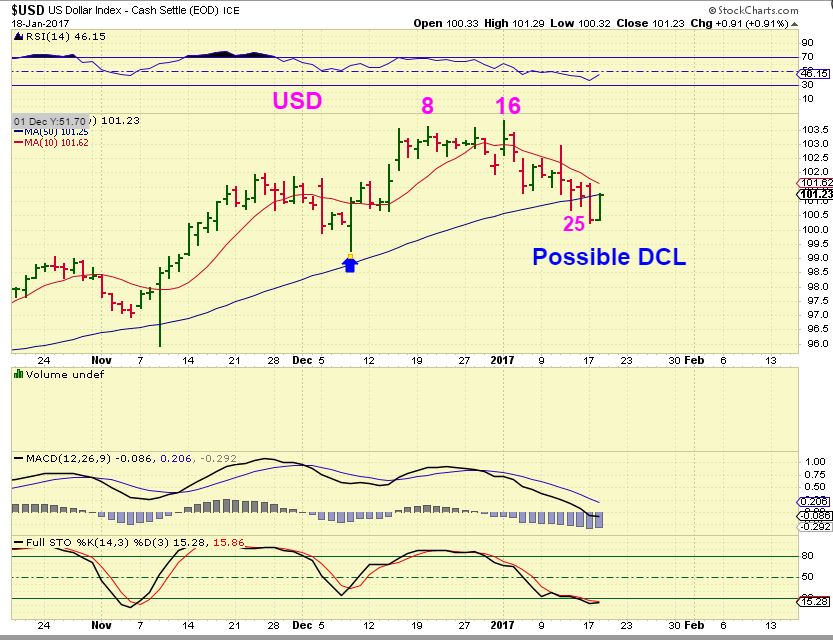
USD – It is possible that we will get a bounce in the USD now, but I expect it to roll over into an ICL drop. In Fact, the USD is at short term resistance too.
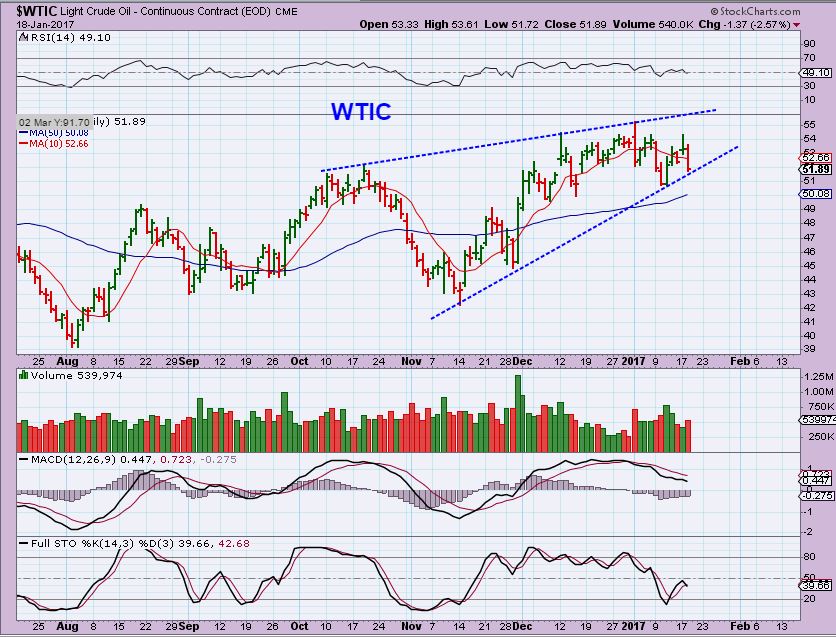
WTIC – Oil took a hit Wednesday, but the XLE and many energy stocks still seem ok so far. NOTE: I am not invested in any energy stocks right now.
IS GOLD ABOUT TO MELT DOWN? I DOUBT IT.
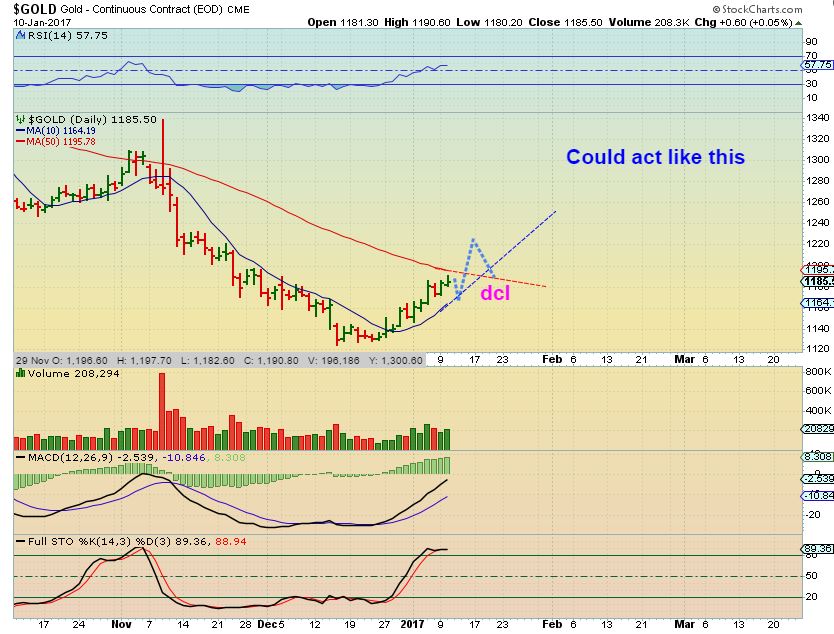
GOLD – This was Jan 10th and I gave a couple of possible ideas of how I could picture Gold playing out. This showed a break above the 50sma for a couple of days, and then a drop to back test it for the dcl. Here I showed a run to $1220ish, and then a dip.
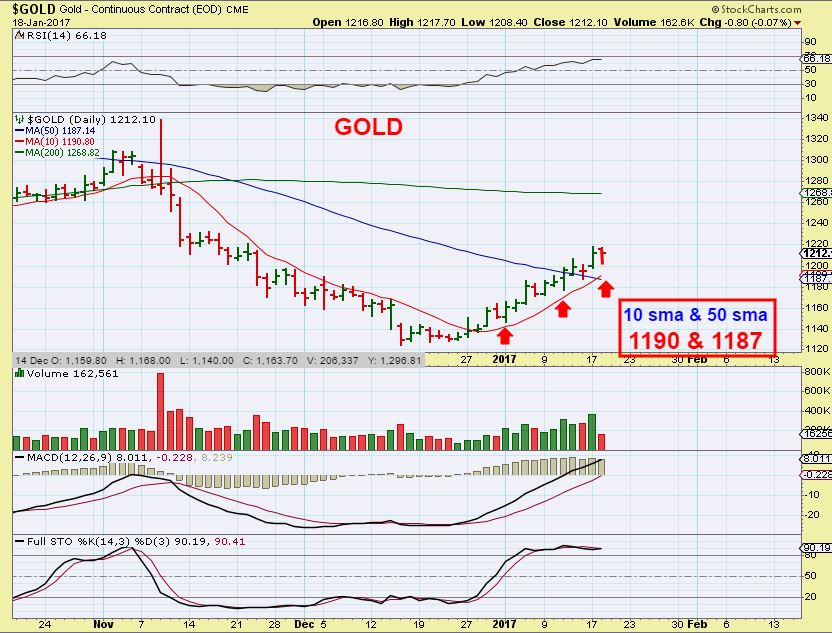
GOLD DAY 21 – We ran to $1220ish, and are we starting to dip? Listed are the numbers of the current potential target areas ( 10 & 50sma) if it continues. I WOULDN’T BE SURPRISED if we just tag the 10sma and continue higher. WHY?
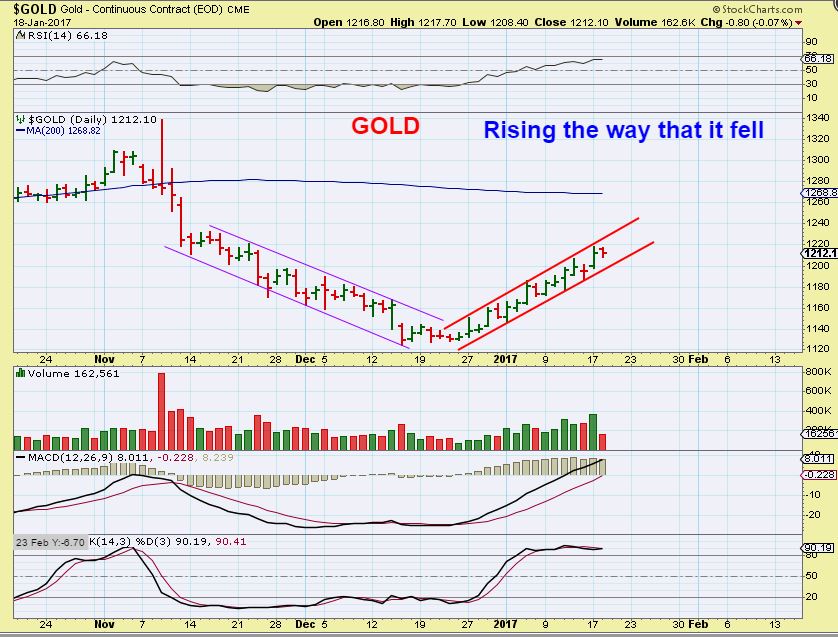
GOLD – Notice Gold here just steadily rising in the manner that it fell. Also note that so far we see an occasional 1 day drop and then it continued higher. I don’t see 2 down days in a row since the vertical climb began. Thursday will let us know if that has changed. If we open down and close higher, this channel has held.
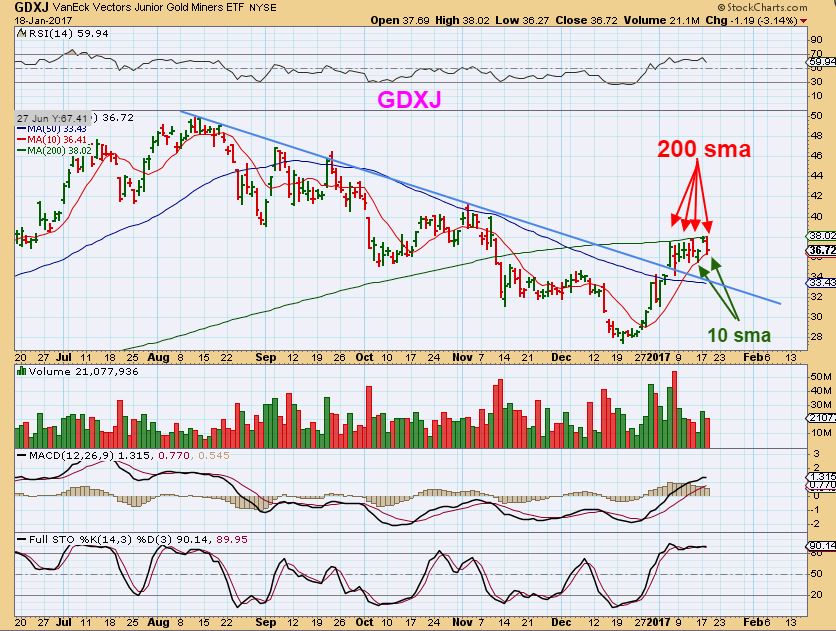
GDXJ – I was looking at the GDXJ and noticed that it has been Pinned under the 200sma and above the 10sma. Being pinched here, it looks like a bull flag. Normally I would expect it to just break out, but if we dip to a dcl here, we may back test the 50sma and then break above the 200sma.
Reminder chart: This was 1 idea of how a drop into a dcl could look.
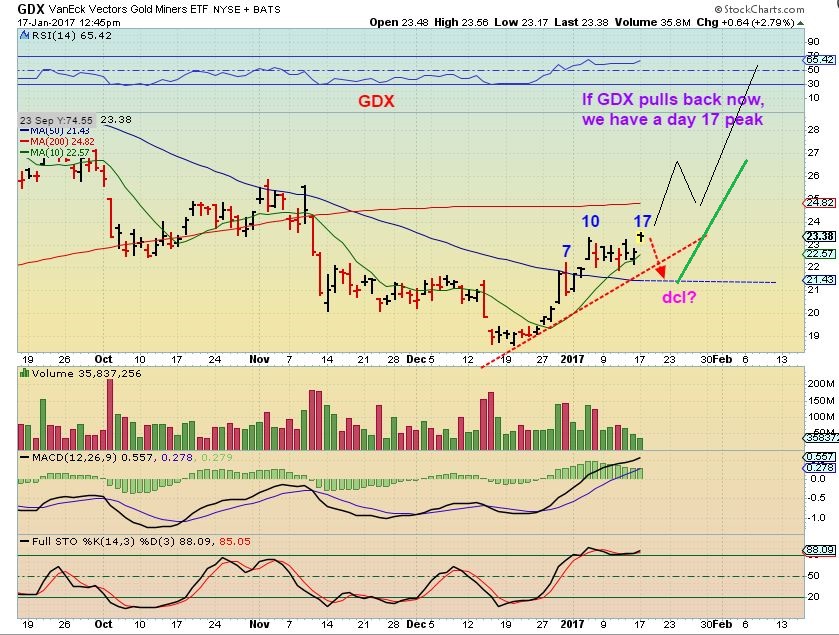
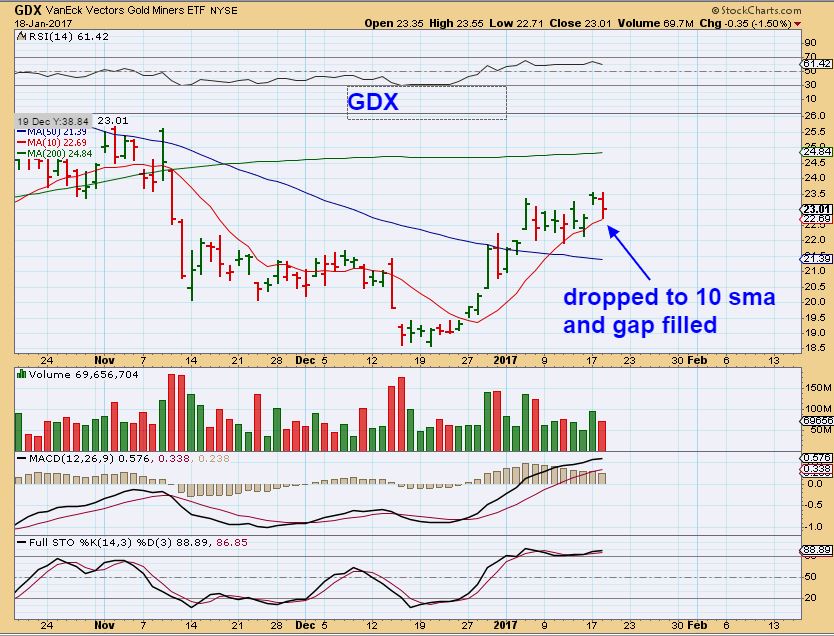
GDX – So far, GDX only dropped and filled the gap Wednesday. The 10sma supported.
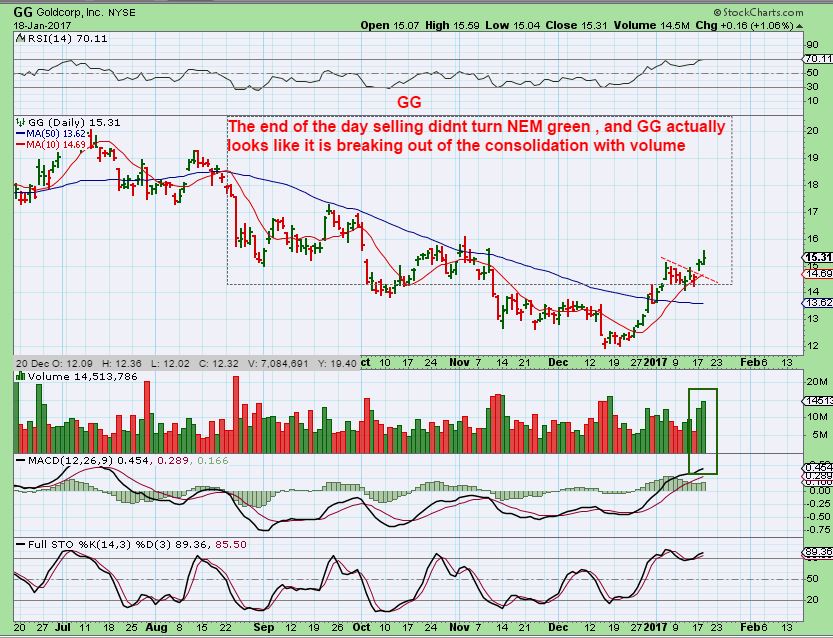
GG – read the chart, that should say that NEM did not turn Red. GG looks bullish.
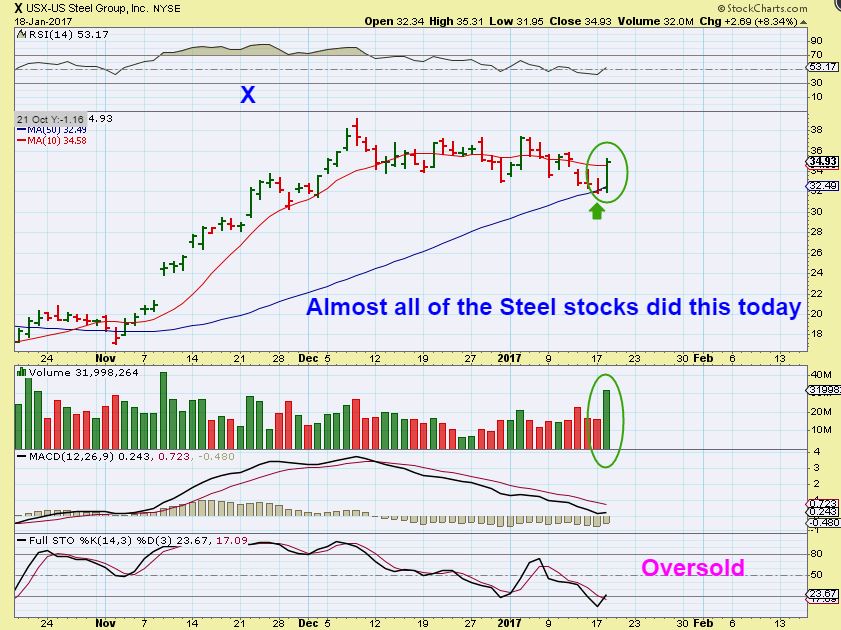
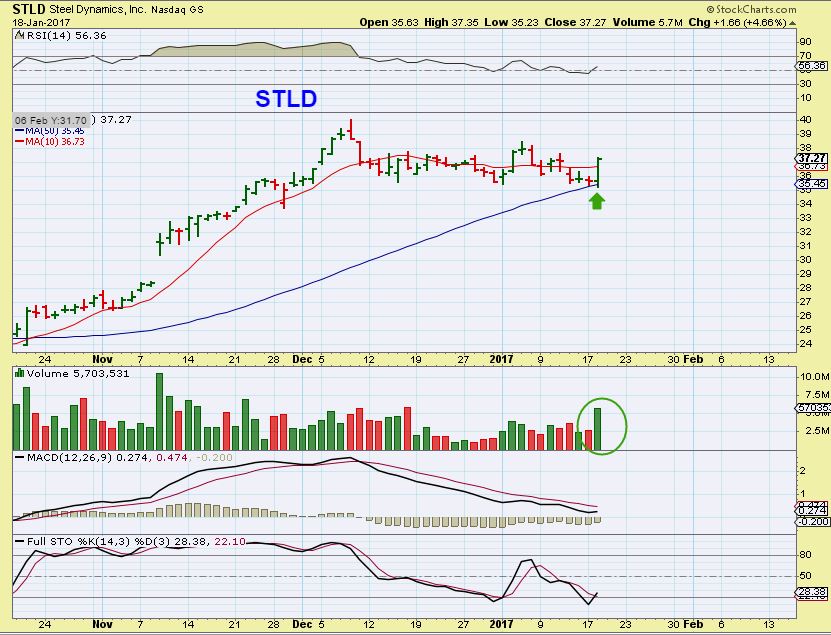
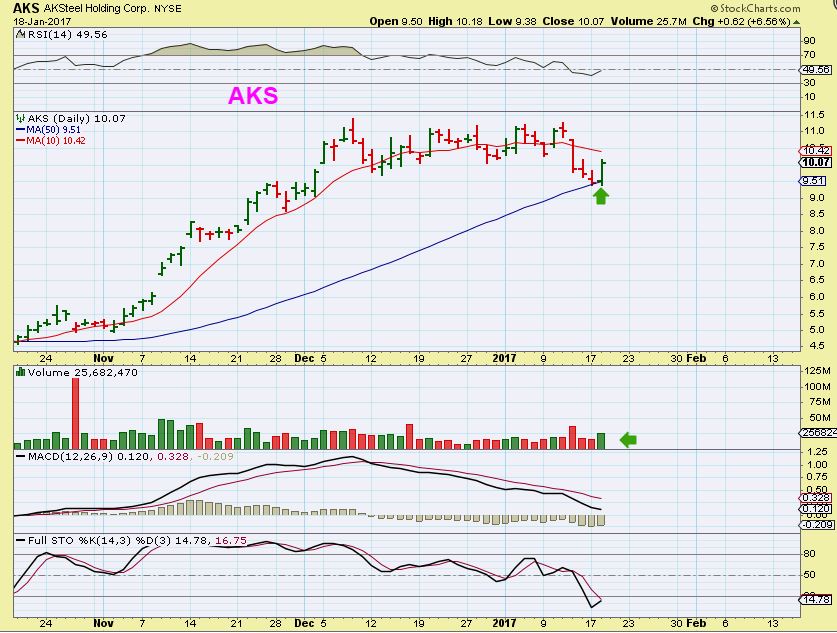
So we are still holding some Miners and will watch how this plays out, I wanted to point out how bullish Steel stocks acted this week too.
X- Strong reversal off of the 50sma. This is a Low risk buy set up, because your stop is under the 50sma
STLD – Same here
AKS – And here
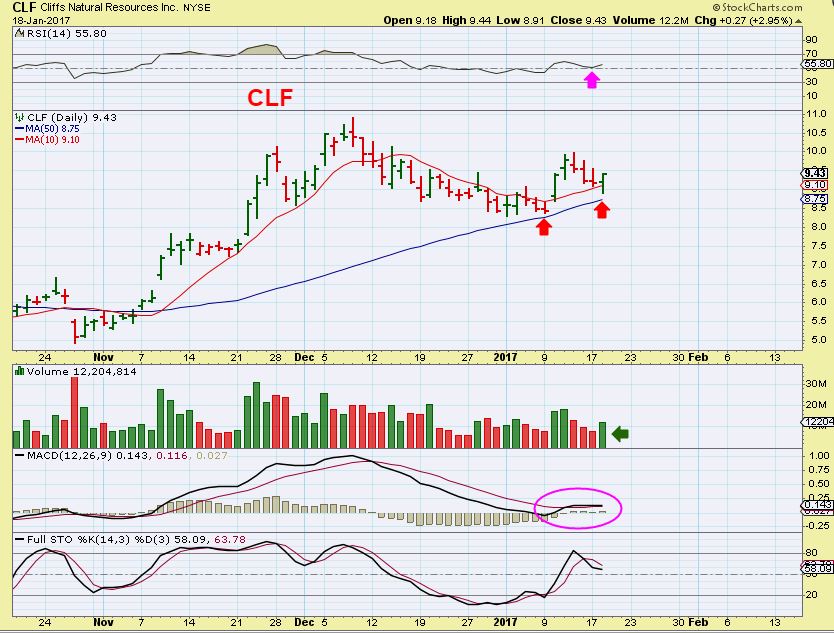
CLF – And here. These are holding up bullishly and low risk with the 50sma right below. IF the markets sell off , will they hold up on their own merits? They could in an inflationary environment.
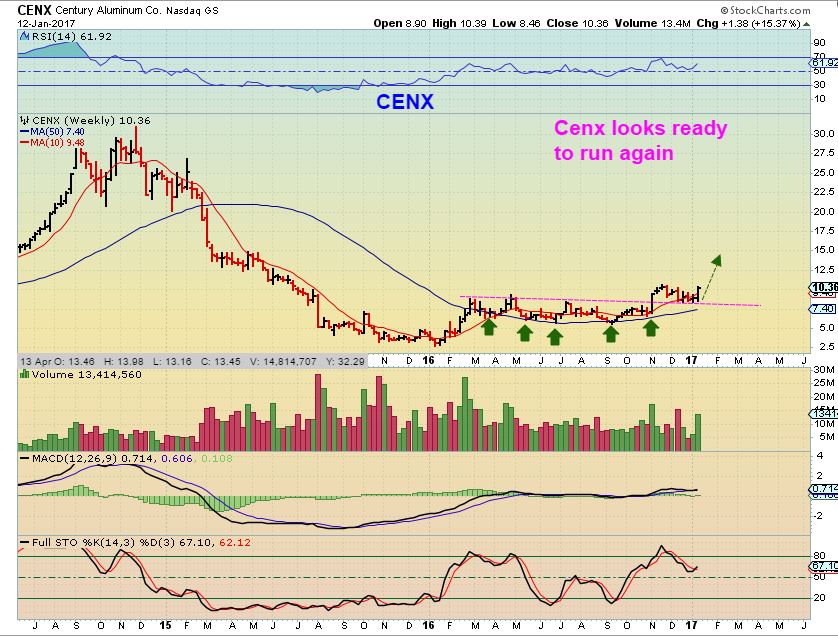
CENX REVIEW – I posted some of these trades in November and December. Buying the dip made an entry low risk. CENX was dipping back down after a break out, here at $8.66.
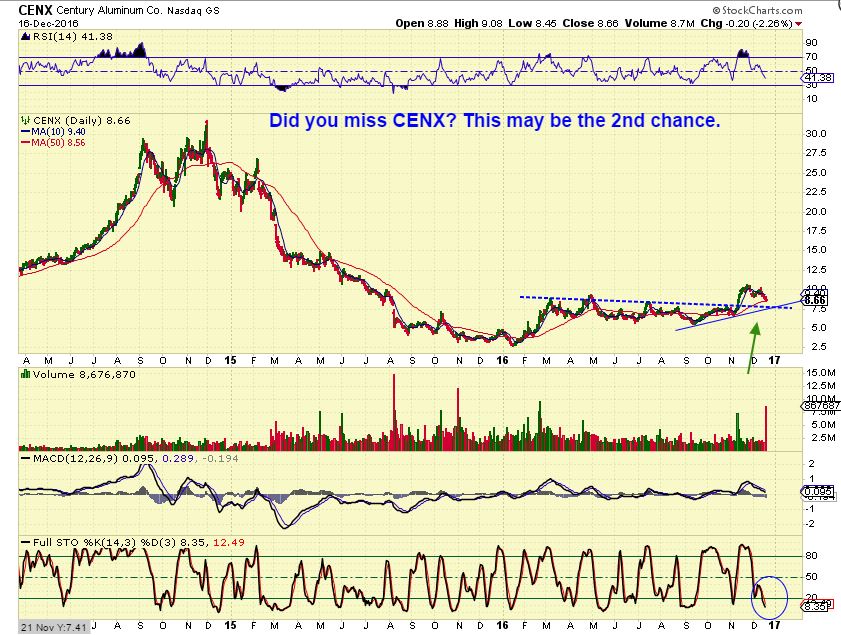
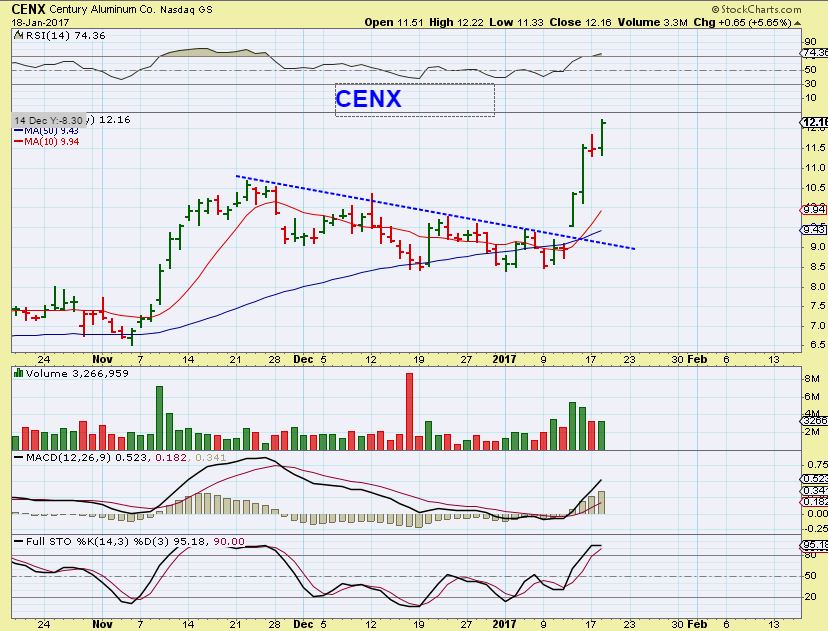
CENX – My Jan 12th chart last week, we were watching for that reversal. Now at $10 the back test was complete.
CENX – Yesterday ( CENX continues higher). The buy e=was at the 50sma and that is my point, X, AKS, CLF, etc are there now. My MTL trade is lingering so far 🙁 , but these look ready.
So along with the nice moves in Miners this past month, the metals companies are still bullishly setting up and breaking higher. We see that with NAK, TGB, X, AKS, FCX, AA, CENX, and so on.
Today is Thursday and we have been wondering if the daily cycle low in Gold and Miners would be a deeper pullback or just a sideways consolidation, and so far we hardly have a dip. Look again at that Gold chart and you’ll see that we haven’t closed red for more than one day lately. Let’s see how this plays out, and be ready to buy the dip if it does dip deeper and you still have cash. If we do have a larger dip this time, I will post charts of set ups in the Mining sector as they present themselves. I also have another trade idea at the end of this report ( for the active and experienced traders only please). 🙂
.
~ALEX
.
A warning : This sector has moved unpredictably fast in the recent past. Do NOT trade this sector thinking that I can answer questions regularly to help you through the trade. This is for experienced traders only and I am just pointing out a sector that I noticed last week as acting bullishly again. If you enter this trade, know your exit point in advance.
.
In the weekend report, you may recall that I mentioned that another sector appears to be acting bullish. I was watching this sector all last week and it was setting up rather bullishly. It is the (Dangerous and fickle ) Shippers again. I have discussed these in the past, they sail swiftly through the markets in both directions, up & down. They can be that lottery ticket buy & hold trade, if you believe that they are recovering. They can be a trading vehicle for the experienced traders looking to scalp. Know your risk threshold! Let’s take a look.
SBLK– As I said, they sail swiftly. In August I pointed out this base and move out of the lows.
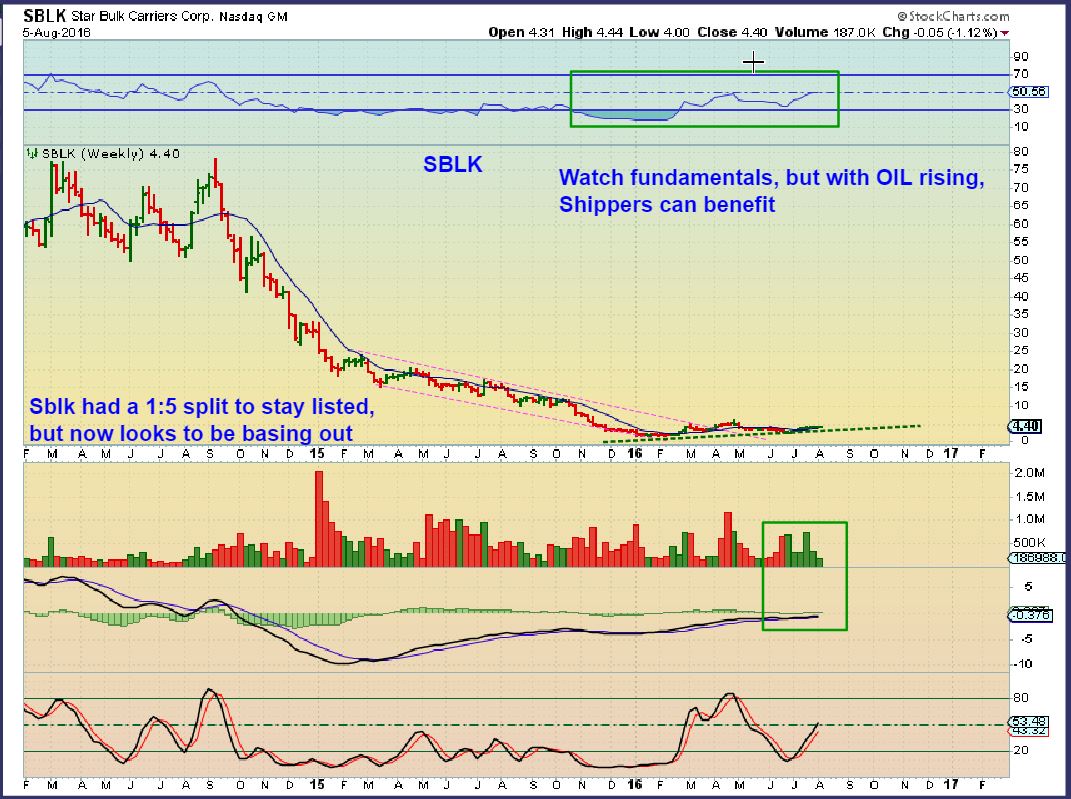
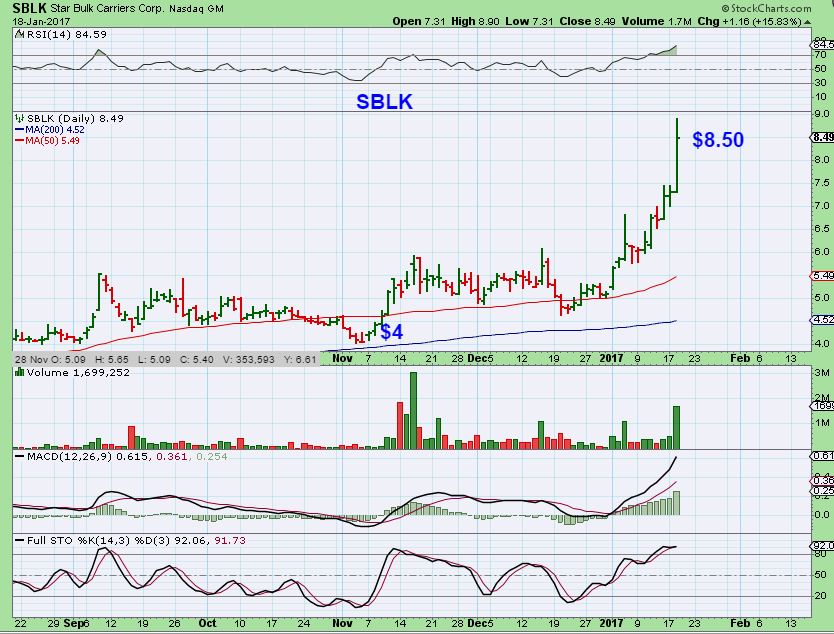
SBLK – Suddenly it broke from a base and doubled . DO not buy this, it is an example of what has caught my attention last week. It was only $6 then.
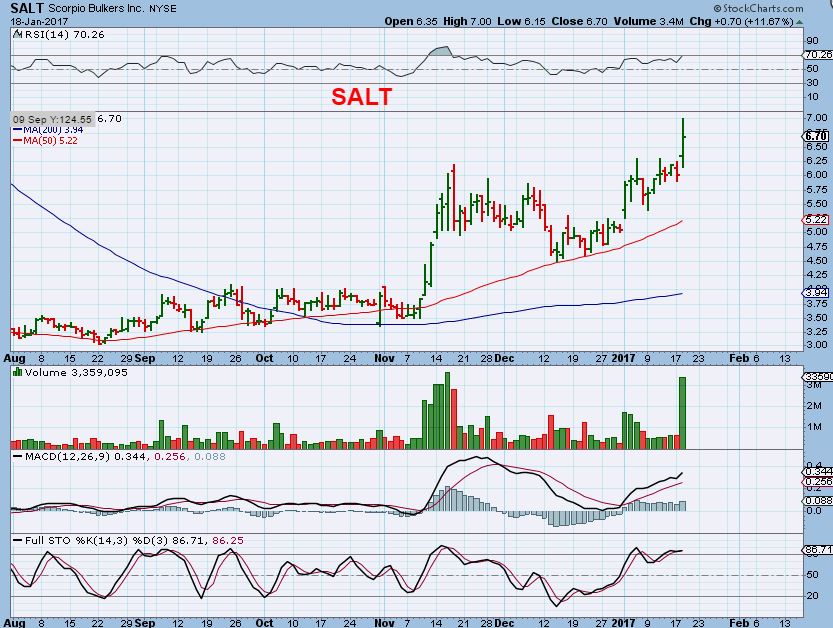
SALT – Another example of what caught my eye. It also doubled from November to now, and Yesterdays volume surge was notable.
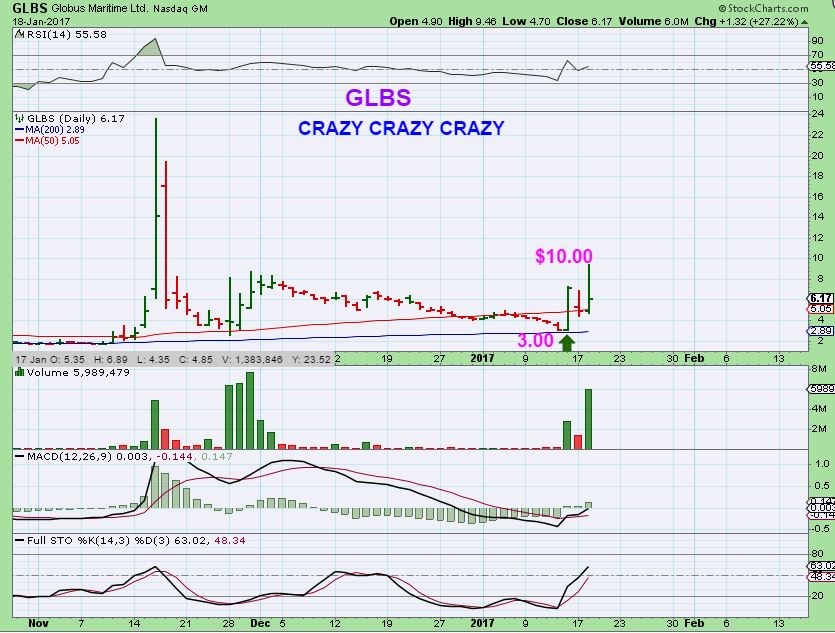
GLBS – And this is a CRAZY example. When I saw this last week it had tagged the 200sma near $3.00 on tiny volume. I did not buy, but it just ran from $3.00 to $10 in 3 days! DANGEROUS ( but I wish I had bought it – lol ) .
SO now let’s look at some shippers that may be setting up or moving in a bit more of an normal manner.
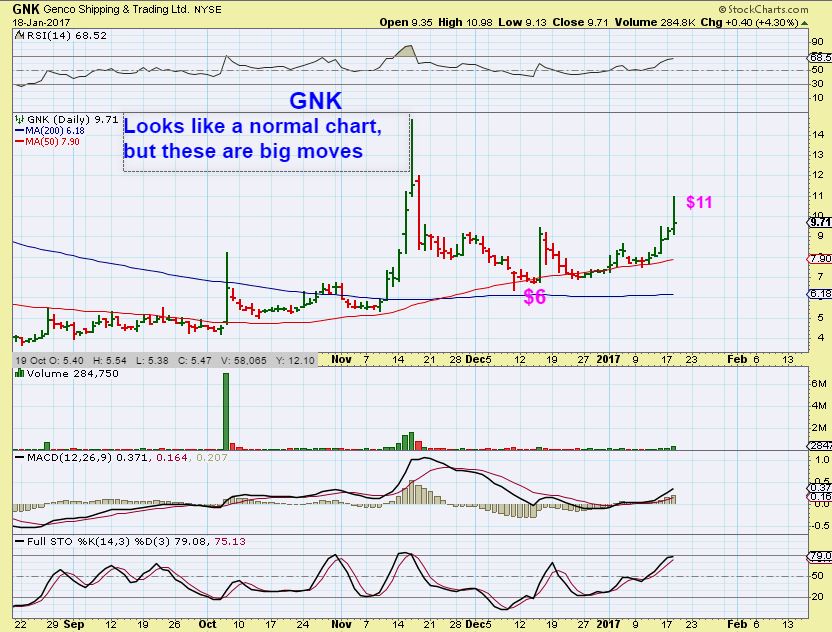
GNK – Last week this was sitting on the 50sma and was a buy. It almost went in the weekend report, but I wanted to monitor this sector for just a bit longer. We see a normal rise out of a base since August and a consolidation of those gains in the form of an inverse H&S forming. It has also doubled since November. This one may just keep running higher, but I would only buy it if it tags that 50sma or the 10sma in a sideways move again. ( Watchlist?)
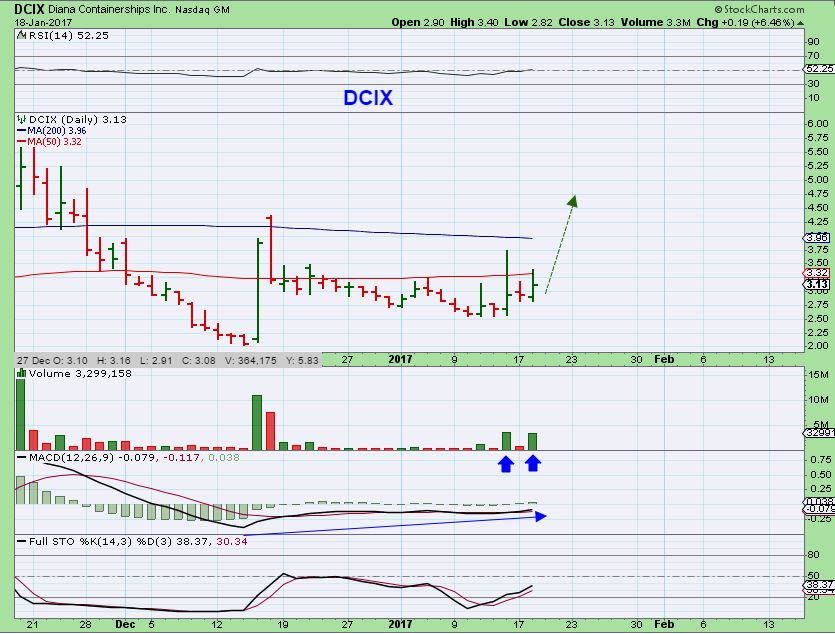
DCIX – Ok, yes this was crazy in November too. It popped from $2 to $26, likely a serious case of short covering. It has based a little since then, so I wanted to zoom in on it. It may just continue sideways for months, but if the whole sector is popping, it may join in too.
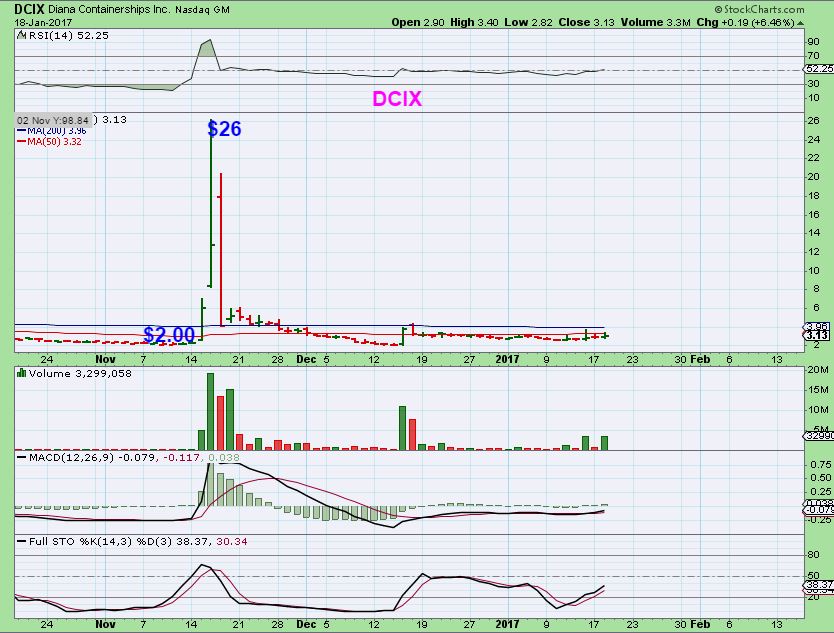
DCIX – Zooming in, you can see some bullishness to this set up. I hate to say this, because I don’t want people to follow me into this trade thinking that it’s a guarantee, but I did take a position at the close. I AM EARLY – USUALLY I WAIT FOR A BREAK OUT AFTER A REVERSAL. I want you to see that this was $2.50 when I looked at it last week, so it is risky, it could go back down there! I was encouraged by the volume pops on up days. Please do not follow me thinking that I will be giving a play by play on this one. I don’t worry about the ‘wiggles’, it is just a trade. I like the base in the ABOVE chart and took a small position because this sector is popping. The ABOVE chart and bullish activity in the sector drew me in. I may be early.
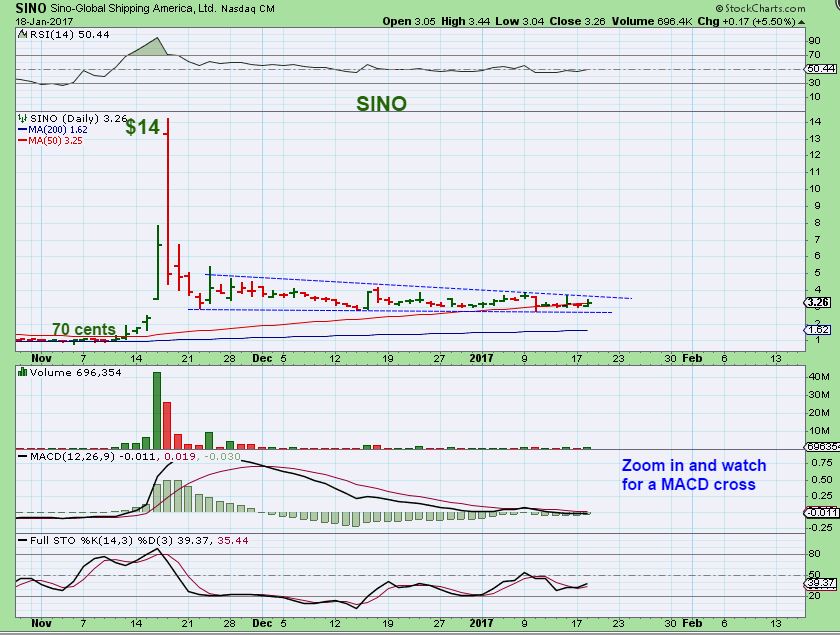
SINO – This has a very similar set up. Ridiculously huge pop in November, and now a base. I’m just watching this one to see if it breaks out, since it could go sideways for months.
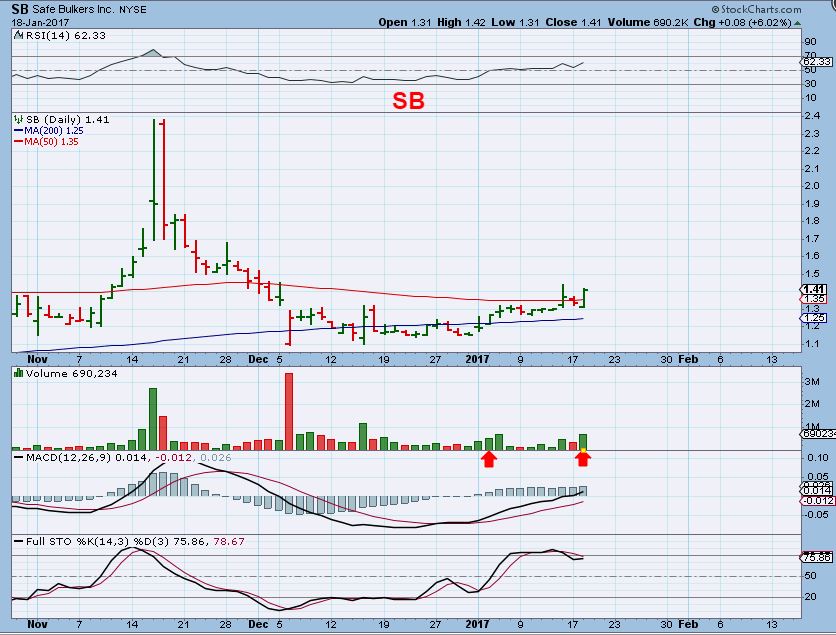
SB – A slower mover, I traded this one the last time I mentioned shippers and it was a slow progressive mover, not as crazy as the others in this sector.


Thanks for the perspective, Alex.
Good report Alex. Thanks
My disqus isnt loading properly again, I have to refresh to get any new comments, and then I have to scroll through and try to figure out which ones are newer and which I’ve already read.
#Cumbersome
Thanks for the warning. Oh, here is the morning gold smackdown in progress.
Hey, your comment just showed up ! Yay
WOW! I guess I magically fixed it!
I have to refresh too.
LXRP News!
http://finance.yahoo.com/news/neutrisci-announces-successful-development-positive-130000551.html
woohoo! Thanks for posting that – I don’t see this on my Ameritrade acct. news summary for them yet….I got some this morning when it was around .55 – glad I jumped in – might be wishing I’d gotten more…..:)
What happened to RIC?
I only see it down 2.5%
Its not showing up on TradingView for some reason. I thought it got bought out, or went under!
Oh, It is still actively trading from what I can see.
CF – LTBR sub 1.00 – Not trying to be a cutie, but this is screaming burnout
LTBR needs a kick in the pants right about now
US Dollar at the 38.2% Fibo. Im hoping this is all we get for a bounce. Also, see H&S pattern as a really nice possibility.
https://www.tradingview.com/x/5m64pE7i/
I bot JNUG and GDXJ on the dip this morning to add to my accounts. Miners have traded sideways since January 5 and a bounce off the 13 day SMA seems like a good buying opp to me. We’ll see …
I bought the dip also
10 yr. bond yield surging…
Alex, what do you think? Is this a good spot to buy more miners? I see a rising flag……….not sure if that is Bearish……
https://www.tradingview.com/x/env4v7AI/
Those formations can be bullish, you would use a stop below the lower trend line of the flag ( but a gap down could be tricky).
Buying different “Miners” individually is an idea too, because they do seem to set up at different areas ( Like EGI totally ignored that Gold sold down). NAK was a nice gap fill, it might be done dropping , but also may just go sideways for a while, it is hard to tell.
I don’t know how much earnings will impact things, but I have found these January earnings dates: BTG Jan 21, NG Jan 25 after market and FCX Jan 26
CF:
Do you have any Steel Jrs. you can recomend ? Other than those above.
I am liking the sector currently……..
SID, SCHN, MTL, GGB, SHLO, off the top of my head.
Thanks
Alex, are you adding back to URRE or other uranium names?
Not at this time, but that doesn’t mean that they aren’t going to hold up on the 10sma- it just means that I am focused elsewhere
Stopped out of LTBR – on to the next
Same here. Out of it.
Yep. My worst trade of 2017 so far. Everything is panning out well so far, though.
??
LTBR. Didn’t work. Classic Cason trade – bought as momentum wearing off, drops within seconds of purchase, bounces at near-term bottom, giving hope so loosen stop, then heads back down to stop next day.
me too
Love the gold melting photo! I am energized – miners behaving well – zig zag up.
MCOA looks decent here like many others, anyone pick up PHOT just for the hell of it?
Ya, I’ve been keeping my eye on MCOA…don’t have any…….I don’t have any PHOT…but hey, for a penny…..someone could get a lot of shares for $200 and just see what happens…..:P As long as one doesn’t mind possibly losing $200……:) 🙂
https://uploads.disquscdn.com/images/d768d93b97d61ee06265ebe43e1d061fa7c5a9e38d8bc81a564820a5d8ddea82.png Hi All . Wanted to share a stock that has done very well for me lately to watch — not to buy as it it’s up significantly today. EOXLQ – emerald oil. They emerged from bankruptcy in November. Maybe after oil makes a decisive move … and y’all do some DD. I Do LOVE the long term potential of the chart
Thanks, Crystal! Just now seeing some of these comments from today…..I guess I should have been refreshing my page all day…! 🙂
Alex, what do you think of the CNBX chart? I sold mine yesterday on that pop figuring it would go down and consolidate…..it kind of looks like it could keep falling to me but I’m not sure…the chart pattern looks like a rising bear wedge now?
URRE regaining the 13, lets see if we can get some follow thru
Sold my CBIS…would like to get again but wanted to lock in my gains….we’ll see if it falls/consolidates…I’m a take the money and run person on these marijuana stocks….at some point I would like to hold for longer term…just have to see what the industry does in the near term…
Can’t let your profits go up in smoke!
hahaha! 😛
Ran into another marijuana stock today that I hadn’t researched….RMHB…..way extended now but will watch for future….would have been good one to be in a few days ago!
I used to play the weed run about 2-3 years ago.. It was a crazy thing.. Check out MINE – was a gold mine (no pun intended) a few years back.. Sub Sub though
PURA….another marijuana stock I just ran into….introducing CBD infused sports drink/water at a trade show in March…..that’s about all I know about it right now…no financials posted to see…..
Interesting……
Thanks Tammie !
You’re welcome 🙂
Yes , some of the MJ stocks were really running nicely, and others are setting up in a similar manner that the ones that have already run are.
Funny how they all seem to form that cup after the big run up in October – November
Yeah, I sold one today for a 55% profit….but it was only profit on $350….:) 🙂 Maybe one day I’ll get brave enough to do $3500 on one of these….but profit is profit…..
Yes, and thats a good trade in a sector that is a little unpredictable and cheap, that’s why it is hard to commit much money into it.
IF someday these stocks hit $1 or $2 or $3, having $350 worth now would be huge ( I Know, I’ve done it with a few in the past, like the NAK story, only I had more than $350)
Check this out
$350 divided by .05/share = 7000 shares.
It hits $3 in a year or two? 7000 shares x $3 = $ 21000.00 CHA – CHING
Look at a 6 month chart of NDEV, CNBX,
Yeah….maybe I should get $700 worth of shares, leave half of it alone, the other half I can trade in and out of for quick profits….if…I ….had…enough….discipline…but yeah…..hm, maybe….sounds like a plan..
Well, if you look at NDEV, that was NOT an easy ride. Picture holding 10,000 shares when it dropped.
It is not easy, but over time these could do well.
Yeah, I know I’d be kicking myself right now if I’d had a bunch of shares and didn’t sell at that top there…..
This was not on my list, thanks
Gold at day’s high, miners not responding to it : (
I have gotten lots of hourly buys in the last several minutes. My acct has also improved and JNUG is only -.80. This is the best potential for a rally I have seen today. Other rallys have faded. Here’s hoping that we get a good last hour.
Sometimes it just needs to be shamed into playing along ; )
JNUG went green, but is now -1%. I hope that is not all we get, but reminds me of earlier today. Next we need to see JNUG over 8.43 to keep the rally going.
Usually the first signs of a top. Gold moves higher and miners don’t follow. I can see a bear flag forming on the 2hr gold chart. Looks like we might go down to 1180 area. Although, the RSI is moving higher with the TSI starting to make a cross higher. Just my 2 cents and very short term.
https://www.tradingview.com/x/mea4T5BO/
Yeah, I spotted that bear flag last night, decent comeback in gold late afternoon, could still be invalidated. Solid support at 1180 should hold either way.
hmmm…went to get URRE and by the time I opened up my account 10sec later it had gone up another $.10. Too frothy for me…I’ll have to wait. 🙁
I managed to get a partial fill again. Still holding 500 shares from 1.75, but partial at 2.38 today. Riding on 1500 now.. Looking for a nice pop tomorrow with the way it closed
Nice! I should have bought…would have been up (a bit) by eod even at the higher buy. Oh well…always another trade apparently. Well done!
Nat Gas (UGAZ) Moving off the bottom now. I can see a nice AB=CD pattern forming with an upside target around 34.50. Nice volume coming in as well. Moving from oversold.
https://www.tradingview.com/x/uwcXiDfF/
Well, I had to leave for the day, and when I got back I couldnt believe URRE, up 27%.
All the Uraniums started acting correctly at the 10sma, UEC, DNN, UUUU, UEG looked good, URRE broke below, but nice strong recovery into the close.
I missed any entry, it’ll be interesting to see how those play out, since some have already done a small consolidation to the 10sma.
UUUU & UEC for example.
NAK did quite the gap flll recovery
EDXC – the marijuana dog bites company (somehow that doesn’t roll of the tongue right…) – has hired an auditor to get the books in order to try and uplist from the pink sheets to the OTCQB – bringing the past 4 years of financials up to date and getting all SEC docs in order….
When I read that Tuesday morning, I actually thought that it might tank the stock ( I own it) , but it actually shot up 34% 🙂
I like the chart using the 9 or 10sma
Looks like maybe chart is forming bull flag?
Hey, tell me what you think of CVSI chart when you get a chance….? One of the companies that is actually bringing in revenue with their oil at least – not sure what all else they might have…I think the chart looks great…like…..I might wish I had double what I have tomorrow…..
Yes, they all seem to be forming a cup, and then breaking out to new highs after a handle.
PLPL was forming a bull flag similar to CVSI